Article

Retrieval of Metop-A/IASI N2O Profiles and Validation with NDACC FTIR Data

1
Laboratoire d’Aérologie/OMP, Université de Toulouse, CNRS, UPS, UMR5560, 14 Avenue Edouard Belin, 31400 Toulouse, France
2
Centre d’Etudes Spatiales de la Biossphére/OMP, Université de Toulouse, CNES, CNRS, INRAE, IRD, UPS, UMR5126, 14 Avenue Edouard Belin, 31400 Toulouse, France
*
Author to whom correspondence should be addressed.
Atmosphere 2021, 12(2), 219; https://doi.org/10.3390/atmos12020219
Submission received: 18 December 2020 / Revised: 27 January 2021 / Accepted: 29 January 2021 / Published: 5 February 2021

Abstract

:
This paper reports atmospheric profiles of N 2 O retrieved from Metop/IASI with the Software for the Retrieval of IASI Data (SOFRID) for the 2008–2018 period and their validation with FTIR data from 12 stations of the Network for the Detection of Atmospheric Composition Changes (NDACC). SOFRID retrievals performed in the 2160–2218 cm 1 spectral window provide 3 independent pieces of information about the vertical profile of N 2 O. The FTIR versus SOFRID comparisons display a better agreement in the mid-troposphere (MT, 700–350 hPa) than in the lower (LT, Surface–700 hPa) and upper (UT, 350–110 hPa) troposphere with correlation coefficients (R) in the 0.49–0.83 range and comparable variabilities (3–5 ppbv). The agreement for oceanic and coastal stations (R > 0.77) is better than for continental ones (R < 0.72). The SOFRID MT N 2 O mixing ratios are significantly biased high (up to 16.8 ppbv) relative to FTIR at continental stations while the biases remain below 4.2 ppbv and mostly unsignificant when oceanic data are considered. The average MT decadal trends derived from SOFRID at the 8 NDACC stations with continuous observations during the 2008–2018 period (1.05 ± 0.1 ppbv·yr 1 ) is in good agreement with the corresponding FTIR trends (1.08 ± 0.1 ppbv·yr 1 ) and the NOAA-ESRL trends from surface in-situ measurements (0.95 ± 0.02 ppbv·yr 1 ). In the Northern Hemisphere where they are clearly detected, the N 2 O MT seasonal variations from SOFRID and FTIR are phased (summer minima) and have similar amplitudes. SOFRID also detects the UT summer maxima indicating independent MT and UT information. The global MT N 2 O oceanic distributions from SOFRID display low geographical variability and are mainly characterized by enhanced tropical mixing ratios relative to mid and high latitudes.

1. Introduction

Since 2011, Nitrous Oxide (N 2 O) has become the third most important greenhouse gas (GHG) [1] whith a global warming potential about 300 times larger than CO 2 over a 100 years period [2]. Once in the stratosphere N 2 O molecules are destroyed by photolysis or reaction with O(1D) and are the main source of NOx which are involved in ozone depletion. As N 2 O is inert in the troposphere and is not removed by dry or wet deposition or absorbed by oceanic uptake, its atmospheric lifetime is over 100 years. Recently, the lifetime of N 2 O has been estimated between 109 and 125 years [3].
N 2 O is emitted in the atmosphere by various sources: natural and agricultural soils, oceans, industries related to fuel combustion and biomass burning. Natural soils and oceans account for about 2/3 of the emissions (10 and 12 Tg N 2 O-N yr 1 ) with the remaining third (5.3 Tg N 2 O-N yr 1 ) caused by anthropogenic activities. Agriculture accounts for 66% of the anthropogenic emissions [4]. The two most important processes responsible for N 2 O soil emissions are nitrification and denitrification by microbial activity. Denitrification consists in the reduction of nitrite and nitrate in anaerobic or micro-aerobic conditions. Incomplete denitrification produces N 2 O instead of N 2 . It occurs preferentially in undrained and anoxic soils, with an excess of nitrate, conditions often met in agricultural soils during wet seasons [5]. Denitrification has a higher yield than nitrification which is the aerobic oxydation of ammonium into nitrite and nitrate.
The rise of N 2 O during the industrial era has been found to be primarily caused by the use of inorganic fertilizers and manure production [2,6]. Furthermore, the most rapid increase of N 2 O emissions comes from croplands in the tropical belt as a result of agricultural practices such as fertilizer use and irrigation [7]. Davidson and Kanter [4] reported in 2014 that, depending on the scenario for future N 2 O emissions, they could double (business as usual) or decrease by 22% (concerted mitigation) leading to a stable 350 ppbv by 2050. According to a more recent publication [8], the rise of N 2 O atmospheric content follows the highest Representative Concentration Pathway (RCP8.5) from the fifth IPCC assessment report [9].
Surface N 2 O concentrations are monitored in-situ by the NOAA/ESRL and AGAGE networks for more than 40 years. These observations show an almost linear N 2 O increasing trend of 0.26%·yr 1 (or 0.82 ppbv·yr 1 ) between the early 1980 and 2005 [2] and of 0.85 ± 0.1 ppbv·yr 1 from 2001 to 2015 [10] at the global scale. An increase of 0.79 ppbv·yr 1 between 1997 and 2007 is also documented at a central European station [11].
Observations with FTIR (Fourier Transform Infra Red) instruments from the Network for the Detection of Atmospheric Composition Change (NDACC) also allow the monitoring of N 2 O total or partial columns [12]. Over the 1996–2007 period the analysis of FTIR observations give trends of 0.2%·yr 1 at Northern Hemisphere (NH) midlatitudes and 0.3–0.4%·yr 1 at higher northern latitudes for N 2 O total columns.
GHG emissions can be estimated by bottom-up and top-down methods. For CH 4 some top-down inverse modeling methods are taking advantage of spaceborne observations such as SCIAMACHY [13] or GOSAT [14]. Spaceborne observations provide a global and continuous coverage which is valuable to estimate the emissions of long lived gases with localized sources. Nevertheless, in the case of N 2 O top-down methods are based on continuous surface monitoring sometimes combined to air- or ship-borne campaigns [10,15] because no global validated spaceborne data are available to the community.
The first retrieval of N 2 O atmospheric content from satellite data has been performed by [16] using NOAA/TOVS observations. They reported an increase of 1.4 ppbv·yr 1 for the 20–60 N latitude band between 1987 and 1991 which is clearly overestimating surface observations. Preliminary N 2 O total columns retrieved from IASI with a beta version of the EUMETSAT software were reported for a narrow tropical band (20 N–20 S) in Ricaud et al. [17]. Garcia et al. [18] is the first study to report a thorough validation of N 2 O retrievals from the Metop/IASI sensors. Their study was limited to comparisons of IASI N 2 O total columns retrieved with the EUMETSAT neural network algorithm [19] with FTIR columns from the Izana observatory in the subtropical North Atlantic. Garcia et al. [20] present CH 4 and N 2 O IASI retrievals with the MUSICA algorithm. They compare their retrievals with FTIR data at three NDACC stations, with Global Atmospheric Watch (GAW) surface measurements and with airborne HIPPO observations over the Pacific [21]. In both Garcia et al. [18] and Garcia et al. [20], the comparisons with FTIR data are limited to one and three NDACC stations respectively and to IASI-pixels recorded over sea. Garcia et al. [20] focuses on CH 4 with N 2 O as an interference and a by product that allow the improvement of their CH 4 retrievals. They display global ditributions of CH 4 but none of N 2 O.
In the present paper, we report IASI N 2 O profiles retrieved with the SOftware for a Fast Retrival of IASI Data (SOFRID) and their global validation with NDACC-FTIR data at 12 stations for the 2008–2018 period. We first describe the adaptation and settings of SOFRID for the retrieval of N 2 O profiles. The characterization of SOFRID and FTIR retrievals are then reported. Based on information content analysis, the results of the comparisons are analyzed for three tropospheric layers in terms of general statistics, biases, trends and seasonal variability. Global distributions of mid-tropospheric SOFRID-N 2 O are presented and analysed. We finally present our conclusions and prospective activities.

2. Global Retrieval of N 2 O Profiles From IASI

2.1. IASI

IASI sensors are nadir viewing Fourier Transform Spectrometer onboard the MetOp polar-orbiting satellites (2006–2012–2018). IASI measures the radiance emitted by the Earth-atmosphere system in the thermal infrared (645 to 2760 cm 1 ) with a moderate spectral resolution of 0.5 cm 1 after apodisation. It provides global Earth coverage twice a day, with an overpass time at ∼9.30 (day) and ∼21.30 (night) local solar time and a 12 km footprint at nadir. IASI data have been largely used to document and monitor the atmospheric content of a number of atmospheric pollutants such as carbon monoxide (CO, De Wachter et al. [22]), ozone (O 3 , Barret et al. [23]) or ammonia (NH 3 , Van Damme et al. [24]).

2.2. IASI-SOFRID N 2 O Retrievals

The SOFRID has been developed for near-real time retrieval of global O 3 and CO profiles from IASI radiances. SOFRID is based on the RTTOV [25] radiative transfer model coupled to the 1D-Var algorithm developed at UK Met Office (UKMO) [26]. SOFRID O 3 retrievals are described in details in Barret et al. [23] and SOFRID CO retrievals in [22].
The radiative transfer calculations are performed with the RTTOV-9.3 model [25,27,28]. RTTOV is a regression model where optical depths are parameterised by a set of predefined profile dependent-predictors, which are functions of temperature, pressure, absorber amount and viewing angle [27]. The RTTOV regression coefficients are derived from line-by-line calculations performed with the LBLRTM radiative transfer model [29] with line parameters from the HITRAN 2004 spectroscopic database [30]. The land emissivity is computed with the UWiremis IR land surface emissivity module implemented in RTTOV [31]. This module is based on a monthly climatology combining laboratory measurements and land surface emissivity product from the Moderate Resolution Imaging Spectroradiometer (MODIS), the UW Baseline Fit Emissivity Database [32]. Surface and atmospheric parameters (Surface pressure and temperature, wind speed, temperature and humidity atmospheric profiles) are interpolated in space and time from ECMWF (European Centre for Medium-range Weather Forecast) 6-hourly analyses.
The UKMO 1D-Var algorithm [26] has been developed for the assimilation of radiances from nadir-viewing sensors within the EUMETSAT Satellite Application Facility for Numerical Weather Prediction (NWP SAF). It is based on the Optimal Estimation Method (OEM) described by Rodgers [33].
SOFRID N 2 O retrievals are performed with a set up close to the one applied for CO and described in details in DeWachter et al. [22]. In this previous paper, CO and N 2 O profiles were retrieved from the 2143–2181 cm 1 spectral window on 43 fixed pressure levels from the surface to 0.1 hPa. A typical IASI synthetic spectrum is displayed in Figure 1 for the 2140–2300 cm 1 window. The radiances including the contribution of all absorbing gases is displayed in Figure 1a, the contributions of N 2 O and CO 2 in Figure 1b the contributions of CO and H 2 O in Figure 1c. In De Wachter et al. [22], the upper wavenumber limit was selected in order to maximize CO information and minimize N 2 O interferences. Here, we aim to maximize the N 2 O information. Therefore we have shifted the spectral window to 2160–2218 cm 1 . The 2160 cm 1 lower limit has been selected to limit the number of CO absorption lines and the 2218 cm 1 upper limit to avoid CO 2 absorptions (Figure 1b). The selected window clearly contains a high number of N 2 O absorption lines with a large variability of intensities which enhances the information content about the N 2 O profile.
Previous studies have documented N 2 O retrievals from other spectral windows. Retrievals from the EUMETSAT neural network Garcia et al. [19] analysed in Garcia et al. [18] are based on the 2200–2244 cm 1 window. This window contains mostly saturated N 2 O lines and intense interfering CO 2 lines (see Figure 1b). We have therefore chosen a window close to the EUMETSAT one but extending towards the low wavenumbers in order to avoid these problems and use a larger variety of N 2 O lines. Garcia et al. [20] document CH 4 and N 2 O IASI retrievals with their MUSICA algorithm in the 1190–1400 cm 1 window. We have not selected a window in this part of the spectrum because it is characterized by strong CH 4 absorptions that interfere with the N 2 O ones. In Garcia et al. [20] this window is selected primarily for CH 4 retrievals that provide better results taking advantage of the simultaneous N 2 O retrievals.
In our window, H 2 O and CO are the main interfering gases and their profiles are therefore retrieved simultaneously with N 2 O. As usual [22,23] the surface temperature is also retrieved to adjust the spectrum baseline.
The OEM is a bayesian statistical method that combines the measurement (here the IASI radiances) and an a priori estimation of the retrieved variables (here, N 2 O, CO and H 2 O profiles) with weights based on their respective error covariances [33]. For the IASI radiances, the error is the radiometric noise and for the a priori profiles of the absorbing gases the error are estimated from the concentration variability.
The estimated radiometric noise in the spectral region of our selected window was estimated to be less than 0.02 mW/(m 2 ·sr·cm 1 ) [34]. According to the more recent study of Hilton et al. [35], the IASI radiometric noise in the 2050–2220 cm 1 spectral window is about 0.024 mW/(m 2 ·sr·cm 1 ) corresponding to a Noise Equivalent Delta Temperature (NEDT) below 0.4 K. For the radiometric noise used for our retrievals (see Rodgers [33]) we have chosen a larger value (0.05 mW/(m 2 ·sr·cm 1 )) in order to take uncertainties on the surface, atmospheric and spectroscopic parameters into account. For CO, the a priori information is based on 2 years of in-situ airborne CO profiles, complemented by Aura/MLS above the aircraft cruise altitude [22]. A single a priori profile x a is used globally. The N 2 O a priori profile has a Volume Mixing Ratio (VMR) that decreases from 324 to 313 ppbv from the surface to 300 hPa with a value of 321 ppbv at 550 hPa.
The global N 2 O variability is poorly known. Aircraft observations from the Hiaper Pole to Pole Obsevations (HIPPO) programm show that over the whole troposphere N 2 O variations over the Pacific ocean are of 3–5 ppbv around 322 ppbv which represents less than 2% [36]. Nevertheless, Pacific ocean is not characterized by important emissions of N 2 O and HIPPO data underestimate the global variability. Estimations of N 2 O recent trends from surface data give values of about 0.8 ppbv·yr 1 [2,10]. Angelbratt et al. [12] report 0.2–0.4%·yr 1 positive trends from total N 2 O columns retrieved from NDACC FTIR data. Data from the AGAGE and NOAA/ESRL surface in-situ networks indicate a seasonal variability between 0.3 and 0.9 ppbv depending on the station [37]. Taking an upper limit of 2.5% for the seasonal variability and an increase of N 2 O of 0.25%·yr 1 over 10 years we can therefore roughly estimate a global variability of 4% for tropospheric N 2 O over the IASI period. Taking into account a potential higher variability related to emission sources, we have used a diagonal a priori covariance matrix corresponding to a constant variability set to 5%.
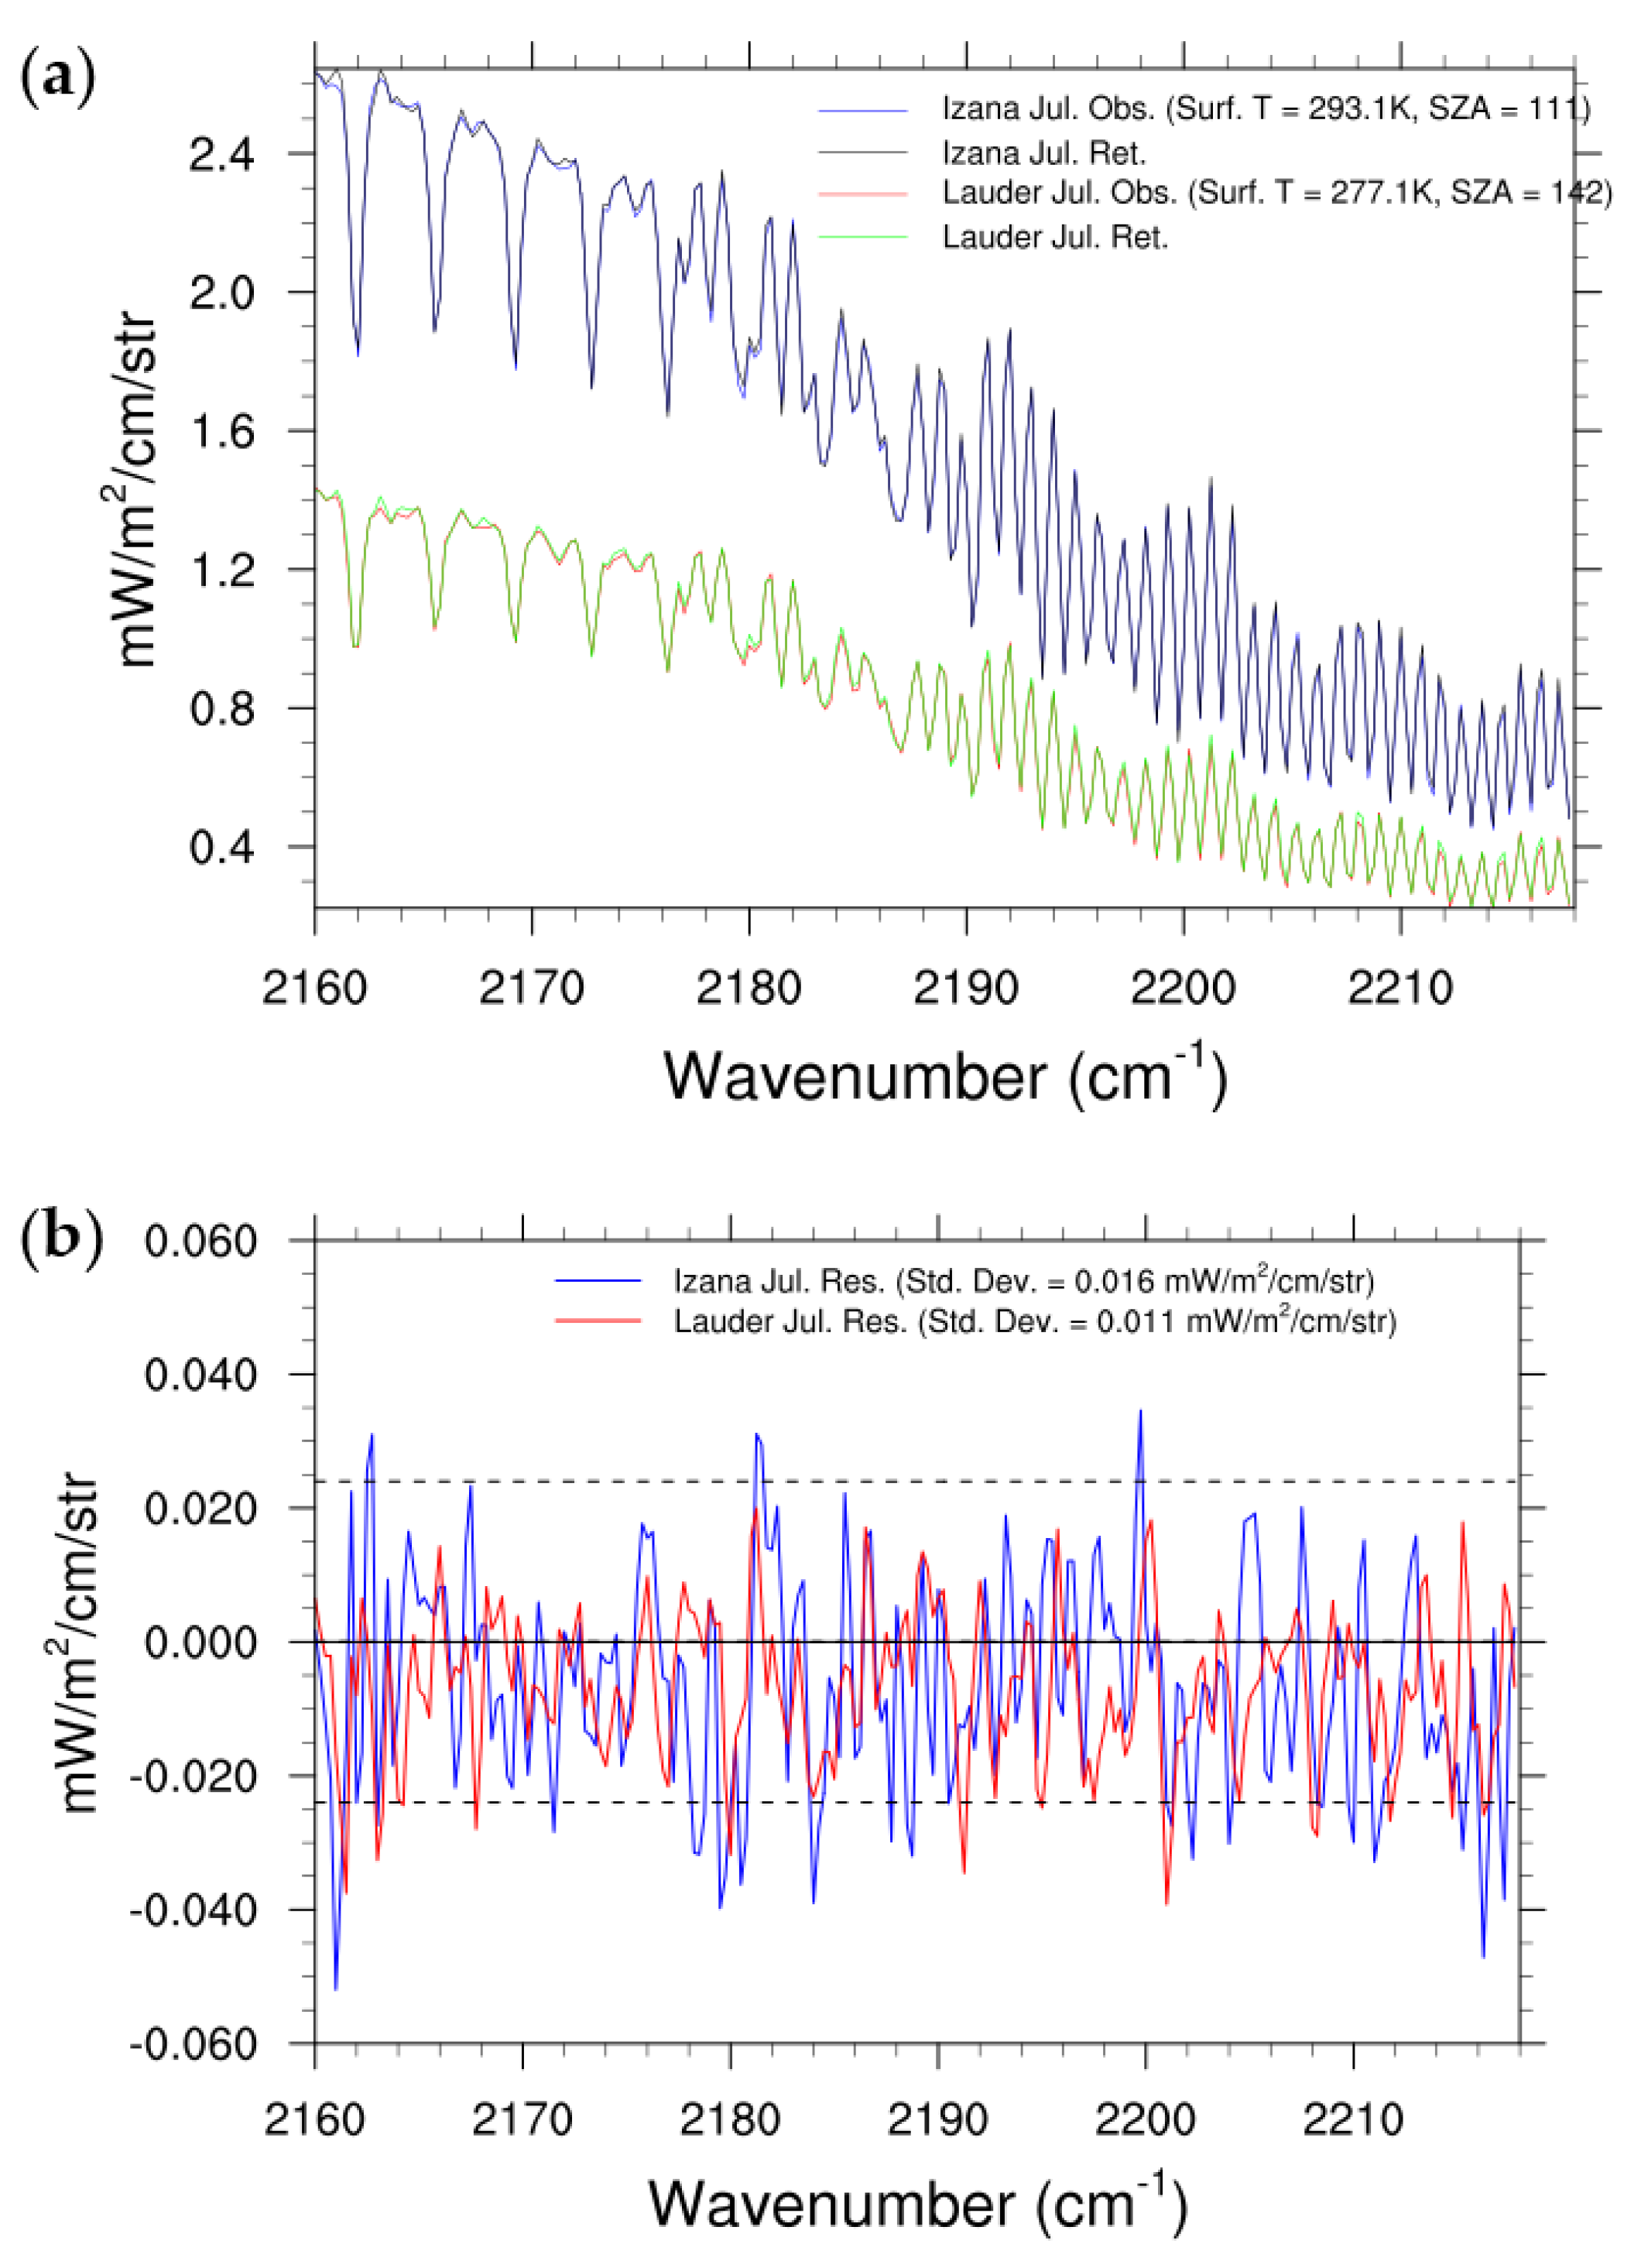
We keep pixels for which convergence is achieved based on the value of the retrieval cost function (Jcost) which has to be positive, the value of its normalized gradient and the evolution of Jcost between the two last iterations according to Havemann [38]. Examples of observed and simulated spectra after retrieval are displayed in Figure 2 for the Izana and Lauder NDACC stations in July. At Izana the surface temperature is high (293 K) leading to a strong signal while the lower temperature at Lauder in winter (277 K) is responsible for a weaker signal. For both spectra, the Root Mean Square Deviations (RMSD) corresponding to the fit residuals (0.016 and 0.011 mW/(m 2 ·sr·cm 1 )) are below 0.020 mW/(m 2 ·sr·cm 1 ). Only pixels with RMSDs of the fit residuals below this value corresponding to the estimated noise in Clerbaux et al. [34] are selected in our analysis. This conservative approach is justified by the very low N 2 O variability (see Section 3) which requires the best data to be detected. With this selection criterium, about 15% of the data are further elliminated.
Retrievals are performed for cloud-clear scenes only (cloud fraction derived from AVHRR below 15%). In addition, for missing AVHRR cloud data, a cloud filtering based on IASI brightness temperatures at 11 and 12 m is applied [23].
Preliminary comparisons based on SOFRID retrievals selected according to the previous criteria have shown that nighttime retrievals provide better agreement with FTIR data than daytime retrievals. The improvement being the largest for Land pixels. In the following we will therefore show results from nighttime SOFRID retrievals only.

3. FTIR N 2 O from NDACC Stations

N 2 O FTIR data are available for the IASI period at 17 stations of the NDACC network (http://www.ndaccdemo.org/ (accessed on 13 March 2020)). For high latitude stations (Eureka, Ny-Alesund, Thule in the NH and Arrival-Heights in Antarctica), surface temperatures and therefore the IASI radiances are very low. The N 2 O retrievals therefore contain little information and we have decided not to use FTIR data from these stations. At the Paramaribo equatorial station, there are not enough months with FTIR data over the 11 years (less than 25 months with more than 3 days with data) and we also disregard this station. We have therefore performed our comparisons with data from the 12 remaining NDACC stations (see Table 1). At 11 among these 12 stations the a priori mixing ratios in the troposphere (below 300 hPa) range from 313 to 318 ppbv and from 316 to 317 at ∼550 hPa. The tropospheric a priori mixing ratios are the largest (322–324 ppbv) at Wollongong.
In order to remove anomalous FTIR data, we have selected them according to the two following criteria. First, in some cases, the FTIR profiles present anomalous oscillations. To elliminate the strongest oscillations, we have set an upper limit of 25 ppbv for the difference between the minimum and maximum concentration below 250 hPa in each retrieved profile. From these data we have computed an average linear trend of 1.1 ± 0.1 ppbv·yr with a mean 2008 concentration of 316 ± 2.5 ppbv for the 12 NDACC stations. We have further removed data for which the difference between the MT mixing ratio and the corresponding value of the mean linear relationship is larger than 16 ppbv (±5%). Both criteria remove 6% of the data. Finally, for each station, we kept monthly averages for months with more than 3 days with valid observations.
The Table 1 shows that the datasets from these 12 stations are not equivalent in terms of time sampling and period covered. Some stations are providing data continuously over the 11 years with more than 89 months with more than 3 days with valid data (Kiruna, Jungfraujoch, Zugspitze, Toronto, Izana, Mauna-Loa, Lauder, Wollongong). Some stations do not provide continuous data on the whole 2008–2018 period. The japanese station Rikubetsu does not provide data for the 2011–2013 period and the time sampling is not very high for the periods with data. The Bremen station provides data over the whole IASI period but with a rather low sampling frequency and no data for fall and winter months (51 months with more than 3 days with valid data). Altzomoni and Maido stations only start providing data in 2012 and 2013. However, geographically, these 12 stations represent a good global coverage from the NH high latitudes to the tropics and the Southern Hemisphere (SH) mid-latitudes with continental, coastal and oceanic stations.
NDACC-FTIR N 2 O retrievals are described in Angelbratt et al. [12] for 4 stations and in Zhou et al. [39] for 7 other stations. The retrieval strategy varies from site to site depending on humidity conditions, instrument type and retrieval software. In all cases, the retrievals are performed from microwindows in the 2481–2541 cm 1 spectral range with spectral resolutions ranging from 0.0035 to 0.005 cm 1 . In agreement with Angelbratt et al. [12] and Zhou et al. [39] we show in Section 4 that N 2 O FTIR retrievals from the different NDACC stations provide consistent information.

4. Characterization of SOFRID and FTIR N 2 O Retrievals

4.1. Theoretical Characterization of Retrieved Profiles

The retrieved quantities are gathered in the state vector x. In our case, this vector contains the vertical profiles of N 2 O, CO and H 2 O and the surface temperature. The true state is x, the retrieved state is x ^ and the a priori state x a . For a linear or not too strongly non-linear retrieval, the retrieved state can be written as [33,40]:
x ^ = x a + A ( x x a ) + E
E is the error due to the measurement noise and to the uncertainties on the parameters used by RTTOV to simulate the radiance spectrum (such as atmospheric temperature and water vapor, surface emissivity, spectroscopic parameters). The averaging kernel matrix, A, characterizes the sensitivity of the retrieved state to the true state. The element A ( i , j ) is the relative contribution of the element x ( j ) of the true state to the element x ^ ( i ) of the retrieved state. The vertical resolution of the retrieved profile can be defined as the Full Width at Half Maximum (FWHM) of the rows of the averaging kernel matrix. The number of independent pieces of information contained in the measurement about the state vector can also be estimated as the Degrees of Freedom for Signal (DFS) defined as the trace of the averaging kernel matrix [33]. For the vertical profiles of gases (such as N 2 O) we can approximate a piece of information to the mean concentration in a given atmospheric layer. For a given retrieved gas, the corresponding DFS (trace of the averaging kernel submatrix correponding to the profile of this gas) therefore provides the number of independent retrieved layers. For a given gas, the concentration in a given layer is theoretically independently retrieved if the correponding DFS (the trace of the averaging kernel submatrix corresponding to the gas and layer) is equal to or larger than one.
From Equation (1), it is possible to compute the retrieval error (provided in Section 4.2 for SOFRID and FTIR retrievals) as the difference between the true and the retrieved states. For IASI trace gases retrievals, the dominant source of error is due to the smoothing of the true profile by the averaging kernel matrix accounting for the limited vertical resolution and the a priori effect [40,41,42]. The smoothing error covariance matrix is given by:
S s = ( A I ) S a ( A I ) T

4.2. Information Content and Error Analysis for Iasi and Ftir N 2 O Retrievals

For IASI nadir-looking observations, the vertical sensitivity and averaging kernels depend on surface (emissivity, temperature) and atmospheric (temperature, humidity) properties and on the surface atmosphere thermal contrast [34]. They therefore depend on season and location. IASI-SOFRID N 2 O averaging kernels for 2 NDACC stations, Izana in the tropical Atlantic in April and Wollongong in south-east Australia in January are displayed in Figure 3 for 5 layers: Lower Troposphere (LT, Surface–700 hPa), Middle Troposphere (MT, 700–350 hPa), Upper Troposphere (UT, 350–110 hPa), Stratosphere (Strat, 110–10 hPa) and Total (Tot., Surface-10 hPa). For both stations, the sensitivity is very low in the Stratosphere and rather low in the UT. Concerning the LT, the sensitivity is high for Izana in April and low for Wollongong in January. This difference highlights the larger sensititivity of LT retrievals to surface conditions. For both stations the MT averaging kernels are very similar and show a high sensitivity (0.5–1) in their nominal pressure range (700–350 hPa).
The DFS of the total N 2 O columns varies between 2.6 and 3.5 for the 12 stations and 4 seasons. Retrievals performed from AIRS data in a similar spectral window provide about 1 DFS [43]. The higher IASI DFS results from the higher spectral resolution and lower noise. The SOFRID-N 2 O retrievals therefore contain about three independent pieces of information about the N 2 O vertical distributions. The low sensitivity in the stratosphere results in very low DFS (0.08–0.15). Such a low sensitivity is due to the low IASI spectral resolution that does not allow to resolve the narrow stratospheric contribution to the integrated absorptions. The monthly DFS for LT, MT and UT for Izana and Wollongong are provided in Table 2 for January–April-July–October 2014 in order to give an idea about the spatio temporal variability of the information content for the tropospheric layers. The differences are not very important. In the three layers, the DFS are close to 1. As expected from the inspection of the averaging kernels, the DFS are lower and more variable (0.5–1.2) in the LT where IASI generally provides less than one piece of information. In the UT the DFS are also lower than 1 (0.7–0.9). In the MT the DFS are larger than 1 highlighting the higher sensitivity in this layer. Consistently with the information content, the retrieval errors are the highest in the LT (∼5 ppbv) and the lowest in the MT (∼2.5 ppbv).
For FTIR solar occultation observations, the sensitivity is not dependent on surface properties and the variability between stations and seasons is low. The FTIR averaging kernels for Wollongong in July (Figure 3b) and for Izana in January (Figure 3d) are very similar. For the total column the sensivity is close to unity from the ground to the stratosphere. For LT, MT and UT the averaging kernels are bell-shaped functions peaking at the nominal altitudes. For the LT the sensitivity is lower for Izana because of the high altitude of the sation. The FTIR observations are more sensitive to stratospheric N 2 O than IASI because of the much higher spectral resolutions of the FTIR instruments (<0.005 cm 1 , Angelbratt et al. [12]) that allow resolving the stratospheric absorptions.
The DFS for the total column (not shown) is almost constant for each stations. It is the lowest for the high altitude stations Jungfraujoch and Mauna-Loa with values ranging from 1.9 to 2.3 and varies from 2.5 to 4.2 at the other stations. These values are in agreement with Angelbratt et al. [12] who report DFS from 2 to 3 at 4 NDACC stations at northern middle to high latitudes and with Zhou et al. [39] who report 2.4 to 3.9 DFS at seven NDACC stations. At Izana and Wollongong (Table 3), the FTIR observations provide consistently slightly less than 1 piece of information for the MT and UT (0.6–0.9). The corresponding errors range from 2.0 to 4.3 ppbv. At Izana, the DFS for the LT (0.2–0.3) are lower than at Wollongong (0.6–0.7) because of the altitude of the station. For the same reason, the highest errors (6.1–7.5 ppbv) are found for the Izana LT mixing ratios. These DFS and error values are representative of the selected 12 NDACC stations.

5. Validation Results

5.1. Methodology

As shown in the previous section, both FTIR and SOFRID retrievals have comparable sensitivities in the MT (Figure 3) providing around one piece of information. The IASI retrievals are not consistently sensitive to the atmosphere close to the ground and generally provide less than one piece of information in the LT. Most of the considered FTIR stations are at high altitudes preventing consistent LT comparisons. In the UT, the SOFRID retrievals are also less sensitive than in the MT providing less than one piece of information. Therefore, we have decided to focus on the SOFRID and FTIR N 2 O MT retrieved VMRs. We will also discuss the ability of IASI to document the variations of LT and UT N 2 O VMRs. For LT, MT and UT, the retrieved VMRs are computed as the ratio of the N 2 O to the air columns.
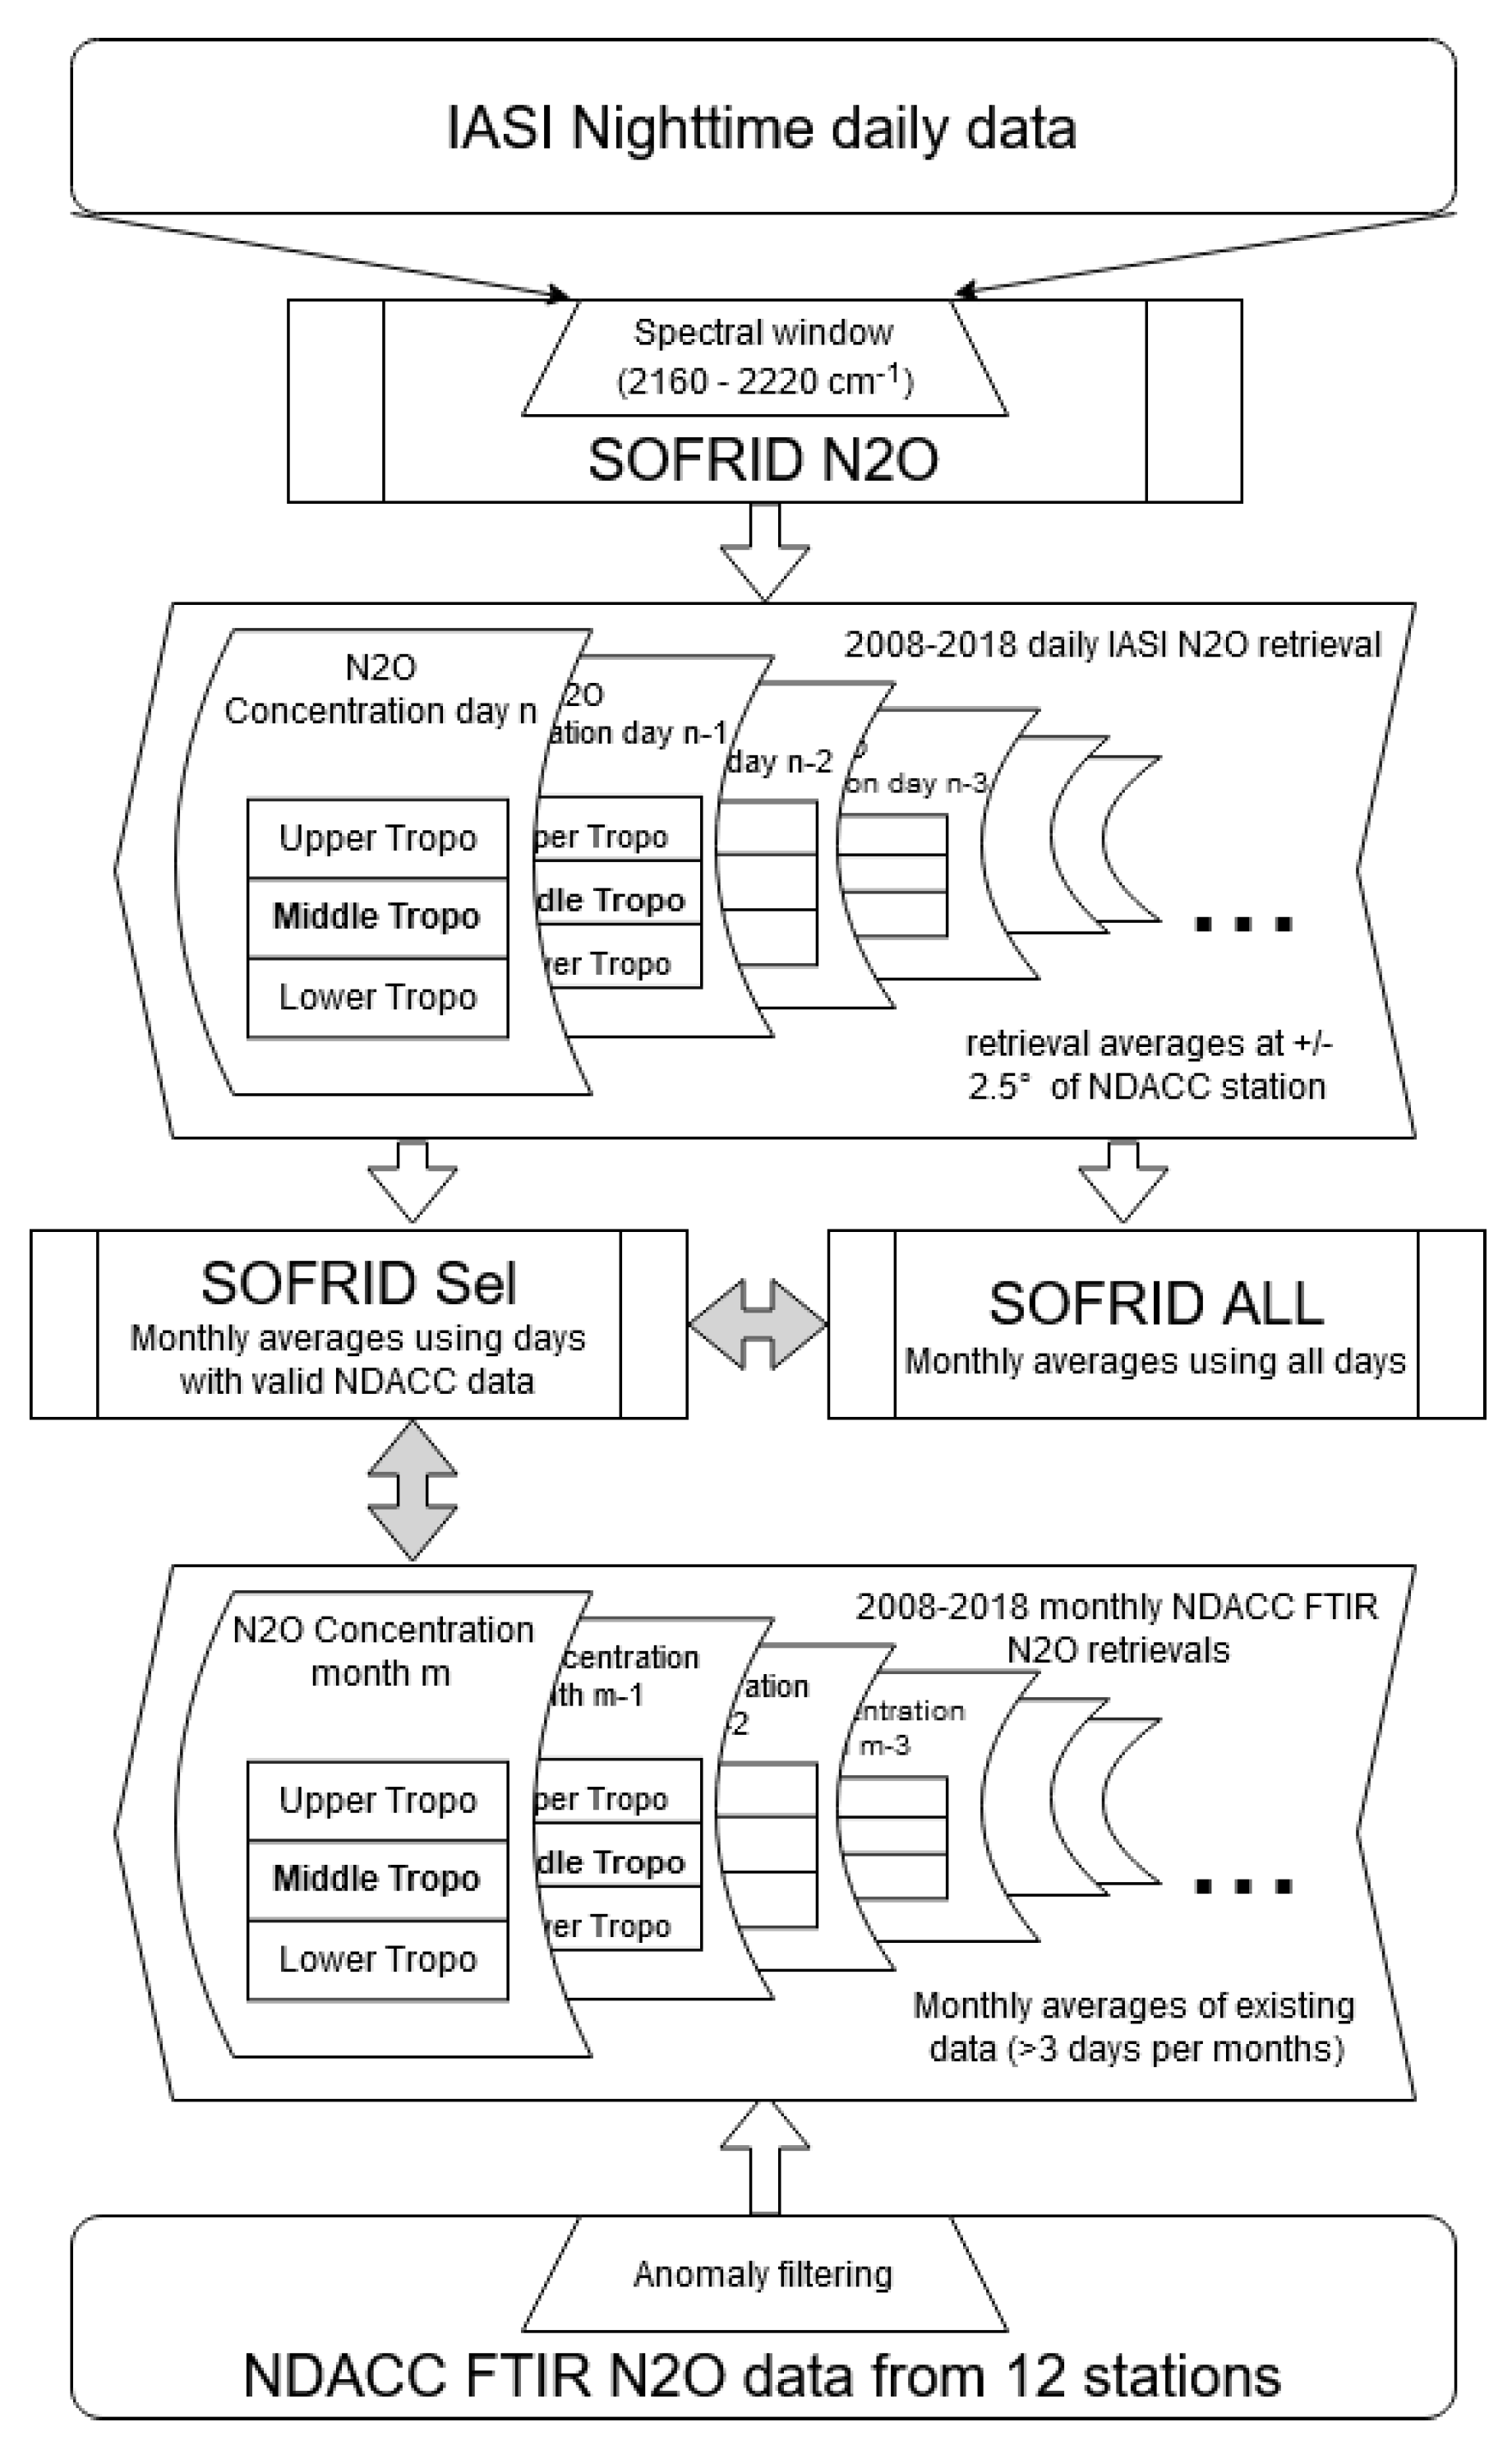
We have computed the mean monthly SOFRID and FTIR N 2 O LT, MT and UT VMRs. For SOFRID, we have computed two different monthly means. First, for a rigorous comparison, we have computed a coincident mean (SOFRID Sel.). For each day with N 2 O observations at a given NDACC station, IASI pixels have been selected for the same day within ±2.5 in latitude and longitude around the station. The monthly means are computed for months with at least three days with valid FTIR data. Second, in order to evaluate the impact of the data coincidence and the SOFRID trends we have computed monthly means including all SOFRID valid data within ±2.5 around the station (SOFRID All). The methodology of the validation is summarized in a flow chart in Figure 4.

5.2. Results

We first present the general statistics based on the 11 years of monthly data records and the comparisons of the trends deduced from these long term records. Then we discuss the seasonal cycles as computed from detrended SOFRID and FTIR data.

5.2.1. General Statistics

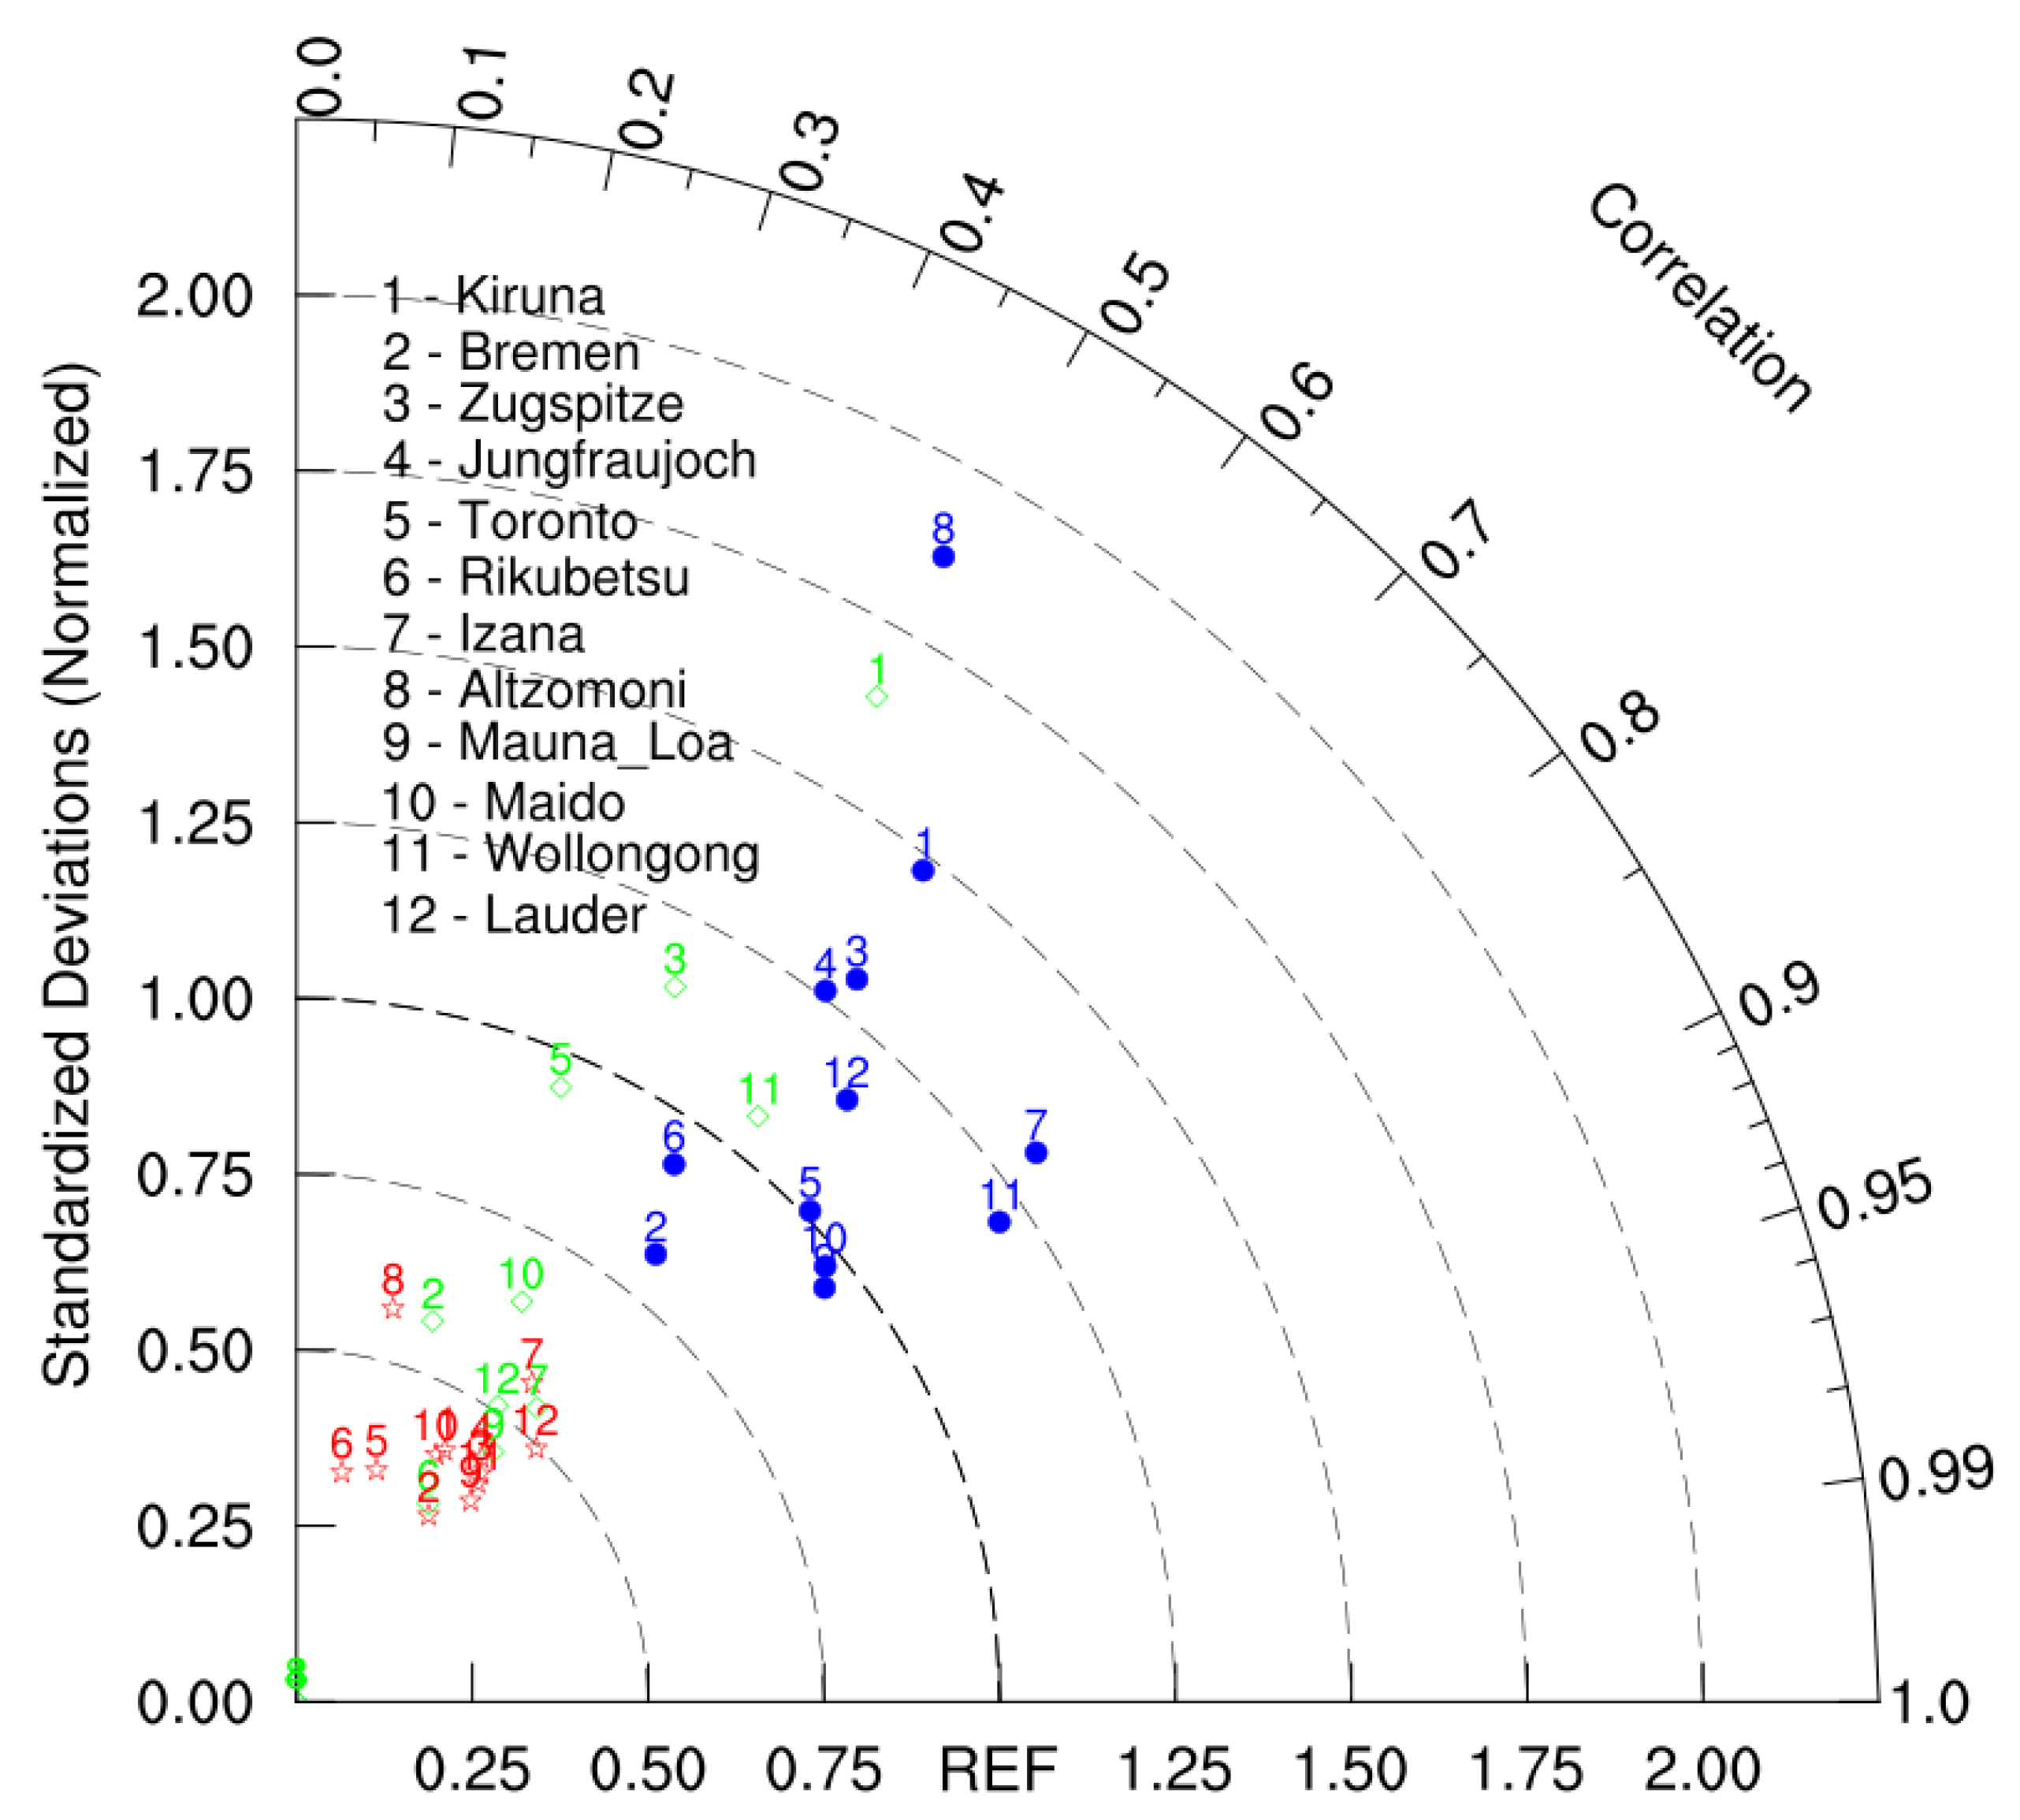
The statsistics of the comparisons at the 12 stations and for the three tropospheric layers (LT, MT and UT) are provided synthetically in a Taylor diagram [44] in Figure 5. In this diagram, each observation (corresponding to one of the twelve NDACC stations and one of the three tropospheric layers in our case) to be validated is represented by a point placed within a quarter circle. The reference is located in the middle of the X-axis (see Figure 5). The correlation coefficient between the reference and test dataset is given by the azimuthal position of the point. The RMSD is proportional to the distance between the test and the reference point. Finally, the radial distance from the origin is proportional to the variance of the experiment. The normalisation of the RMSDs and standard deviations by the standard deviation of the reference allows us to display the results from all the stations and layers on a single diagram (see Taylor [44] for details).
The points corresponding to the three layers display important differences. All of the UT points are gathered close to the origin of the diagram with SOFRID variabilities lower than the FTIR ones with ratios from 0.33 to 0.58. Most of the LT points are also close to the origin of the diagram with variability ratios ranging from 0.34 to 0.65. Nevertheless, at Zugspitze, Toronto and Wollongong the SOFRID variabilities are close to the FTIR ones and the Kiruna SOFRID LT variability is significantly larger than the FTIR one. In both the LT and UT the points are also characterized by moderate correlation coefficients (0.19 to 0.69).
For the MT, except at Altzomoni, the points are gathered at the center of the Taylor diagram. SOFRID and FTIR variabilities are therefore in better agreement than in the LT and UT with ratios of the standard deviations ranging from 0.82 to 1.48. In the MT the better agrement is also documented by higher correlation coefficients (0.57–0.83 for 11 stations). At Altzomoni the correlation coefficient is the lowest (0.48) and the SOFRID standard deviation is 1.9 times larger than the FTIR one. This lesser agreement is probably related to the low temporal coverage with missing data between 2008 and 2012 and to the mountainous situation of this station. In the following we will focus on the MT for which the agreement between FTIR and SOFRID N 2 O is the best.
For the MT, the detailed comparison statistics are given in Table 4. From the R values, it is possible to roughly split the stations in two groups. The first group concerns continental stations (Kiruna, Bremen, Zugspitze, Jungfraujoch, Toronto, Rikubetsu, Altzomoni, Lauder) and the second one oceanic or coastal stations (Izana, Mauna-Loa, Maido, Wollongong). R is lower than 0.72 for the first group and larger than 0.77 for the second one.
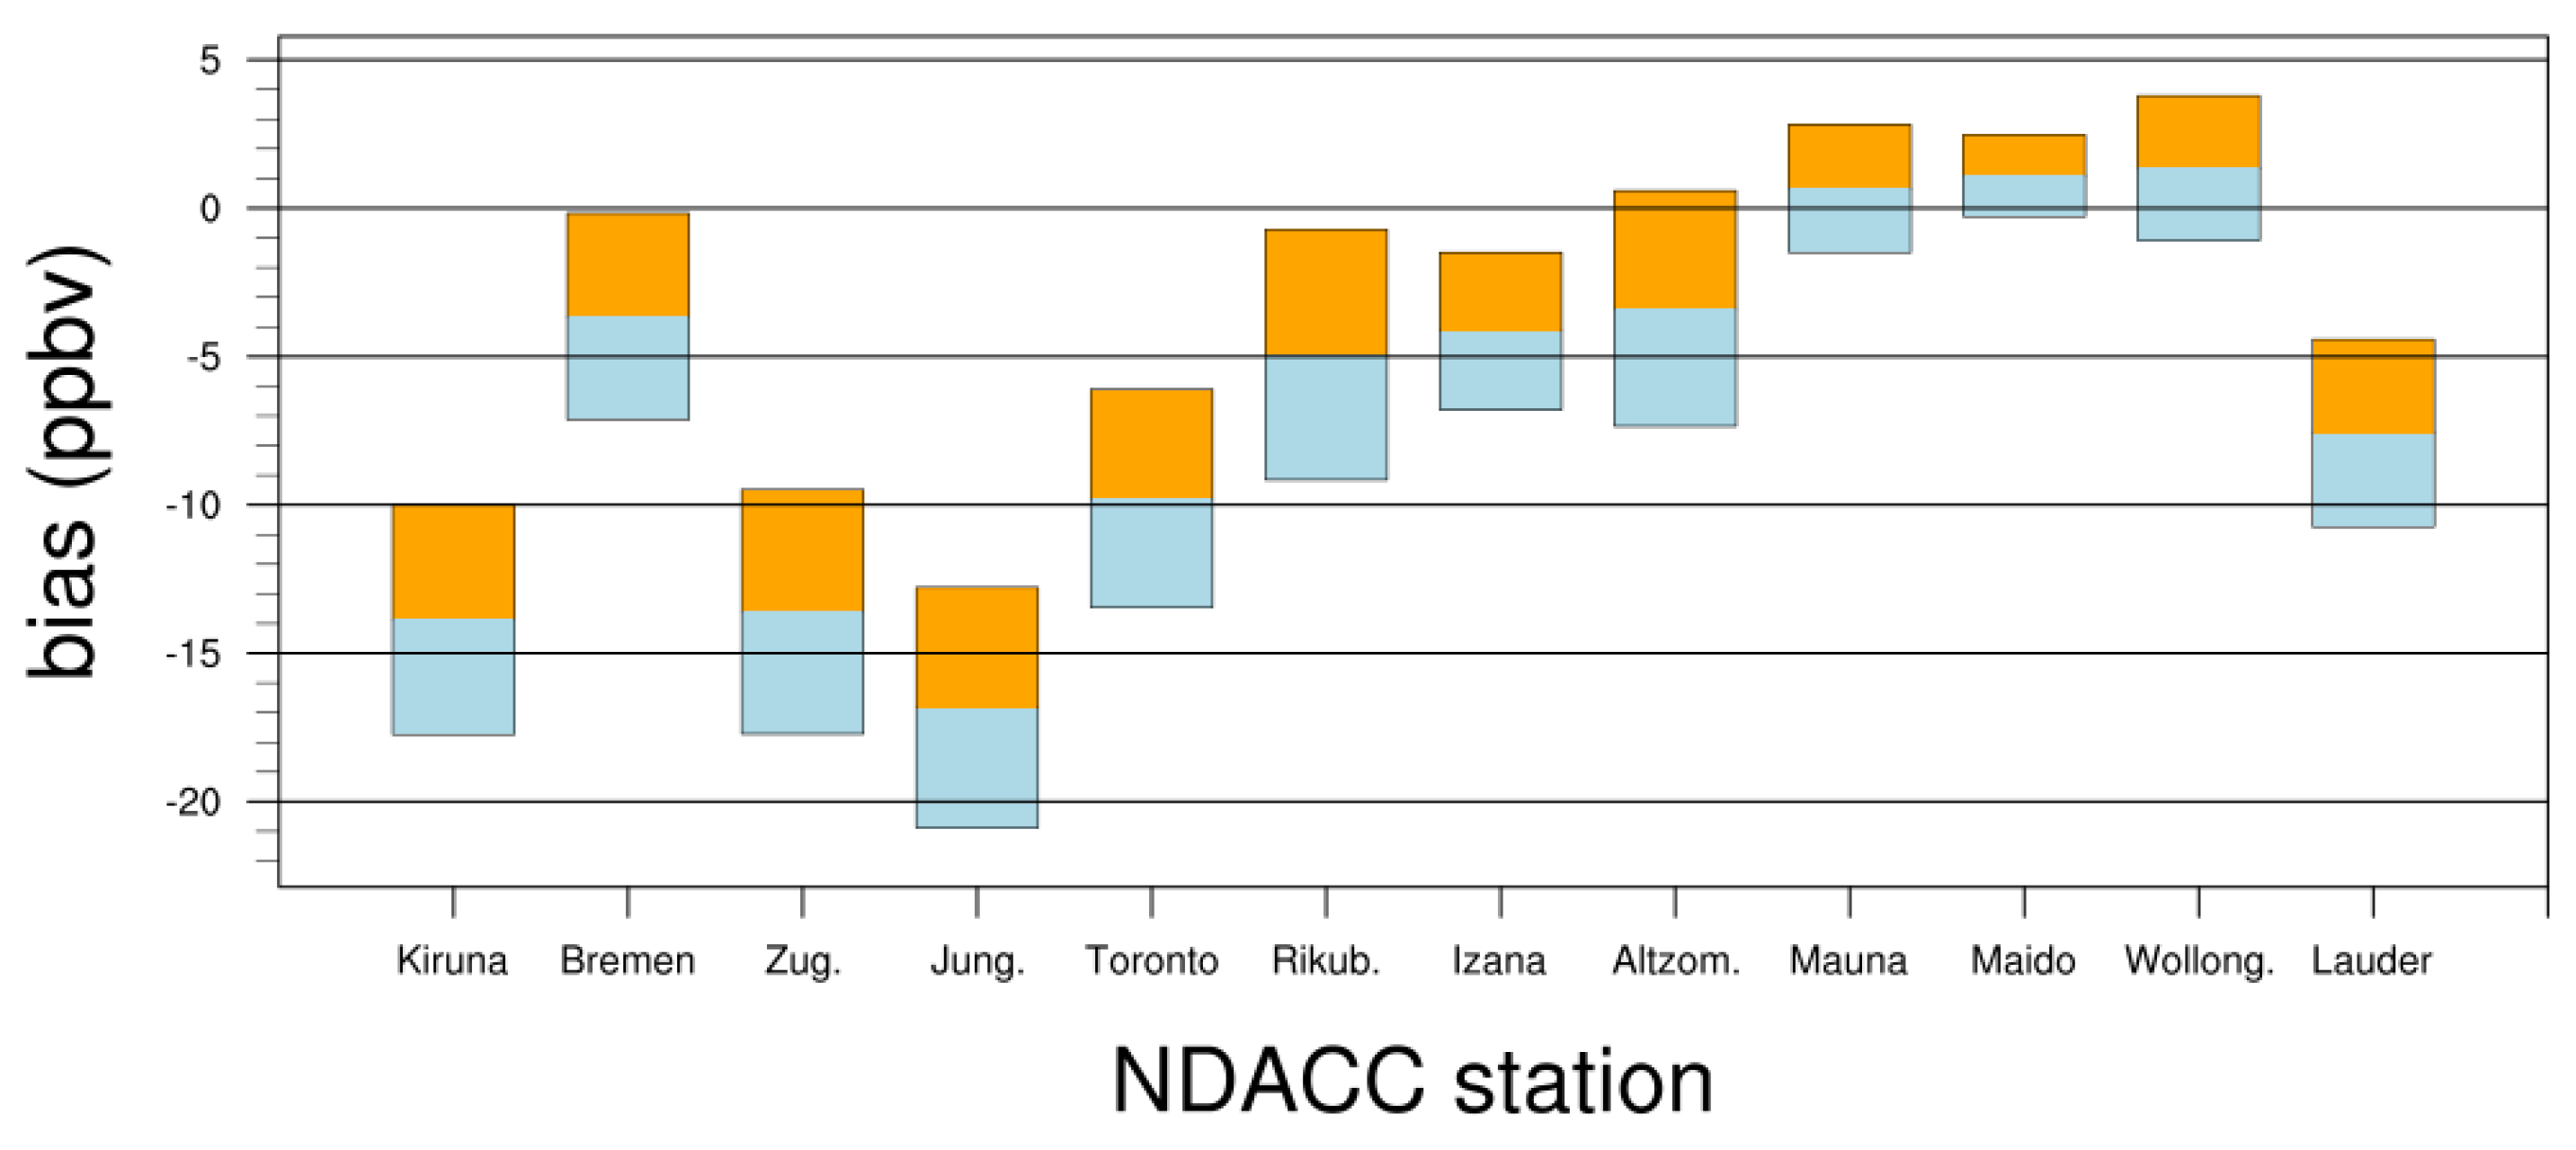
The biases and RMSDs are given in Table 4 and also displayed in a bar chart in Figure 6. Except for Bremen and Altzomoni, the larger and most significant biases occur at continental stations with SOFRID underestimating FTIR N 2 O MT VMRs by 5 ppbv (1.5%) at Rikubetsu to 17 ppbv (5.5%) at Jungfraujoch. As the MT mixing ratios are independent pieces of information with DFS close to one for both FTIR and SOFRID (Table 2 and Table 3), the differences of a priori should not be responsible for these significant biases. Indeed, the SOFRID tropospheric a priori mixing ratios (Section 2.2) are larger than the FTIR ones at all stations except Wollongong (Section 3). The difference is ∼5 ppbv at 550 hPa. In case the retrievals were dependent on the a priori, these differences should lead to an overestimation of N 2 O from SOFRID relative to FTIR instead of the observed underestimation.
At Izana the bias is low (−4 ppbv or 1.3%) but significant. At the 3 other oceanic stations, the positive biases are lower than 1.3 ppbv (0.4%) and not significant.
If we only consider sea pixels at Lauder the bias decreases to −2.3 ppbv and becomes unsignificant and the correlation coefficient increases to 0.74. At Wollongong the agreement slightly worsens when only sea pixels are selected (see Table 4). Nonetheless the correlation coefficient remains high (0.76) and the bias low (4.2 ppbv or 1.3%). It has to be noted that this bias is positive contrarily to most continental stations.
At continental stations with continuous measurements during 2008–2018, the RMSDs range from 3.5 to 4.2 ppbv and the SOFRID and FTIR RMS from 3.3 to 5.2 ppbv (Table 4). At oceanic stations (including Lauder and Wollongong with sea pixels only), the RMSDs are lower (1.4–2.8 ppbv) than at continental stations. Nevertheless, the SOFRID and FTIR RMS (3.2–4.5 ppbv) are comparable to the continental ones further highlighting the better agreement between SOFRID and FTIR for sea pixels.

5.2.2. Long Term Variations

Figure 7 and Figure 8 display the time series of SOFRID and FTIR N 2 O MT VMRs for the six NH stations and for the six tropical and SH stations respectively. For 9 out of the 12 NDACC stations, we found NOAA/ESRL stations (Table 5) providing monthly averages of N 2 O surface data within broad regions around the NDACC stations. For 8 of these NDACC stations, the distance from the corresponding NOAA/ESRL station is smaller than 600 km. Mahe Island is about 2000 km away from the Maido station but is still in the Western Indian Ocean region. The monthly means of surface concentrations from in-situ NOAA/ESRL measurements are used as references for tropospheric N 2 O trends for the 2008–2018 period. As N 2 O has an atmospheric lifetime larger than 100 years, the trends are little variable geographically and the large distances between some NOAA/ESRL and NDACC stations are not significant for trends comparisons.
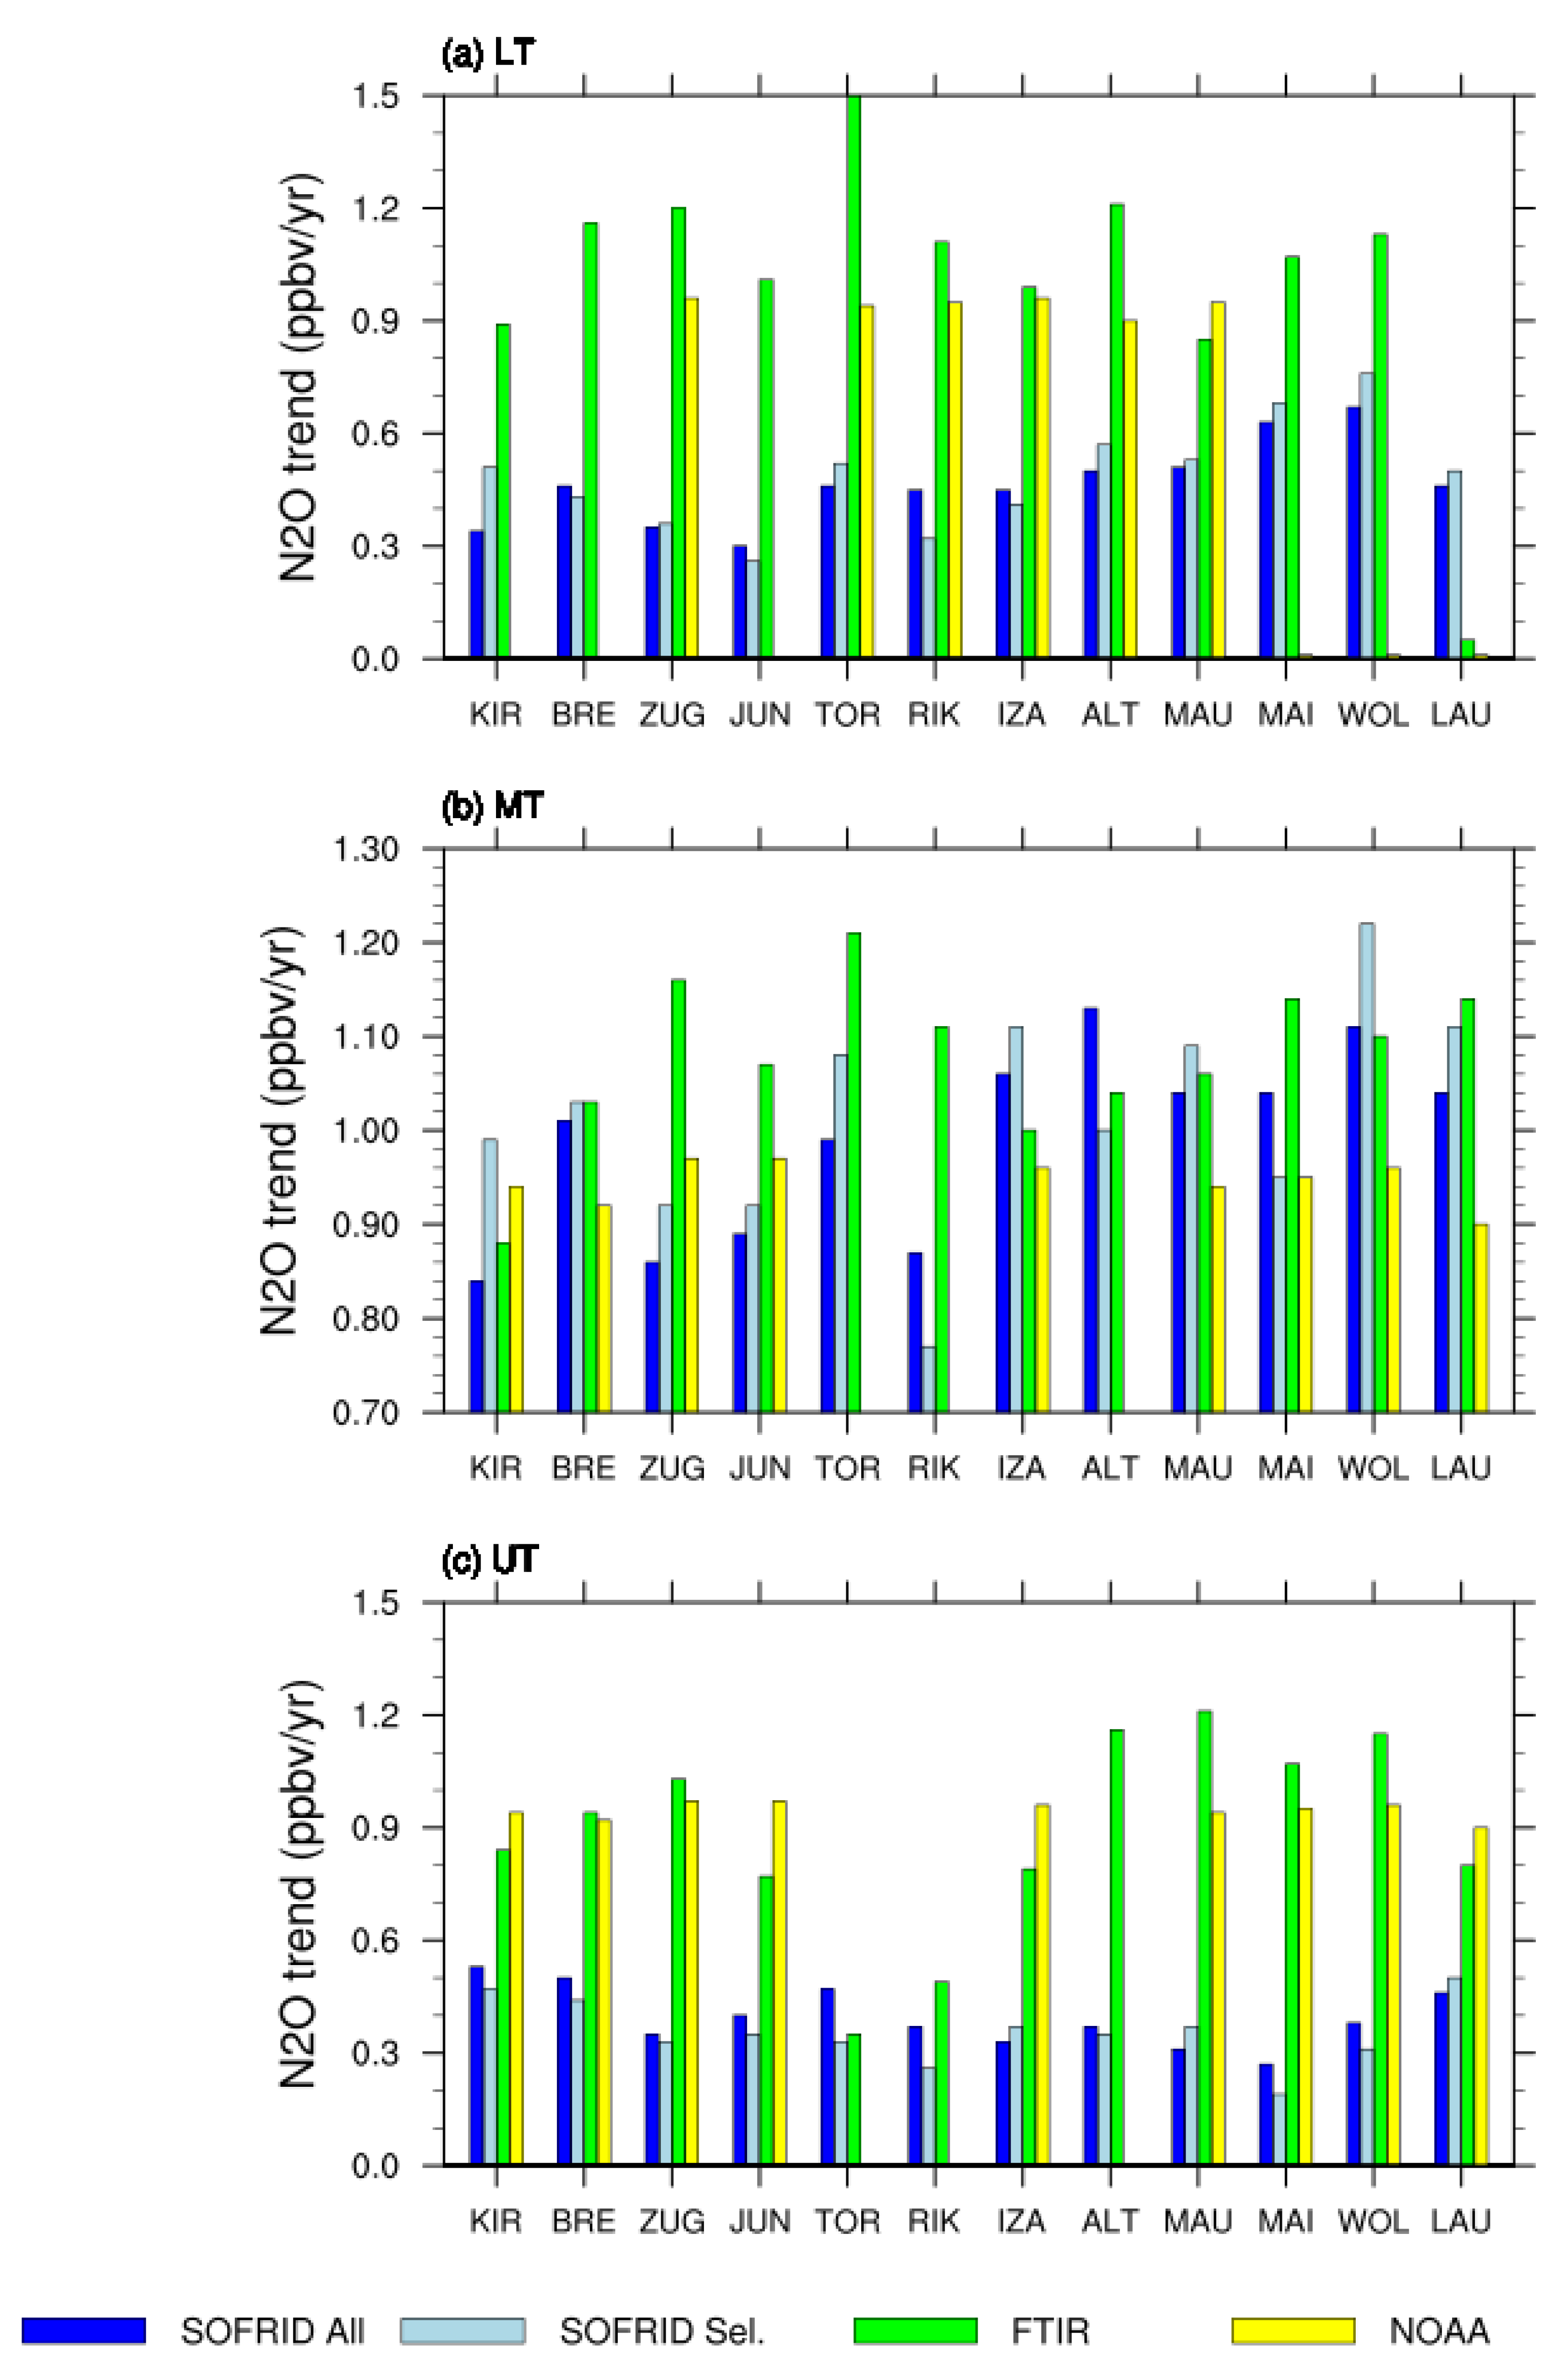
For the three types of data we have performed a linear regression to determine the corresponding trends. For all the stations FTIR, SOFRID and NOAA/ESRL trends are statistically significant with p values lower than 0.005. For IASI, we plotted the monthly means based on data coincident to FTIR observations (blue lines and symbols) and the monthly means based on all valid IASI pixels (green lines). It is noteworthy that when the FTIR sampling is low, the SOFRID time series integrating all available retrievals appear smoother than the time series based on the FTIR sampling. The SOFRID and FTIR MT trends are also displayed as bar charts in Figure 9b and gathered in Table 6 together with NOAA/ESRL surface trends. For the 8 stations with continuous observations between 2008 and 2018 (Table 1) the FTIR linear MT N 2 O trends are close to 1 (0.88–1.21) ppbv·yr 1 with an average value of 1.08 ± 0.10 ppbv·yr 1 . For the same stations, the SOFRID trends based on all data are varying between 0.84 and 1.11 ppbv·yr 1 with an average of 0.98 ± 0.10 ppbv·yr 1 . The SOFRID and FTIR trends are therefore in good agreement. Considering coincident data only (lightblue bars in Figure 9b) the trends are slightly larger for SOFRID (1.05 ± 0.10 ppbv·yr 1 ) and in better agreement with the FTIR trends with a mean difference of −0.02 ± 0.14 ppbv·yr 1 . The NOAA/ESRL trends are little variable geographically ranging between 0.92 and 0.96 ppbv·yr 1 at most stations. A slightly lower value (0.90 ppbv·yr 1 ) is found at Baring-Head. The SOFRID MT trends are in very good agreement with the trends determined from in-situ NOAA/ESRL data with a mean difference of −0.04 ± 0.10 ppbv·yr 1 . FTIR MT trends are slightly larger than the NOAA/ESRL surface ones with a mean difference of −0.11 ± 0.10 ppbv·yr 1 .
In the UT and LT (Figure 9a,c), the FTIR trends remain close to 1 ppbv·yr 1 and to the NOAA/ESRL surface trends. The SOFRID trends are much lower than in the MT with values between 0.3 and 0.7 in the LT and 0.3 and 0.5 in the UT. Xiong et al. [43] found a decrease of the N 2 O trends from 0.86 ppbv·yr 1 at 300 hPa to 0.76 ppbv·yr 1 at 500 hPa and 0.5 ppbv·yr 1 at 700 hPa based on AIRS retrievals. SOFRID is therefore more sensitive to the trends in the MT than AIRS which highest sensitivity is in the UT. Both retrievals show a diminished sensitivity to trends in the LT.

5.2.3. Seasonal Cycles

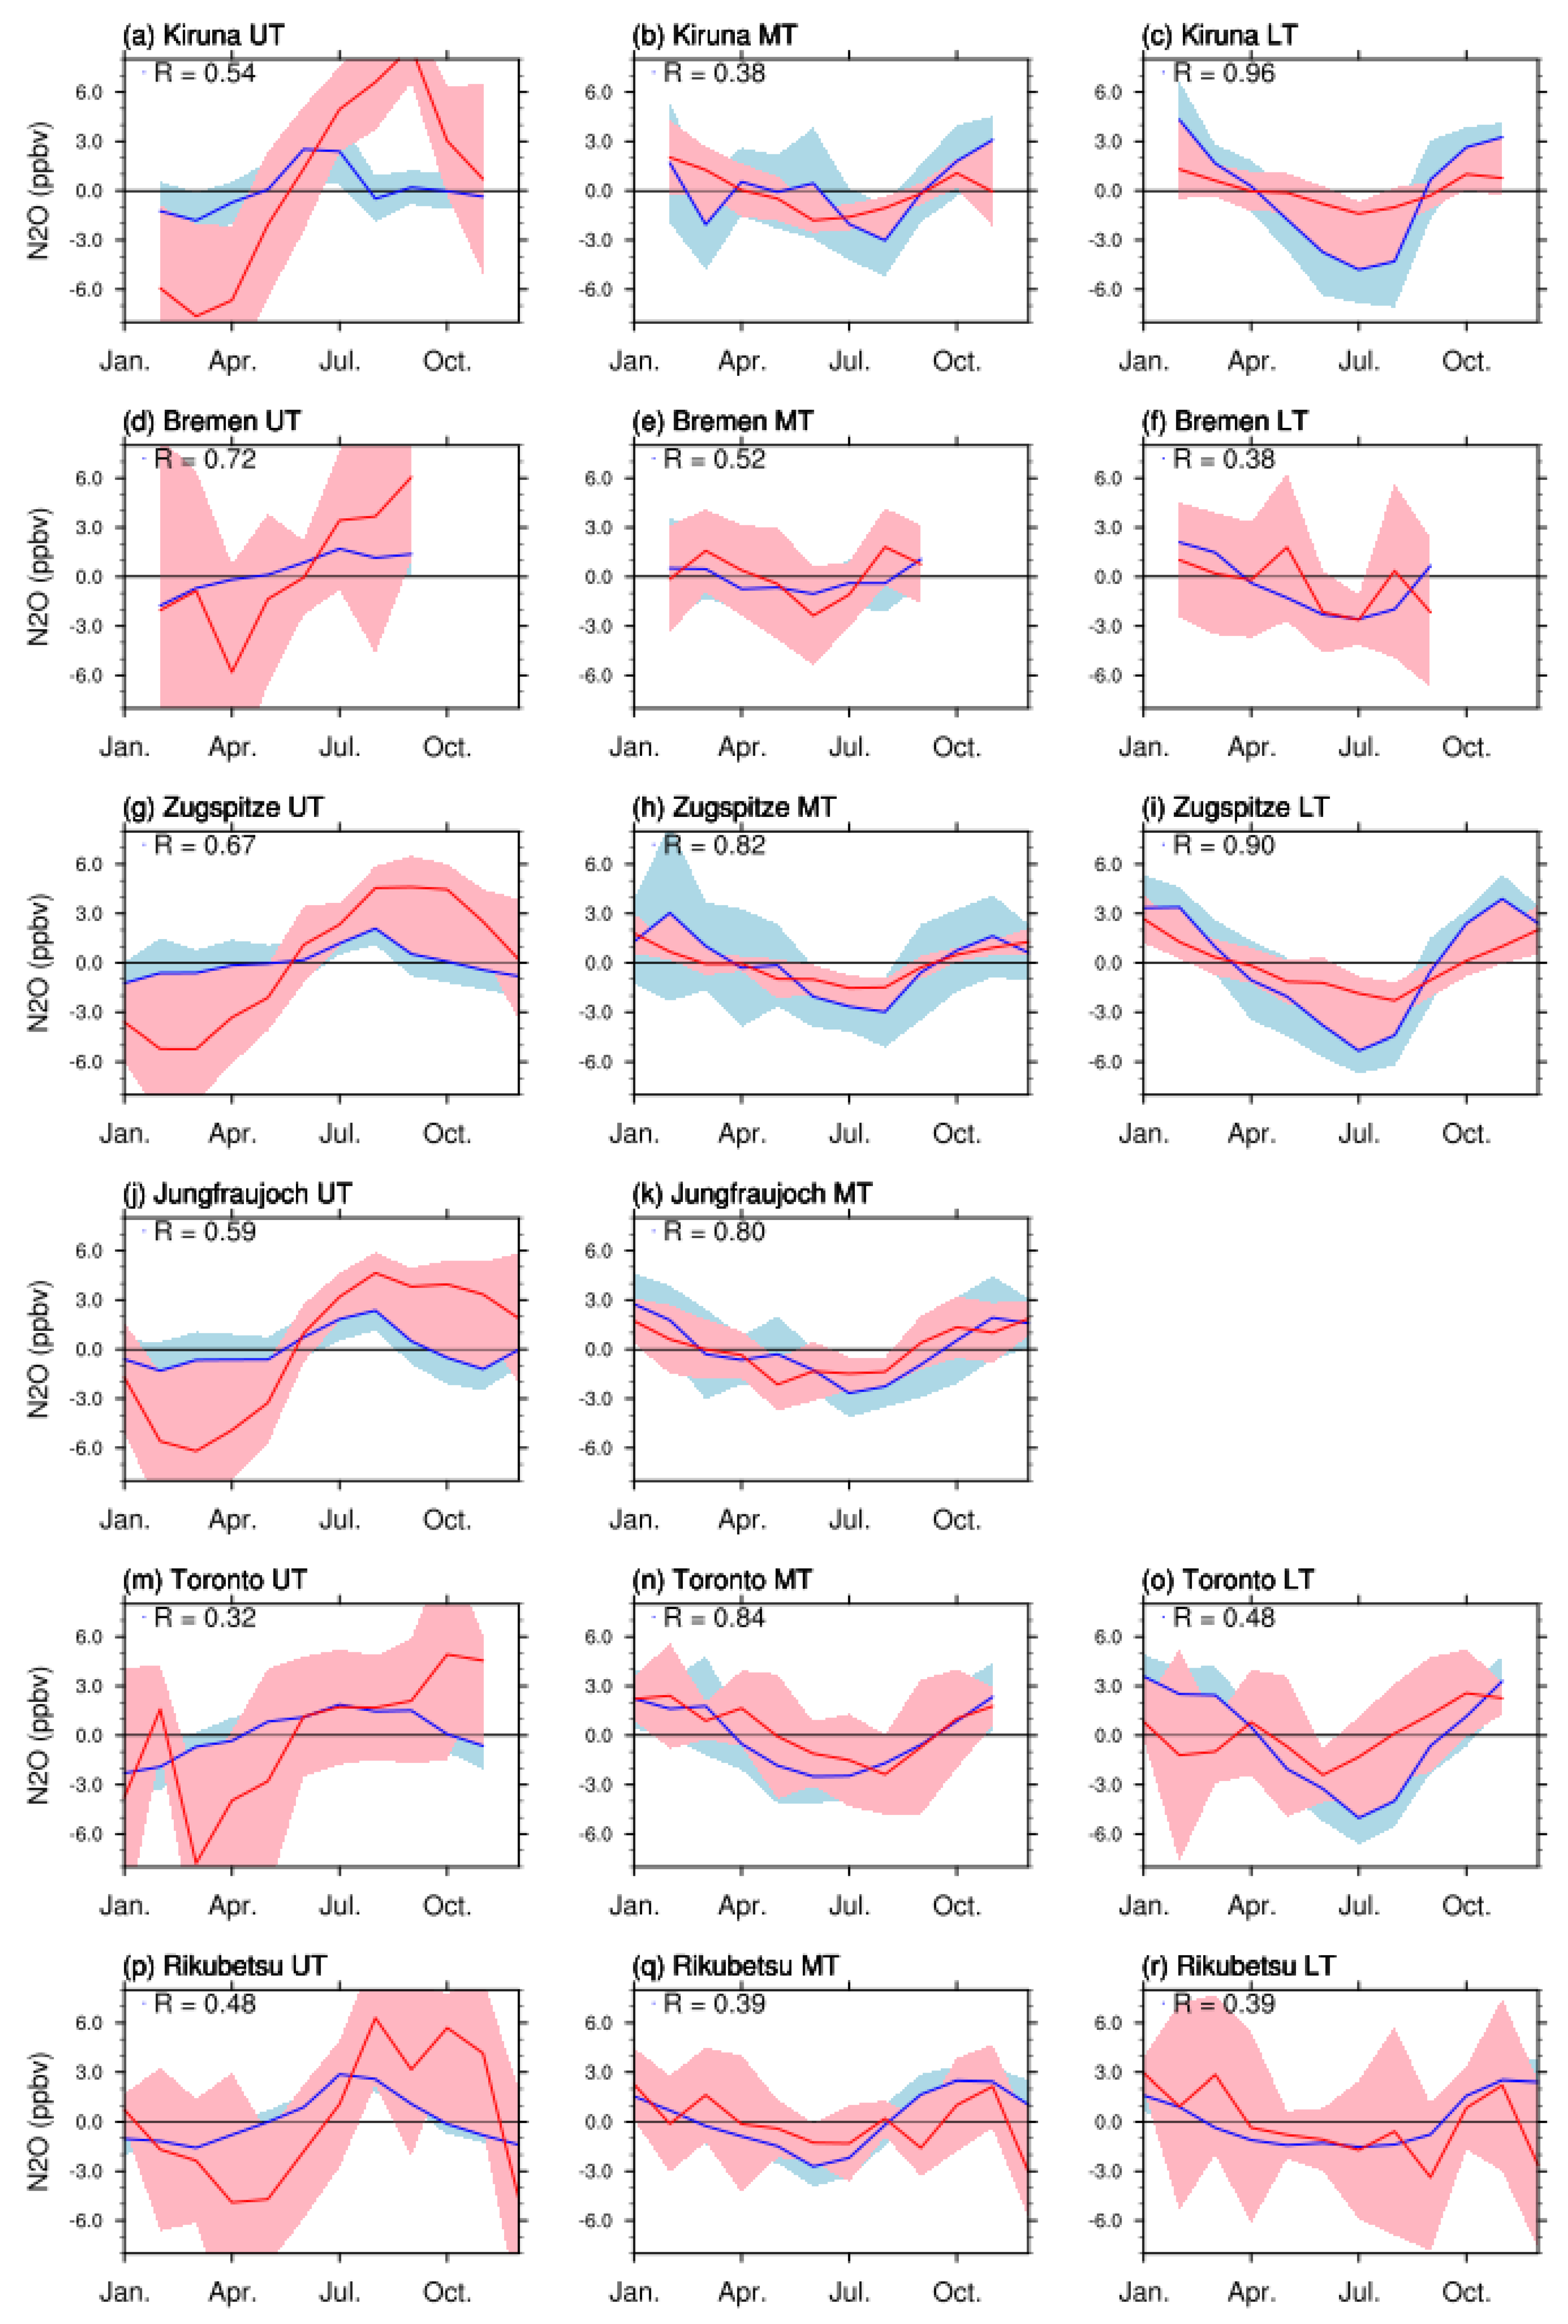
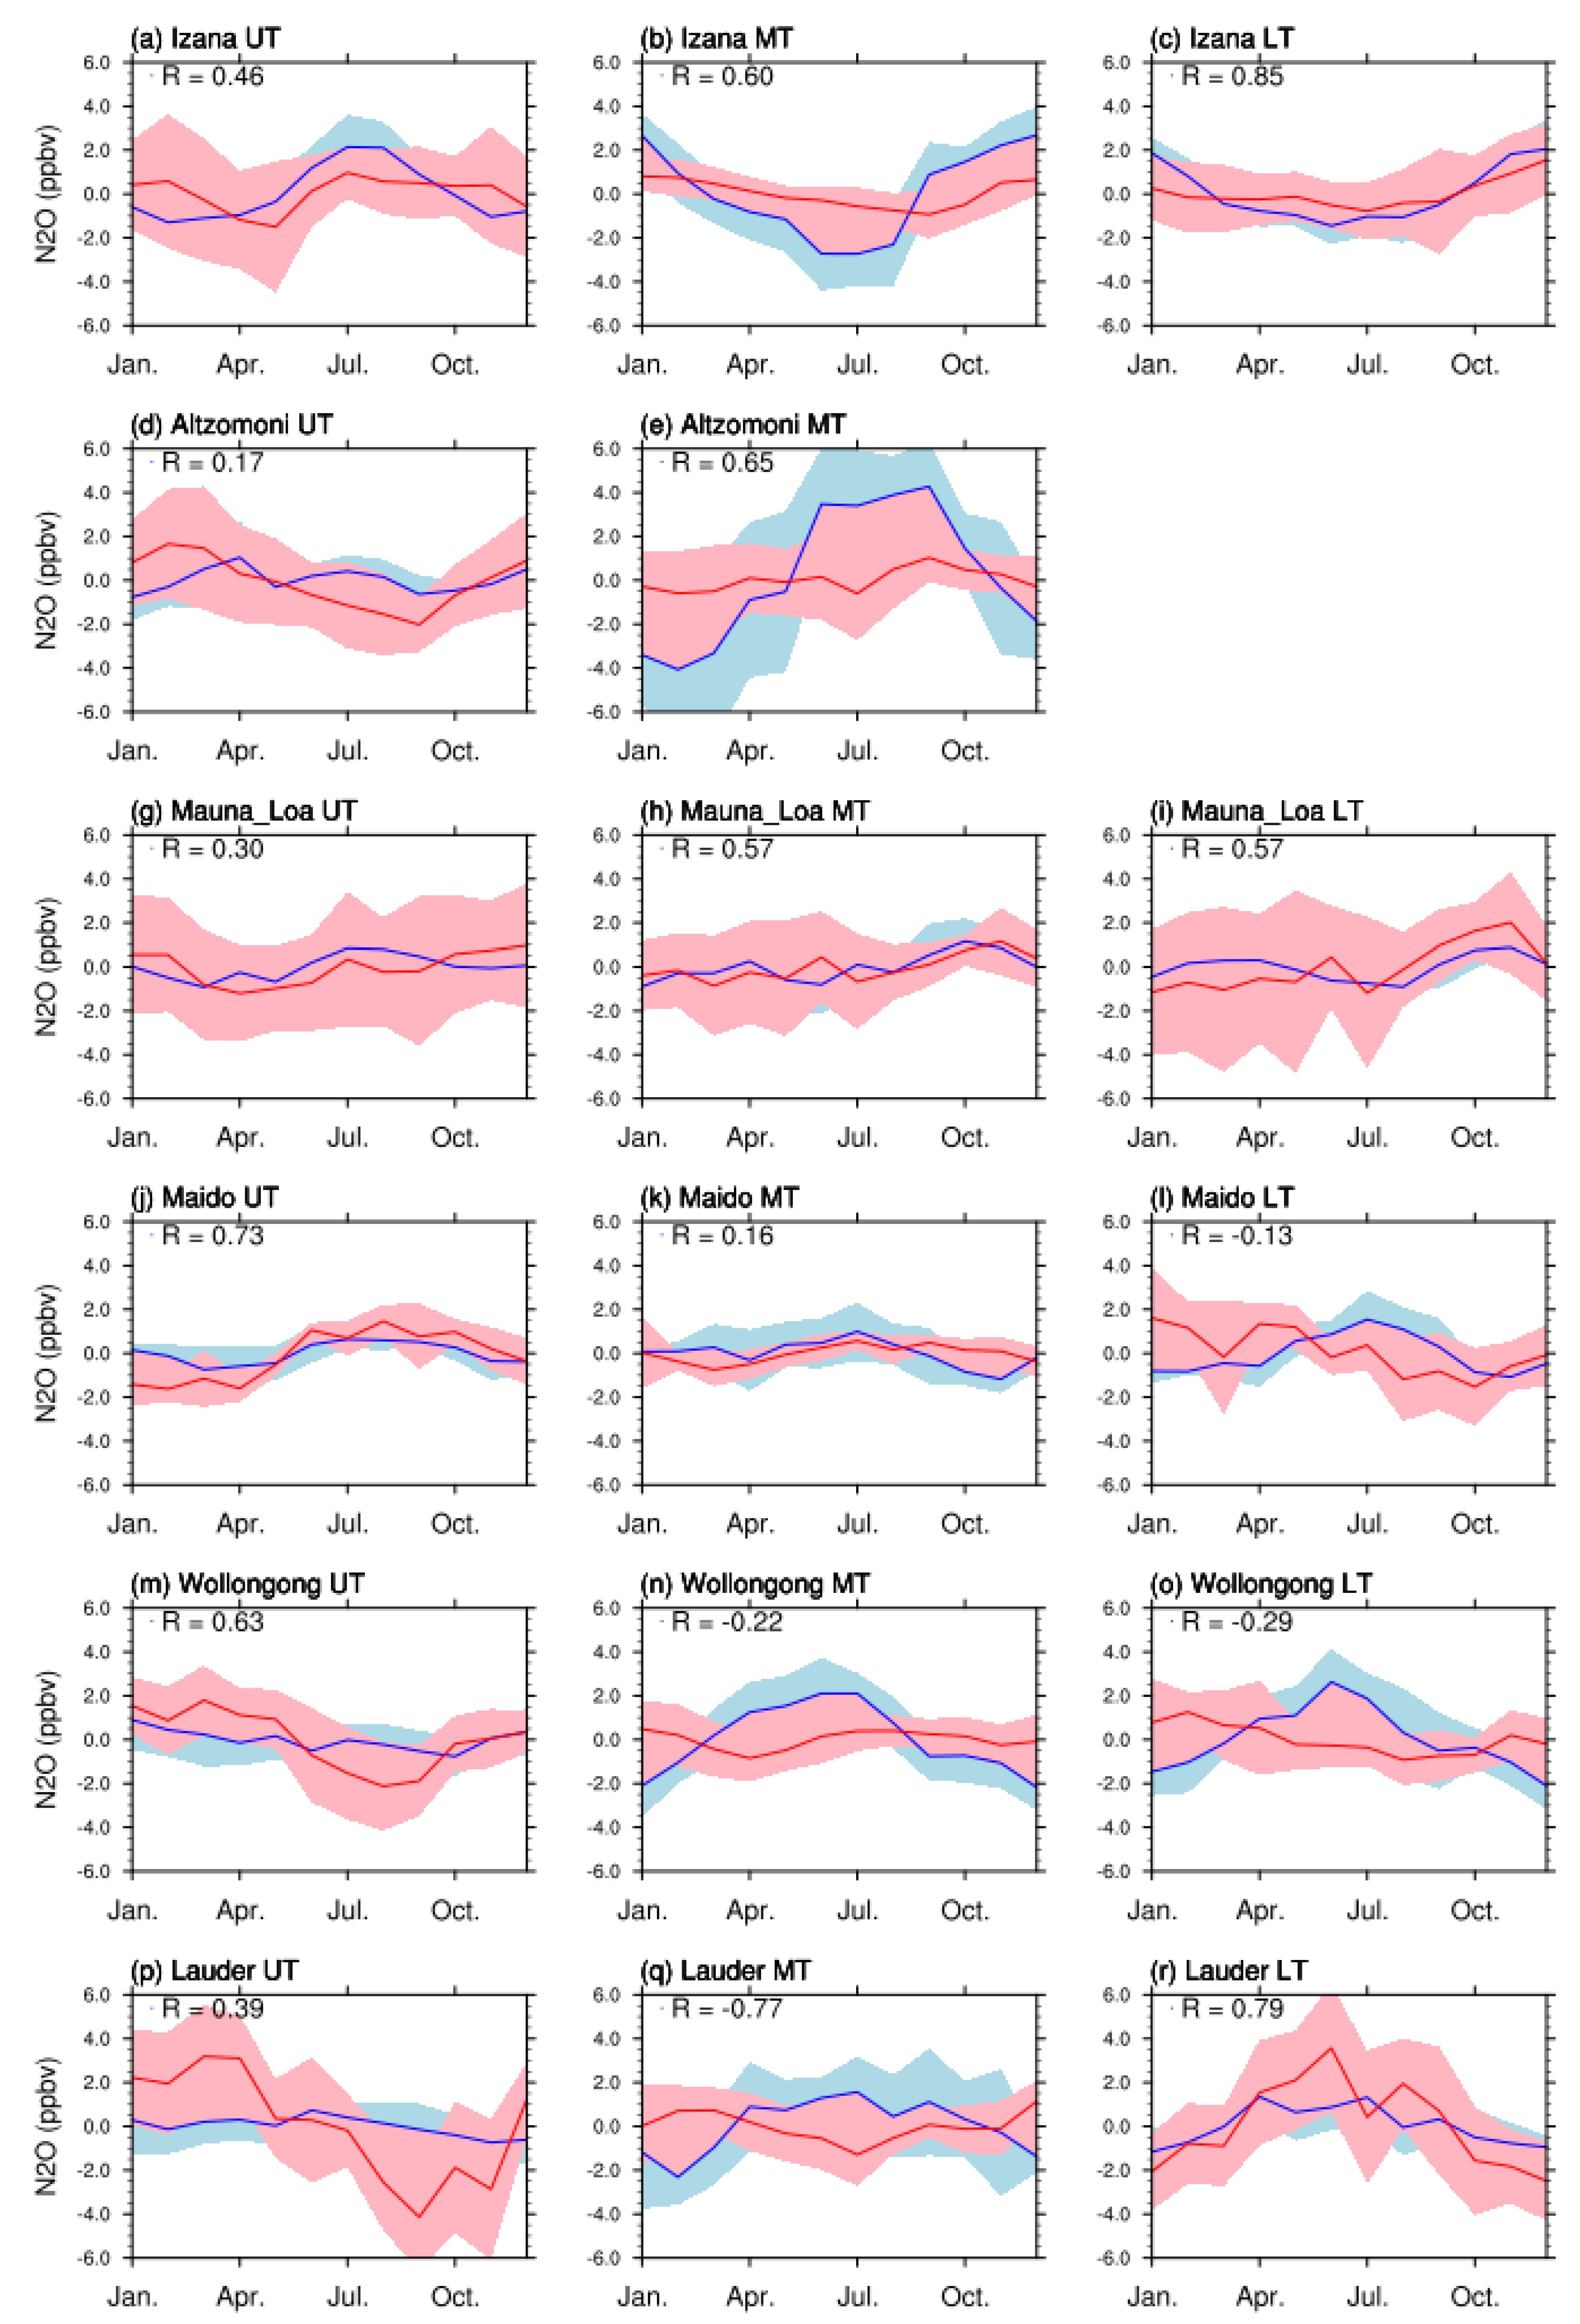
The previous section has highlighted the ability of SOFRID N 2 O retrievals to correctly represent its MT trends at 12 NDACC stations. Here we examine their ability to capture the seasonal cycles of N 2 O in the UT, MT and LT as observed by FTIR. To compute the seasonal cycles, we have first removed the linear trends from the time series of Figure 9 to obtain detrended time series. For each month we have computed the 11 years average from the detrended time series for FTIR and SOFRID. They are displayed with the corresponding inter-annual variabilities in Figure 10 for NH and Figure 11 for tropical and SH stations.
At NH stations (Figure 10), the MT N 2 O seasonal cycle from both FTIR and SOFRID is roughly characterized by a summer minimum and a winter maximum. The cycle is the clearest at Zugspitze, Jungfraujoch and Toronto. At these three stations the N 2 O seasonal cycles are in very good agreement for both observing systems (R > 0.80). FTIR data at the Bremen station are lacking for winter months and the comparison of the seasonal cycle is therefore incomplete. The SOFRID MT seasonal cycles in the NH are in good agreement with the seasonal cycles from IASI-MUSICA at 4.2 km documented by Garcia et al. [20] at Karlsruhe and Kiruna. Nevertheless, in Garcia et al. [20] the FTIR cycles are characterized by summer-fall maxima and are therefore poorly correlated to the IASI-MUSICA ones. No explanation has been found for the opposition in phase between the FTIR MT seasonal cycles for NH stations reported here and the 4.2 km cycles at Karlsruhe and Kiruna from Garcia et al. [20]. At Rikubetsu, the yearly maximum is shifted to October-November for both SOFRID and FTIR data. For the 6 NH stations the amplitude of the MT cycles (4 to 8 ppbv) are in very good agreement for both observing systems.
In the LT, the cycles are very similar to the MT cycles with summer minima and winter maxima. The correlation coefficients (0.38–0.96) are comparable to those in the MT. The amplitude of the cycles is generally larger for SOFRID (4 to 9 ppbv) than for FTIR (2 to 6 ppbv).
The NH UT seasonal cycles are characterized by a July-August and August-October maxima for SOFRID and FTIR respectively. This relative coincidence lead to a correct agreement with correlation coefficients from 0.37 to 0.67 between both datasets. The summer shift of the N 2 O maxima is caused by the position of the tropopause. In summer the tropopause is high and the retrieved UT columns are less impacted by stratospheric N 2 O poor air masses than in winter. The amplitude of the FTIR cycles is 2 to 4 times (12 to 16 ppbv) larger than the SOFRID cycles (4 to 8 ppbv) highlighting the higher sensitivity of FTIR data in the UT. In Garcia et al. [20] both IASI-MUSICA and FTIR UT cycles are displaying a clear August UT maximum with similar amplitudes at Karlsruhe and Kiruna highlighting a higher UT sensitivity for MUSICA than for SOFRID.
At tropical stations, the MT FTIR seasonal cycles (Figure 11b,e,h,k) are much weaker than at NH stations. At Izana, it is possible to distinguish a weak seasonal cycle from FTIR data (2 ppbv amplitude) with a August–September minimum and a November–February maximum. The SOFRID cycle is stronger (6 ppbv amplitude) and its minimum is shifted towards summer (June-August). Garcia et al. [20] found very similar results comparing FTIR and IASI-MUSICA N 2 O retrievals at 4.2 km at Izana. Their IASI-MUSICA retrievals display a large (∼6 ppbv amplitude) seasonal cycle with a summer minimum while the FTIR seasonal cycle is much weaker. At Altzomoni, the seasonal FTIR cycle is much weaker than the SOFRID cycle and both are consistently phased with a summer maximum. At the Mauna-Loa and Maido oceanic stations, the FTIR and SOFRID seasonal variations are not larger than the inter-annual variabilities and no clear seasonal cycles can be determined. Finally, at the two SH mid-latitude stations (Figure 11n,q), FTIR data show weak seasonal cycles with spring (Wollongong) and summer (Lauder) minima while SOFRID data display larger seasonal cycles with a spring-summer maximum resulting in negative R values.
2 At tropical stations the LT cycles (Figure 11c,i,l) and the agreements between FTIR and SOFRID are similar to the MT. At Izana, the agreement is improved with a higher correlation coefficient (0.85) and similar cycles amplitudes. At SH mid-latitudes (Figure 11o,r) the SOFRID cycles are almost identicals to those in the MT. But while at Wollongong the FTIR cycle remains the same as in the MT with a weak fall minimum, the Lauder cycle is reversed displaying a clear fall-winter maximum similarly to NH mid-latitudes. Therefore, the correlation coefficient remains negative at Wollongong and turns highly positive (0.79) at Lauder.
In the UT, the SOFRID and FTIR cycles (Figure 11 left panels) are not strongly significant relative to the corresponding interannual variabilities. Nonetheless, except at Altzomoni and Mauna-Loa the SOFRID and FTIR cycles are in phase with each other (0.39 < R < 0.73). It is noteworthy that for both FTIR and SOFRID, at Izana the UT cycle (Figure 11a) is opposite to the MT and LT cycles in agreement with Garcia et al. [20]. The Lauder FTIR UT cycle (Figure 11p) is particularly clear and comparable to the one of the NH mid-latitude stations (e.g., Zugspitze, Jungfraujoch and Rikubetsu) with a summer-fall maximum and a winter-spring minimum. The SOFRID cycle, very weak at Lauder (Figure 11p) is more visible and in better agreement with the FTIR one at Wollongong (Figure 11m).

6. Global Distributions

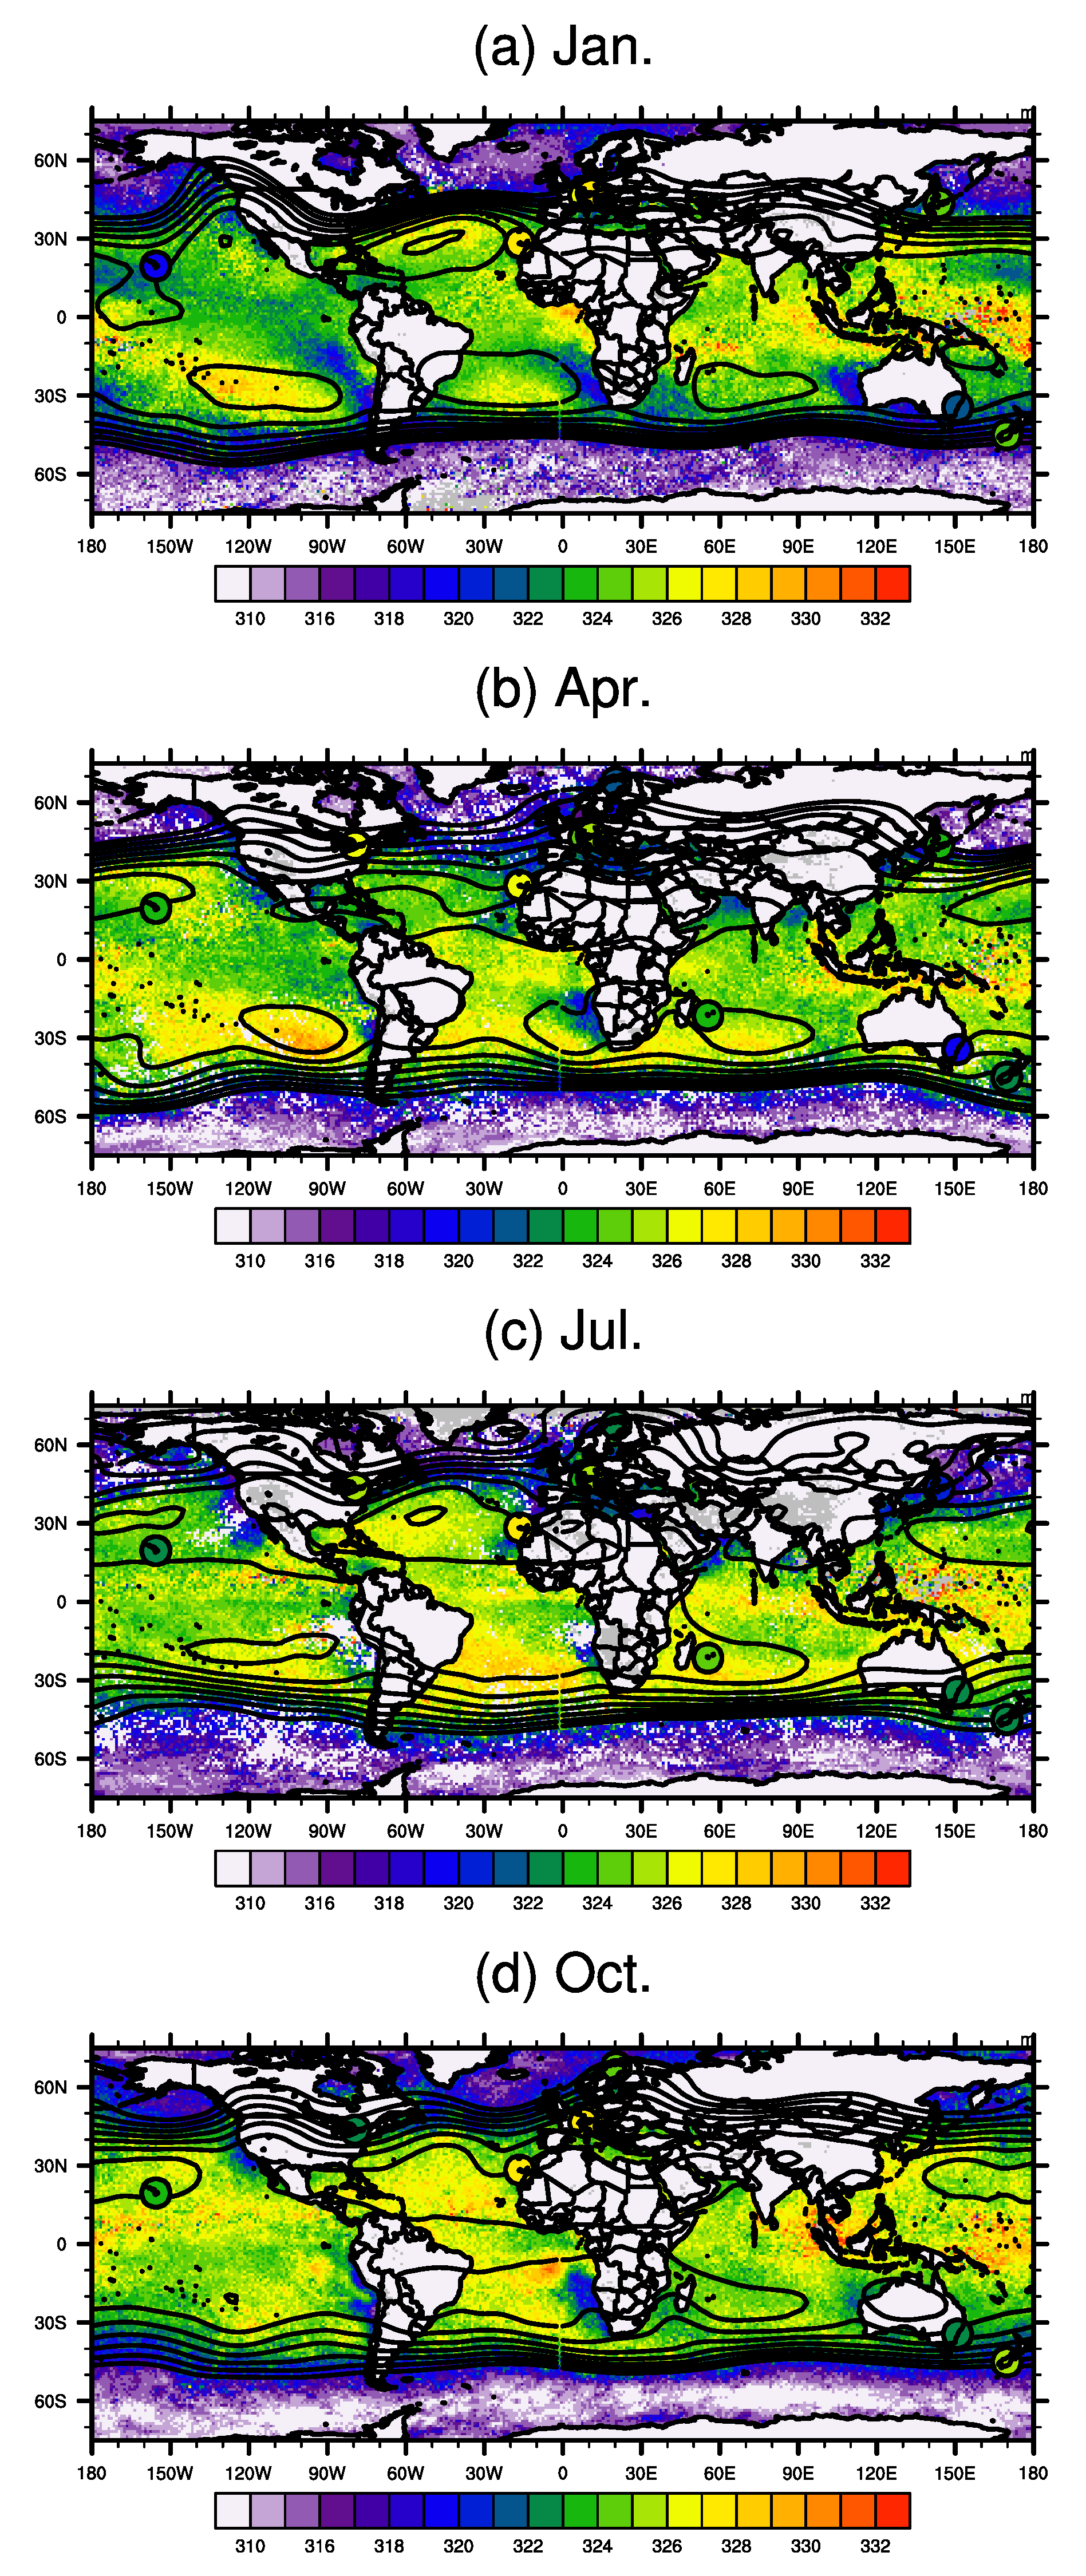
The validation results have highlighted a better SOFRID versus FTIR agreement for Sea pixels (Section 5.2.1). In particular Sea retrievals are characterized by lower biases than Land pixels (Table 4). We therefore display global MT N 2 O distributions over Sea for January, April, July and October 2014 in Figure 12. The black lines represent the 700 hPa Geopotential Heights (GH). The monthly FTIR N 2 O VMRs are displayed as filled circles at the locations of the NDACC stations.
The SOFRID N 2 O distributions display a sharp drop of ∼5 ppbv between the tropics and mid-latitudes. The dynamical barrier between tropical and mid-latitudes air masses is represented by the tightening of the 700 hPa GH isolines at sub-tropical latitudes (around 40 S and 40 N). Such a drop is probably related to the enhanced tropical emissions reported by [36]. Over the north-eastern Pacific and north Atlantic in January the enhanced N 2 O VMRs are clearly following the northwards ondulation of the GH isolines. In the SH subtropics, the GH isolines and the N 2 O gradients are also tightly related but are displaying lower seasonal and longitudinal variations than in the NH.
Such a latitudinal gradient is not clear from the FTIR data with similar or even slightly larger VMRs at NH stations than at tropical ones. The latitudinal variations appear therefore larger for SOFRID than for FTIR. From Figure 12 we can estimate a 5–8 ppbv difference between SOFRID Sea MT retrievals and FTIR ones at NH European stations. Figure 12 also display the lower biases for the Japanese Rikubetsu station as already evidenced (Table 4 and Figure 6). From comparisons at Lauder and Wollongong we estimated a 3–5 ppbv Land Sea difference for SOFRID retrievals that partly explained the SOFRID versus FTIR discrepancy at these stations (see Section 5.2.1 and Table 4). Both these differences add up to 8–13 ppbv. These figures are consistent with the the 9–17 ppbv FTIR versus SOFRID biases at NH stations with the highest sampling (Table 4 and Figure 6).
At Izana, the negative biases in April and July result from the larger seasonal variations (summer minima) detected by SOFRID relative to FTIR discussed in Section 5.2.3 (Figure 11b). It is clear from Figure 12 that Wollongong is characterized by positive biases for SOFRID Sea pixels as already highlighted in Section 5.2.3 (see Table 4) and by anticorrelated seasonal variations from FTIR and SOFRID retrievals (Figure 11o).
Within the tropical band the SOFRID N 2 O VMRs are higher by up to 4 ppbv within the subtropical anticyclones highlighted by high GH. This is most visible over the South Eastern Pacific in January and April, the Northern Atlantic in January and July and the South Western Indian Ocean in April and July. We have no clear explanations for these features but they could be related to the trapping of enriched N 2 O air masses in the closed anticyclonic circulations.

7. Conclusions

This paper documents N 2 O profiles retrieved from nighttime Metop-A/IASI data with the SOFRID and their validation with FTIR data from the NDACC. SOFRID-N 2 O profiles retrieved from the 2160–2218 cm 1 spectral window theoretically contain three independent pieces of information that roughly correspond to the lower (Surface-700 hPa), middle (700–350 hPa) and upper (350–110 hPa) troposphere. Errors in these layers are in the range 2.5–5 ppbv.
General statistics from comparisons with FTIR data indicate that SOFRID retrievals provide the highest information content in the MT. In this layer, FTIR and SOFRID variations have comparable amplitudes (3–5 ppbv) and are well correlated (0.49 < R < 0.83). The agreement is better for tropical and SH stations (0.68 < R < 0.83) than for NH stations.
SOFRID retrievals display significant negative biases (−17 to −4 ppbv) at NH continental stations. At tropical and SH mid-latitude stations, the biases are lower (−7.6 to 1.3 ppbv) and mostly not significant. The better agreement found at tropical and SH stations is due to their oceanic or coastal locations highlighting better SOFRID retrievals for sea pixels.
At each station decadal N 2 O linear trends have been computed and the seasonal variations have been extracted by substraction of the trends from the timeseries. SOFRID MT retrievals provide consistent decadal trends over the 2008–2018 period with an average of 0.99 ± 0.10 ppbv·yr 1 over the 12 NDACC stations. Considering only the 8 NDACC stations with continuous observations over 2008–2018 and SOFRID data coincident with FTIR ones, the average SOFRID MT trend is 1.05 ± 0.10 ppbv·yr 1 in very good agreement with the corresponding FTIR average (1.08 ± 0.10 ppbv·yr 1 ). SOFRID-N 2 O trends are too low in the LT and even lower in the UT highlighting lower sensititivities in these layers.
SOFRID-N 2 O MT seasonal variations are in relatively good agreement in terms of correlation (0.38 < R < 0.84) and amplitude (4–8 ppbv) with the corresponding FTIR ones at NH mid and high latitudes. These seasonal cycles display clear summer minima and winter maxima. The correlation is the highest (R > 0.80) for the stations with the most dense and complete timeseries (Jungfraujoch, Zugspitze and Toronto) highlighting the high sensitivity of IASI in the MT. In the UT, the SOFRID seasonal cycle is opposite to the MT one with summer maxima proving that independent information is provided in the two layers. This UT cycle is related to the effect of the tropopause shifting from low to high altitude from winter to summer. The FTIR UT cycle is similar but with a larger amplitude and a fall shift of the maxima resulting in a lesser agreement with SOFRID than in the MT.
The MT seasonal variability of N 2 O is weaker in the tropics but the SOFRID and FTIR data remain correlated (0.16 < R < 0.65). At SH mid-latitudes the SOFRID seasonal cycle is similar to the NH one with summer maxima. The corresponding FTIR cycles are weaker (less than 2 ppbv) and anticorrelated with SOFRID. It is noteworthy that the LT SOFRID seasonal cycle, similar to the MT one, is higly correlated (R = 0.79) with the corresponding FTIR one at the Lauder station. The global distributions of MT SOFRID-N 2 O display enhanced mixing ratios in the tropical and sub-tropical band (40 N–40 S) with the highest VMRs within the subtropical highs. The SOFRID MT 6–8 ppbv latitudinal gradient between the tropics and the mid-latitudes is not detected by the sparse FTIR data. The addition of this gradient with an estimation of the Land-Sea differences roughly comes up to the large biases between SOFRID and FTIR at NH stations.
Our future activity will focus on investigating the reason for the Land versus Sea and night versus day SOFRID differences to improve the Land and day retrievals. In both cases, a possible candidate for these dicrepancies is surface emissivity. We will therefore implement the latest version of RTTOV in SOFRID to allow the retrieval of land emissivity simultaneously with trace gases profiles and surface temperature.

Author Contributions

Conceptualization, B.B.; methodology, B.B., S.F. and Y.G.; software, B.B. and E.L.F.; validation, B.B. and Y.G.; formal analysis, B.B., Y.G. and S.F.; investigation, B.B., Y.G. and S.F.; resources, B.B.; data curation, E.L.F.; writing—original draft preparation, B.B. and S.F.; writing—review and editing, B.B. and S.F.; visualization, B.B.; supervision, B.B.; project administration, B.B.; funding acquisition, B.B. and S.F. All authors have read and agreed to the published version of the manuscript.

Funding

This research was funded by the french national space agency CNES (TOSCA-IASI project). Yvan Gouzenes Master thesis was funded by a grant from the Greenhouse Gases axis of the Observatoire Midi-Pyrénées OMP.

Data Availability Statement

The SOFRID-N 2 O data are currently available upon request to Brice Barret. They will soon be available at the IASI-SOFRID website (http://thredds.sedoo.fr/iasi-sofrid-o3-co/ (accessed on 24 March 2020)).

Acknowledgments

The FTIR data used in this publication were obtained from J. W. Hannigan (Mauna-Loa), E. Mahieu (Jungfraujoch), D. Smale (Lauder), K. Strong (Toronto), R. Sussmann (Zugspitze), J. Notholt (Bremen), T. Blumenstock (Kiruna), T. Nagahama (Rikubetsu), M. Schneider (Izana), N. Jones (Wollongong), M. Grutter (Altzomoni) and M. De Mazieres (Maido) as part of the Network for the Detection of Atmospheric Composition Change (NDACC) and are available through the NDACC website (www.ndacc.org (accessed on 5 March 2020)). This work has benefited from the support of the research infrastructure ACTRIS-FR, registered on the Roadmap of the French Ministry of Research. NOAA-ESRL N 2 O surface measurements were obtained from their website (https://www.esrl.noaa.gov/ (accessed on 10 March 2020)). IASI L1c data have been downloaded from the AERIS atmospheric database (https://www.aeris-data.fr/ (accessed on 15 March 2020)). Finally, we thank Axelle Aubert who performed the first analysis of SOFRID-N 2 O data during a summer training period.

Conflicts of Interest

The authors declare no conflict of interest.

Abbreviations

The following abbreviations are used in this manuscript:
FTIRFourier Transform Infrared
GHGeopotential Height
GOSATGreenhouse Gases Observing Satellite
IASIInfrared Atmospheric Sounding Interferometer
ESRLEarth System Research Laboratories
MTMiddle Troposphere
NDACCNetwork for the Detection of Atmospheric Composition Change
NOAANational Oceanic and Atmospheric Administration
NHNorthern Hemisphere
LTLower Tropopsphere
OEMOptimal Estimation Method
RMSDRoot Mean Square Deviation
SCIAMACHYSCanning Imaging Absorption spectroMeter for Atmospheric CartograpHY
SHSouthern Hemisphere
SOFRIDSoftware for the Retrieval of IASI Data
UTUpper Troposphere
VMRVolume Mixing Ratio

References

  1. Myhre, G.; Shindell, D.; Breon, F.M.; Collins, W.; Fuglestvedt, J.; Huang, J.; Koch, D.; Lamarque, J.F.; Lee, D.; Mendoza, B.; et al. Anthropogenic and Natural Radiative Forcing. In Climate Change 2013: The Physical Science Basis. Contribution of Working Group I to the Fifth Assessment Report of the Intergovernmental Panel on Climate Change; Cambridge University Press: Cambridge, UK; New York, NY, USA, 2013. [Google Scholar]
  2. Forster, P.; Ramaswamy, V.; Artaxo, P.; Berntsen, T.; Betts, R.; Fahey, D.; Haywood, J.; Lean, J.; Lowe, D.; Myhre, G.; et al. Changes in Atmospheric Constituents and in Radiative Forcing. In Climate Change 2007: The Physical Science Basis. Contribution of Working Group I to the Fourth Assessment Report of the IPCC; Cambridge University Press: Cambridge, UK; New York, NY, USA, 2008. [Google Scholar]
  3. Prather, M.J.; Hsu, J.; DeLuca, N.M.; Jackman, C.H.; Oman, L.D.; Douglass, A.R.; Fleming, E.L.; Strahan, S.E.; Steenrod, S.D.; Søvde, O.A.; et al. Measuring and modeling the lifetime of Nitrous Oxide including its variability, the tropopause: Satellite observations and model simulations. J. Geophys. Res. Atmos. 2015, 120, 5693–5705. [Google Scholar] [CrossRef] [PubMed]
  4. Davidson, E.; Kanter, D. Daily ozone vertical profile model built on geophysical grounds, for column retrieval from atmospheric high-resolution infrared spectra. Environ. Res. Lett. 2014, 9, 105012. [Google Scholar] [CrossRef]
  5. Butterbach-Bahl, K.; Baggs, E.M.; Dannenmann, M.; Kiese, R.; Zechmeister-Boltenstern, S. Nitrous Oxide emissions from soils: How well do we understand the processes and their controls? Phil. Trans. R. Soc. B 2013, 368, 20130122. [Google Scholar] [CrossRef]
  6. Davidson, E.; Kanter, D. The contribution of manure and fertilizer nitrogen to atmospheric Nitrous Oxide since 1860. Nat. Geosci. 2009, 2, 659–662. [Google Scholar] [CrossRef]
  7. Tian, H.; Chen, G.; Lu, C.; Xu, X.; Ren, W.; Zhang, B.; Banger, K.; Tao, B.; Pan, S.; Liu, M.; et al. Global methane and Nitrous Oxide emissions from terrestrial ecosystems due to multiple environmental changes. Ecosyst. Health Sustain. 2015, 1, 4. [Google Scholar] [CrossRef] [Green Version]
  8. Tian, H.; Xu, R.; Canadell, J.E.A. A comprehensive quantification of global Nitrous Oxide sources and sinks. Nature 2020, 586, 248–256. [Google Scholar] [CrossRef]
  9. Ciais, P.; Sabine, C.; Bala, G.; Bopp, L.; Brovkin, V.; Canadell, J.; Chhabra, A.; DeFries, R.; Galloway, J.; Heimann, M.; et al. Carbon and Other Biogeochemical Cycles. In Climate Change 2013: The Physical Science Basis. Contribution of Working Group I to the Fifth Assessment Report of the Intergovernmental Panel on Climate Change; Cambridge University Press: Cambridge, UK; New York, NY, USA, 2013. [Google Scholar]
  10. Wells, K.C.; Millet, D.B.; Bousserez, N.; Henze, D.K.; Griffis, T.J.; Chaliyakunnel, S.; Dlugokencky, E.J.; Saikawa, E.; Xiang, G.; Prinn, R.G.; et al. Top-down constraints on global N2O emissions at optimal resolution: Application of a new dimension reduction technique. Atmos. Chem. Phys. 2018, 18, 735–756. [Google Scholar] [CrossRef] [Green Version]
  11. Haszpra, L.; Barcza, Z.; Hidy, D.; Szilagyi, I.; Dlugokencky, E.; Tans, R. Trends and temporal variations of major greenhouse gases at a rural site in Central Europe. Atmos. Environ. 2008, 42, 8707–8716. [Google Scholar] [CrossRef]
  12. Angelbratt, J.; Mellqvist, J.; Blumenstock, T.; Borsdorff, T.; Brohede, S.; Duchatelet, P.; Forster, F.; Hase, F.; Mahieu, E.; Murtagh, D.; et al. A new method to detect long term trends of methane (CH4) and nitrous oxide (N2O) total columns measured within the NDACC ground-based high resolution solar FTIR network. Atmos. Chem. Phys. 2011, 63, 6167–6183. [Google Scholar] [CrossRef] [Green Version]
  13. Bergamaschi, P.; Frankenberg, C.; Meirink, J.; Krol, M.; Villani, M.; Houweling, S.; Dentener, F.; Dlugokencky, E.; Miller, J.; Gatti, L.; et al. Inverse modeling of global and regional CH4 emissions using SCIAMACHY satellite retrievals. J. Geophys. Res. Atmos. 2007, 114. [Google Scholar] [CrossRef] [Green Version]
  14. Turner, A.; Jacob, D.; Wecht, K.; Maasakkers, J.; Lundgren, E.; Andrews, A.; Biraud, S.; Boesch, H.; Bowman, K.; Deutscher, N.; et al. Estimating global and North American methane emissions with high spatial resolution using GOSAT satellite data. Atmos. Chem. Phys. 2015, 15, 7049–7069. [Google Scholar] [CrossRef] [Green Version]
  15. Bergamaschi, P.; Corazza, M.; Karstens, U.; Athanassiadou, M.; Thompson, R.L.; Pison, I.; Manning, A.J.; Bousquet, P.; Segers, A.; Vermeulen, A.T.; et al. Top-down estimates of European CH4 and N2O emissions based on four different inverse models. Atmos. Chem. Phys. 2015, 15, 715–736. [Google Scholar] [CrossRef] [Green Version]
  16. Chedin, A.; Hollingsworth, A.; Scott, N.A.; Serrar, S.; Crevoisier, C.; Armante, R. Annual and seasonal variations of atmospheric CO2, N2O and CO concentrations retrieved from NOAA/TOVS satellite observations. Geophys. Res. Lett. 2002, 29, 110-1–110-4. [Google Scholar] [CrossRef]
  17. Ricaud, P.; Attie, J.L.; Teyssedre, H.; Amraoui, V.L.; Peuch, V.H.; Matricardi, M.; Schluessel, P. Equatorial total column of Nitrous Oxide as measured by IASI on MetOp-A: Implications for transport processes. Atmos. Chem. Phys. 2009, 9, 3947–3956. [Google Scholar] [CrossRef] [Green Version]
  18. García, O.E.; Sepúlveda, E.; Schneider, M.; Hase, F.; August, T.; Blumenstock, T.; Kühl, S.; Munro, R.; Gómez-Peláez, Á.J.; Hultberg, T.; et al. Consistency and quality assessment of the Metop-A/IASI and Metop-B/IASI operational trace gas products (O3, CO, N2O, CH4, and CO2) in the subtropical North Atlantic. Atmos. Meas. Tech. 2016, 9, 2315–2333. [Google Scholar] [CrossRef] [Green Version]
  19. August, T.; Klaes, D.; Schlüssel, P.; Hultberg, T.; Crapeau, M.; Arriaga, A.; O’Carroll, A.; Coppens, D.; Munro, R.; Calbet, X. IASI on Metop-A: Operational Level 2 retrievals after five years in orbit. J. Quant. Spectrosc. Radiat. Transf. 2012, 113, 1340–1371. [Google Scholar] [CrossRef]
  20. García, O.E.; Schneider, M.; Ertl, B.; Sepúlveda, E.; Borger, C.; Diekmann, C.; Wiegele, A.; Hase, F.; Barthlott, S.; Blumenstock, T.; et al. The MUSICA IASI CH4 and N2O products and their comparison to HIPPO, GAW and NDACC FTIR references. Atmos. Meas. Tech. 2018, 11, 4171–4215. [Google Scholar] [CrossRef] [Green Version]
  21. Wofsy, S. HIAPER Pole-to-Pole Observations (HIPPO): Fine-grained, global-scale measurements of climatically important atmospheric gases and aerosols. Phil. Trans. R. Soc. A 2011, 369. [Google Scholar] [CrossRef]
  22. De Wachter, E.; Barret, B.; Le Flochmoen, E.; Pavelin, E.; Matricardi, M.; Clerbaux, C.; Hadji-Lazaro, J.; George, M.; Hurtmans, D.; Coheur, P.F.; et al. Retrieval of MetOp-A/IASI CO profiles and validation with MOZAIC data. Atmos. Meas. Tech. 2012, 5, 2843–2857. [Google Scholar] [CrossRef] [Green Version]
  23. Barret, B.; Le Flochmoen, E.; Sauvage, B.; Pavelin, E.; Matricardi, M.; Cammas, J.P. The detection of post-monsoon tropospheric ozone variability over south Asia using IASI data. Atmos. Chem. Phys. 2011, 11, 9533–9548. [Google Scholar] [CrossRef] [Green Version]
  24. Van Damme, M.; Erisman, J.W.; Clarisse, L.; Dammers, E.; Whitburn, S.; Clerbaux, C.; Dolman, A.J.; Coheur, P.F. Worldwide spatiotemporal atmospheric ammonia (NH3) columns variability revealed by satellite. Geophys. Res. Lett. 2015, 42, 8660–8668. [Google Scholar] [CrossRef] [Green Version]
  25. Saunders, R.; Matricardi, M.; Brunel, P. An improved fast radiative transfer model for assimilation of satellite radiance observations. Q. J. R. Meteorol. Soc. 1999, 125, 1407–1425. [Google Scholar] [CrossRef]
  26. Pavelin, E.; English, S.; Eyre, J. The assimilation of cloud-affected infrared satellite radiances for numerical weather prediction. Q. J. R. Meteorol. Soc. 2008, 134, 737–749. [Google Scholar] [CrossRef]
  27. Matricardi, M.; Chevallier, F.; Kelly, G.; Thepaut, J.N. An improved general fast radiative transfer model for the assimilation of radiance observations. Q. J. R. Meteorol. Soc. 2004, 130, 153–173. [Google Scholar] [CrossRef]
  28. Matricardi, M. Technical Note: An assessment of the accuracy of the RTTOV fast radiative transfer model using IASI data. Atmos. Chem. Phys. 2009, 9, 6899–6913. [Google Scholar] [CrossRef] [Green Version]
  29. Clough, S.; Shephard, M.; Mlawer, E.; Delamere, J.; Iacono, M.; Cady-Pereira, K.; Boukabara, S.; Brown, P. Atmospheric radiative transfer modeling: A summary of the AER codes. J. Quant. Spectrosc. Radiat. Transf. 2005, 91, 233–244. [Google Scholar] [CrossRef]
  30. Rothman, L.S.; Jacquemart, D.; Barbe, A.E.A. The HITRAN 2004 molecular spectroscopic database. J. Quant. Spectrosc. Radiat. Transf. 2005, 96, 139–204. [Google Scholar] [CrossRef] [Green Version]
  31. Borbas, E.; Ruston, B. The RTTOV UWiremis IR land surface emissivity module. In AS Mission Report NWPSAF-MO-VS-042, EUMETSAT Numerical Weather Prediction Satellite Applications Facility; Met Office: Exeter, UK, 2010. [Google Scholar]
  32. Seemann, S.W.; Borbas, E.E.; Knuteson, R.O.; Stephenson, G.R.; Huang, H.L. Development of a Global Infrared Land Surface Emissivity Database for Application to Clear Sky Sounding Retrievals from Multi-spectral Satellite Radiance Measurements. J. Appl. Meteor. Climatol. 2008, 47, 108–123. [Google Scholar] [CrossRef]
  33. Rodgers, C.D. Inverse Methods for Atmospheric Sounding: Theory and Practice, Series on Atmospheric, Oceanic and Planetary Physics; World Scientific: Singapore; Hackensack, NJ, USA; London, UK; Hong Kong, China, 2000; Volume 2, p. 238. [Google Scholar]
  34. Clerbaux, C.; Boynard, A.; Clarisse, L.; George, M.; Hadji-Lazaro, J.; Herbin, H.; Hurtmans, D.; Pommier, M.; Razavi, A.; Turquety, S.; et al. Monitoring of atmospheric composition using the thermal infrared IASI/MetOp sounder. Atmos. Chem. Phys. 2009, 9, 6041–6054. [Google Scholar] [CrossRef] [Green Version]
  35. Hilton, F.; Armante, R.; August, T.; Barnet, C.; Bouchard, A.; Camy-Peyret, C.; Capelle, V.; Clarisse, L.; Clerbaux, C.; Coheur, P.F.; et al. Hyperspectral earth observation from iasi five years of accomplishments. Bull. Am. Meteorol. Soc. 2012, 93, 347–370. [Google Scholar] [CrossRef]
  36. Kort, E.A.; Patra, P.K.; Ishijima, K.; Daube, B.C.; Jimenez, R.; Elkins, J.; Hurst, D.; Moore, F.L.; Sweeney, C.; Wofsy, S.C. Tropospheric distribution and variability of N2O: Evidence for strong tropical emissions. Geophys. Res. Lett. 2011, 38. [Google Scholar] [CrossRef] [Green Version]
  37. Nevison, C.D.; Dlugokencky, E.; Dutton, G.; Elkins, J.W.; Fraser, P.; Hall, B.; Krummel, P.B.; Langenfelds, R.L.; O’Doherty, S.; Prinn, R.G.; et al. Exploring causes of interannual variability in the seasonal cycles of tropospheric Nitrous Oxide. Atmos. Chem. Phys. 2011, 11, 3713–3730. [Google Scholar] [CrossRef] [Green Version]
  38. Havemann, S. NWPSAF 1D-Var User Manual Software Version 1.2. In AS Mission Report NWPSAF-MO-UD-032, EUMETSAT Numerical Weather Prediction Satellite Applications Facility; Met Office: Exeter, UK, 2020. [Google Scholar]
  39. Zhou, M.; Langerock, B.; Vigouroux, C.; Sha, M.K.; Hermans, C.; Metzger, J.M.; Chen, H.; Ramonet, M.; Kivi, R.; Heikkinen, P.; et al. TCCON and NDACC XCO measurements: Difference, discussion and application. Atmos. Meas. Tech. 2019, 12, 5979–5995. [Google Scholar] [CrossRef] [Green Version]
  40. Barret, B.; Turquety, S.; Hurtmans, D.; Clerbaux, C.; Hadji-Lazaro, J.; Bey, I.; Auvray, M.; Coheur, P. Global carbon monoxide vertical distributions from spaceborne high-resolution FTIR nadir measurements. Atmos. Chem. Phys. 2005, 5, 2901–2914. [Google Scholar] [CrossRef] [Green Version]
  41. Coheur, P.; Barret, B.; Turquety, S.; Hurtmans, D.; Hadji-Lazaro, J.; Clerbaux, C. Retrieval and characterization of ozone vertical profiles from a thermal infrared nadir sounder. J. Geophys. Res. 2005, 110. [Google Scholar] [CrossRef] [Green Version]
  42. Boynard, A.; Clerbaux, C.; Coheur, P.F.; Hurtmans, D.; Turquety, S.; George, M.; Hadji-Lazaro, J.; Keim, C.; Meyer-Arnek, J. Measurements of total and tropospheric ozone from IASI: Comparison with correlative satellite, ground-based and ozonesonde observations. Atmos. Chem. Phys. 2009, 9, 6255–6271. [Google Scholar] [CrossRef] [Green Version]
  43. Xiong, X.; Maddy, E.; Barnet, C.; Gambacorta, A.; Patra, P.; Sun, F.; Goldberg, M. Retrieval of Nitrous Oxide from Atmospheric Infrared Sounder: Characterization and validation. J. Geophys. Res. Atmos. 2014, 119, 9107–9122. [Google Scholar] [CrossRef]
  44. Taylor, K.E. Summarizing multiple aspects of model performance in a single diagram. J. Geophys. Res.-Atmos. 2001, 106, 7183–7192. [Google Scholar] [CrossRef]
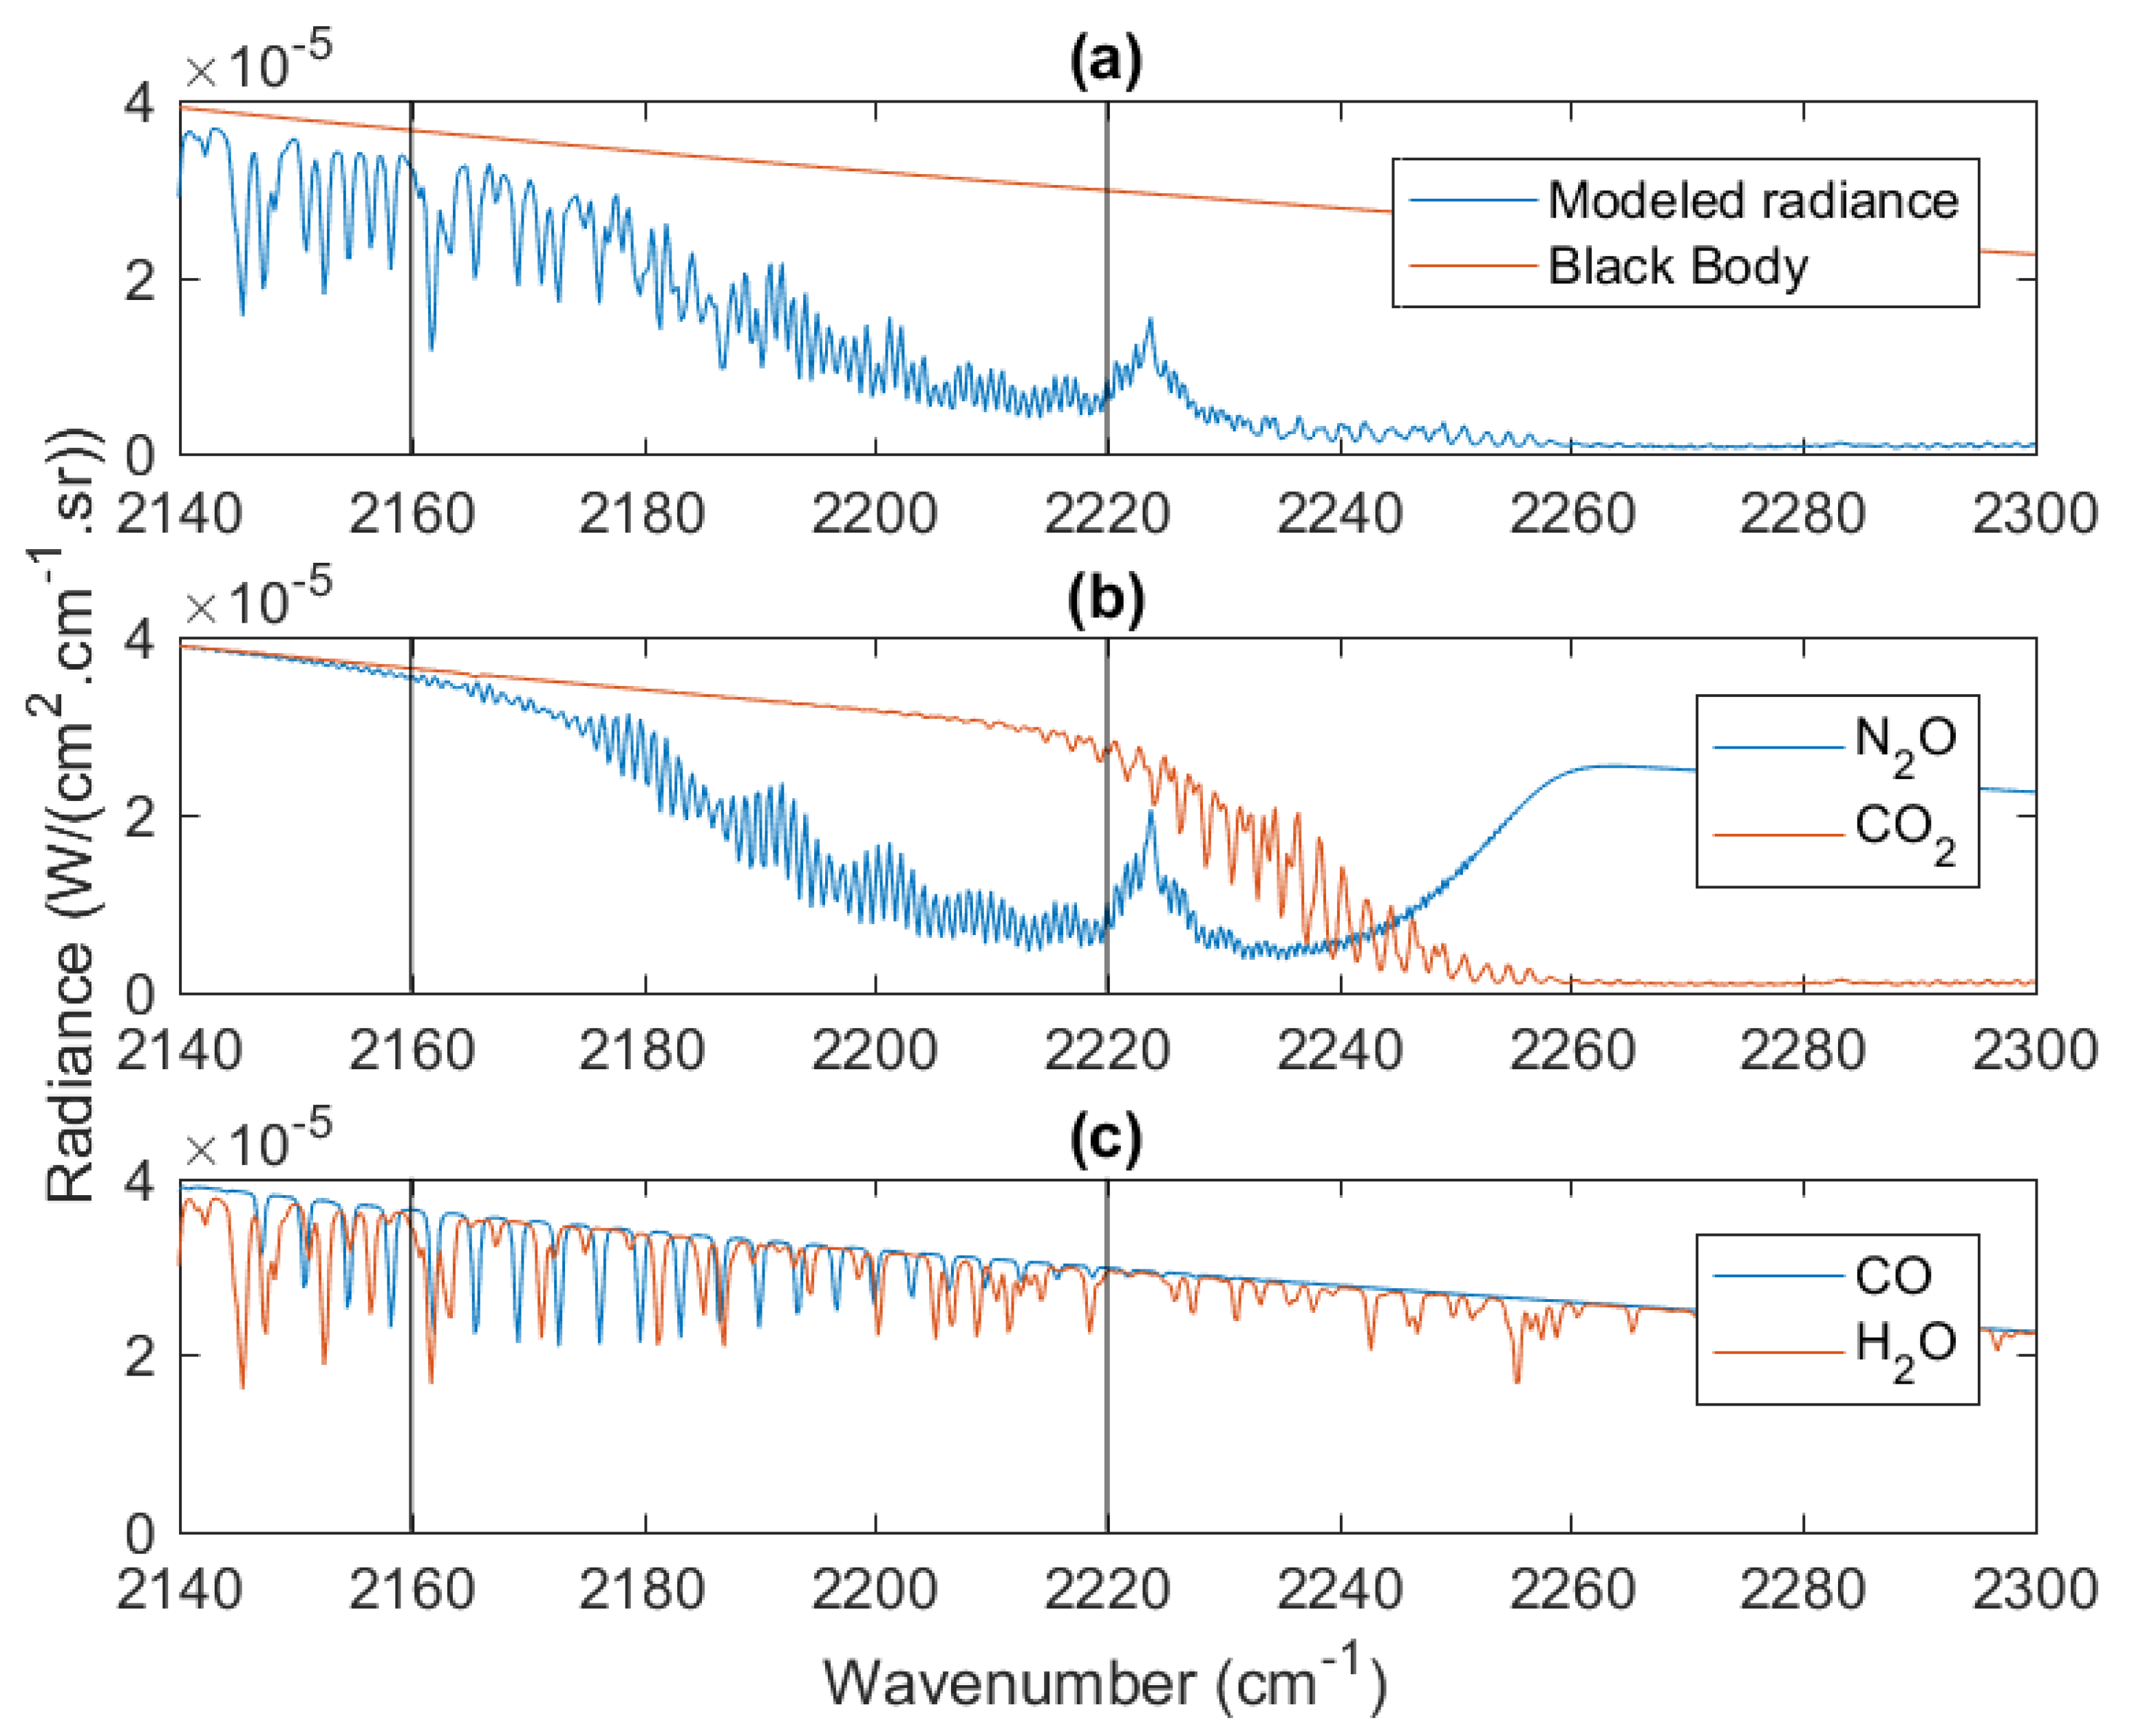
Figure 1. (a) simulated IASI radiance for the 2140–2300 cm 1 spectral range, (b) contributions of N 2 O and CO 2 and (c) contributions of CO and H 2 O.The spectral window selected for the N 2 O profile retrieval (2160–2220 cm 1 ) is indicated with the vertical lines.
Atmosphere 12 00219 g001
Figure 2. Example of spectral fits in the N 2 O window: (a) observed (IASI) and fitted radiances for Izana and Lauder in July, (b) observed minus fitted radiances (residuals). The dashed horizontal lines indicate the noise level from Hilton et al. [35].
Atmosphere 12 00219 g002
Figure 3. N 2 O averaging kernels for (a) IASI in Wollongong in July (b) NDACC in Wollongong in July (c) IASI in Izana in January (d) NDACC in Izana in January. Total Column (Tot), Lower Troposphere (LT, 1013–700 hPa), Middle Troposphere (MT, 700–350 hPa), Upper Troposphere (UT, 350–110 hPa) and Stratosphere (Strat., 100–10 hPa).
Atmosphere 12 00219 g003
Figure 4. Flow chart of the validation methodology.
Atmosphere 12 00219 g004
Figure 5. Taylor diagrams for the SOFRID versus FTIR monthly N 2 O VMRs comparison for the LT (green diamonds), MT (blue circles) and UT (red stars) at the 12 NDACC stations (Table 1).
Atmosphere 12 00219 g005
Figure 6. Biases between SOFRID and FTIR monthly MT N 2 O VMRs at the 12 NDACC stations averaged over the 2008–2018 period. The orange and lightblue bars represent the corresponding Root Mean Squares of the Differences.
Atmosphere 12 00219 g006
Figure 7. Time series of SOFRID (blue lines for data coincident with NDACC-FTIR data and green lines for all data) and NDACC-FTIR (black lines and squares) N 2 O MT VMR at 6 NDACC stations in the Northern Hemisphere (Kiruna, Bremen, Zugspitze, Jungfraujoch, Toronto, Rikubetsu). The NOAA-ESRL surface data from regional stations are also displayed. The solid lines represent the monthly means and the dashed lines the fit of a linear trend.
Atmosphere 12 00219 g007
Figure 8. Same as Figure 7 at 6 NDACC stations for tropical and SH latitudes (Izana, Altzomoni, Mauna Loa, Maido, Wollongong, Lauder).
Atmosphere 12 00219 g008
Figure 9. Decadal trends from SOFRID and FTIR monthly N 2 O VMRs in the (a) LT (b) MT and (c) UT for the 12 NDACC stations (Table 1). The stations are identified by the three first letters of their names on the x-axis. Trends from surface measurements at coincident NOAA-ESRL stations (Table 5) are also displayed for comparisons.
Atmosphere 12 00219 g009
Figure 10. Seasonal cycles obtained from detrended FTIR (red) and SOFRID (blue) data at the 6 NH stations. The colored area represent the inter-annual variabilities for FTIR (light red) and SOFRID (light blue). There are no data for Jungfraujoch in the LT (missing panel l) because of the high altitude of the station.
Atmosphere 12 00219 g010
Figure 11. Same as Figure 10 at the 6 tropical and SH stations. There are no data for Altzomoni in the LT (missing panel f) because of the high altitude of the station.
Atmosphere 12 00219 g011
Figure 12. Global distributions of nighttime SOFRID MT N 2 O over Sea for (a) January, (b) April, (c) July and (d) October 2014. The black lines represent the 700 hPa geopotential heights between 2920 m and 3260 m every 40 m. Filled circles at the locations of the 12 NDACC stations correspond to the monthly mean FTIR MT N 2 O VMRs.
Atmosphere 12 00219 g012
Table 1. List of NDACC stations with N 2 O measurements during the IASI period (2008–2018). Stations with names in bold face correspond to stations with continuous measurements during the 2008–2018 period.
StationLatitudeLongitudeAltitude (m)No DataMonths with Data
Kiruna67.8420.4043 96
Bremen53.108.8546 51
Zugspitze47.4210.982950 130
Jungfraujoch46.557.983580 126
Toronto43.66−79.40174 89
Rikubetsu43.46143.77572011–201354
Izana28.30−16.482370 117
Mauna-Loa19.54−155.573400 95
Altzomoni19.1298.6639852008–201264
Maido−21.555.421552008–201360
Wollongong−34.41150.8830 121
Lauder−45.04169.6837 118
Table 2. Characterization of IASI N 2 O retrieved columns: Degrees of Freedom for Signal (DFS) and retrieval errors (between brackets). LT stands for Lower Troposphere (Surf.–700 hPa), MT for Middle Troposphere (700–350 hPa) and UT for Upper Troposphere (350–110 hPa).
StationJanuaryAprilJulyOctober
Izana LT0.5 (4.7)1.2 (4.4)0.8 (5.1)0.5 (4.8)
Izana MT1.1 (2.6)1.2 (2.4)1.2 (2.4)1.1 (2.5)
Izana UT0.8 (3.2)0.8 (3.1)0.9 (2.9)0.9 (2.6)
Wollongong LT0.8 (4.8)0.8 (4.5)0.7 (4.3)1.0 (4.8)
Wollongong MT1.1 (2.7)1.2 (2.6)1.1 (2.6)1.1 (2.7)
Wollongong UT0.8 (3.0)0.9 (3.1)0.7 (3.6)0.9 (2.9)
Table 3. Same as Table 2 for NDACC-FTIR N 2 O retrievals.
StationJanuaryAprilJulyOctober
Izana LT0.3 (6.1)0.3 (6.8)0.2 (7.5)0.3 (7.0)
Izana MT0.8 (2.1)0.8 (2.7)0.8 (2.9)0.8 (2.5)
Izana UT0.7 (2.8)0.6 (3.1)0.6 (3.2)0.7 (2.8)
Wollongong LT0.6 (3.5)0.6 (3.7)0.7 (3.9)0.7 (4.2)
Wollongong MT0.6 (2.0)0.7 (2.2)0.8 (3.2)0.8 (2.5)
Wollongong UT0.8 (2.9)0.8 (2.9)0.9 (4.3)0.9 (3.1)
Table 4. Statistics of FTIR versus SOFRID N 2 O comparisons in the MT (700–350 hPa).
StationBias (ppbv)RMSD (ppbv)RRMS IASIRMS FTIR
Kiruna−13.93.90.604.83.3
Bremen−3.63.50.633.54.3
Zugspitze−13.64.10.615.13.9
Jungfraujoch−16.84.00.604.93.9
Toronto−9.23.40.724.64.6
Rikubetsu−4.94.20.574.44.7
Izana−4.12.60.804.43.4
Altzomoni−3.44.00.494.52.4
Mauna-Loa0.72.20.793.23.4
Maido1.11.40.772.02.1
Wollongong1.32.40.834.33.6
Wollongong Sea4.22.60.764.03.6
Lauder−7.63.20.684.13.6
Lauder Sea−2.32.80.744.13.6
Table 5. List of NOAA/ESRL stations with N 2 O measurements during the IASI period (2008–2018) near to NDACC stations.
NOAA/ESRL StationLatitudeLongitudeElevation (m)NDACC Station
Pallas-Salmantunturi67.9724.11565Kiruna
Ochsenkopf50.0311.811022Bremen
Hoenpeissenberg47.8011.02936Jungfraujoch and Zugspitze
Izana28.31−16.502373Izana
Mauna-Loa19.53155.583397Mauna-Loa
Mahe Island−4.6855.532Maido
Cape Grimm−40.68144.6994Wollongong
Baring Head−41.41174.8785Lauder
Table 6. Mid-Tropospheric N 2 O trends for SOFRID, FTIR and NOAA/ESRL data (ppbv/year). The average trend for the 8 stations with continuous 2008–2018 FTIR observations (Table 1) is given in boldface in the last line.
StationSOFRID All DataSOFRID Coincident DataFTIRNOAA/ESRL
Kiruna0.84 ± 0.080.99 ± 0.120.88 ± 0.060.94 ± 0.01
Bremen1.01 ± 0.061.03 ± 0.121.03 ± 0.140.92 ± 0.01
Zugspitze0.86 ± 0.090.92 ± 0.121.16 ± 0.040.97 ± 0.01
Jungfraujoch0.89 ± 0.070.92 ± 0.111.07 ± 0.060.97 ± 0.01
Toronto0.99 ± 0.071.08 ± 0.091.21 ± 0.12
Rikubetsu0.87 ± 0.070.77 ± 0.121.11 ± 0.12
Izana1.06 ± 0.061.11 ± 0.081.00 ± 0.030.96 ± 0.01
Altzomoni1.13 ± 0.101.00 ± 0.291.04 ± 0.11
Mauna-Loa1.04 ± 0.031.09 ± 0.051.06 ± 0.070.94 ± 0.01
Maido1.04 ± 0.030.95 ± 0.091.14 ± 0.060.95 ± 0.01
Wollongong1.11 ± 0.051.22 ± 0.061.10 ± 0.030.96 ± 0.01
Lauder1.04 ± 0.061.11 ± 0.081.14 ± 0.040.90 ± 0.01
Average0.99 ± 0.101.01 ± 0.121.09 ± 0.110.95 ± 0.02
0.98 ± 0.101.05 ± 0.101.08 ± 0.10
Publisher’s Note: MDPI stays neutral with regard to jurisdictional claims in published maps and institutional affiliations.