Abstract
Aqueous secondary organic aerosol (aqSOA) formation from volatile and semivolatile organic compounds at the air–liquid interface is considered as an important source of fine particles in the atmosphere. However, due to the lack of in situ detecting techniques, the detailed interfacial reaction mechanism and dynamics still remain uncertain. In this study, synchrotron-based vacuum ultraviolet single-photon ionization mass spectrometry (VUV SPI-MS) was coupled with the System for Analysis at the Liquid Vacuum Interface (SALVI) to investigate glyoxal dark oxidation products at the aqueous surface. Mass spectral analysis and determination of appearance energies (AEs) suggest that the main products of glyoxal dark interfacial aging are carboxylic acid related oligomers. Furthermore, the VUV SPI-MS results were compared and validated against those of in situ liquid time-of-flight secondary ion mass spectrometry (ToF-SIMS). The reaction mechanisms of the dark glyoxal interfacial oxidation, obtained using two different approaches, indicate that differences in ionization and instrument operation principles could contribute to their abilities to detect different oligomers. Therefore, the mechanistic differences revealed between the VUV SPI-MS and ToF-SIMS indicate that more in situ and real-time techniques are needed to investigate the contribution of the air–liquid interfacial reactions leading to aqSOA formation.
1. Introduction
Glyoxal is the smallest dicarbonyl in the Earth’s atmosphere. The origin of glyoxal can be either from biogenic volatile organic compounds (VOC) oxidation or anthropogenic emission [1]. Additionally, glyoxal forms via the chemical degradation of VOCs initiated by hydroxyl radicals [2]. Thus, it is deemed as an indicator of the VOC oxidation and secondary aerosol formation in the troposphere [3,4]. There are still significant uncertainties due to the lack of understanding of the underpinning chemistry that leads to the formation of secondary organic aerosols (SOAs) and their impacts on radiative forcing [5]. SOA is deemed important in haze episodes, climate change, and human health [6]. Particularly as a component of airborne particulate matter, SOA can enter the lung and cause damage to the respiratory system via inflammatory response [7]. SOA formed in aqueous phase (e.g., cloud and fog water, aqueous aerosols, etc.) is termed aqueous SOA or aqSOA. The aqSOA is an important source of the global SOA budget [8,9]. Oxidation of volatile and semivolatile organic compounds (VOCs and SVOCs) occurring at the air–liquid (a–l) interface is confirmed as an important pathway of aqSOA formation [10,11]. The processes at the a–l interface are critical in SOA formation, acting as a means of reactive uptake on aerosols and facilitating new particle growth [9]. However, due to the lack of in situ techniques to probe products at the a–l surface, large uncertainties still remain concerning SOA formation [12].
Synchrotron-based single-photon ionization mass spectrometry using vacuum ultraviolet photons (VUV SPI-MS) is a powerful technique to investigate complex chemical systems [13,14]. Compared with other traditional ionization methods, such as charged particles or electron impact, VUV SPI-MS is an efficient and softer method, thus it can provide dynamic information by the determination of ionization energies (IEs). IEs reflect the electronic structure of a molecule [15]. AEs acquired from photoionization efficiency (PIE) curves could help us determine the chemical composition by comparison with known IEs and their molecule weight in the mass spectrum. SPI-MS was shown to be a viable technique to study aerosols [16]. However, studying reactions and associated products at the a–l interface is challenging, because such measurements must be performed under high vacuum. Since liquids would volatize in vacuum, VUV SPI-MS traditionally has been limited to the analysis of gases and gas–solid interfaces.
To enable chemical analysis of the liquid–vacuum interface and use that to approximate the a–l interface, we developed a vacuum applicable microfluidic reactor, namely, the System for Analysis at the Liquid Vacuum Interface (SALVI) [17,18]. Recent work has shown that combining SALVI with VUV SPI-MS makes it possible to probe the aqueous surface reaction products in high vacuum and provides unique insights into the a–l reaction mechanisms [19,20]. In the atmosphere, glyoxal molecules can go through hydration then follow with oxidation to form glyoxylic acid, formic acid, and oxalic acid. Those preliminary products could form oligomers via hydrogen bonding or oligomerization in the aqueous phase, which leads to a considerable aqSOA budget [21,22,23]. Furthermore, the evolution of glyoxal dark reaction is another contributing factor to oligomer formation [23,24]. Thus, we present the investigation of glyoxal and H2O2 dark aging reactions at the a–l interface using the approach recently demonstrated and validated using SALVI in VUV SPI-MS in this study [19,25]. Key products and reactants were identified by mass spectral analyses, and appearance energies (AEs) of the volatile and semivolatile products as a result of dark aging were determined. Products from dark and UV aging of glyoxal and hydrogen peroxide at the aqueous surface were also compared based on our recent results [25]. The comparison results suggest that dark interfacial aging of glyoxal has different pathways from UV aging; the main products are carboxylic acid related oligomers. The VUV SPI-MS results were compared and validated against recent findings from in situ liquid time-of-flight secondary ion mass spectrometry (ToF-SIMS) [23,24], showing that different oligomers were detected. This work provides new insights into the dark aging mechanism of glyoxal oxidation using VUV SPI-MS, suggesting that it is a valuable approach in the study of aqSOA formation [21,26].
2. Experiments
2.1. SALVI Fabrication
SALVI is a vacuum-compatible microfluidic reactor (Figure 1a). Soft lithography was applied to make a 200 µm wide and 300 µm deep microchannel in a polydimethylsiloxane (PDMS) block. The channel was covered by a silicon nitride (SiN) membrane of 1.5 × 1.5 mm2 and 100 nm thick (Norcada, Edmonton, AB, Canada) supported by a silicon frame of 7.5 × 7.5 mm2 and 200 µm thick. The Si frame was irreversibly bonded to the PDMS block after oxygen plasma treatment. After assembling the SALVI cells, two apertures of 2 µm in diameter and 100 µm apart (Figure 1b) were milled on the SiN membrane above the center of the channel using scanning electron microscopy with the focused ion beam (SEM-FIB) to allow evaporation of liquids in vacuum [19,20,25]. More details about cell design and fabrications were described in our previous studies [17,18].
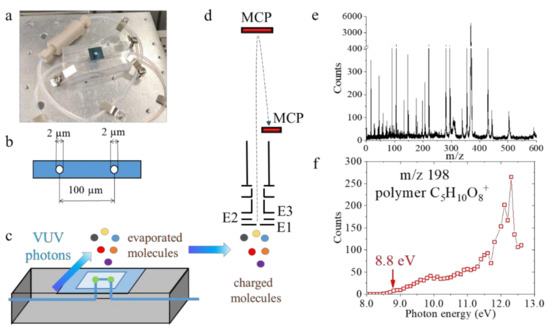
Figure 1.
(a) A photograph of the System for Analysis at the Liquid Vacuum Interface (SALVI) device; (b) a schematic showing the two 2 μm diameter apertures allowing evaporation of molecules on the SiN membrane covering the microchannel; (c) the relative position of the vacuum ultraviolet (VUV) photon beam from the SALVI device; (d) extraction and detection of charged molecules by the reflectron time-of-flight mass spectrometer; (e) a representative mass spectrum from the 2 h dark aging experiment acquired at 12.0 eV; and (f) a photoionization efficiency (PIE) curve of m/z 198 (C5H10O8+) from the 2 h dark reactions.
2.2. Sample Preparation
Chemicals (40 wt.% glyoxal in water, electrophoresis grade, and 30% wt. hydrogen peroxide, H2O2 in water, certified ACS grade) used in this work were acquired from Sigma-Aldrich (St. Louis, MO, USA). The microchannel was cleaned with deionized water (DI water, 18.2 MΩ) three times to minimize the interference from PDMS. The devices were baked in a vacuum oven (Fisher, Model 282 A, Waltham, MA, USA) overnight to reduce PDMS outgassing interferences before use. The concentration of glyoxal in clouds is about 10−4 M, however, glyoxal could be enriched due to droplet evaporation which then leads to oligomer formation [21,27]. Therefore, 5 mM glyoxal and 20 mM H2O2 solutions were used. The solutions were prepared using DI water. They were mixed thoroughly before getting injected into the microchannel via a syringe pump at a flow rate of 10 µL/min. Excess hydrogen peroxide as the oxidant ensures that the glyoxal oxidation reactions meet the pseudo-first-order condition. Polymers and oligomers can also form at the a–l interface using this concentration [24,28]. We covered the devices in clean aluminum foils after introducing glyoxal and H2O2 liquid mixture into the channel at different times to avoid any possible irradiation during sample preparation. The sample transfer and installation time between the wet laboratory and the beamline of 10 min and instrument pump-down time of 20 min were included in the dark aging process. The pH values of the solutions were close to cloud conditions [29]. More information of the samples investigated in this work is summarized in Table S1.
2.3. VUV SPI-MS Setup
After the dark aging treatment in the lab adjacent to the beamline, the device was attached onto the bottom electrode of the ion optics module immediately. Analysis was performed when the main chamber reached vacuum on the order of 10−7 Torr. The SPI-MS was combined with a three-meter VUV monochromator at the Chemical Dynamics Beamline 9.0.2 at the Advanced Light Source (ALS) located at the Lawrence Berkeley National Laboratory. The distance of SiN membrane and the VUV photon flux was kept at about 5 mm by optimizing the height of the mass spectrometer during each experiment. The liquid in the microchannel was held by its surface tension across the apertures, permitting the ionization and detection of the evaporated molecules during experiments [30,31]. The reactants and products evaporated from the two 2 µm apertures were ionized by the tunable synchrotron VUV photon beam (Figure 1c). These cations were sent to a microchannel plate (MCP) detector of the reflectron time-of-flight (ToF) mass spectrometer. Volatile molecules like aldehydes and carboxylic acids with lower molecular weight and medium vapor pressure with higher rates of evaporation provided higher counts compared to oligomers with higher molecular weights and lower vapor pressures.
The photon energies were scanned from 8.0 to 12.6 eV during mass spectral collection for the 4 h, 2 h dark aging, and glyoxal control samples. The 1 h dark aging sample was analyzed in an earlier ALS visit and the photon energy range was 8.0 to 11.0 eV. The sweeping step of photon energies was set at 0.1 eV to obtain a photoionization efficiency (PIE) curve of reaction products. The ion counts among different samples were affected by the optical alignment and instrument parameters among experimental runs and beamline trips. The schematic of the experimental setup was shown in Figure 1a–d and experimental conditions were summarized in Table S1.
2.4. Data Analysis
Mass calibration was performed using the known masses, such as water, oxygen, nitrogen, and rare gases [19]. Peak identification was based on the mass at the peak and glyoxal reaction mechanism reported in previous papers. During the VUV SPI-MS ToF analysis, a continuous wave ion beam is converted to a pulsed one. The mass spectra are affected by the pulsing and the resolution is not uniform over the mass range. Thus, unit mass was used for peak identification. All AEs of the main products were less than 12.0 eV. Many products would dissociate under higher photon energies and cause a reduction of corresponding molecular signals. Therefore, mass spectra at 12.0 eV were chosen for peak identification (an example is shown in Figure 1e). However, products that have consistent molecule weights could have multiple chemical formulas and structures. Therefore, determination of AEs of key products were needed to narrow down the possible structures of the observed peaks. The AE refers to the minimal photon energies required to observe an ion (seen in Figure 1f). In this study, PIE curves were acquired by scanning the ion counts at each photon energy, then the AE was determined as the first point where ion counts began to increase from the background signal [13,16]. The interference peaks from PDMS were evaluated in Table S2. The results showed that the PDMS interferences did not have a significant effect on the peak identification and peak integration of main products.
3. Results
3.1. Mass Spectra Analysis
The mass spectral comparison of glyoxal and H2O2 dark aging samples and the glyoxal control solution are shown in Figure 2 and Figure S1 at 12.0 eV and 10.7 eV photon energies, respectively. Glyoxal and its dimers (m/z 116 and 130) dissociated to fragments, such as m/z 45 CHO2+, m/z 75 C2H3O3+, m/z 91 C2H3O4+, and m/z 106 C3H6O4+. In contrast, a series of product peaks are observed after 1 h, 2h, and 4 h dark aging treatment. The results of mass spectral comparison indicate that the products are formed at the a–l interface after dark reactions of glyoxal and H2O2. Carboxylic acids formed at the aqueous surface are observed as protonated or deprotonated fragments due to proton transfer [32], such as deprotonated glyoxylic acid (m/z 73 C2HO3+) and protonated oxalic acid (m/z 91 C2H3O4+), at 12.0 eV. Glycolaldehyde (m/z 60 C2H4O2), an important intermediate, is detected as a neutral molecule. The main products formed at the a–l interface under dark conditions of glyoxal and H2O2 reaction are polymers and oligomers, including m/z 177 C6H9O6+, m/z 181 C4H5O8+, m/z 198 C5H10O8+, m/z 265 C8H9O10+, m/z 307 C10H11O11+, and m/z 339 C10H11O13+. More peaks with higher intensities are detected in the 2 h and 4 h dark aged samples as shown in Figure S1, suggesting that the longer dark processing time enhances the oligomer formation. Carboxylic related oligomers are one of the main dark aging products as listed in Table 1. The normalized VUV SPI-MS spectral comparison between UV and dark reaction products is depicted in Figure S2, and the comparison results are summarized in Table 1. In addition, these products observed by VUV SPI-MS are compared with results from in situ liquid ToF-SIMS shown in Table S3. The latter is a novel approach to study a–l interfacial reactions [23,24,28]. Interestingly, the two techniques show different kinds of oligomer products. We observed new oligomers in VUV SPI-MS that were not detected by in situ liquid ToF-SIMS. This finding indicates that new reaction pathways of glyoxal dark aging can be proposed as highlighted in light grey in Table S3 based on VUV SPI-MS experiments of the same reaction system. There are subtle differences in the products identified due to different ionization conditions, in the case of VUV SPI-MS, evaporated gas phase molecules are ionized, while in the case of ToF-SIMS, sputtering and subsequent ionization of gas phase molecules from the liquid interface are detected.
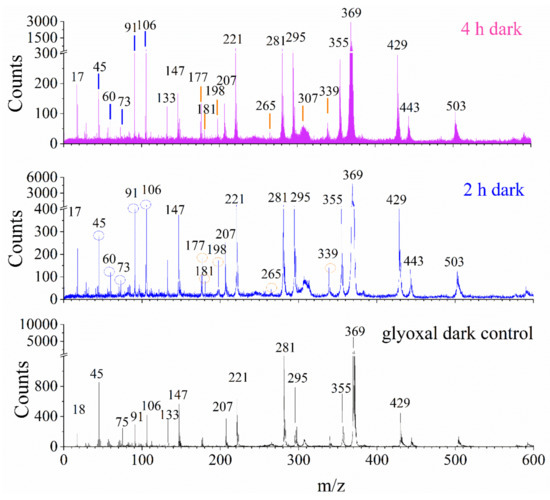
Figure 2.
VUV SPI-MS spectral comparison of (a) 4 h and (b) 2 h dark reaction products of glyoxal and hydrogen peroxide solutions and (c) the glyoxal solution at photon energy of 12.0 eV. Blue drop lines and circles stand for reactant, intermediates, and carboxylic acids and orange drop lines and circles depict polymers and oligomers, respectively. Peaks from the glyoxal control solution and polydimethylsiloxane (PDMS) are marked without markers.

Table 1.
Identifications of key reactants and product peaks in the positive mode at 12.0 eV.
3.2. Appearance Energies (AEs) Determination
AEs obtained from the PIE curve of the 2 h dark aging sample are presented in Figure 3. The comparison of AEs between dark and UV-aged samples are summarized in Table 1. Additionally, AEs derived from the 4 h dark-aged sample and PIE curves of some key products from our recent study [25] are depicted in Figure S3. The normalized PIE curves of a few representative ions observed in the 2 h dark and UV aged samples are shown in Figure S4. The AEs determined from PIE curves and their shapes are in good agreement, implying that there are some common products for glyoxal oxidation under dark and UV conditions. As to smaller products (i.e., Figure 3a,d), the ion counts increase linearly with photon energies, and the IEs and molecular structures can be determined directly from the known PIE curves. For example, the AEs for m/z 60 (Figure 3a) is determined to be 10.0 eV, and we assigned glycolaldehyde C2H4O2 according to the IE reported in a previous study [33]. The AEs for m/z 73 C2HO3+ (Figure 3b) and m/z 91 C2H3O4+ (Figure 3c) are 9.2 eV and 11.1 eV, respectively, which are identified as deprotonated glyoxylic acid C2HO3 and protonated acid C2H3O4+ based on the known pathways of the glyoxal oxidation in dark reactions as reported in previous studies [9,22,23,24,34]. While looking into Figure 3d–k, the PIE curves exhibited are more complicated and they show similar behaviors, suggesting that the products shared multi and same functional groups. Specifically, the PIE curve of m/z 106 led to the determination of an AE of 8.6 eV, which is suggested as the glyoxal dimer fragment, C3H6O4+. Furthermore, the AEs of polymers and oligomers formed via glyoxal oxidation under dark conditions at the a–l interface are determined as follows (shown in Figure 3d,f–k), m/z 105 C3H5O4+ 9.8 eV, m/z 177 C6H9O6+ 10.2 eV, m/z 181 C4H5O8+ 9.6 eV, m/z 198 C5H10O8+ 8.8 eV, m/z 265 C8H9O10+ 9.7 eV, m/z 307 C10H11O11+ 9.9 eV, and m/z 339 C10H11O13+ 9.6 eV. Our results indicate that glyoxal interfacial dark reactions and the associated dynamic processes could be studied by the VUV SPI-MS. New products could be determined and assigned according to both mass spectral analysis and via the determination of AEs.
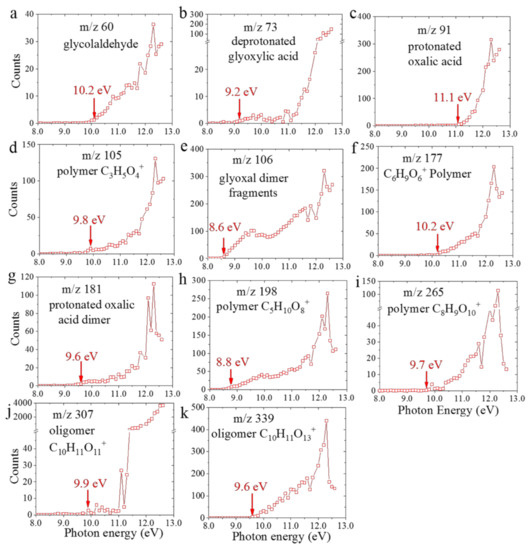
Figure 3.
Photoionization efficiency curves of key products with appearance energies shown by arrows (a) glycolaldehyde (b), deprotonated glyoxylic acid, (c) protonated oxalic acid, (d) polymer, C3H5O4+, (e) glyoxal dimer fragments, (f) polymer C6H9O6+, (g) protonated oxalic acid dimer, (h) oligomer, C5H10O8+ (i) oligomer, C8H9O10+, (j) oligomer, C10H11O11+, and (k) oligomer, C10H11O13+ from the 2 h dark aging VUV SPI-MS observations.
4. Discussion
Under the UV radiation, glyoxylic acid and oxalic acid could form by glyoxal oxidation in the presence of OH radicals via radical reactions [21]. When H2O2 acts as oxidant, for instance under dark conditions, the primary reaction is that the carbonyl group of glyoxal is oxidized to form glyoxylic acid. As a result, the intermediate products are glyoxylic acid, and it could be further oxidized to oxalic acid [35,36]. Afterwards, oxalic acid could form dimers by hydrogen bonding (m/z 181, C4H5O8+) in both dark and UV samples [37]. The differences in dark and UV interfacial aging in the presence of oxidant suggest that the formation mechanisms of oligomer products are distinctive between UV and dark aging of glyoxal in the presence of oxidant.
Specifically, oligomers could form via radical reactions of carboxylic acids under UV irradiation [34]. Tan et al. proposed a dark aging pathway involving glyoxylic acid and oxalic acid participating in aqSOA formation, because these carboxylic acids could form high molecular weight oligomers via oligomerization, acetal and hemiacetal formation or aldol condensation at the a–l interface [38]. This pathway is verified by our VUV SPI-MS observations in this work. Glyoxylic-related oligomers, i.e., C6H9O6, C5H10O8, C8H9O10, C10H11O11, and oxalic-related oligomers C10H11O13 were detected right above the a–l interface. Fewer oligomer species were observed in dark aging samples when comparing the dark and UV aging results [25] as seen in Table 1 and Figure S2, indicating that UV irradiation could enhance the formation of more aqSOA products with low volatility. Nevertheless, these products confirmed that dark reactions of glyoxal were another significant source of the global SOA budget.
The expanded reaction flow chart showing glyoxal dark reactions is illustrated in Figure 4 with representative new products marked in blue based on the comparison results with those of recent liquid ToF-SIMS. The cluster ions and water clusters observed in the liquid ToF-SIMS spectra were not detected in VUV SPI-MS [24,28]. In contrast, VUV SPI-MS detected some new oligomers that were not observed in liquid ToF-SIMS, and these products are highlighted in gray in Table S3. VUV SPI-MS and ToF-SIMS use different ionization methods and those differences were reflected in the observed products [24,25,39]. ToF-SIMS can detect cluster ions including water clusters and water and organic cluster ions to study environmental and biological surfaces and interfaces [23,24,28,30,40,41]. VUV SPI-MS, deemed as a soft ionization technique, has demonstrated its ability to capture more oligomers in this work.
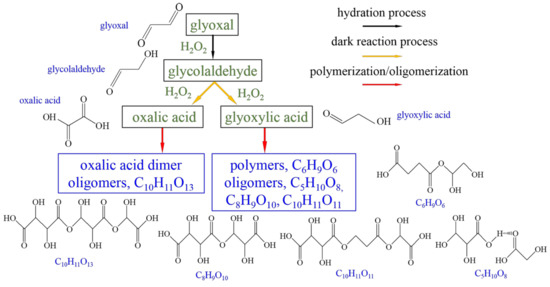
Figure 4.
The expanded reaction flow chart of glyoxal dark reactions based on VUV SPI-MS results. Black arrows represent hydration process, yellow—dark reaction process, and red—polymerization/oligomerization. Green font and boxes stand for known carboxylic acids. Representative new products are highlighted in blue font and boxes.
The mass spectral comparison between VUV SPI-MS and ToF-SIMS shows that new insights of glyoxal dark aging in the presence of a strong oxidant like hydrogen peroxide can be obtained based on experimental observations. Additionally, more advanced detection approaches are needed to fully comprehend the complex aqSOA formation at the a–l interface, such as electrospray ionization mass spectrometry, infrared and Raman spectroscopy.
5. Conclusions
We performed VUV SPI-MS experiments to study the products of glyoxal and H2O2 dark reactions at the a–l interface in this work. Compared with UV aging of the same chemical system, the main products of dark interfacial aging of glyoxal and H2O2 are glyoxylic acid, oxalic acid, and their related oligomers. Our results indicate that the pathways of dark reactions of glyoxal and hydrogen peroxide have different characteristics compared to UV aging. The AEs determined from the PIE curves indicate that those oligomers have hydroxyl and carboxyl functional groups. Furthermore, the VUV SPI-MS results were compared with those of in situ liquid ToF-SIMS. Some oligomers and oxidants are observed in both techniques, giving us confidence in using VUV SPI-MS in exploring complex reactions. The new VUV SPI-MS results suggest that oligomers discovered in the glyoxal dark oxidations could form at the a–l interface. In contrast, different products were detected by in situ liquid ToF-SIMS at the aqueous surface. These new results suggested that glyoxal could firstly become oxidized to form glyoxylic acid and oxalic acid under dark conditions, then they act as a significant source of aqSOA via oligomerization reactions in the atmosphere.
In summary, we gained new insights into glyoxal dark oxidation leading to aqSOA formation at the aqueous surface using VUV SPI-MS. Our efforts show that the vacuum compatible microfluidic reactor SALVI enables a–l interfacial product detection in VUV SPI-MS and extends its applications to atmospheric mechanistic studies of aqSOA formation. Utilization of more than one advanced technique can help us gain a more complete picture of interfacial kinetics and dynamics of aqSOAs in the future.
Supplementary Materials
The following are available online at https://www.mdpi.com/2073-4433/12/3/338/s1, Figure S1: VUV SPI-MS spectral comparison of the glyoxal control, 1 h, 2 h, and 4 h dark aging of glyoxal and hydrogen peroxide solutions acquired at photon energy of 10.7 eV. Blue drop lines stand for reactant and intermediates and red drop lines for polymers/oligomers. Peaks from the glyoxal control and PDMS are marked without drop lines. Figure S2: VUV SPI-MS normalized spectral comparison of UV and dark reaction products of glyoxal and hydrogen peroxide solutions at photon energy of 12.0 eV. Total ions are used in normalization. Green drop lines stand for reactant, intermediates, and products such as carboxylic acids; and red drop lines for polymers/oligomers in UV samples. Peaks from the glyoxal control and PDMS are marked without drop lines. Figure S3: PIE curves of key products with AE’s shown by arrows of key products from the 4 h dark aging VUV SPI-MS observations. Figure S4: Comparison of normalized PIE curves of key products between UV and dark aged samples from the 2 h observations. Table S1: Summary of experimental conditions. Table S2: List of significant PDMS related peaks observed in the positive ion mode. Table S3: Detected products comparison between VUV SPI-MS and in situ liquid ToF-SIMS at the a–l interface.
Author Contributions
X.Y.Y. designed the experiments. X.S., X.Y.Y., O.K. and M.A. wrote the paper. B.X., X.Y.Y. and J.Y. performed the experiments. X.S., B.X., O.K., M.A. and X.Y.Y. did analysis. All authors have read and agreed to the published version of the manuscript.
Funding
The programmatic support of the experimental work for X.Y.Y. and J.Y. was from Pacific Northwest National Laboratory (PNNL), the Earth and Biological Science Directorate (EBSD), and mission seed Laboratory Directed Research and Development (LDRD) support to perform the beamline experiment. The manuscript preparation for X.Y.Y. was supported partially by the Physical and Computational Science Directorate (PCSD) LDRD. PNNL is operated for the U.S. DOE by Battelle Memorial Institute under Contract No. DE-AC05-76RL01830. This research used resources of the Advanced Light Source, a Department of Energy (DOE) Office of Science User Facility under contract no. DE-AC02-05CH11231. Programmatic support for B.X., O.K., and M.A. was from the Director, Office of Science, Office of Basic Energy Sciences, of the U.S. DOE under Contract No. DE-AC02-05CH11231, through the Gas Phase Chemical Physics Program and Condensed Phase, Interfaces, and Molecular Sciences Program.
Acknowledgments
X.S. is grateful for the support from the PNNL Alternate Sponsored Fellowship (ASF). The authors thank Rachel Komorek, Jenn Yao, Fei Zhang, and Tyler Troy for their assistance in device fabrication, sample preparation, and data analysis.
Conflicts of Interest
The authors declare no conflict of interest.
References
- Myriokefalitakis, S.; Vrekoussis, M.; Tsigaridis, K.; Wittrock, F.; Richter, A.; Brühl, C.; Volkamer, R.; Burrows, J.P.; Kanakidou, M. The influence of natural and anthropogenic secondary sources on the glyoxal global distribution. Atmos. Chem. Phys. 2008, 8, 4965–4981. [Google Scholar] [CrossRef]
- Atkinson, R.; Arey, J. Atmospheric Degradation of Volatile Organic Compounds. Chem. Rev. 2003, 103, 4605–4638. [Google Scholar] [CrossRef]
- Volkamer, R.; Molina, L.T.; Molina, M.J.; Shirley, T.; Brune, W.H. DOAS measurement of glyoxal as an indicator for fast VOC chemistry in urban air. Geophys. Res. Lett. 2005, 32. [Google Scholar] [CrossRef]
- Miller, C.C.; Jacob, D.J.; Marais, E.A.; Yu, K.; Travis, K.R.; Kim, P.S.; Fisher, J.A.; Zhu, L.; Wolfe, G.M.; Hanisco, T.F.; et al. Glyoxal yield from isoprene oxidation and relation to formaldehyde: Chemical mechanism, constraints from SENEX aircraft observations, and interpretation of OMI satellite data. Atmos. Chem. Phys. 2017, 17, 8725–8738. [Google Scholar] [CrossRef]
- Mellouki, A.; Wallington, T.J.; Chen, J. Atmospheric Chemistry of Oxygenated Volatile Organic Compounds: Impacts on Air Quality and Climate. Chem. Rev. 2015, 115, 3984–4014. [Google Scholar] [CrossRef] [PubMed]
- Huang, R.-J.; Zhang, Y.; Bozzetti, C.; Ho, K.-F.; Cao, J.-J.; Han, Y.; Daellenbach, K.R.; Slowik, J.G.; Platt, S.M.; Canonaco, F.; et al. High secondary aerosol contribution to particulate pollution during haze events in China. Nature 2014, 514, 218–222. [Google Scholar] [CrossRef]
- Ito, T.; Bekki, K.; Fujitani, Y.; Hirano, S. The toxicological analysis of secondary organic aerosol in human lung epithelial cells and macrophages. Environ. Sci. Pollut. Res. 2019, 26, 22747–22755. [Google Scholar] [CrossRef]
- Li, J.; Zhu, C.; Chen, H.; Fu, H.; Herrmann, H.; Chen, J. A More Important Role for the Ozone S(IV) Oxidation Pathway Due to Decreasing Acidity in Clouds. J. Geophys. Res. Atmos. 2020, 125, 1–13. [Google Scholar] [CrossRef]
- Herrmann, H.; Schaefer, T.; Tilgner, A.; Styler, S.A.; Weller, C.; Teich, M.; Otto, T. Tropospheric Aqueous-Phase Chemistry: Kinetics, Mechanisms, and Its Coupling to a Changing Gas Phase. Chem. Rev. 2015, 115, 4259–4334. [Google Scholar] [CrossRef]
- Vaida, V. Atmospheric radical chemistry revisited sunlight may directly drive previously unknown organic reactions at environmental surfaces. Science 2016, 353, 650. [Google Scholar] [CrossRef] [PubMed]
- McNeill, V.F. Aqueous organic chemistry in the atmosphere: Sources and chemical processing of organic aerosols. Environ. Sci. Technol. 2015, 49, 1237–1244. [Google Scholar] [CrossRef]
- Yu, X.Y.; Liu, B.W.; Yang, L. Imaging liquids using microfluidic cells. Microfluid. Nanofluid. 2013, 15, 725–744. [Google Scholar] [CrossRef]
- Kostko, O.; Bandyopadhyay, B.; Ahmed, M. Vacuum Ultraviolet Photoionization of Complex Chemical Systems. Annu. Rev. Phys. Chem. 2016, 67, 19–40. [Google Scholar] [CrossRef]
- Ahmed, M.; Kostko, O. From atoms to aerosols: Probing clusters and nanoparticles with synchrotron based mass spectrometry and X-ray spectroscopy. Phys. Chem. Chem. Phys. 2020, 22, 2713–2737. [Google Scholar] [CrossRef]
- Craig, A.; Taatjes, N.H.; Andrew McIlroy, J.A.M.; Juan, P.S.; Stephen, J.K.; Qi, F.; Sheng, L.; Zhang, Y.; Terrill, A.; Wang, C.J.; et al. Enols Are Common Intermediates in Hydrocarbon Oxidation. Science 2005, 308, 1887–1889. [Google Scholar]
- Mysak, E.R.; Wilson, K.R.; Jimenez-Cruz, M.; Ahmed, M.; Baer, T. Synchrotron radiation based aerosol time-of-flight mass spectrometry for organic constituents. Anal. Chem. 2005, 77, 5953–5960. [Google Scholar] [CrossRef] [PubMed]
- Yang, L.; Yu, X.Y.; Zhu, Z.H.; Iedema, M.J.; Cowin, J.P. Probing liquid surfaces under vacuum using SEM and ToF-SIMS. Lab Chip 2011, 11, 2481–2484. [Google Scholar] [CrossRef] [PubMed]
- Yang, L.; Yu, X.Y.; Zhu, Z.H.; Thevuthasan, T.; Cowin, J.P. Making a hybrid microfluidic platform compatible for in situ imaging by vacuum-based techniques. J. Vac. Sci. Technol. A 2011, 29, 061101. [Google Scholar] [CrossRef]
- Komorek, R.; Xu, B.; Yao, J.; Ablikim, U.; Troy, T.P.; Kostko, O.; Ahmed, M.; Yu, X.Y. Enabling liquid vapor analysis using synchrotron VUV single photon ionization mass spectrometry with a microfluidic interface. Rev. Sci. Instrum. 2018, 89, 115105. [Google Scholar] [CrossRef]
- Komorek, R.; Xu, B.; Yao, J.; Kostko, O.; Ahmed, M.; Yu, X.Y. Probing sulphur clusters in a microfluidic electrochemical cell with synchrotron-based photoionization mass spectrometry. Phys. Chem. Chem. Phys. 2020, 22, 14449–14453. [Google Scholar] [CrossRef]
- Lim, Y.B.; Tan, Y.; Perri, M.J.; Seitzinger, S.P.; Turpin, B.J. Aqueous chemistry and its role in secondary organic aerosol (SOA) formation. Atmos. Chem. Phys. 2010, 10, 10521–10539. [Google Scholar] [CrossRef]
- Ervens, B.; Volkamer, R. Glyoxal processing by aerosol multiphase chemistry: Towards a kinetic modeling framework of secondary organic aerosol formation in aqueous particles. Atmos. Chem. Phys. 2010, 10, 8219–8244. [Google Scholar] [CrossRef]
- Zhang, F.; Yu, X.; Chen, J.; Zhu, Z.; Yu, X.-Y. Dark air–liquid interfacial chemistry of glyoxal and hydrogen peroxide. NPJ Clim. Atmos. Sci. 2019, 2. [Google Scholar] [CrossRef]
- Sui, X.; Zhou, Y.F.; Zhang, F.; Chen, J.M.; Zhu, Z.H.; Yu, X.Y. Deciphering the aqueous chemistry of glyoxal oxidation with hydrogen peroxide using molecular imaging. Phys. Chem. Chem. Phys. 2017, 19, 20357–20366. [Google Scholar] [CrossRef]
- Sui, X.; Xu, B.; Yao, J.; Kostko, O.; Ahmed, M.; Yu, X.-Y. New Insights into Secondary Organic Aerosol Formation at the Air–Liquid Interface. J. Phys. Chem. Lett. 2020, 324–329. [Google Scholar] [CrossRef]
- Galloway, M.M.; Chhabra, P.S.; Chan, A.W.H.; Surratt, J.D.; Flagan, R.C.; Seinfeld, J.H.; Keutsch, F.N. Glyoxal uptake on ammonium sulphate seed aerosol: Reaction products and reversibility of uptake under dark and irradiated conditions. Atmos. Chem. Phys. 2009, 9, 3331–3345. [Google Scholar] [CrossRef]
- Carlton, A.G.; Turpin, B.J.; Altieri, K.E.; Seitzinger, S.; Reff, A.; Lim, H.-J.; Ervens, B. Atmospheric oxalic acid and SOA production from glyoxal: Results of aqueous photooxidation experiments. Atmos. Environ. 2007, 41, 7588–7602. [Google Scholar] [CrossRef]
- Zhang, F.; Yu, X.; Sui, X.; Chen, J.; Zhu, Z.; Yu, X.Y. Evolution of aqSOA from the Air-Liquid Interfacial Photochemistry of Glyoxal and Hydroxyl Radicals. Environ. Sci. Technol. 2019, 53, 10236–10245. [Google Scholar] [CrossRef] [PubMed]
- Li, J.; Zhu, C.; Chen, H.; Zhao, D.; Xue, L.; Wang, X.; Li, H.; Liu, P.; Liu, J.; Zhang, C.; et al. The evolution of cloud and aerosol microphysics at the summit of Mt. Tai, China. Atmos. Chem. Phys. 2020, 20, 13735–13751. [Google Scholar] [CrossRef]
- Yu, J.C.; Zhou, Y.F.; Hua, X.; Liu, S.Q.; Zhu, Z.H.; Yu, X.Y. Capturing the transient species at the electrode-electrolyte interface by in situ dynamic molecular imaging. Chem. Commun. 2016, 52, 10952–10955. [Google Scholar] [CrossRef] [PubMed]
- Liu, B.; Yu, X.Y.; Zhu, Z.; Hua, X.; Yang, L.; Wang, Z. In situ chemical probing of the electrode-electrolyte interface by ToF-SIMS. Lab Chip 2014, 14, 855–859. [Google Scholar] [CrossRef] [PubMed]
- Bell, F.; Ruan, Q.N.; Golan, A.; Horn, P.R.; Ahmed, M.; Leone, S.R.; Head-Gordon, M. Dissociative photoionization of glycerol and its dimer occurs predominantly via a ternary hydrogen-bridged ion-molecule complex. J. Am. Chem. Soc. 2013, 135, 14229–14239. [Google Scholar] [CrossRef]
- Ptasińska, S.; Denifl, S.; Scheier, P.; Märk, T.D. Electron impact ionization of glycolaldehyde. Int. J. Mass Spectrom. 2005, 243, 171–176. [Google Scholar] [CrossRef]
- Perri, M.J.; Seitzinger, S.; Turpin, B.J. Secondary organic aerosol production from aqueous photooxidation of glycolaldehyde: Laboratory experiments. Atmos. Environ. 2009, 43, 1487–1497. [Google Scholar] [CrossRef]
- Strukul, G. Transition Metal Catalysis in the Baeyer–Villiger Oxidation of Ketones. Angew. Chem. Int. Ed. 1998, 37, 1198–1209. [Google Scholar] [CrossRef]
- Warneck, P. In-cloud chemistry opens pathway to the formation of oxalic acid in the marine atmosphere. Atmos. Environ. 2003, 37, 2423–2427. [Google Scholar] [CrossRef]
- Mariusz, P.; Mitoraj, R.K.; Boczar, M.; Michalak, A. Theoretical description of hydrogen bonding in oxalic acid dimer and trimer based on the combined extended-transition-state energy decomposition analysis and natural orbitals for chemical valence (ETS-NOCV). J. Mol. Model. 2010, 16, 1789–1795. [Google Scholar]
- Tan, Y.; Carlton, A.G.; Seitzinger, S.P.; Turpin, B.J. SOA from methylglyoxal in clouds and wet aerosols: Measurement and prediction of key products. Atmos. Environ. 2010, 44, 5218–5226. [Google Scholar] [CrossRef]
- Hanley, L.; Zimmermann, R. Light and molecular ions: The emergence of vacuum UV single-photon ionization in MS. Anal. Chem. 2009, 81, 4174–4182. [Google Scholar] [CrossRef] [PubMed]
- Ding, Y.; Zhou, Y.; Yao, J.; Szymanski, C.; Fredrickson, J.K.; Shi, L.; Cao, B.; Zhu, Z.; Yu, X.Y. In Situ Molecular Imaging of the Biofilm and Its Matrix. Anal. Chem. 2016. [Google Scholar] [CrossRef]
- Hua, X.; Szymanski, C.; Wang, Z.; Zhou, Y.; Ma, X.; Yu, J.; Evans, J.; Orr, G.; Liu, S.; Zhu, Z.; et al. Chemical imaging of molecular changes in a hydrated single cell by dynamic secondary ion mass spectrometry and super-resolution microscopy. Integr. Biol. 2016, 8, 635–644. [Google Scholar] [CrossRef] [PubMed]


Publisher’s Note: MDPI stays neutral with regard to jurisdictional claims in published maps and institutional affiliations. |
© 2021 by the authors. Licensee MDPI, Basel, Switzerland. This article is an open access article distributed under the terms and conditions of the Creative Commons Attribution (CC BY) license (http://creativecommons.org/licenses/by/4.0/).