Article

Geographic Shift and Environment Change of U.S. Tornado Activities in a Warming Climate

1
Meteorological Research Division, Environment and Climate Change Canada, Toronto, ON M3H 5T4, Canada
2
U.S. Army Research Laboratory, White Sands Missile Range, NM 88002, USA
3
Scripps Institution of Oceanography, University of California San Diego, La Jolla, CA 92093, USA
*
Author to whom correspondence should be addressed.
Atmosphere 2021, 12(5), 567; https://doi.org/10.3390/atmos12050567
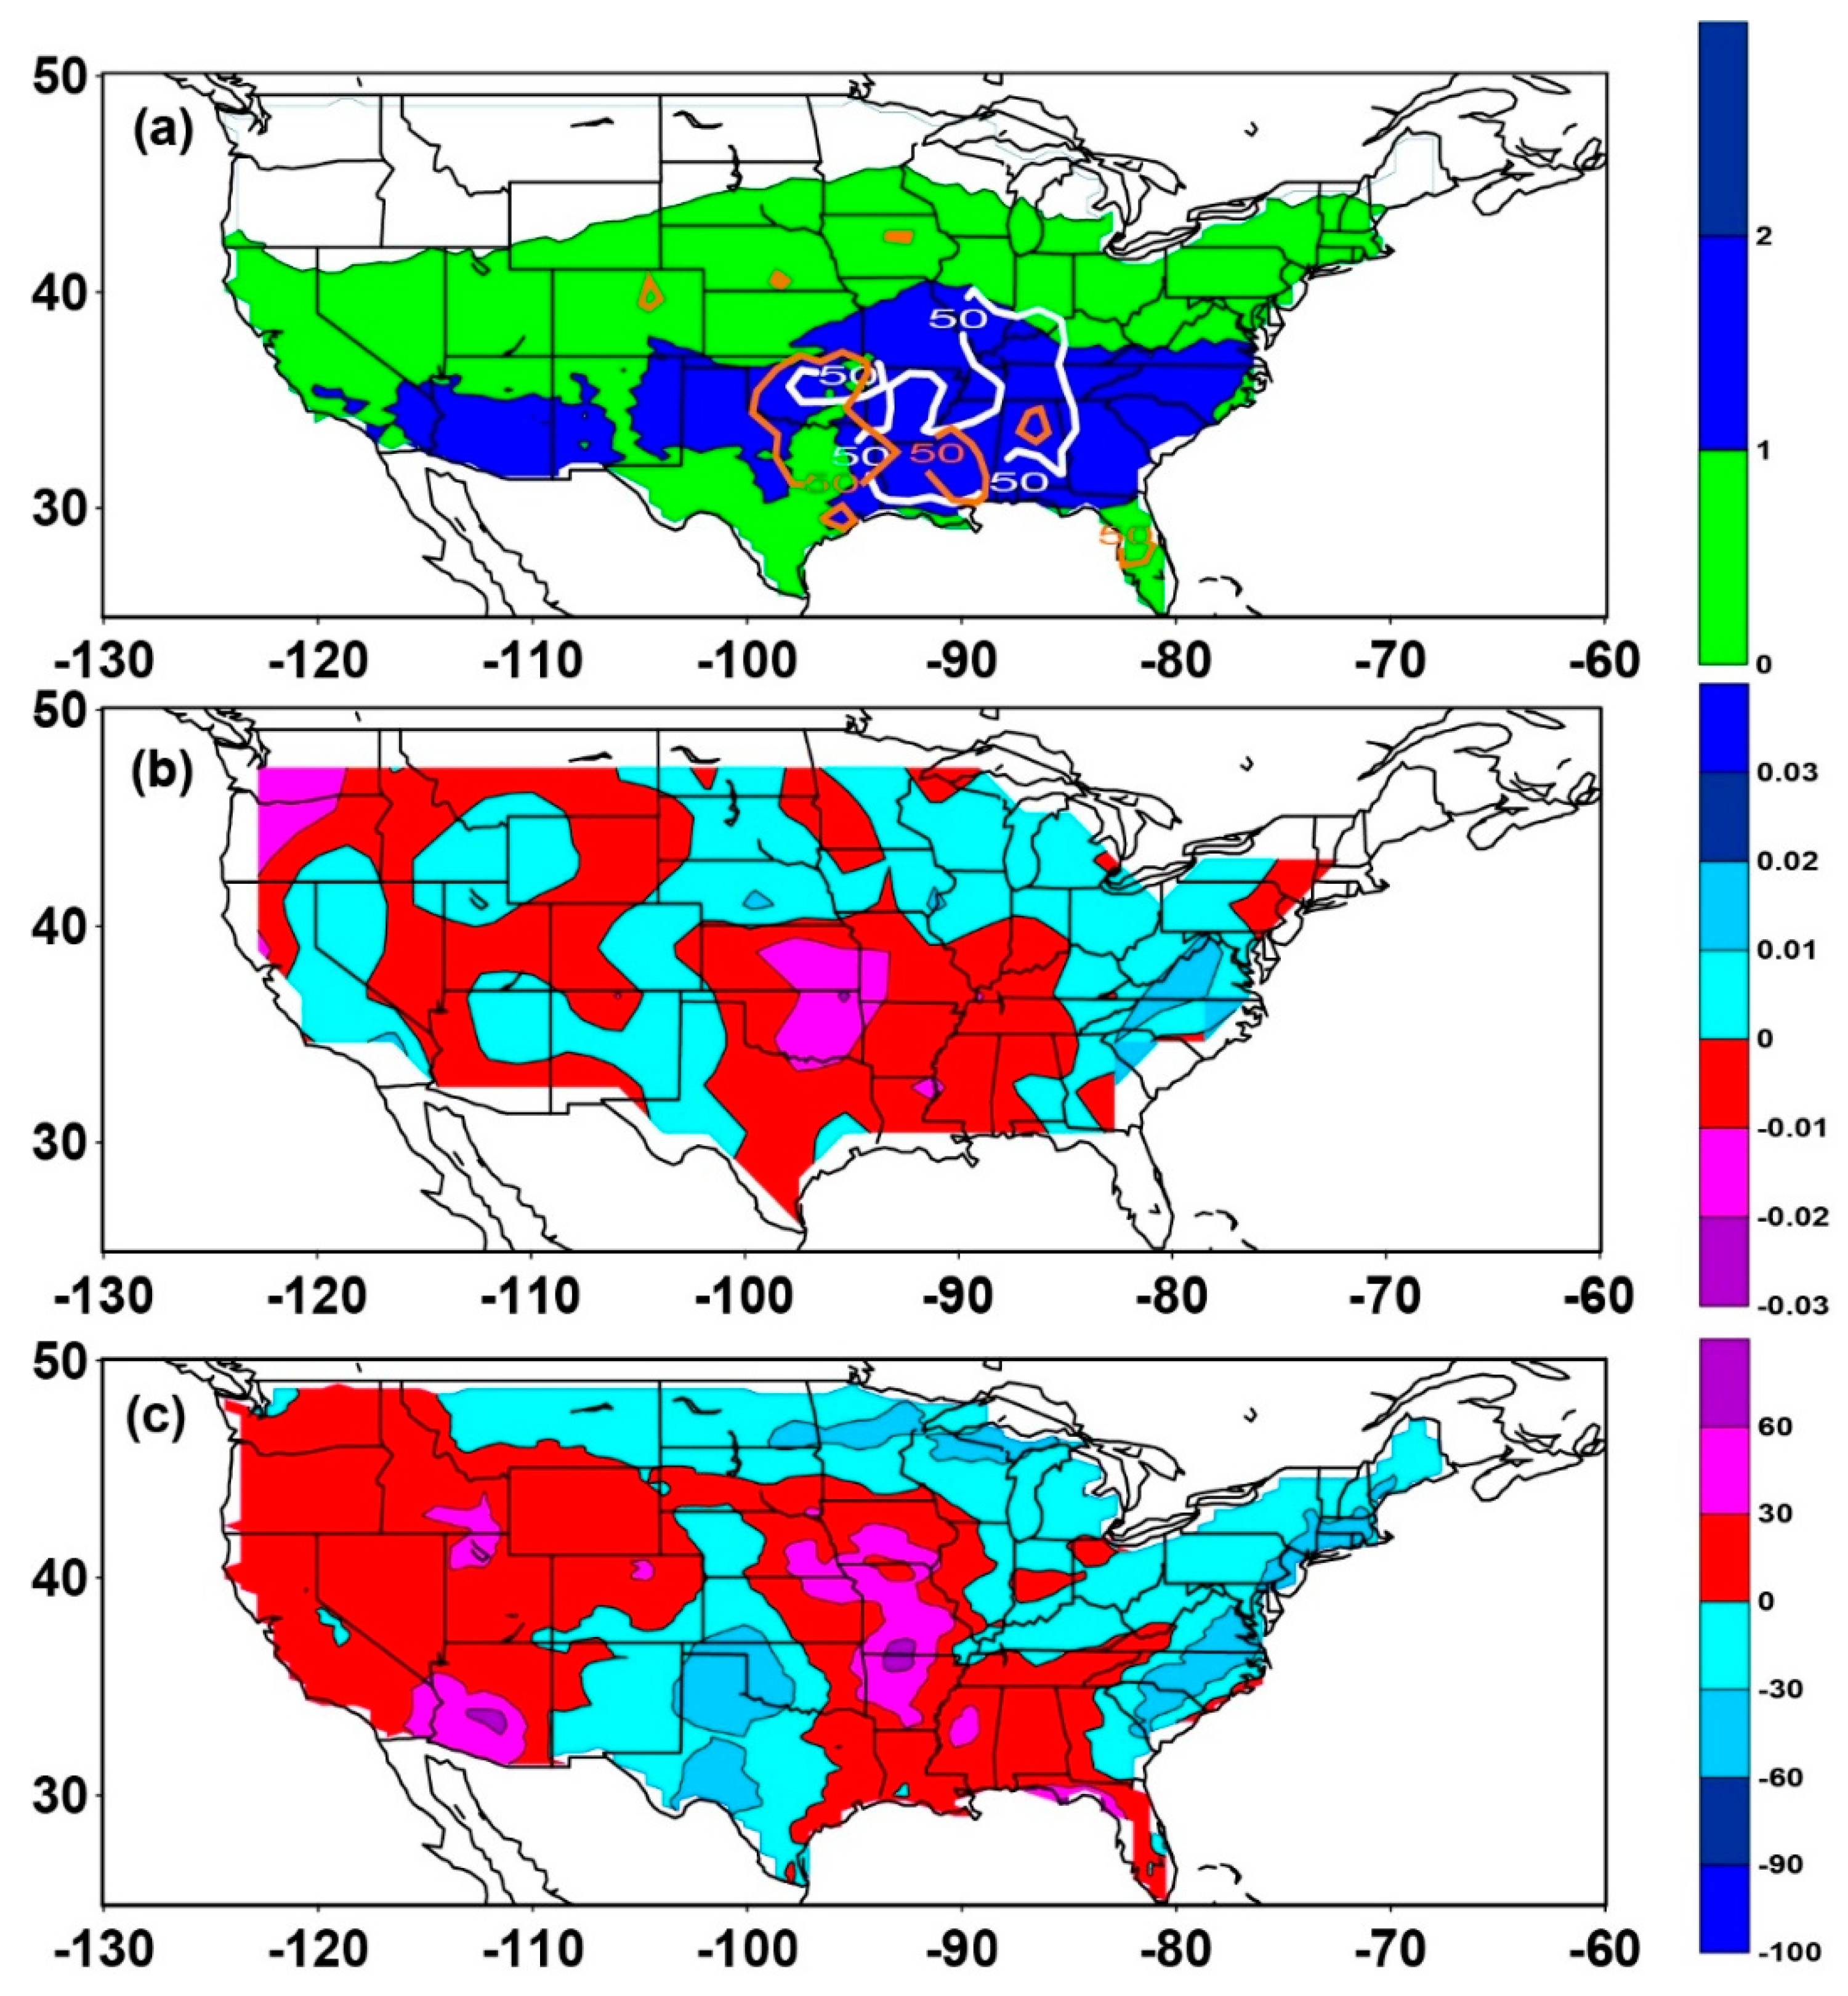
Submission received: 17 March 2021 / Revised: 25 April 2021 / Accepted: 26 April 2021 / Published: 28 April 2021
(This article belongs to the Section Climatology)

Abstract

:
Even with ever-increasing societal interest in tornado activities engendering catastrophes of loss of life and property damage, the long-term change in the geographic location and environment of tornado activity centers over the last six decades (1954–2018), and its relationship with climate warming in the U.S., is still unknown or not robustly proved scientifically. Utilizing discriminant analysis, we show a statistically significant geographic shift of U.S. tornado activity center (i.e., Tornado Alley) under warming conditions, and we identify five major areas of tornado activity in the new Tornado Alley that were not identified previously. By contrasting warm versus cold years, we demonstrate that the shift of relative warm centers is coupled with the shifts in low pressure and tornado activity centers. The warm and moist air carried by low-level flow from the Gulf of Mexico combined with upward motion acts to fuel convection over the tornado activity centers. Employing composite analyses using high resolution reanalysis data, we further demonstrate that high tornado activities in the U.S. are associated with stronger cyclonic circulation and baroclinicity than low tornado activities, and the high tornado activities are coupled with stronger low-level wind shear, stronger upward motion, and higher convective available potential energy (CAPE) than low tornado activities. The composite differences between high-event and low-event years of tornado activity are identified for the first time in terms of wind shear, upward motion, CAPE, cyclonic circulation and baroclinicity, although some of these environmental variables favorable for tornado development have been discussed in previous studies.

1. Introduction

Tornadoes, as one of the most severe weather phenomena on Earth, can occur globally [1,2] especially in the United States, Canada, northern Europe, Bangladesh, China, Japan, Argentina, South Africa, Australia, and New Zealand. Among these, the United States is ranked number one in terms of the total number of tornadoes with annual occurrences of more than 1000 in recent years [3]. Annual tornado events reported in the United States at the beginning of the 21st century (~1200 per year) are about double of those in the 1950s (~600 per year) [4]. Most of the reported tornado increase is due to the more frequent reporting of (E)F0 tornadoes, while reported (E)F1 and greater tornadoes have remained fairly stable and are more representative of actual tornado activity [4,5,6,7]. Every year, an average of 1200 tornadoes kill about 60 people, injure 1500 persons and cause more than $400 million in property damages in the U.S. [8,9,10]. The Intergovernmental Panel on Climate Change (IPCC) and the United States Climate Change Science Program have recently begun to pay close attention to how a warming climate affects localized severe weather such as tornadoes [11,12], even though it is challenging to identify the influences of global warming on tornado activity [13,14]. In this study, we focus on long-term changes of tornado activities in the U.S. and their associated large-scale environments. In particular, we attempt to examine whether tornado occurrence variability in the U.S. has increased and/or shifted in recent decades. We will investigate the spatial changes of tornado activity (counts and days) and their association with regional climate warming over the continental U.S.
Even with ever-increasing societal interest in tornado activities which engender catastrophes of loss of life and property damages [8,9], long-term change in geographic location of tornado activities in the U.S. and their associated environments over the past six decades has still not been robustly proved scientifically. The spatial variability of tornado activities of (E)F1–(E)F5 refers to geographic location changes of the tornado activity centers (i.e., Tornado Alley). The official boundaries of Tornado Alley have been debatable and not clearly defined, even though the first use of the term Tornado Alley can be dated back to 1952, and the term has often been used by the media. To arrive a clear scientific definition and for easy communication with the media and the public, we define Tornado Alley based on our analysis and statistical tests. Here, Tornado Alley is defined as the core area of gridded (E)F1–(E)F5 tornado counts of 50 or more per 1° × 1° grid box over a 30-year period (see methods and results). In this study, we demonstrate that, in a warming climate, the U.S. Tornado Alley shifts from the traditional tornado activity centers in Texas and Oklahoma to the new tornado activity center over Arkansas, Louisiana, Mississippi, Alabama, Tennessee, Kentucky, and Illinois, as well as a shrinking area of Oklahoma. This shift is statistically significant based on our discriminant analysis. In this work, we find that the new tornado activity center is mainly located in seven states (Arkansas, Louisiana, Mississippi, Kentucky, Illinois, Alabama and Tennessee) as opposed to a previous study [15] that only identifies two (Alabama and Tennessee).
Given that the spatial variability of tornado activities associated with large scale environment conditions remains highly uncertain [16], we will further perform composite analyses to understand the large-scale environments that are conducive to tornado development using high resolution North American Regional Reanalysis (NARR) monthly mean data (~32 km horizontal resolution) [17]. Although these synoptic- and meso-scale environments for tornado development have been discussed in case studies, numerical simulations, and other climatological analyses [18,19,20,21], this is the first time that these signals have been detected in a climate composite analysis of difference between high-event and low-event years of tornado activity.

2. Data and Methods

2.1. Observational and Reanalysis Data

Three datasets are used in this work, including (1) the U.S. tornado data provided by NOAA’s (National Oceanic and Atmospheric Administration) National Weather Service Storm Prediction Center (SPC) (http://www.spc.noaa.gov/wcm/index.html#data, accessed on 27 April 2021), (2) the NCEP-NCAR (National Centers for Environmental Prediction-National Center for Atmospheric Research) monthly mean reanalysis data [22], and (3) NCEP NARR (North American Regional Reanalysis) high-resolution reanalysis data provided by NOAA (http://www.esrl.noaa.gov/psd/, accessed on 27 April 2021).
The U.S. tornado data used in this study are the same as those used in others [6,7,19,23]. These data are maintained by the Storm Prediction Center of NOAA, reviewed by the U.S. National Climatic Data Center, and updated on a yearly basis [7,24] (http://www.spc.noaa.gov/wcm/#data, accessed on 27 April 2021). Although there are uncertainties in the U.S. tornado databases [14,25,26,27,28,29,30], recent studies find that the time series of (E)F1 or greater tornadoes is more stationary over time [4,31] and is thus more representative of actual tornado activity since the 1950s [6,7]. Similar to others [4,6,7,32], in this study we exclude (E)F0 tornadoes from consideration. Since the tornado data from 1950–1953 are flawed due to incomplete efforts to archive them [32], we also exclude these 4-year data from consideration.
The tornado dataset (1954–2018) from NOAA’s National Weather Service Storm Prediction Center is used to generate the tornado count and day maps over the entire contiguous United States. The entire domain (60–130° W and 25–50° N) is divided into grid boxes with equal grid spacing at 1° latitude × 1° longitude. All (E)F1–(E)F5 tornado counts and days whose starting latitude and longitude fall into the latitude and longitude box are added up to arrive at the total tornado counts and days for the box. These counts and days are assigned to the center of the grid box. The gridded tornado data are then used to produce spatial distribution maps of tornado counts and days by Matlab software with smoothing of contours.

2.2. Statistical Methods

To determine if there is a geographical shift of tornado activities from one core area during an early period (referred to as group 1) to another core area over a later period (referred to as group 2), one would expect to have a maximized between-group distance, but a minimized within-group distance. The large ratio of the between-group distance to the within-group distance is therefore required. This ratio is proportional to a statistic t that will be illustrated in the next few paragraphs (see Equation (1)). Given the locations (latitude and longitude) of tornadoes in group 1, one can compute a geometric center of group 1 by performing an arithmetic average of tornado locations (latitude and longitude). Similarly, one can calculate a geometric center for group 2. The difference of the geometric centers between two groups is the between-group distance (see the numerator of Equation (1)) whereas the sum of distances between each individual tornado and its group geometric center is the total within-group distance (see Equation (2)). Within a group, the distance between each individual tornado and its group geometric center is approximately normally distributed (not shown).
To test that the geographical shift of the core area of tornado activities is statistically significant, we perform a t-test using the following procedures: (1) plotting contour maps of gridded (E)F1–(E)F5 tornado counts and days per 1° × 1° grid box over two 30-year periods of 1959–1988 and 1989–2018; (2) selecting a contour value (in ascending order) as the first guess so that geographic areas with this value or greater may be distinguished between these two time periods; (3) computing the within-group distances in the first group for the time period 1959–1988 and in the second group for the time period 1989–2018, and the distance between the first and the second groups, i.e., between-group; (4) computing a t value that is proportional to a ratio of the distance between two groups to the distance within the groups (see Equation (1)); (5) accepting a shift of tornado activities at a given statistically significant level α if t > tα, or repeating processes (1)–(5) until t > tα is satisfied for the selected contour value. Otherwise, the shift of tornado activities is not statistically significant.
The statistical difference between two group means over two 30-year periods can be determined using a t test by computing statistic t [33]:
t = y ¯ 2 y ¯ 1 s 1 n 2 + 1 n 1
where n 1 and n 2 indicate the size of group 1 and 2, y ¯ 1 and y ¯ 2 are the sample means (i.e., the geometric centers) of group 1 and 2, respectively, and s is the estimated standard deviation defined as:
s = i = 1 n 2 ( y i 2 y 2 ¯ ) 2 + i = 1 n 1 ( y i 1 y 1 ¯ ) 2 n 2 + n 1 2
Under the null hypothesis Ho, Equation (1) has a t distribution with n 1   +   n 2   − 2 degree of freedom. When applying this t test to examine if there is a geographic shift of the (E)F1–(E)F5 tornado activities over two different climate periods with colder (group 1) and warmer (group 2) conditions, we deal with a two-dimensional variable of tornado activity location denoted by (longitude, latitude). The difference between two sample means of group 1 and 2 refers to the distance between the geometric center of group 1 tornado activities and the geometric center of group 2 tornado activities. The estimated standard deviation is calculated by adding the distances inside each group. Within each group, the distance is computed between individual tornado location and its own group’s geometric center.
Using the NCEP-NCAR (National Centers for Environmental Prediction-National Center for Atmospheric Research) monthly mean reanalysis data (2.5° × 2.5° horizontal resolution) [22], we perform composite analyses to arrive at insights into the large-scale environments associated with tornado activities, especially during a warm period of 1989–2018 and a cold period of 1959–1988. The meteorological parameters used in the composite analyses include surface and upper air temperature, mean-sea-level pressure, specific humidity, horizontal winds, and vertical velocity.
We also employ the high resolution North American Regional Reanalysis (NARR) monthly mean data (~32 km horizontal resolution) [17] for composite analyses to understand the synoptic- and meso-scale environments favorable for tornado development, particularly for high and low tornado activity years. Although these environments have been identified in case studies, numerical simulations, and other climatological analyses [18,19,20,21], they have not been documented in a climate composite analysis of difference between the high-event and low-event years of tornado activity. These climate analyses may in turn help long-term anticipation of tornado activities.
To take into consideration the tornado intensity (i.e., EF scales) in the composite analyses of high and low tornado activity years, we introduce the concept of intensity weighted tornado number (IWTN). Since tornado EF scales are essentially estimated by damage, which is related to wind speed ( V ) (no measurements) [32], the weights of tornado intensity for each category of tornadoes from EF1 to EF5 are defined as ratios of median kinetic energy ( 1 2 V 2 ) for each category to the median kinetic energy for EF5 tornadoes. On the other hand, using V 3 represents the destructive power of tornadoes, similar to the power dissipation of hurricanes [34]. After assigning these weights (Table 1), we have the intensity weighted tornado number (IWTN):
IWTN = i = 1 n W i × T i ,
where Wi is the weight for category i tornado, Ti is the number of tornadoes belonging to category i, and n equals 5. The IWTN is used to choose 10 high and low event years for tornado activities.

3. Results

3.1. Geographic Shift of U.S. Tornado Activities in A Warming Climate

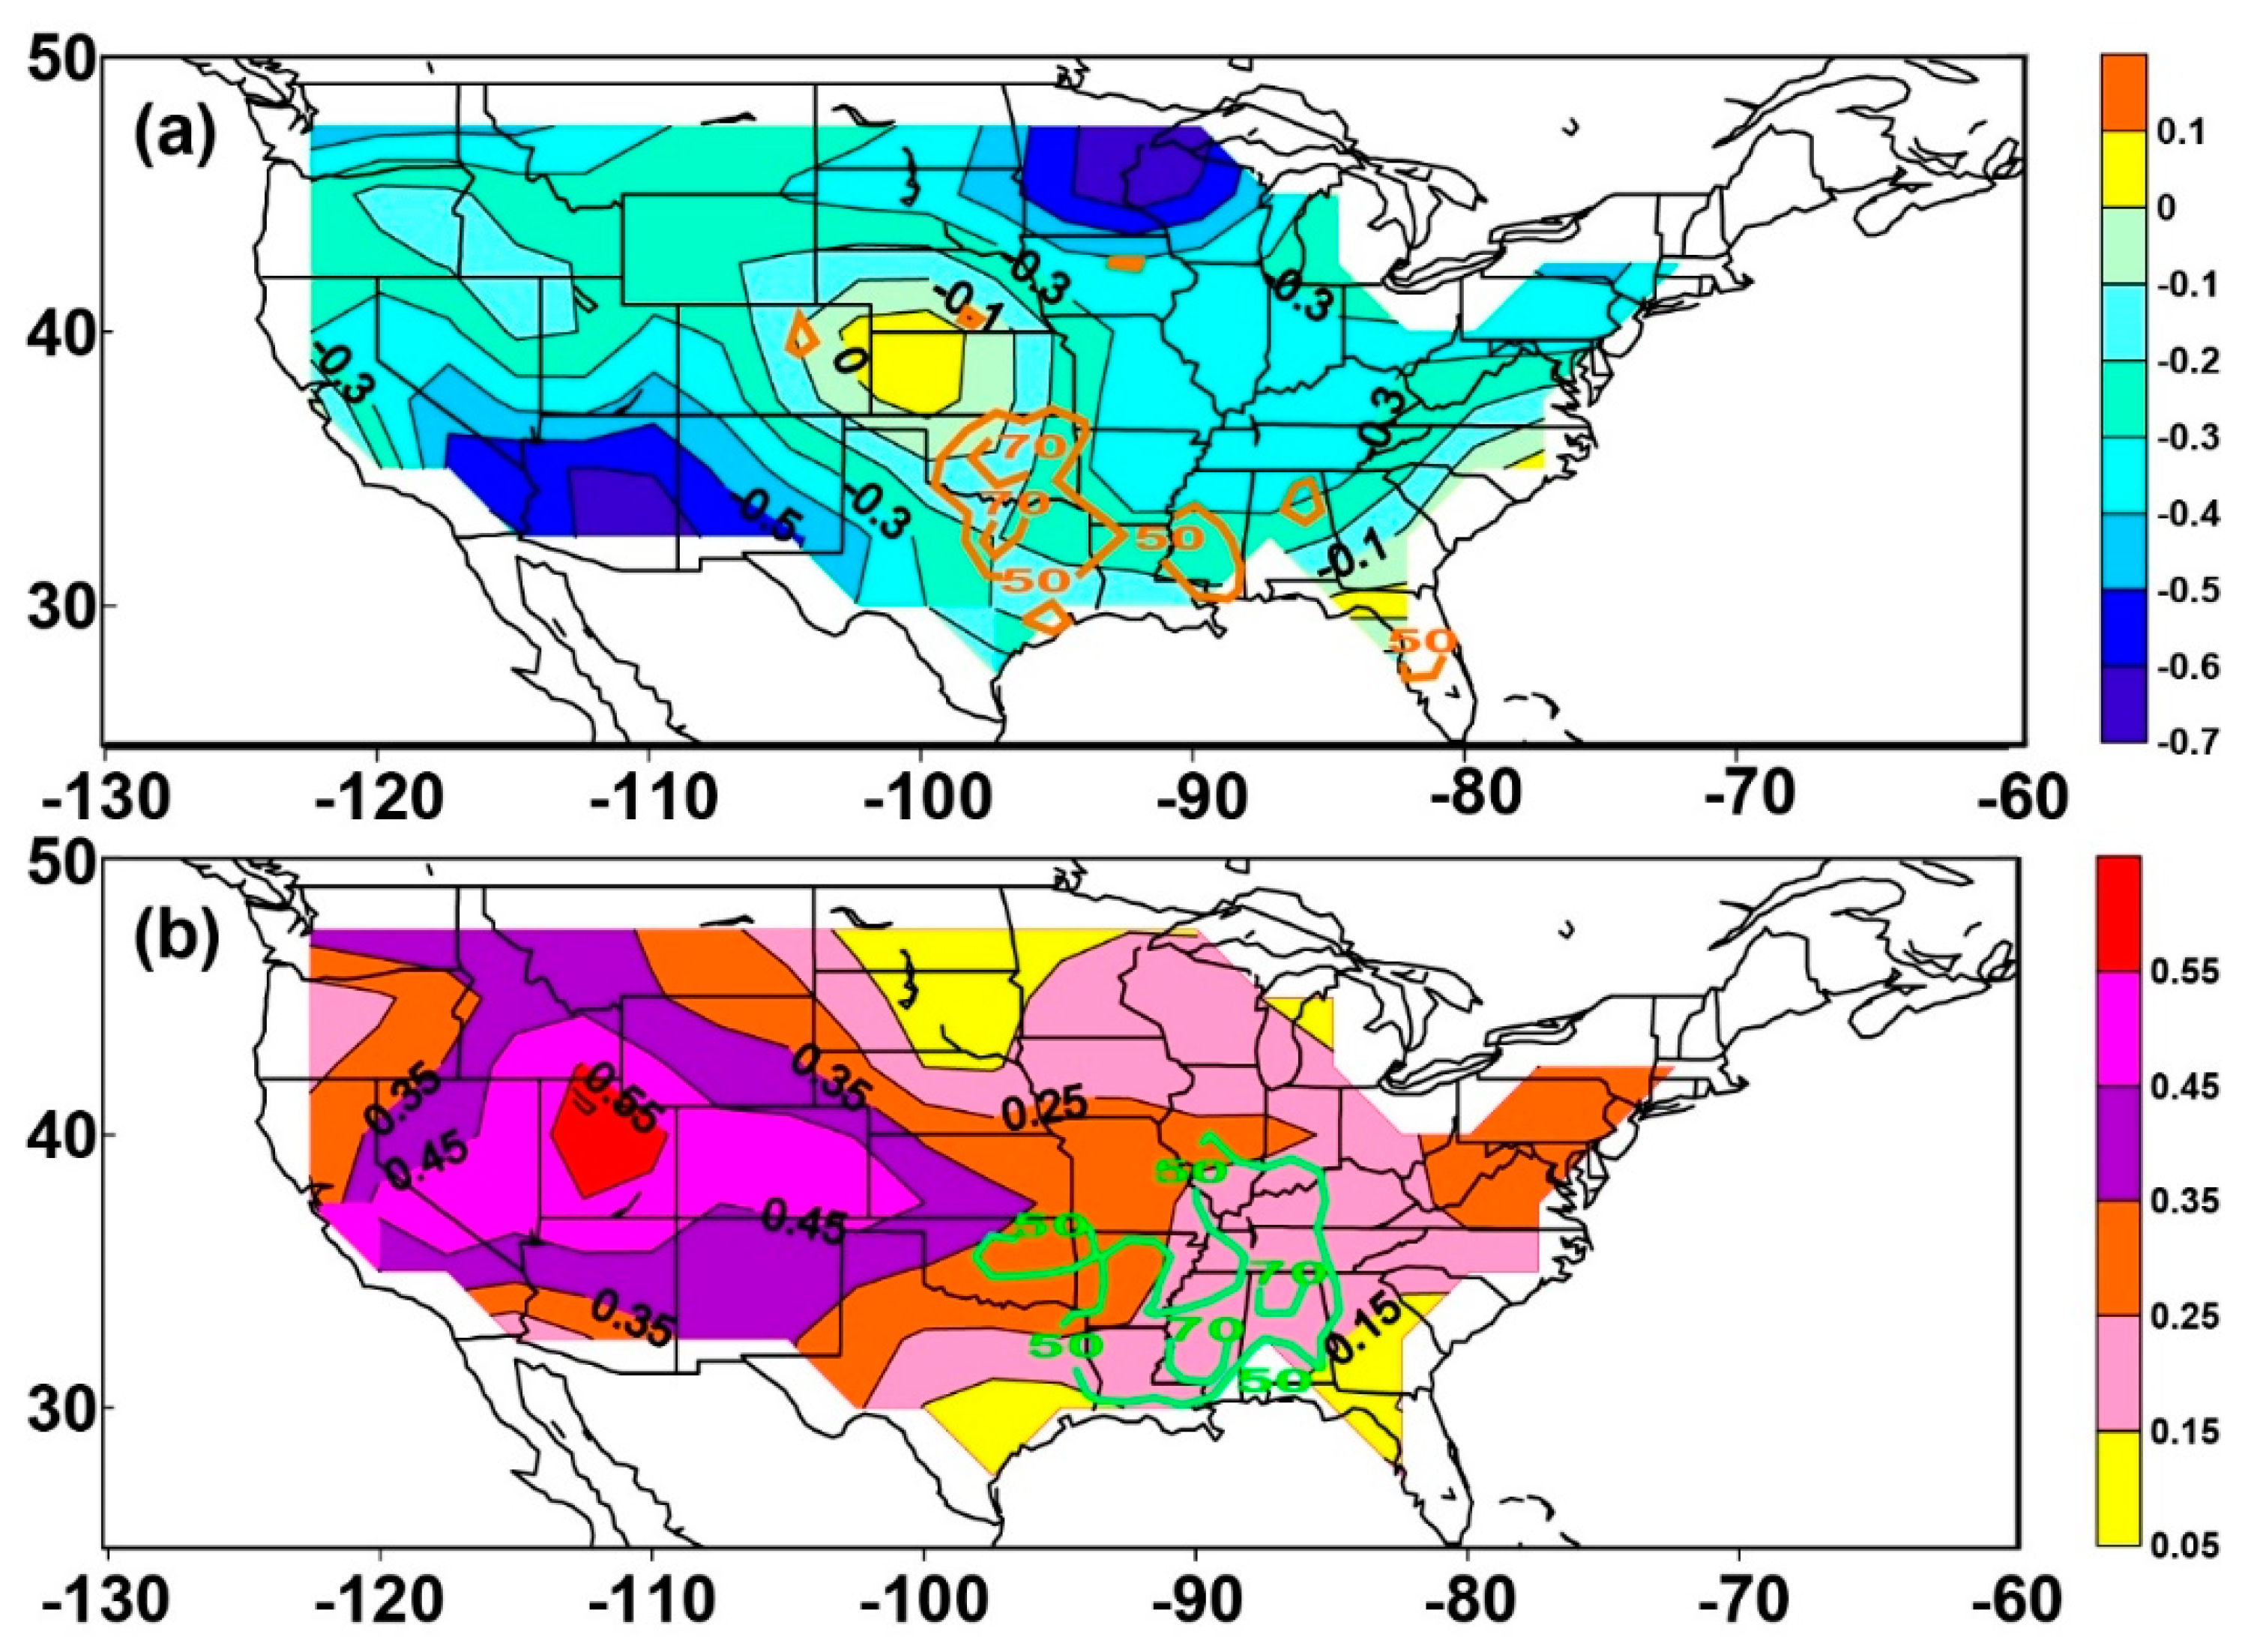
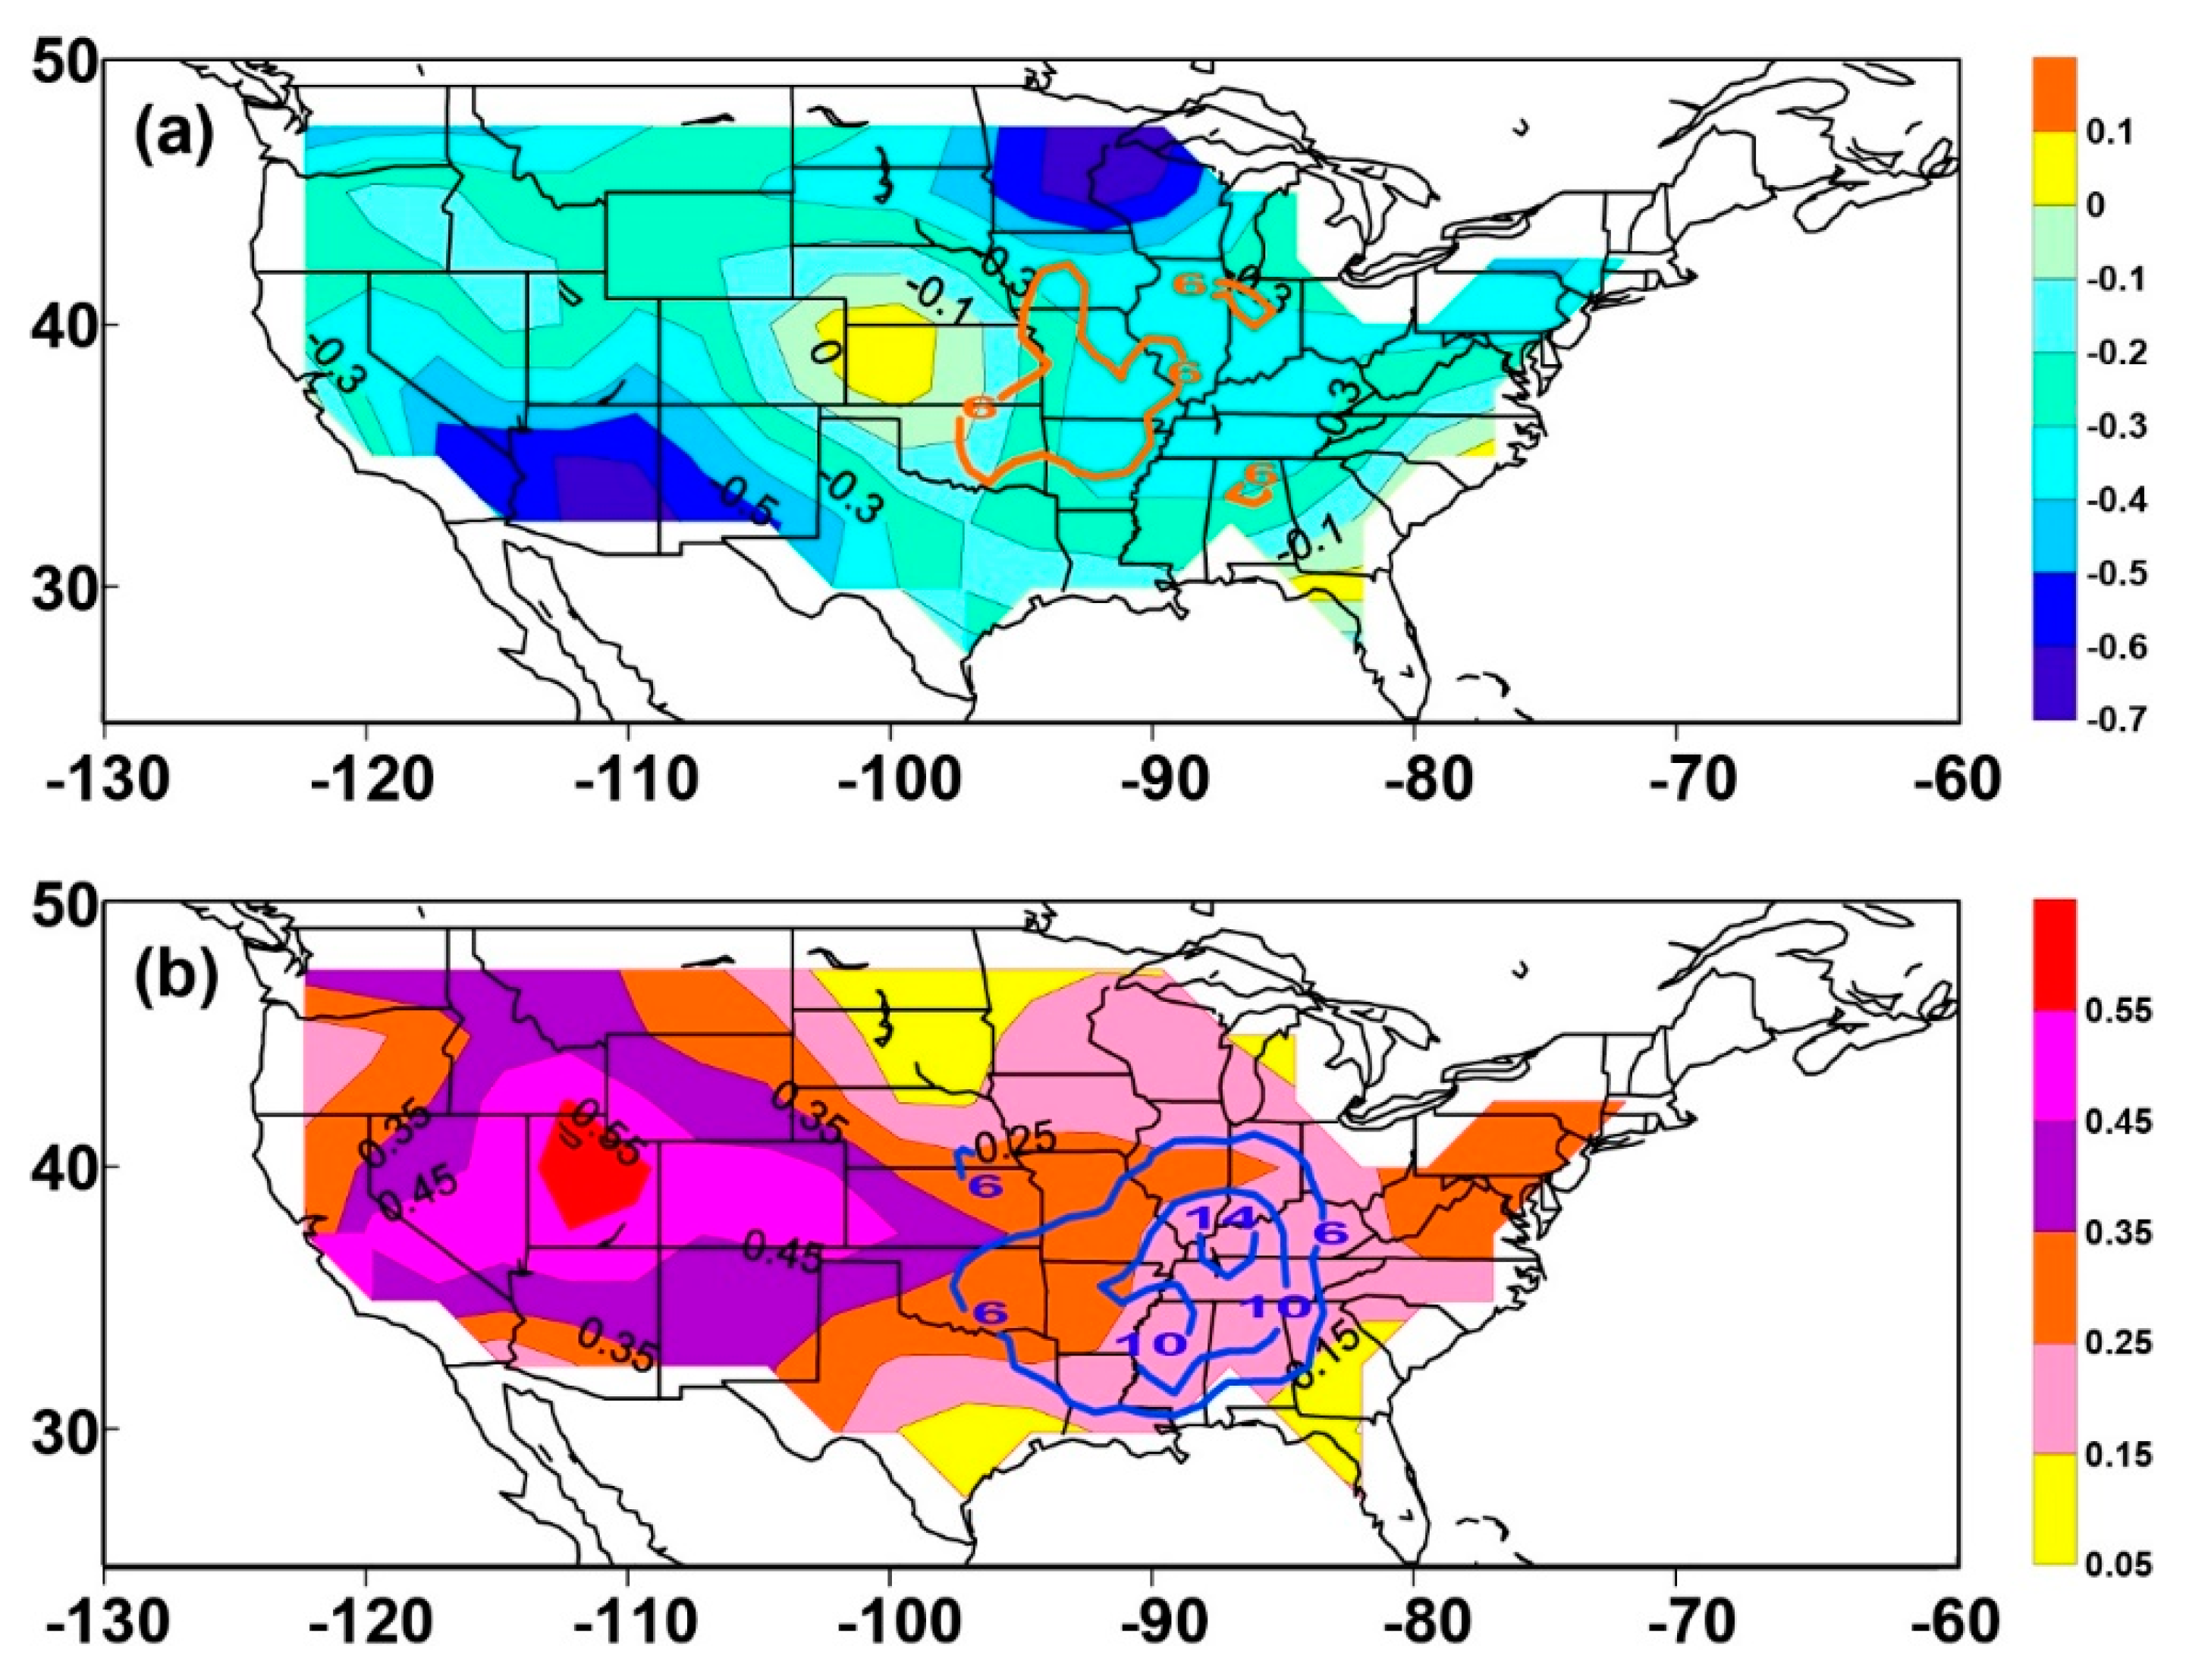
As shown in Figure 1, the entire continental U.S. has recently been experiencing an upward warming trend of surface air temperature. In this section, we focus on changes in geographic locations of the U.S. tornado activity center (i.e., Tornado Alley) for (E)F1–(E)F5 under a regime change from a cold climate to a warm climate. To do so, we divide the data (covering the entire continental U.S., 60–130° W and 25–50° N) into two successive 30-year periods (1959–1988 and 1989–2018), and for each period we generate tornado number maps over the entire contiguous United States. Using the NCEP-NCAR monthly mean reanalysis data [22], we perform composite analyses (January to December) of surface and upper air temperature anomaly (with respect to the climate mean of 1981–2010) over these two 30-year periods (Figure 2 and Figure 3). The time period used to define climate mean is the same as that used at the NCEP website. Note that what time period is used to define climate mean, this has no effect on the anomaly differences of variables between the two 30-year periods.
The criteria to distinguish a colder period (1959–1988) from a warmer period (1989–2018) are that both surface and upper-level air temperatures over the entire contiguous U.S. during the period of 1989–2018 are warmer than those during the period of 1959–1988. It is evident that the surface air temperature anomalies over the entire contiguous U.S. during the period of 1989–2018 (Figure 2b) are warmer than those during the period of 1959–1988 (Figure 2a). These differences are also clearly reflected at upper levels such as 500 (Figure 3) and 250 hPa (not shown). The core area of tornado activities (in orange color) over the colder period of 1959–1988 are mostly located in the traditional tornado activity center of Texas and Oklahoma [15], with very small areas in Mississippi and Florida (Figure 2a), whereas over the warmer period of 1989–2019 it has shifted eastward, northeastward, and southeastward to a new tornado activity center (in green color) of Arkansas, Louisiana, Mississippi, Alabama, Tennessee, Kentucky, and Illinois, as well as a shrinking area of Oklahoma (Figure 2b). Here, the Tornado Alley is defined as the core area of gridded (E)F1–(E)F5 tornado counts of 50 or more per 1° × 1° grid box over a 30-year period. This geographic shift of the core area of (E)F1–(E)F5 tornado activity center is in association with regime changes from a colder to a warmer climate (Figure 2 and Figure 3), and the shift is statistically significant (see next paragraph). In the new tornado activity center, we identify seven major states: Arkansas, Louisiana, Mississippi, Alabama, Tennessee, Kentucky, and Illinois. Although a previous study [15] identified two of these (Alabama and Tennessee), the five new areas (Arkansas, Louisiana, Mississippi, Kentucky, and Illinois) are discovered in the current work. These differences are caused by different methods used in the previous study [15] and the current work. Different from similarity measurements using correlation coefficients [15], our method of discriminant analysis uses the distance to measure how far from each other are two core areas of gridded (E)F1–(E)F5 tornado counts per 1o × 1o grid box over a 30-year period, which is intuitive and easy to visualize and utilize.
We systematically carry out a series of tests for contour values of tornado counts in an ascending order. To pass a significant-statistical test, it is required to have a large distance between groups 1 and 2 but a small distance within each group, resulting in a large t value according to Equation (1). The larger the contour value, the higher the t value and the higher possibility of passing a t test. Based on our computations, for a given threshold of the contour value passing the statistical test at a given statistically significant level, say 95%, all other thresholds of the contour values larger than the given threshold also pass the statistical test, at least at the same level. In the neighborhood of threshold (say 50 counts of tornadoes) passing the statistically significant test, we increase the frequency of statistical tests, for example, at contour values of 48, 45 and 40 counts. As a result, a contour value such as 48 only passes at a statistically significant level of 90%, but the contour values of 45 and 40 do not pass the statistical test even at a level of 90%. When the contour value of 50 is assigned, however, our computations show that the statistic t is equal to 2.6 (> t 0.05 = 1.97) with the statistically significant level of 95% and 151 (=83 + 70 − 2) degrees of freedom. A contour value greater than 50 is also statistically significant at a level of at least 95%. Therefore, the geographic shift of the core area of (E)F1–(E)F5 tornado counts 50 or more per 1° × 1° grid box over a 30-year period is statistically significant. This shift is mainly from the region of Texas and Oklahoma, in the Great Plains, during the colder period to the area of Arkansas, Louisiana, Mississippi, Alabama, Tennessee, Kentucky, and Illinois, as well as a shrinking area of Oklahoma during the warmer period (Figure 2).
The tornado activity center shifts are not sensitive to any single major tornado outbreak. For example, if all tornadoes that occurred in a single major tornado outbreak on 25–28 April 2011 are removed, the geographic shift of the tornado activity center is still statistically significant.
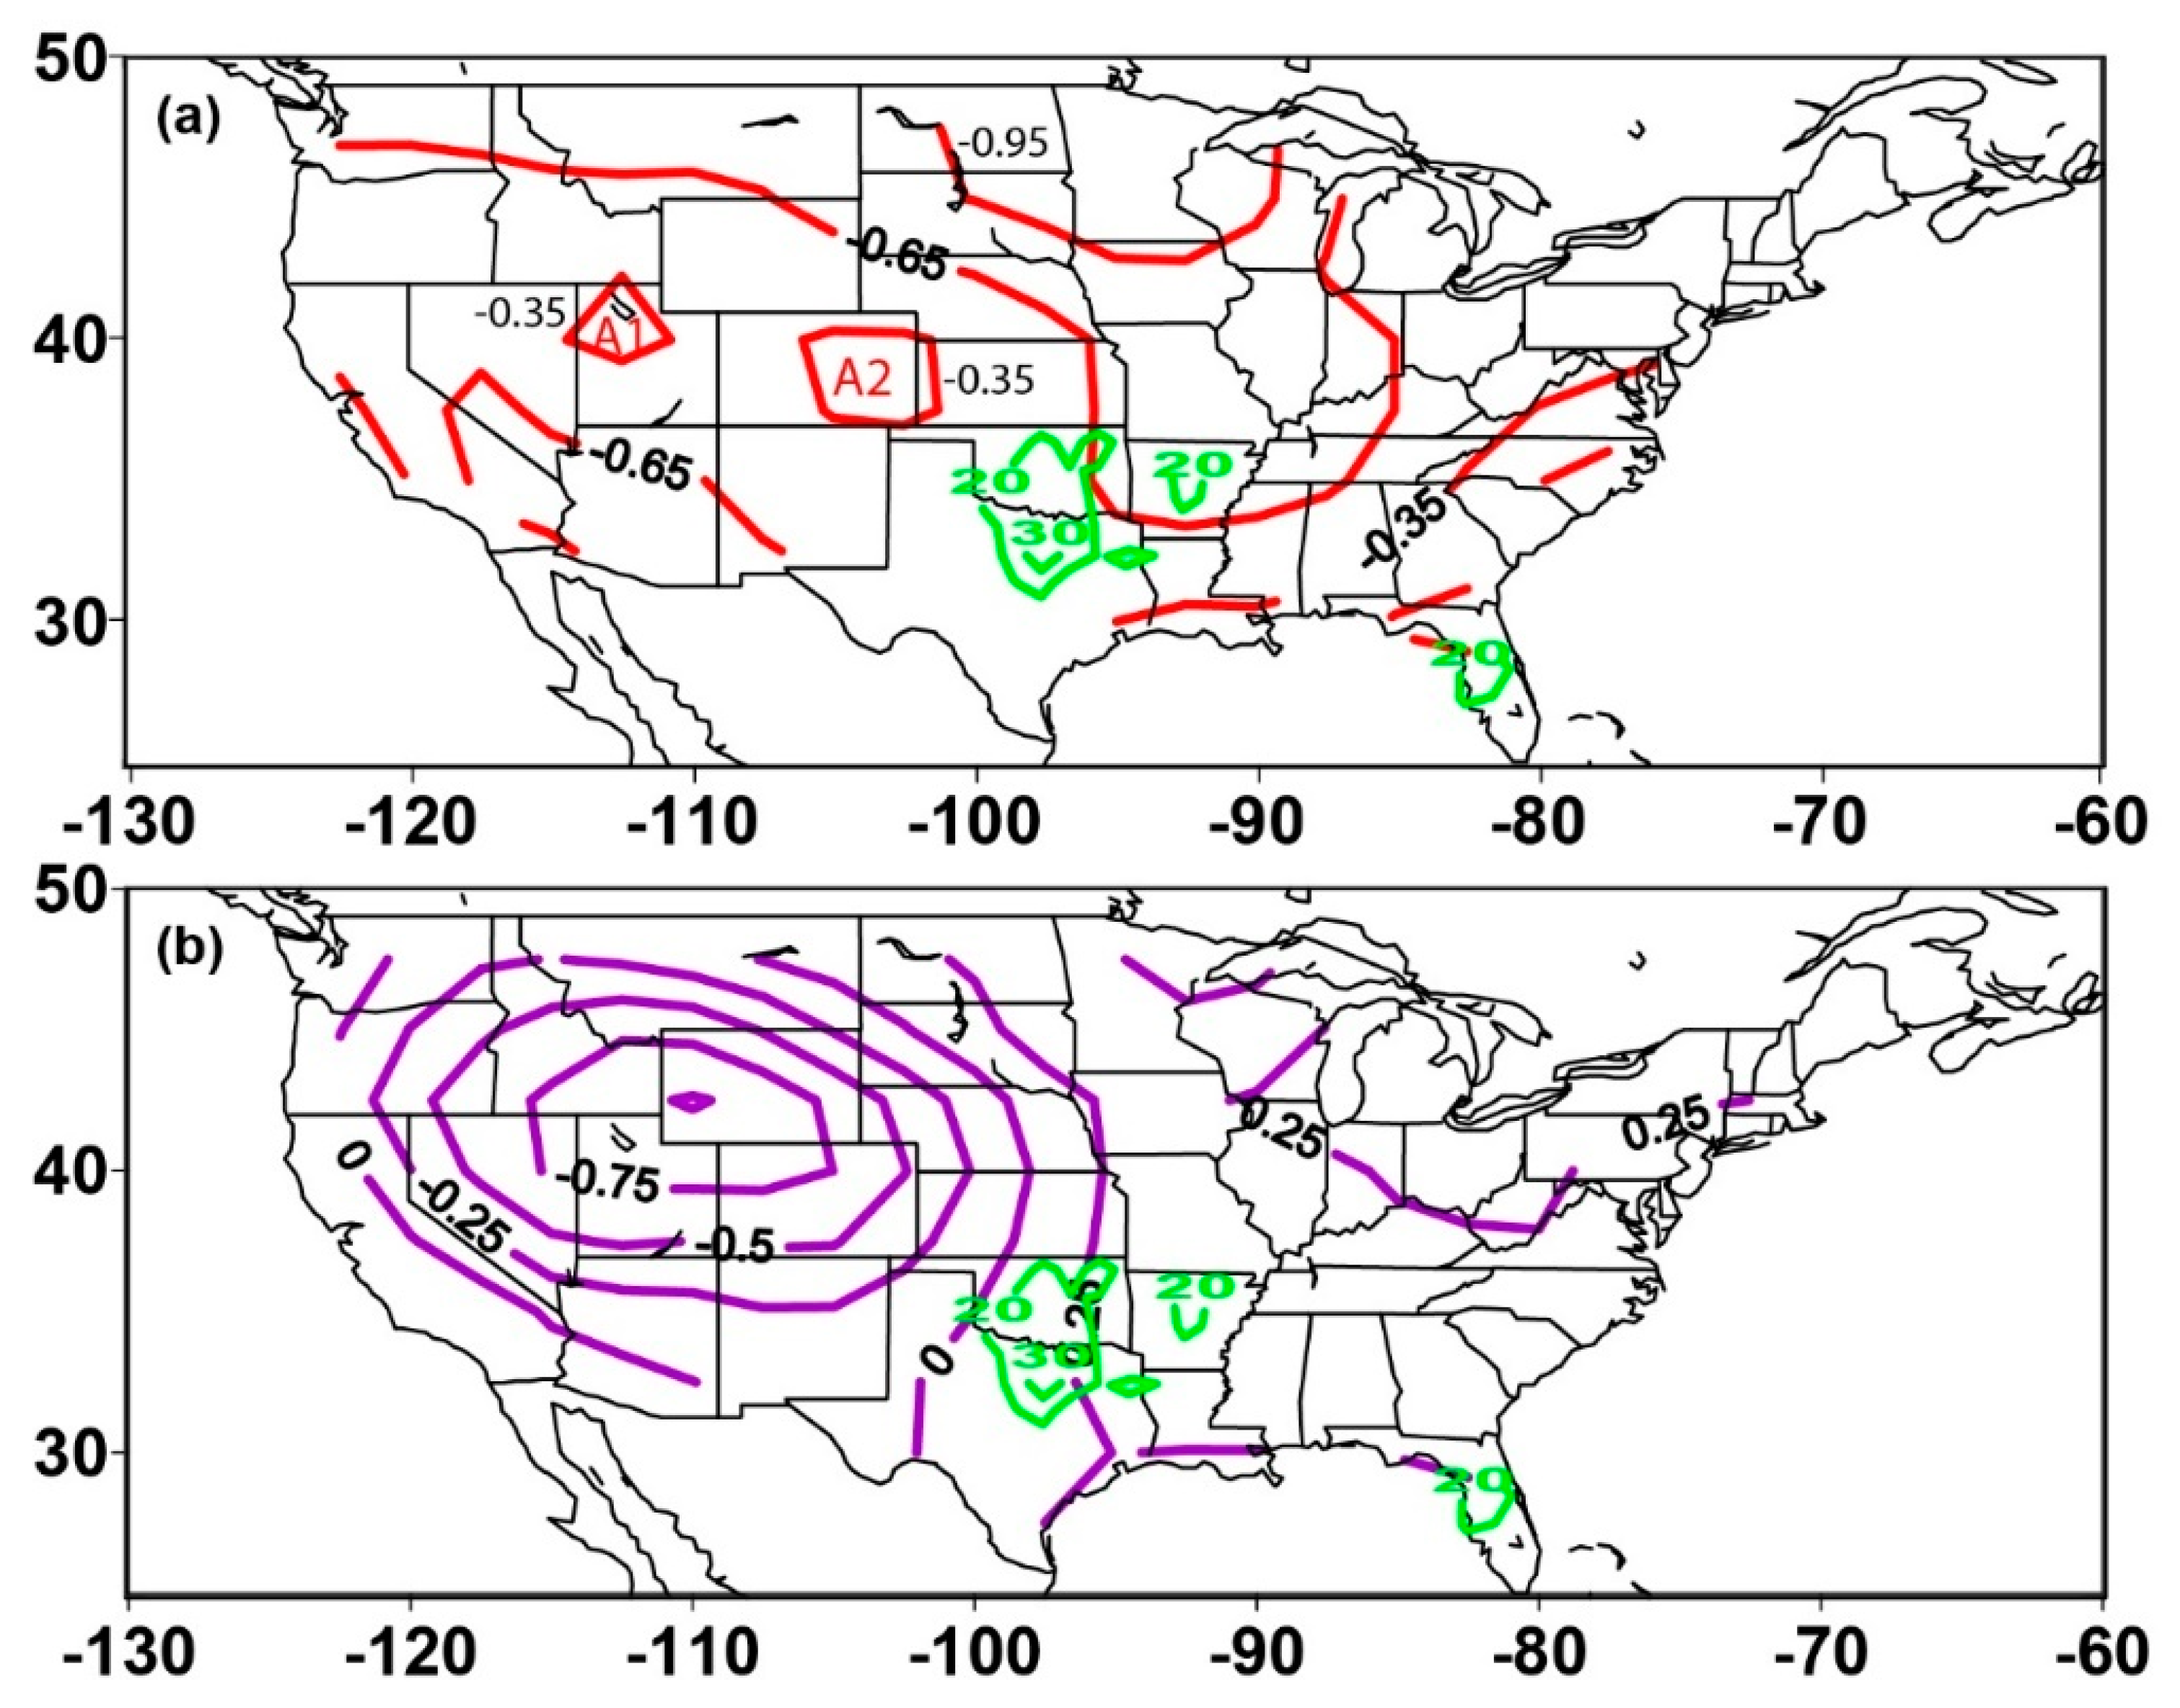
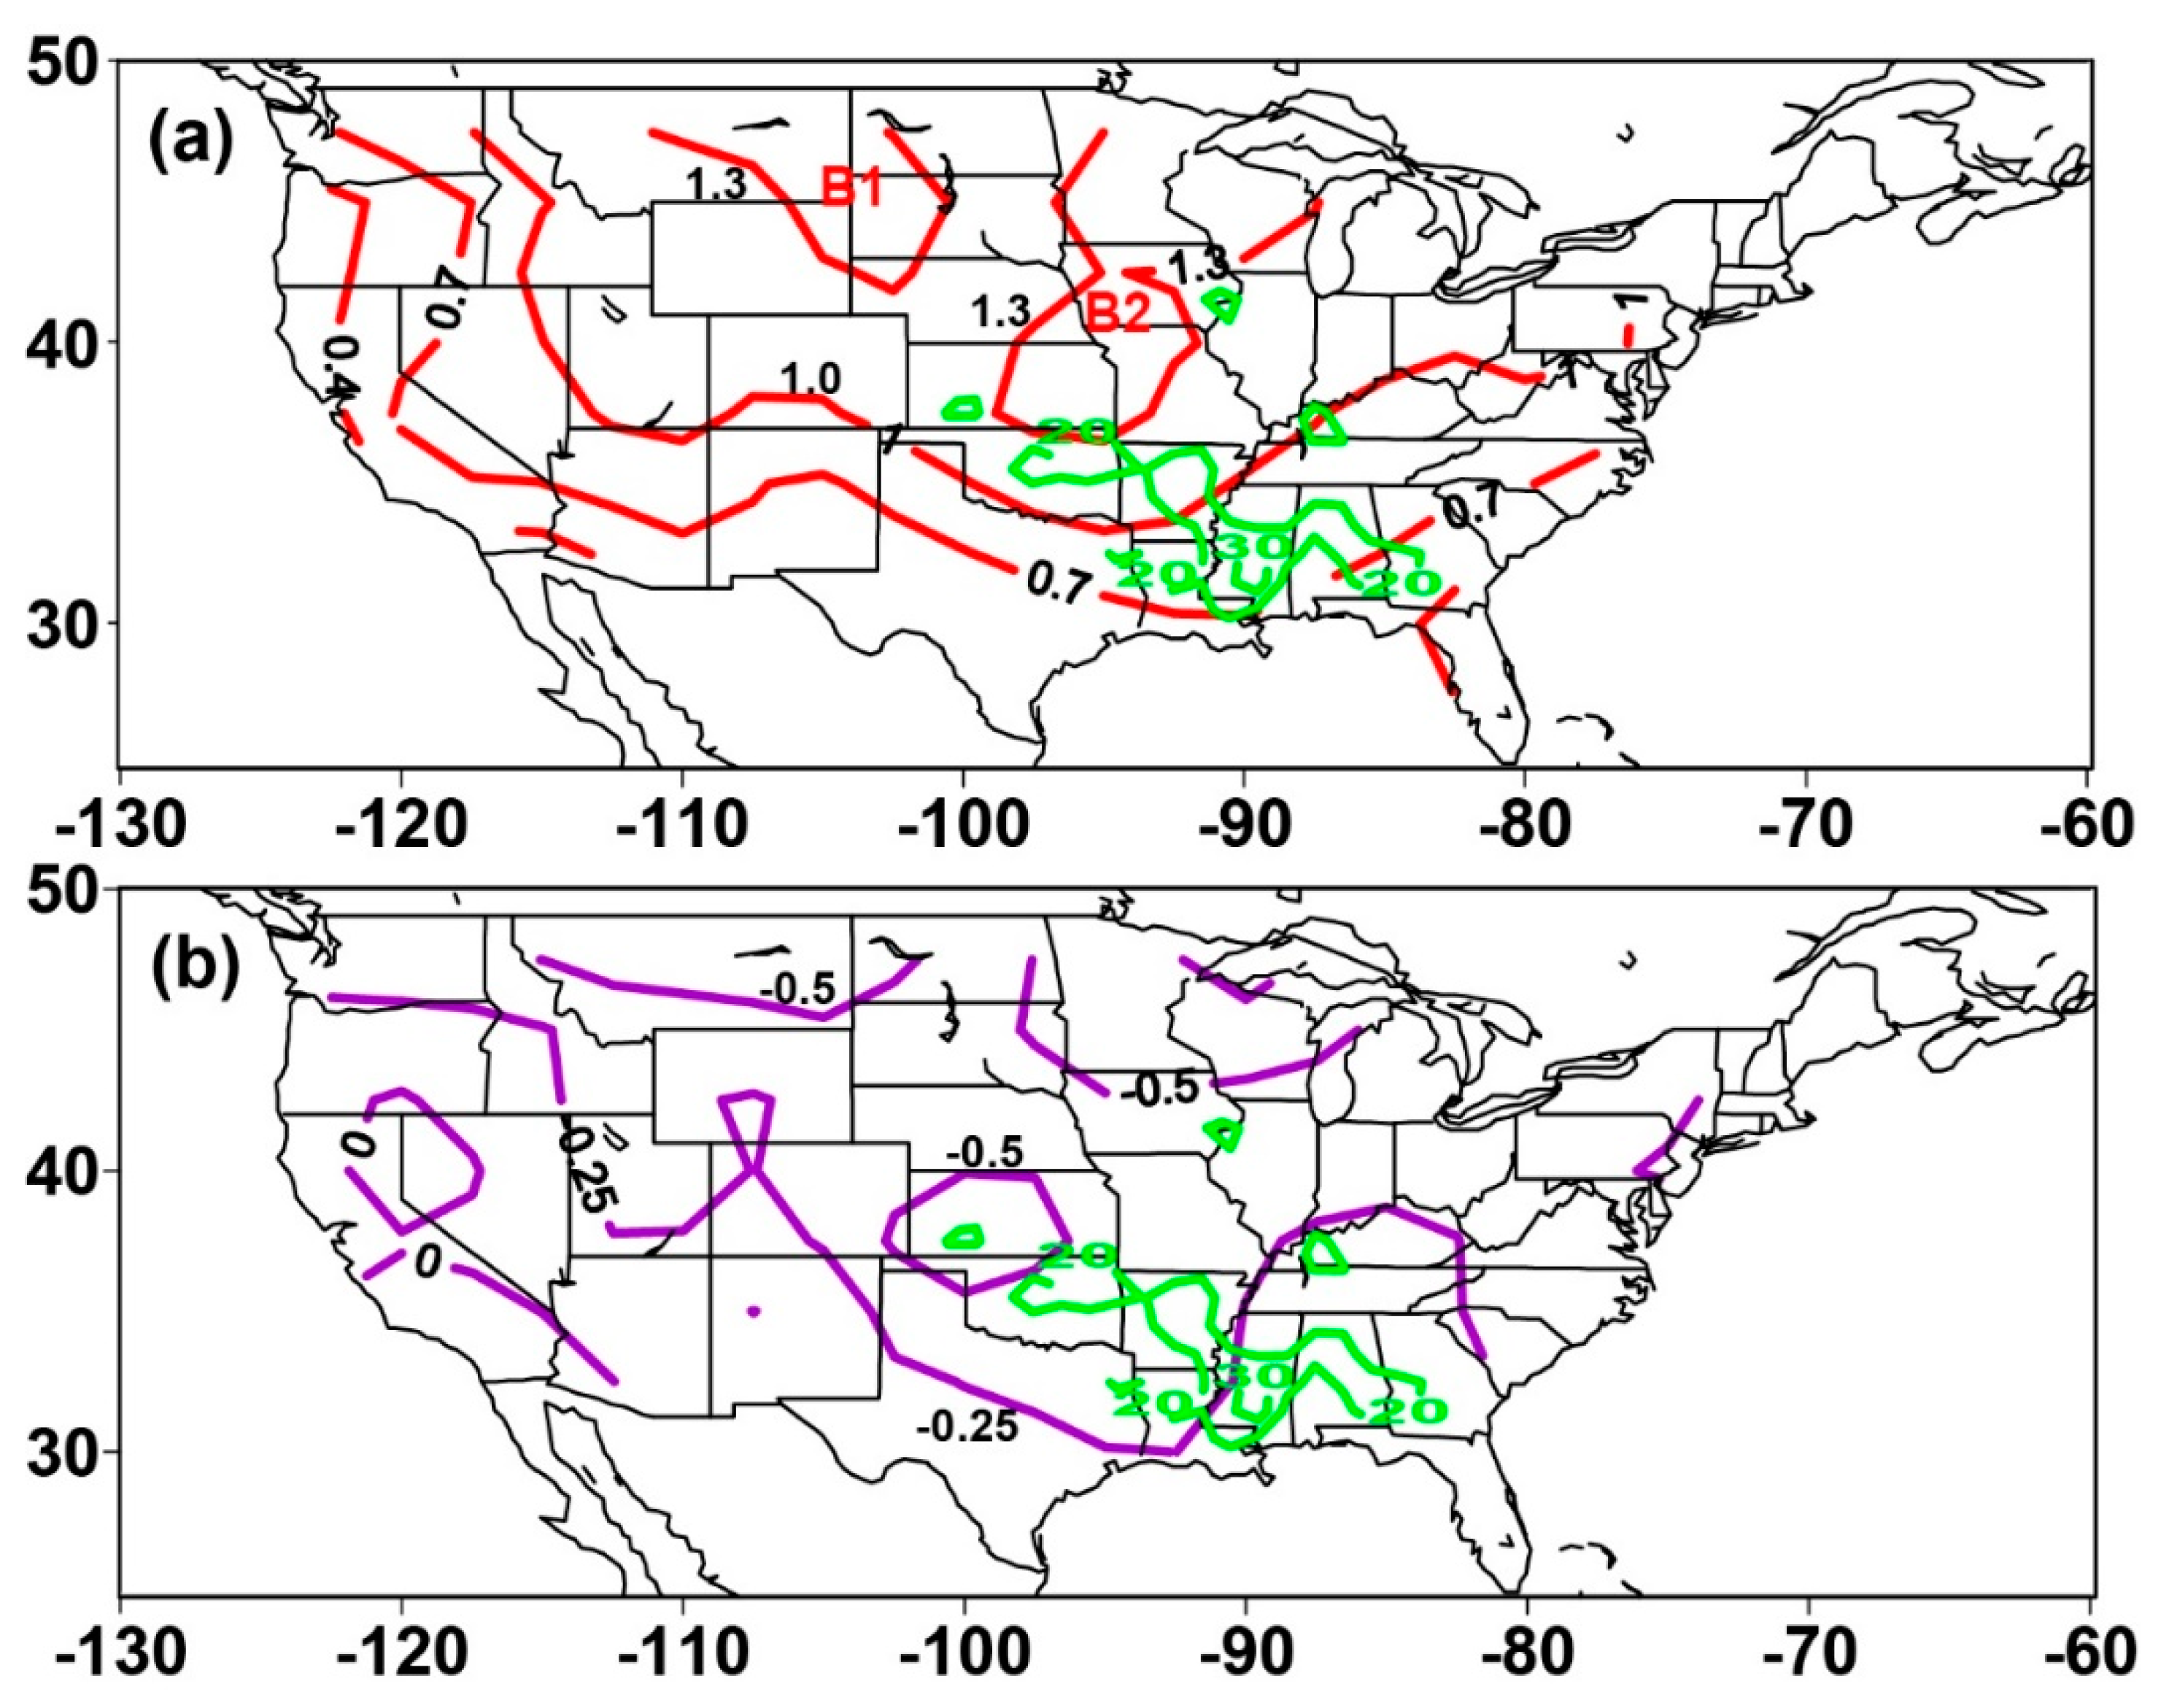
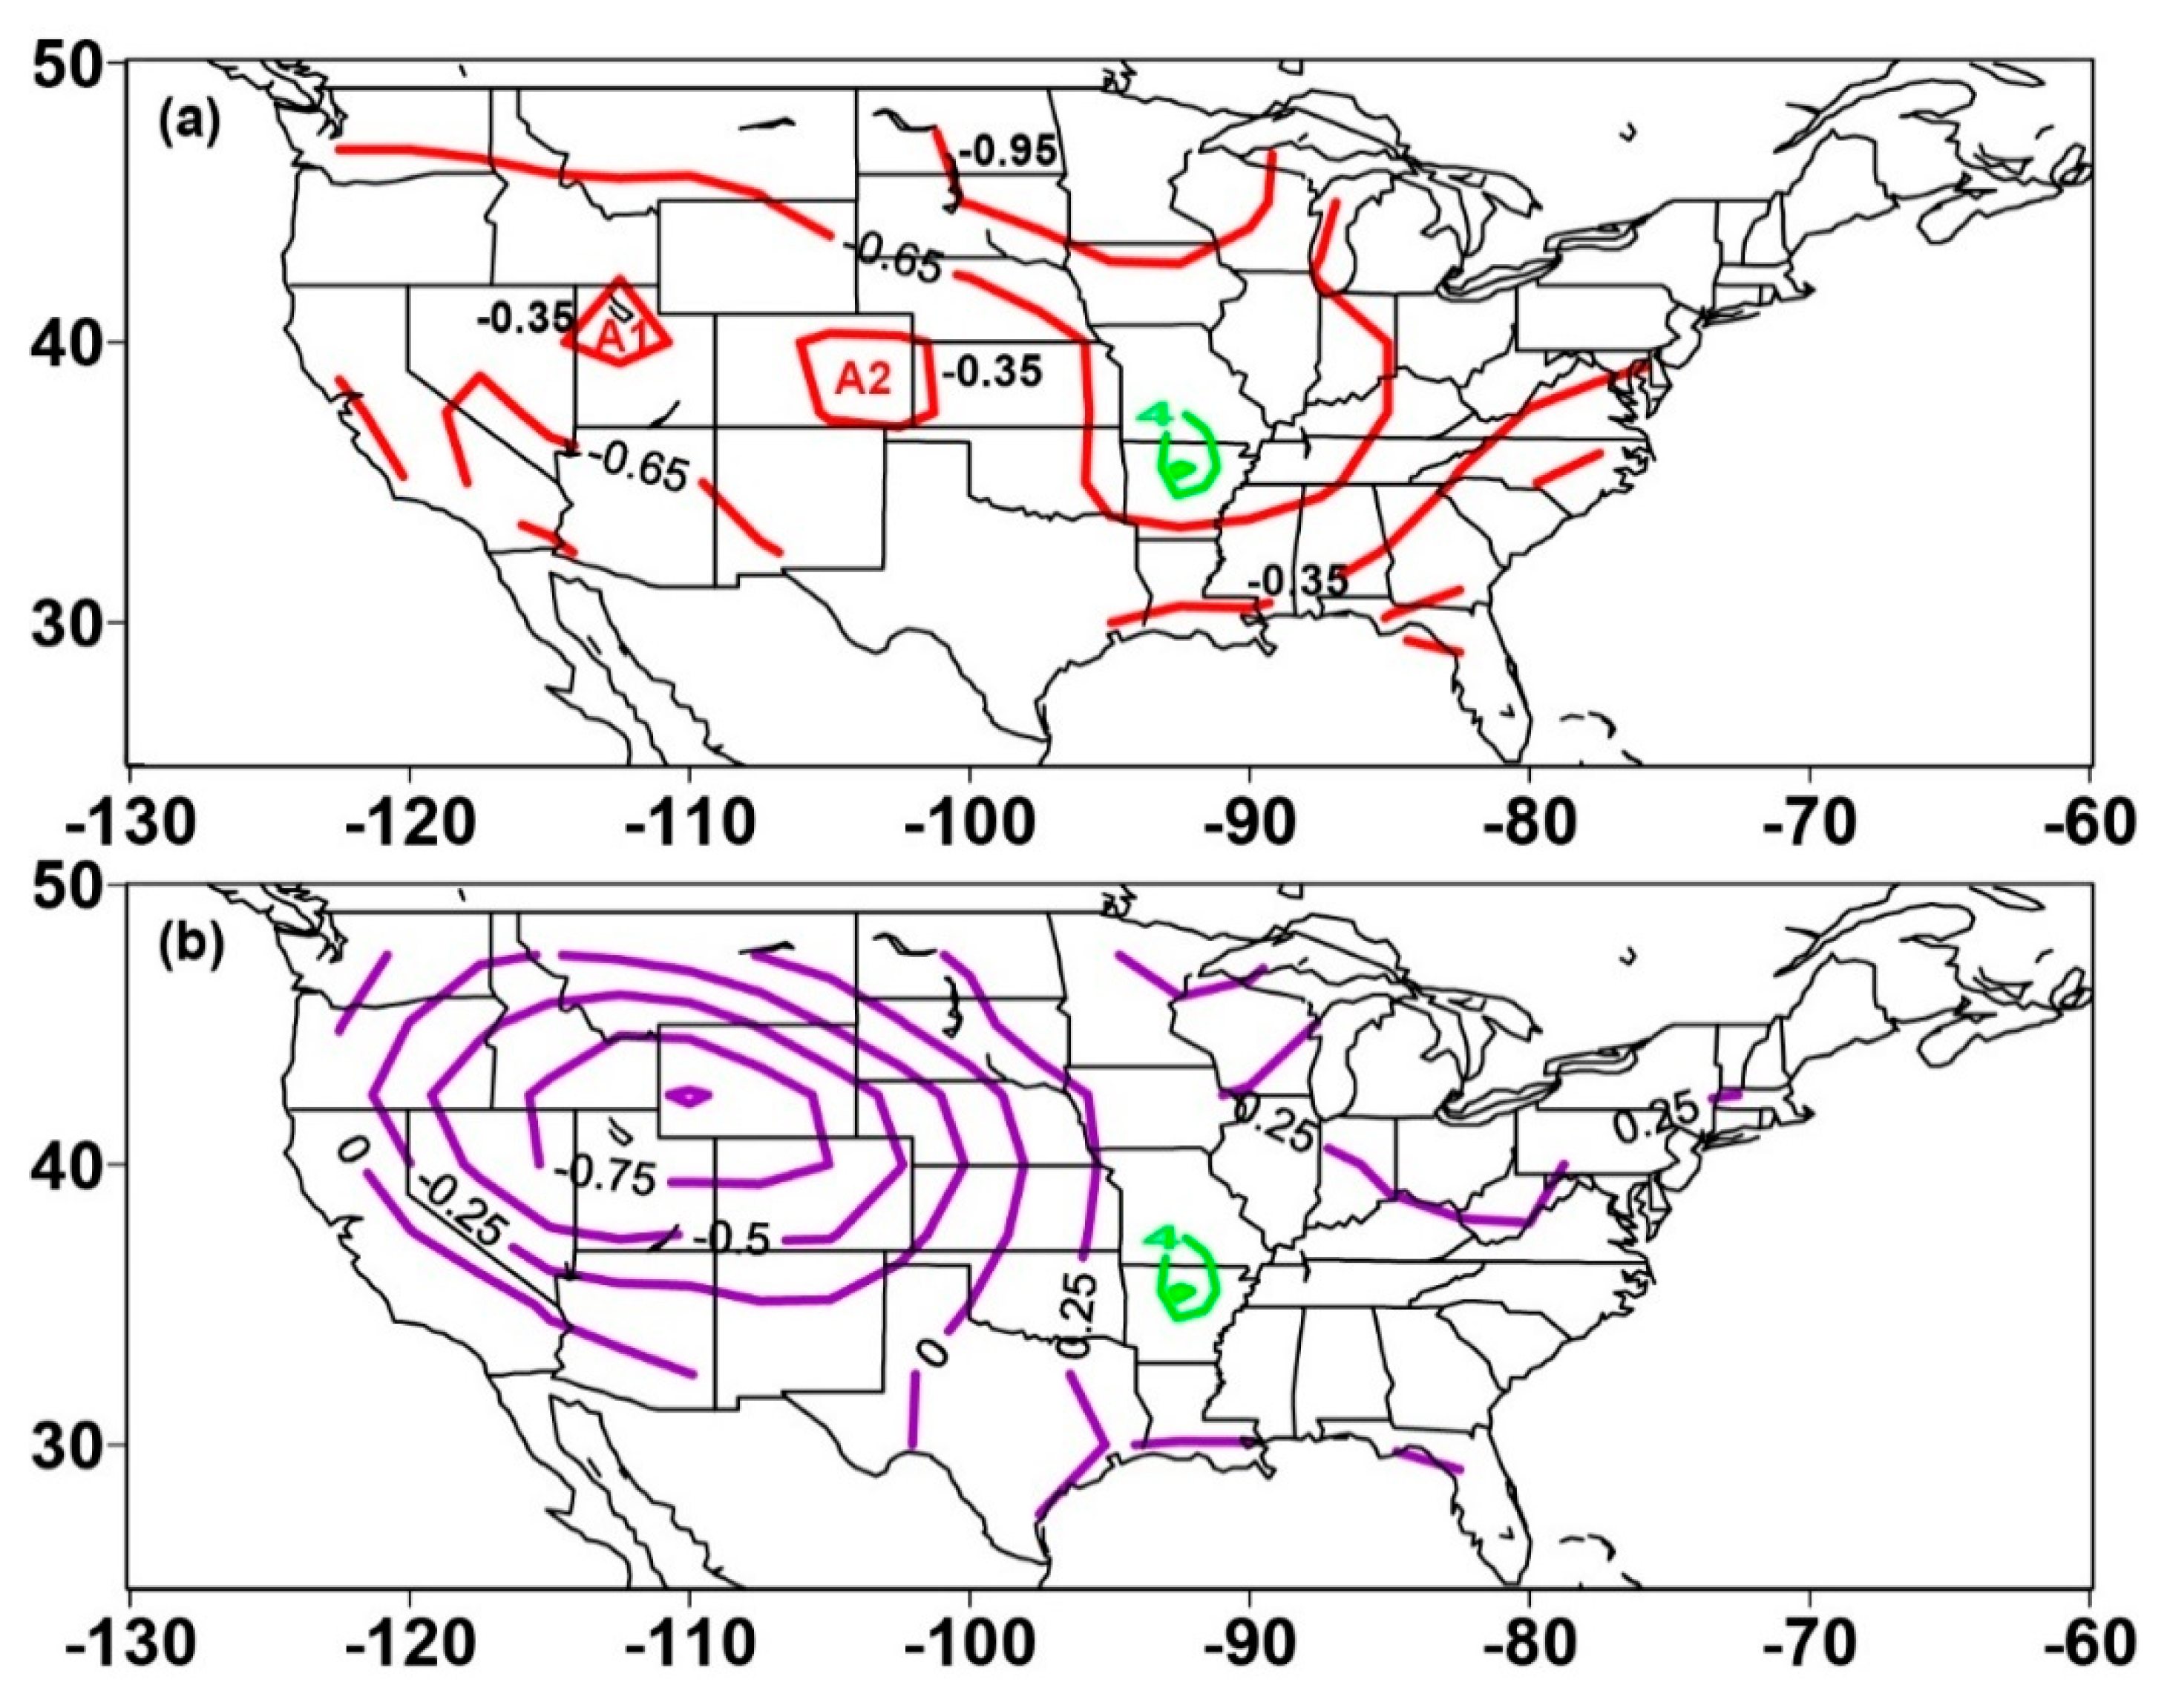
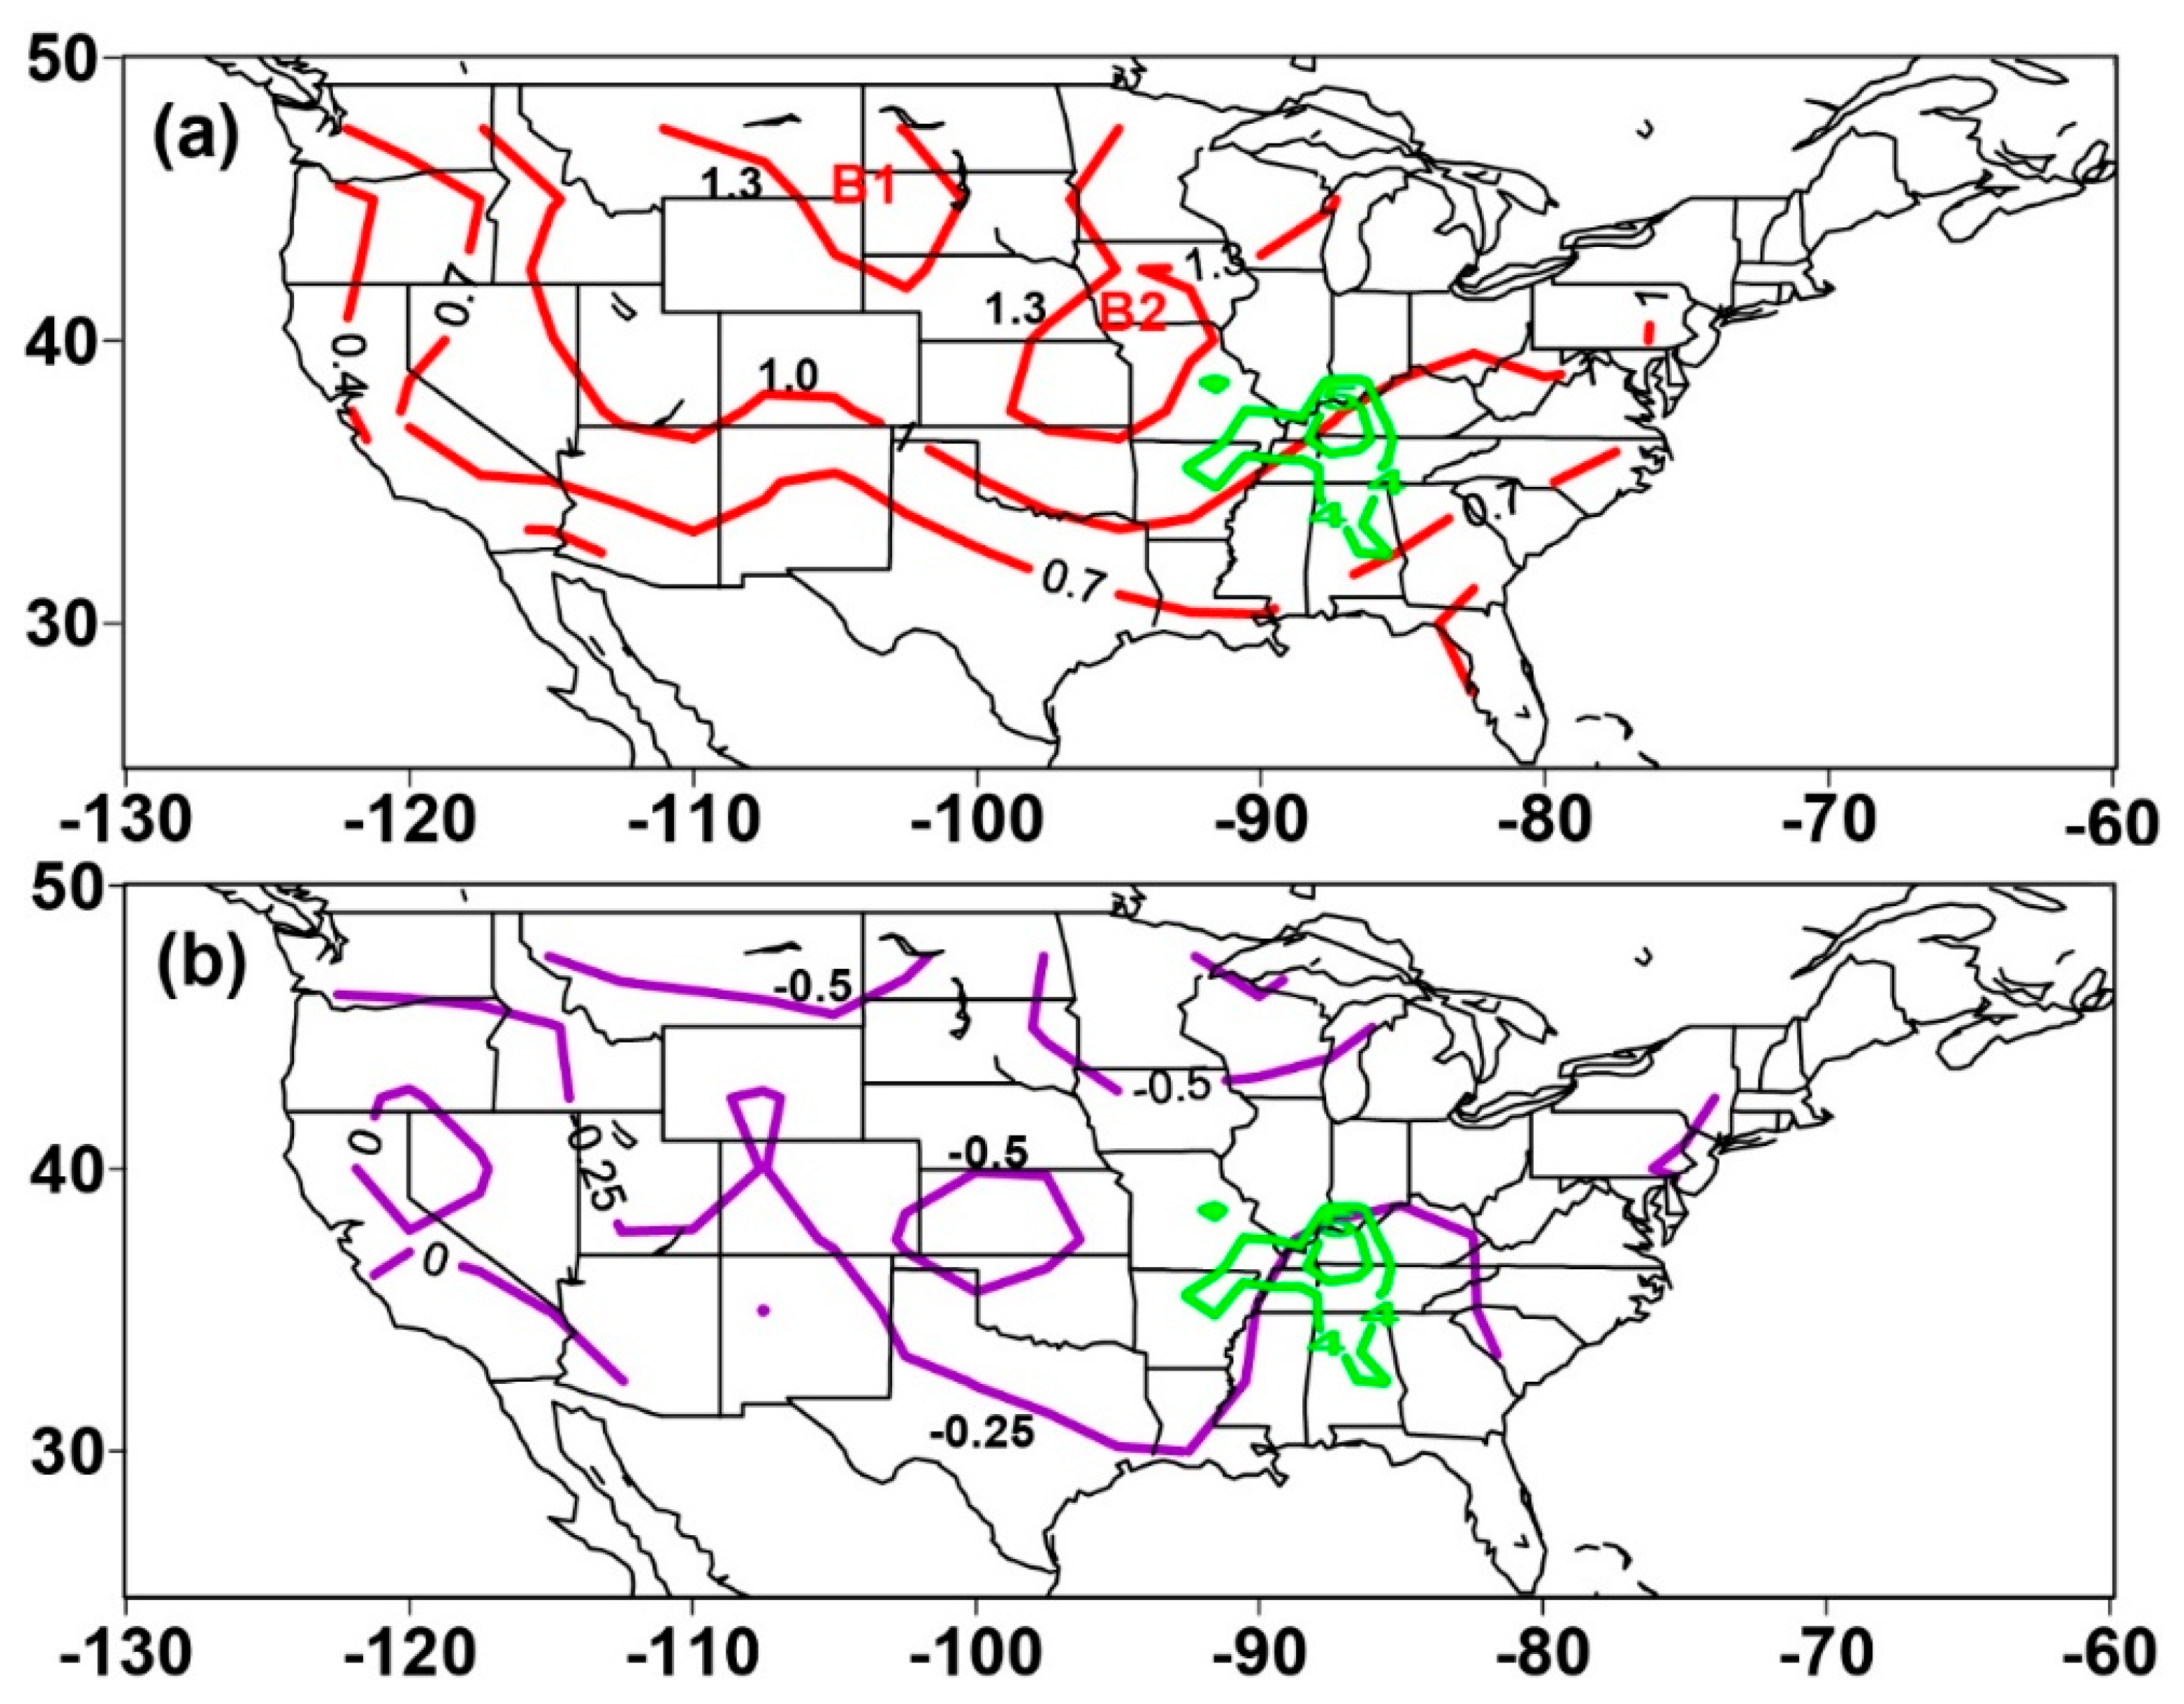
To gain further physical understanding of the cold and warm climates associated with the spatial shift in tornado activities, we perform composite analysis [33,35] based on the 10 warmest and coldest years of anomalous U.S. surface air temperature (Figure 1), because these strong anomalous years satisfy a common requirement of an anomaly magnitude greater than one standard deviation. The 10 strongest positive anomaly years are 2012, 2016, 2017, 2015, 2006, 1998, 1999, 2001, 2007, and 2005, referred to as the warmest years, and the 10 strongest negative anomaly years are 1979, 1978, 1985,1968, 1982, 1972, 1960, 1976, 1966, and 1975, referred to as the coldest years (Figure 1). In the coldest years, the tornado activities are mainly located in the traditional Tornado Alley (Figure 4a) whereas in the warmest years, the tornado activities have shifted eastward, northeastward and southeastward (Figure 5a). The relatively warm centers (labelled A1 and A2 in the coldest years and B1 and B2 in the warmest years, respectively) shift eastward, northeastward, and southeastward (cf. Figure 4a and Figure 5a). Meanwhile, the tornado activity shifts eastward, northeastward, and southeastward (cf. Figure 4a and Figure 5a). It is interesting to note that, in the warmest years, the difference of temperature anomaly across the core area of tornado activity is about 0.6 °C (Figure 5a), whereas in the coldest years the difference of temperature anomaly across the core area of tornado activity is about 0.25 °C (Figure 4a). The former is about two times the latter. This increased north–south anomalous temperature gradient in the warmest years means stronger baroclinicity for tornado activities than in the coldest years. In the meantime, low pressure centers are well co-located with the relative warm centers in both the coldest (cf. Figure 4a,b) and the warmest (cf. Figure 5a,b) years. With the relative warm centers shifting eastward, northeastward, and southeastward from the coldest period (labelled with A1 and A2 in Figure 4a) to the warmest period (labelled with B1 and B2 in Figure 5a), the low-pressure systems shift eastward, northeastward, and southeastward (cf. Figure 4b and Figure 5b). As a result, in the coldest years, tornado activities are mainly distributed ahead of the low-pressure system (Figure 4b) while in the warmest years, tornado activities are located near and ahead of the low-pressure center (Figure 5b). Similarly, the mean-sea-level pressure anomaly difference across the core area of tornado activity in the warmest years is greater than that in the coldest years (cf. Figure 4b and Figure 5b), indicating that the former is associated with more cyclonic circulations than the latter. This also suggests that the zonal gradient of pressure differences creates warm and moist southerly flow from the Gulf of Mexico in the lower troposphere which fuels convection in the new Tornado Alley.
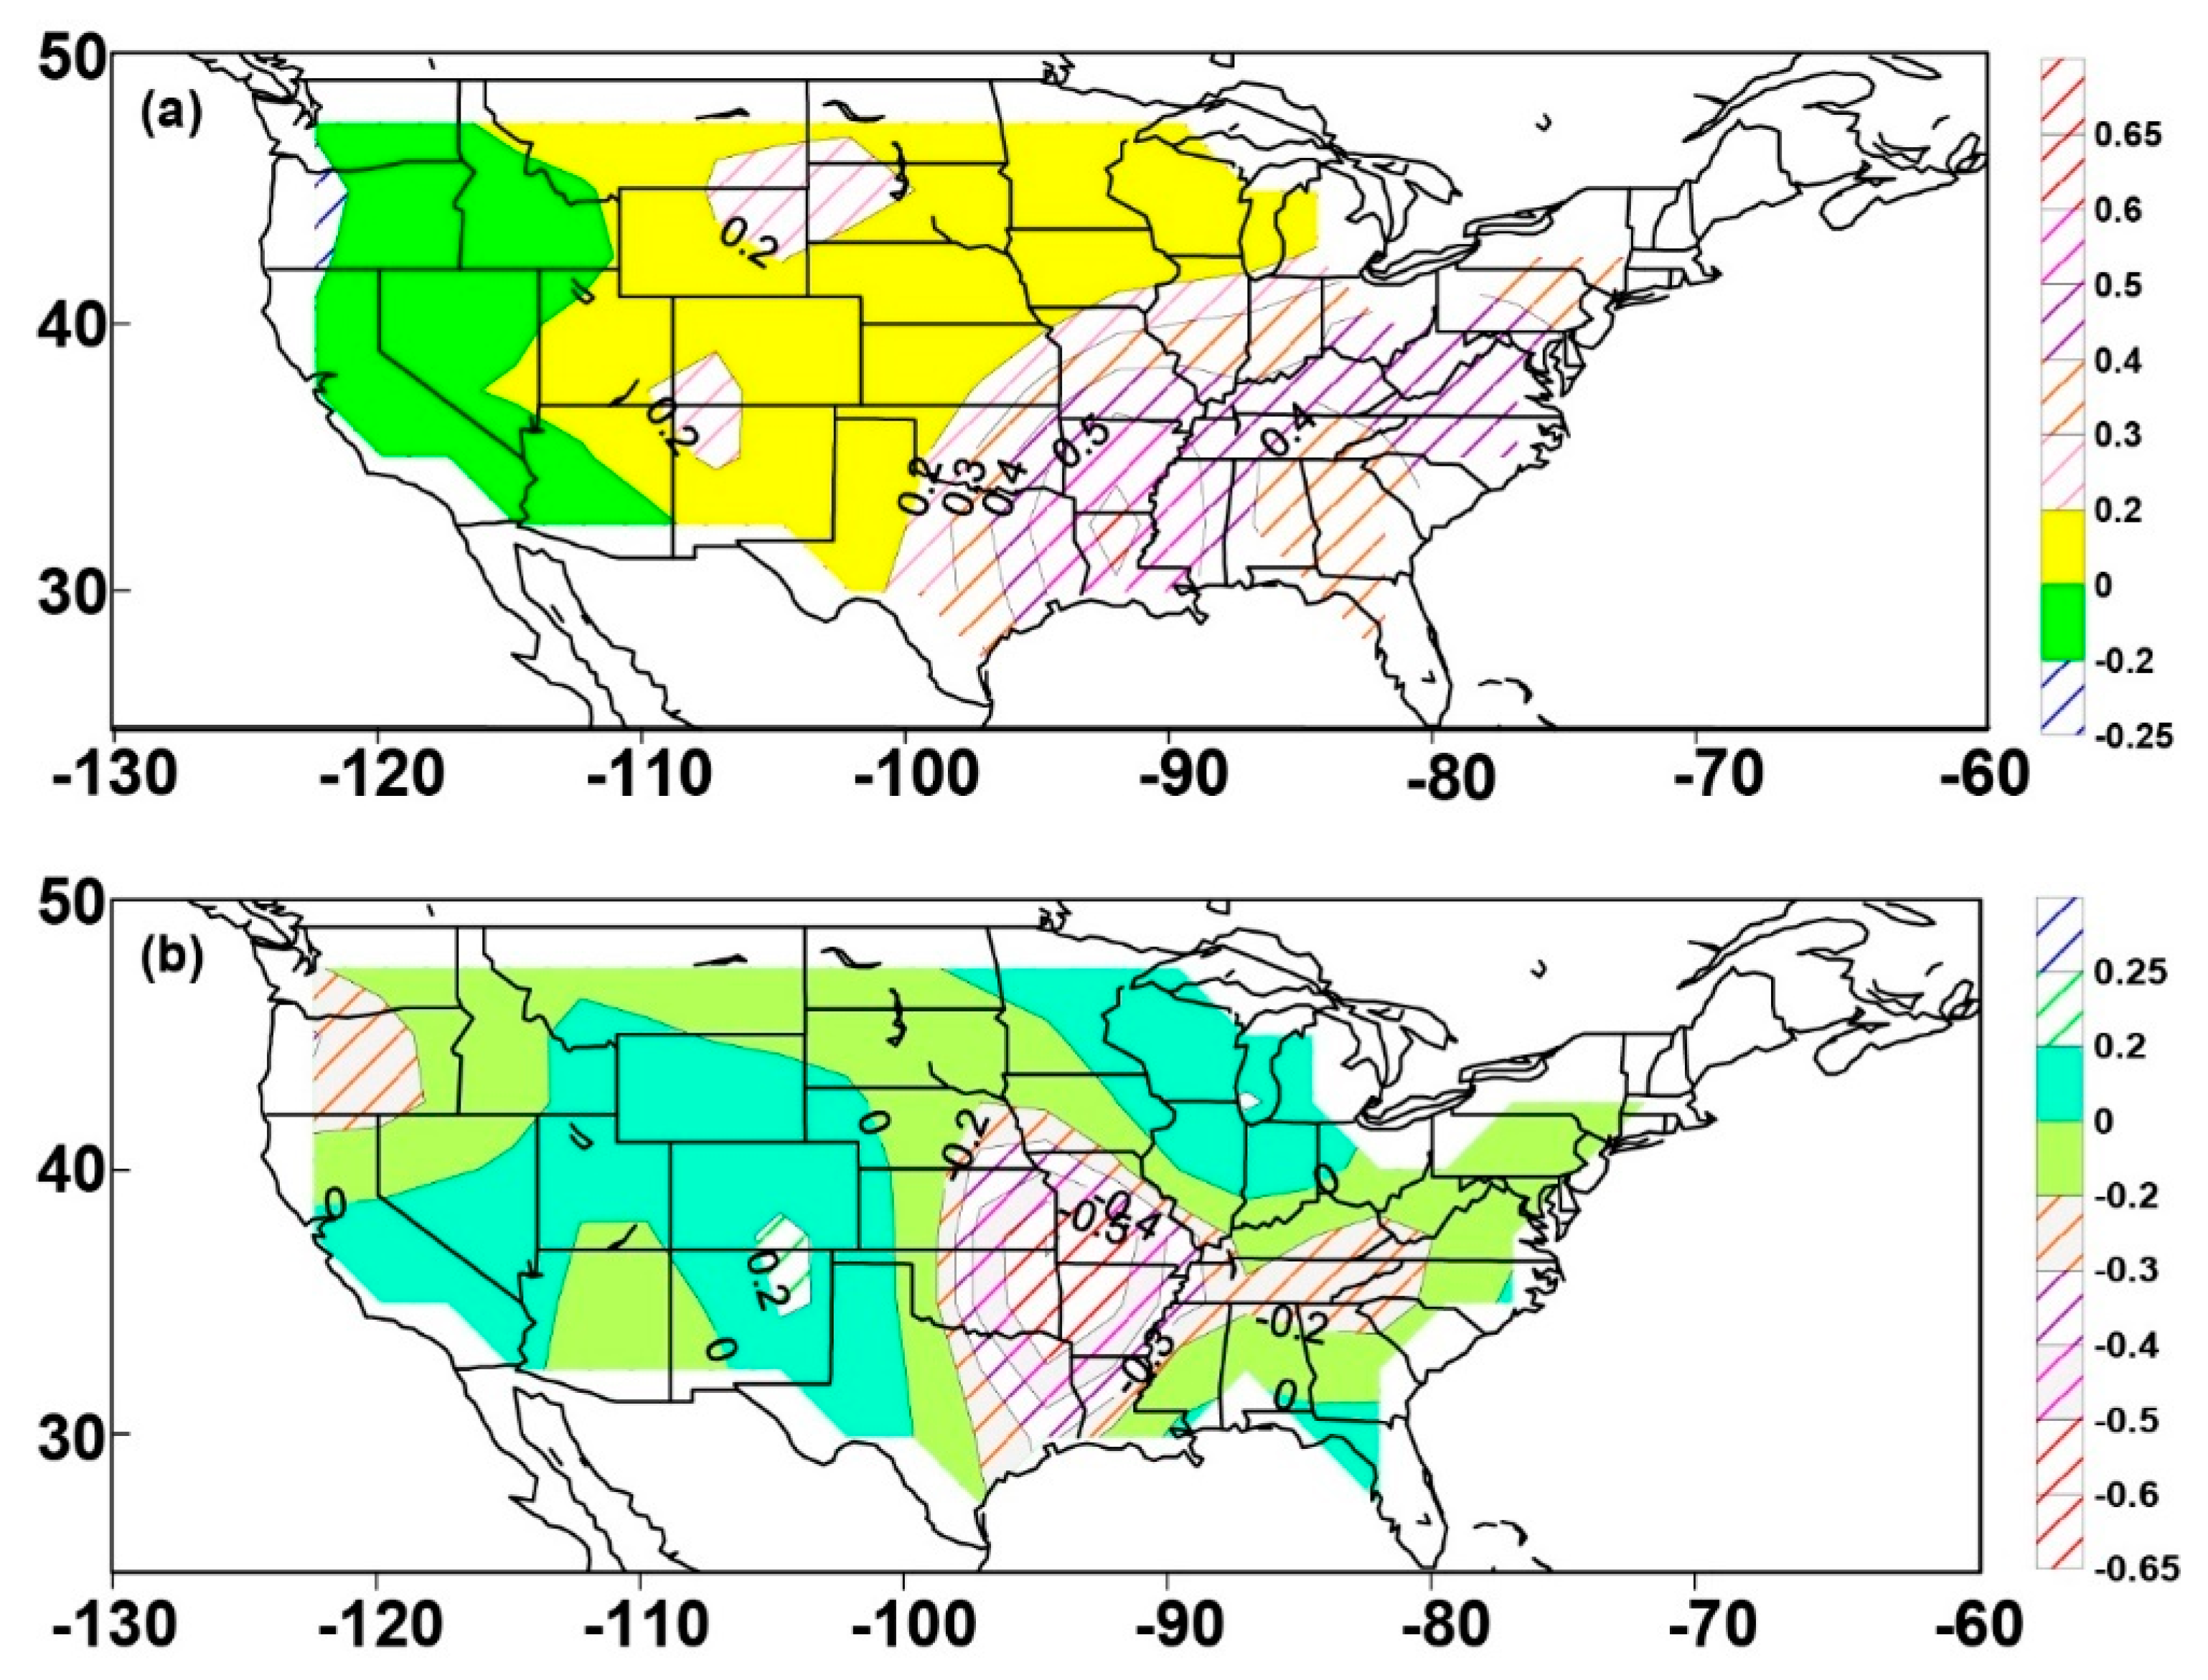
To confirm this, we compute correlation coefficients of the tornado time series with meridional wind. It is found that the areas of statistically significant (>95%) correlation coefficients (with a max. value of about 0.65) very well match the areas of tornado activities (Figure 6a). This indicates that the Gulf of Mexico as a source of moisture indeed plays a critical role in the transport of warm, moist air by the southerly flow in the lower troposphere to fuel convection in the new Tornado Alley. This is further supported by the statistically significant correlation coefficients between upward motion and the tornado time series located in the areas of tornado activities (Figure 6b). These environments are conducive to severe storm development and increase the probability of tornado development.
The spatial distributions of U. S. tornado days over the colder period of 1959–1988 and the warmer period of 1989–2018 are also examined. From the colder period to the warmer period, the location of tornado days has geographically shifted eastward, southeastward and northeastward. This is consistent with geographic shifts of tornado counts found earlier. For example, the location of 20+ tornado days clearly shows an eastward shift in addition to southeastward and northeastward shifts from the colder period (in orange color of Figure 7a) to the warmer period (in blue color of Figure 7b). More importantly, the maximum number of tornado days in the warmer period is about two times greater than that in the colder period (cf. Figure 7a,b). This indicates that, under climate warming conditions, the number of 20+ tornado days not only shifts eastward, southeastward and northeastward geographically but also increases in its area coverage, compared with the colder period. These shifts are statistically significant at a level of >99% (Table 2). Similar geographic shifts at a statistically significant level of at least 95% also occur for 10+, 15+, 25+, 40+, 45+, and 50+ tornado days but not for 1+, 2+, 5+, 30+, and 35+ tornado days (Table 2). Note that in this study we use tornado day data directly to generate maps of spatial distributions for various tornado days. In contrast, a previous study [36] used start coordinates of individual tornadoes from 41-year data to create maps for spatial distribution of 1–9, 10–19, 20–29, and 30+ tornado days. Although the other work [37] plotted maps of annual average number of tornado days, it compared the first 30 years (1960–1989) with the second 22 years (1990–2011), and only considered 1+ and 2+ tornado days (see their Figure 5, Figure 6, Figure 7, Figure 8 and Figure 9). In our work, we use longer time periods of tornado data to compare a 30-year accumulated number of tornado days between the first 30 years (1959–1988) and the second 30 years (1989–2018). More importantly, we examine most high-frequency 10+, 15+, 20+, 25+, 40+, 45+, 50+ tornado days and find statistically-significant eastward, northeastward, and southeastward shifts but no statistically-significant shift for low frequency tornado days such as 1+, 2+, 5+, and some high frequency tornado days such as 30+ and 35+.
Similarly, from the coldest period (Figure 8a) to the warmest period (Figure 9a), when the relatively warm centers (labelled A1 and A2 in the coldest years and B1 and B2 in the warmest years, respectively) shift eastward, northeastward, and southeastward, corresponding shifts occur in the low-pressure systems (cf. Figure 8b and Figure 9b) and the center of tornado days (cf. Figure 8 and Figure 9). These pattern linkages between the geographic shift of warming patterns and the spatial shift of tornado days, as well as relevant physical variables, are absent in previous studies [36,37].

3.2. Detection of Environment Signals for U.S. Tornado Activities in Climate Composites

The spatial variability of tornado activities associated with the other large-scale environment conditions remains highly uncertain [16]. To gain further understanding of the larger scale environments that are conducive to tornado development, we employ the North American Regional Reanalysis (NARR) monthly mean data (~32 km horizontal resolution) [17] for composite analyses.
Based on the availability of the NARR (North American Regional Reanalysis) data beginning in 1979 and onward, the 10 strongest positive anomaly years (of tornado activity) after 1979 are 2011, 2008, 1982, 2004, 1980, 1992, 1990, 1983, 1998, and 1984, referred to as high-event years, and the 10 strongest negative anomaly years are 2002, 1987, 2000, 2012, 1985, 1994, 1988, 2013, 2001, and 2014, referred to as low-event years.
All composite analyses are performed over the 10 highest and 10 lowest event years of intensity weighted tornado counts. In each year, the composite analyses are implemented from March to September since U.S. tornadoes mostly occur in these months (Figure 10).
The statistical difference between the two means of high-event-year and low-event-year tornado numbers can be evaluated using a t test (see Equations (1) and (2)). The n2 and n1 (n2 = n1 = 10) in Equation (1) are the sample size of 10 high-event and low-event years, and s in Equation (2) is the estimated standard deviation. Under the null hypothesis Ho, Equation (1) obeys a t distribution with n2 + n1 − 2 (= 18) degree of freedom. The computed statistic t is 7.2 (> t 0.01 = 2.9), indicating that the difference of two means is statistically significant at a level of 99%.
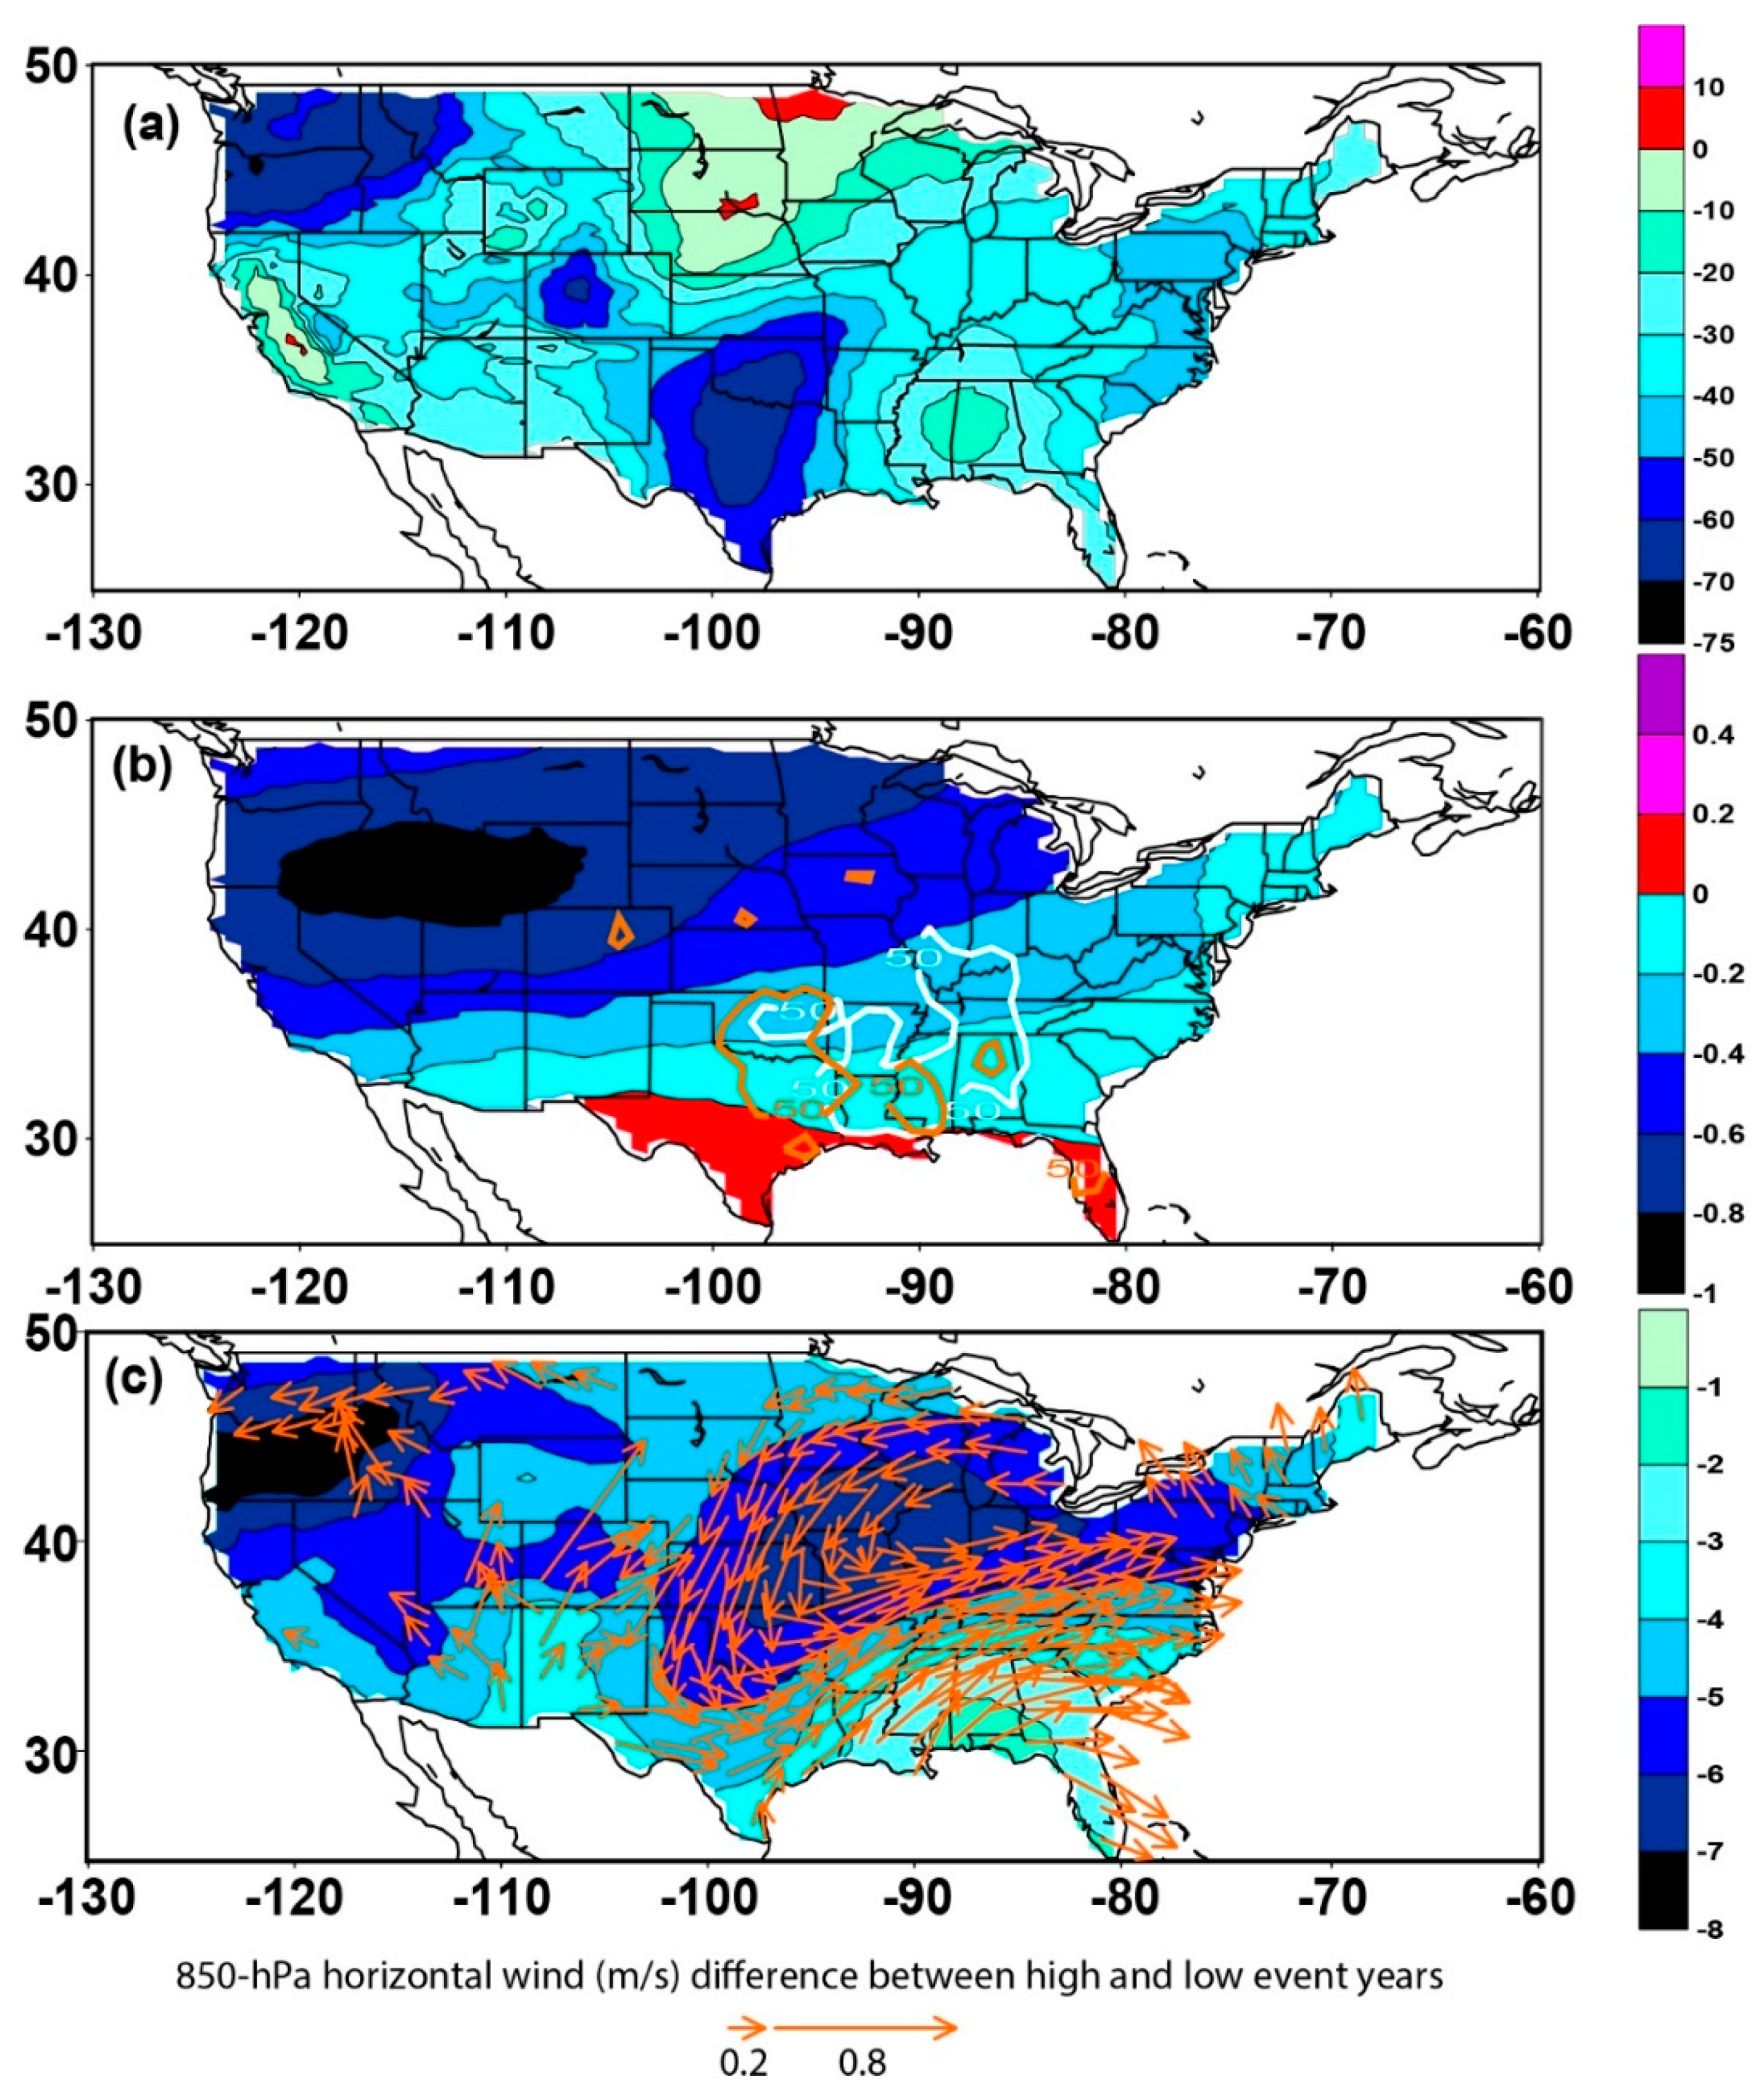
We examine the synoptic settings and mesoscale environments favorable for tornado development, such as vertical shear of wind speed, lifting conditions, and atmospheric instability. Figure 11a presents the composite differences of mean sea level pressure (MSLP) between high and low event years. Both the new and traditional Tornado Alleys are located in regions of negative MSLP differences. A closed low of negative MSLP difference is positioned mainly in Texas and Oklahoma in the traditional Tornado Alley. Another closed low of negative MSLP difference is located in part (Mississippi and Alabama) of the new Tornado Alley to the east of the traditional Tornado Alley. Hence, high tornado activity years are associated with more cyclonic circulations than low tornado activity years.
Figure 11b shows the 500-hPa air temperature differences between the high-event and low-event years. The positive and negative temperature differences are located to the south and north, respectively. The increased north–south temperature contrast in high-event years means stronger baroclinicity for tornado activities than in low-event years. Based on the thermal wind relationship, the larger the south–north temperature contrast, the stronger the vertical shear of westerly wind. Furthermore, the zonal gradient of pressure differences (Figure 11a) creates warm and moist southerly flow from the Gulf of Mexico in the lower troposphere that fuels convection in the new Tornado Alley (Figure 11c). These environments are conducive to severe storm development and increase the probability of tornado development.
Figure 12a displays the composite differences of the 500–1000 hPa wind speed change between high and low event years. The new Tornado Alley is located in regions of positive differences of wind shear, indicating that the high-event years have stronger wind shear than the low-event years. In most of the traditional and the new Tornado Alleys, the magnitude of the wind shear differences reaches about 2 m s−1 (Figure 12a). The horizontal vortex tube produced by the wind shear, when twisted by upward motion in convective clouds, results in spinning in the vertical, creating favorable environment for supercell development, which often spawns the most destructive tornadoes in the U.S.
Figure 12b exhibits the 850-hPa omega differences between the high and low event years, indicating that the high event years are associated with stronger observed upward motion, especially in the new Tornado Alley, than the low event years. The upward motion also helps release atmospheric instability, beneficial for severe convective storm development and maintenance.
Atmospheric instability and potential for deep convection are usually measured by convective available potential energy (CAPE). As shown in Figure 12c, the surface-based CAPE is greater in high event years than in low event years in the new Tornado Alley, where the majority of intensive tornado activities occur. Clearly, stronger vertical shear, larger surface-based CAPE, and stronger upward motion (Figure 12) as well as low-level southerly flow from Gulf of Mexico (Figure 11c) act in concert to provide favorable synoptic and mesoscale environments in the new Tornado Alley.

4. Discussion and Conclusions

Every year, tornado activities in the United States generate tremendous societal interest due to their engendering catastrophes of loss of life and property damage. When severe tornado events occur, numerous questions related to climate change often arise from the public. The IPCC and the U.S. Climate Change Science Program are also keen to know how warming climate affects localized severe weather such as tornadoes. This research helps answer some of these unknown or unresolved scientific questions, of concern to the IPCC, the U.S. climate change program, and the public.
We show that over the latest 30-year warming period stronger tornado activities have made a statistically-significant geographic shift eastward, northeastward, and southeastward. The tornado count ≥50 is a clear threshold that the geographic shift has become statistically significant at a level of at least 95%, whereas at the tornado count <50, the geographic shift is not statistically significant, or not significant at a level of 95%. This shift is not sensitive to a single major tornado outbreak such as the one occurred on 25–28 April 2011. Furthermore, we find that, from the cold period to the warm period, the relative warm centers shift eastward, northeastward, and southeastward, coupled with shifts of low pressure and tornado activity centers. The Gulf of Mexico plays an important role in transporting warm and moist air into the areas of tornado activity centers, in collaboration with upward motion, to fuel convection in the tornado activity centers.
Consistent with these geographic shifts in tornado counts, from the colder period to the warmer period U. S. tornado days are also geographically shifting eastward, northward and southward. Under a warming climate, high-frequency tornado days increase in their area coverage in addition to these geographical shifts.
Over the new tornado alley, high-tornado-activity years are coupled with stronger low-level wind shear, stronger upward motion, and higher convective available potential energy. These are identified for the first time in climate composite analyses of difference between the high-event and low-event years of tornado activity, although some of them have been discussed in case studies, numerical simulations, and other climatological analyses.
As demonstrated, the above-mentioned changes are associated with climate warming, but it is not clear how and to what extent changes are caused by internal variability versus anthropogenic forcing, and which process is dominant. Answers to these important scientific questions will benefit our understanding of the impact of climate change on tornado activities, long-term projection of severe weather events, and possible mitigation strategies.

Author Contributions

Z.C. developed the ideas that lead to this manuscript, performed the numerical computations and analyses, devised figure structures, and led the interpretation of the results and the writing of the paper with input from H.C. and G.J.Z. H.C. plotted the spatial distributions of US gridded EF1–EF5 tornado annual counts and days over two 30-year periods for superimposing onto the composite maps. G.J.Z. contributed to Figure 1 and Figure 11c. All authors contributed to interpreting results, discussion of their implications and improvement of the paper. All authors have read and agreed to the published version of the manuscript.

Funding

Huaqing Cai was supported by U.S. Army Research Laboratory. Guang J. Zhang was supported by the U.S. Department of Energy Office of Science, Biological and Environmental Research Program (BER) under Award Number DE-SC0019373.

Institutional Review Board Statement

Not applicable.

Informed Consent Statement

Not applicable.

Data Availability Statement

The U.S. tornado data are obtained from National Oceanic and Atmospheric Administration (NOAA) National Weather Service Storm Prediction Center (SPC) (http://www.spc.noaa.gov/wcm/index.html#data, accessed on 27 April 2021). Reanalysis data are gained from the NOAA/OAR/ESRL PSD, Boulder, Colorado, USA (https://psl.noaa.gov/cgi-bin/data/composites/printpage.pl, accessed on 27 April 2021).

Acknowledgments

The US tornado data are provided by NOAA’s National Weather Service Storm Prediction Center (http://www.spc.noaa.gov/wcm/index.html#data, accessed on 27 April 2021). NCEP Reanalysis data are provided by the NOAA/OAR/ESRL PSD, Boulder, Colorado, USA, from their Web site at https://psl.noaa.gov/cgi-bin/data/composites/printpage.pl (accessed on 27 April 2021).

Conflicts of Interest

The authors declare that they have no conflict of interest.

References

  1. Feuerstein, B.; Dotzek, N.; Grieser, J. Assessing a tornado climatology from global tornado intensity distributions. J. Clim. 2005, 18, 585–596. [Google Scholar] [CrossRef] [Green Version]
  2. Brooks, H.E.; Doswell, C.A., III. Some aspects of the international climatology of tornadoes by damage classification. Atmos. Res. 2001, 56, 191–201. [Google Scholar] [CrossRef] [Green Version]
  3. NOAA. The Online Tornado FAQ: Frequently Asked Questions about Tornadoes. 2018. Available online: https://www.spc.noaa.gov/faq/tornado/ (accessed on 26 April 2021).
  4. Verbout, S.M.; Brooks, H.E.; Leslie, L.M.; Schultz, D.M. Evolution of the U.S. tornado database: 1954-2003. Wea. Forecast. 2006, 21, 86–93. [Google Scholar] [CrossRef]
  5. Elsner, J.B.; Michaels, L.E.; Elsner, I.J. The decreasing population bias in tornado reports across the central plains. Wea. Clim. Soc. 2013, 5, 221–232. [Google Scholar] [CrossRef]
  6. Fuhrmann, C.M. Ranking of tornado outbreaks across the United States and their climatological characteristics. Wea. Forecast. 2014, 29, 684–701. [Google Scholar] [CrossRef]
  7. Guo, L.; Wang, K.; Bluestein, H.B. Variability of tornado occurrence over the continental United States since 1950. J. Geophys. Res. Atmos. 2016, 121, 6943–6953. [Google Scholar] [CrossRef] [Green Version]
  8. NOAA. National Weather Service. Quick Facts: Tornadoes. 2009. Available online: https://www.yumpu.com/en/document/read/11877490/quick-facts-tornadoes-noaa (accessed on 26 April 2021).
  9. NOAA. National Weather Service, Office of Climate, Water, and Weather Services. Weather Fatalities. 2012. Available online: http://www.nws.noaa.gov/om/hazstats.shtml (accessed on 26 April 2021).
  10. Ashley, W.S.; Strader, S.M. Recipe for disaster: How the dynamic ingredients of risk and exposure are changing the tornado disaster landscape. Bull. Am. Meteorol. Soc. 2016, 97, 767–786. [Google Scholar] [CrossRef]
  11. IPCC. Summary for policymakers. In Climate Change 2014: Impacts, Adaptation, and Vulnerability; Field, C.B., Ed.; Cambridge University Press: Cambridge, UK, 2014; pp. 1–32. Available online: https://www.ipcc.ch/site/assets/uploads/2018/02/ar5_wgII_spm_en.pdf (accessed on 26 April 2021).
  12. The, U.S. Climate Change Science Program and the Subcommittee on Global Change Research. In Weather and Climate Extremes in a Changing Climate; Department of Commerce, NOAA’s National Climatic Data Center: Washington, DC, USA, 2008. [Google Scholar]
  13. Tippett, M.K.; Lepore, C.; Cohen, J.E. More tornadoes in the most extreme U.S. tornado outbreaks. Science 2016, 354, 1419–1423. [Google Scholar] [CrossRef] [Green Version]
  14. Diffenbaugh, N.S.; Trapp, R.J.; Brooks, H.E. Does global warming influence tornado activity? Eos Trans. 2008, 89, 553–554. [Google Scholar] [CrossRef] [Green Version]
  15. Agee, E.; Larson, J.; Childs, S.; Marmo, A. Spatial redistribution of U.S. tornado activity between 1954 and 2013. J. Appl. Meteor. Climatol. 2016, 55, 1681–1697. [Google Scholar] [CrossRef]
  16. Tippett, M.K.; Sobel, A.H.; Camargo, S.J.; Allen, J.T. An Empirical Relation between U.S. Tornado Activity and Monthly Environmental Parameters. J. Clim. 2014, 27, 2983–2999. [Google Scholar] [CrossRef]
  17. Mesinger, F.; DiMego, G.; Kalnay, E.; Mitchell, K.; Shafran, P.C.; Ebisuzaki, W.; Shi, W. North American Regional Reanalysis. Bull. Am. Meteor. Soc. 2006, 87, 343–360. [Google Scholar] [CrossRef] [Green Version]
  18. Wakimoto, R.M.; Cai, H. Analysis of a non-tornadic supercell during VORTEX-95. Mon. Wea. Rev. 2000, 128, 565–592. [Google Scholar] [CrossRef]
  19. Cai, H. Comparison between tornadic and nontornadic mesocyclones using fractal geometry. Mon. Wea. Rev. 2005, 133, 2535–2551. [Google Scholar] [CrossRef]
  20. Gallo, B.T.; Clark, A.J.; Dembek, S.R. Forecasting tornadoes using convection-permitting ensembles. Wea. Forecast. 2016, 31, 273–295. [Google Scholar] [CrossRef]
  21. Reames, L.J. Diurnal variations in severe weather forecast parameters of Rapid Update Cycle-2 tornado proximity environments. Wea. Forecast. 2017, 32, 743–761. [Google Scholar] [CrossRef]
  22. Kalnay, E.; Kanamitsu, M.; Kistler, R.; Collins, W.; Deaven, D.; Gandin, L.; Joseph, D. The NCEP/NCAR 40-year reanalysis project. Bull. Am. Meteorolo. Soc. 1996, 77, 437–471. [Google Scholar] [CrossRef] [Green Version]
  23. Brooks, H.E.; Carbin, G.W.; Marsh, P.T. Increased variability of tornado occurrence in the United States. Science 2014, 346, 349–352. [Google Scholar] [CrossRef] [PubMed]
  24. Elsner, J.B.; Jagger, T.H.; Elsner, I.J. Tornado intensity estimated from damage path dimensions. PLoS ONE. 2014, 9. [Google Scholar] [CrossRef] [Green Version]
  25. Doswell, C.A., III; Brooks, H.E.; Kay, M.P. Climatological estimates of daily local nontornadic severe thunderstorm probability for the United States. Wea. Forecast. 2005, 20, 577–595. [Google Scholar] [CrossRef] [Green Version]
  26. Doswell, C.A., III; Brooks, H.E.; Dotzek, N. On the implementation of the enhanced Fujita scale in the USA. Atmos. Res. 2009, 93, 554–563. [Google Scholar] [CrossRef] [Green Version]
  27. Kelly, D.L.; Schaefer, J.T.; McNulty, R.P.; Doswell, C.A., III. An augmented tornado climatology. Mon. Wea. Rev. 1978, 106, 1172–1183. [Google Scholar] [CrossRef] [Green Version]
  28. Doswell, C.A., III; Burgess, D.W. On some issues of United States tornado climatology. Mon. Wea. Rev. 1988, 116, 495–501. [Google Scholar] [CrossRef] [Green Version]
  29. Brooks, H.E.; Doswell, C.A., III; Kay, M.P. Climatological estimates of local daily tornado probability for the United States. Wea. Forecast. 2003, 18, 626–640. [Google Scholar] [CrossRef]
  30. Grazulis, T.P.; Schaefer, J.T.; Abbey, R.F. Advances in tornado climatology, hazards, and risk assessment since Tornado Symposium II, In the Tornado: Its Structure, Dynamics, Prediction and Hazards. Geophys. Monogr. 1993, 79, 409–426. [Google Scholar]
  31. Kunkel, K.E.; Karl, T.R.; Brooks, H.; Kossin, J.; Lawrimore, J.H.; Arndt, D.; Wuebbles, D. Monitoring and understanding trends in extreme storms. Bull. Am. Meteor. 2013, 4, 499–514. [Google Scholar] [CrossRef]
  32. Agee, E.; Childs, S. Adjustments in tornado counts, F-scale intensity, and path width for assessing significant tornado destruction. J. Appl. Meteor. Climatol. 2014, 53, 1494–1505. [Google Scholar] [CrossRef]
  33. Cao, Z. Severe hail frequency over Ontario, Canada: Recent trend and variability. Geophys. Res. Lett. 2008, 35, L14803. [Google Scholar] [CrossRef]
  34. Emanuel, K. Increasing destructiveness of tropical cyclones over the past 30 years. Nature 2005, 436, 686–688. [Google Scholar] [CrossRef]
  35. Cao, Z.; Ma, J. Summer severe rainfall frequency trend and variability over Ontario, Canada. J. Appl. Meteor. Climatol. 2009, 48, 1955–1960. [Google Scholar] [CrossRef]
  36. Moore, T.W. On the temporal and spatial characteristics of tornado days in the United States. Atmos. Res. 2017, 184, 56–65. [Google Scholar] [CrossRef]
  37. Farney, T.J.; Dixon, P.G. Variability of tornado climatology across the continental United States. Int. J. Climatol. 2014, 35, 2993–3006. [Google Scholar] [CrossRef]
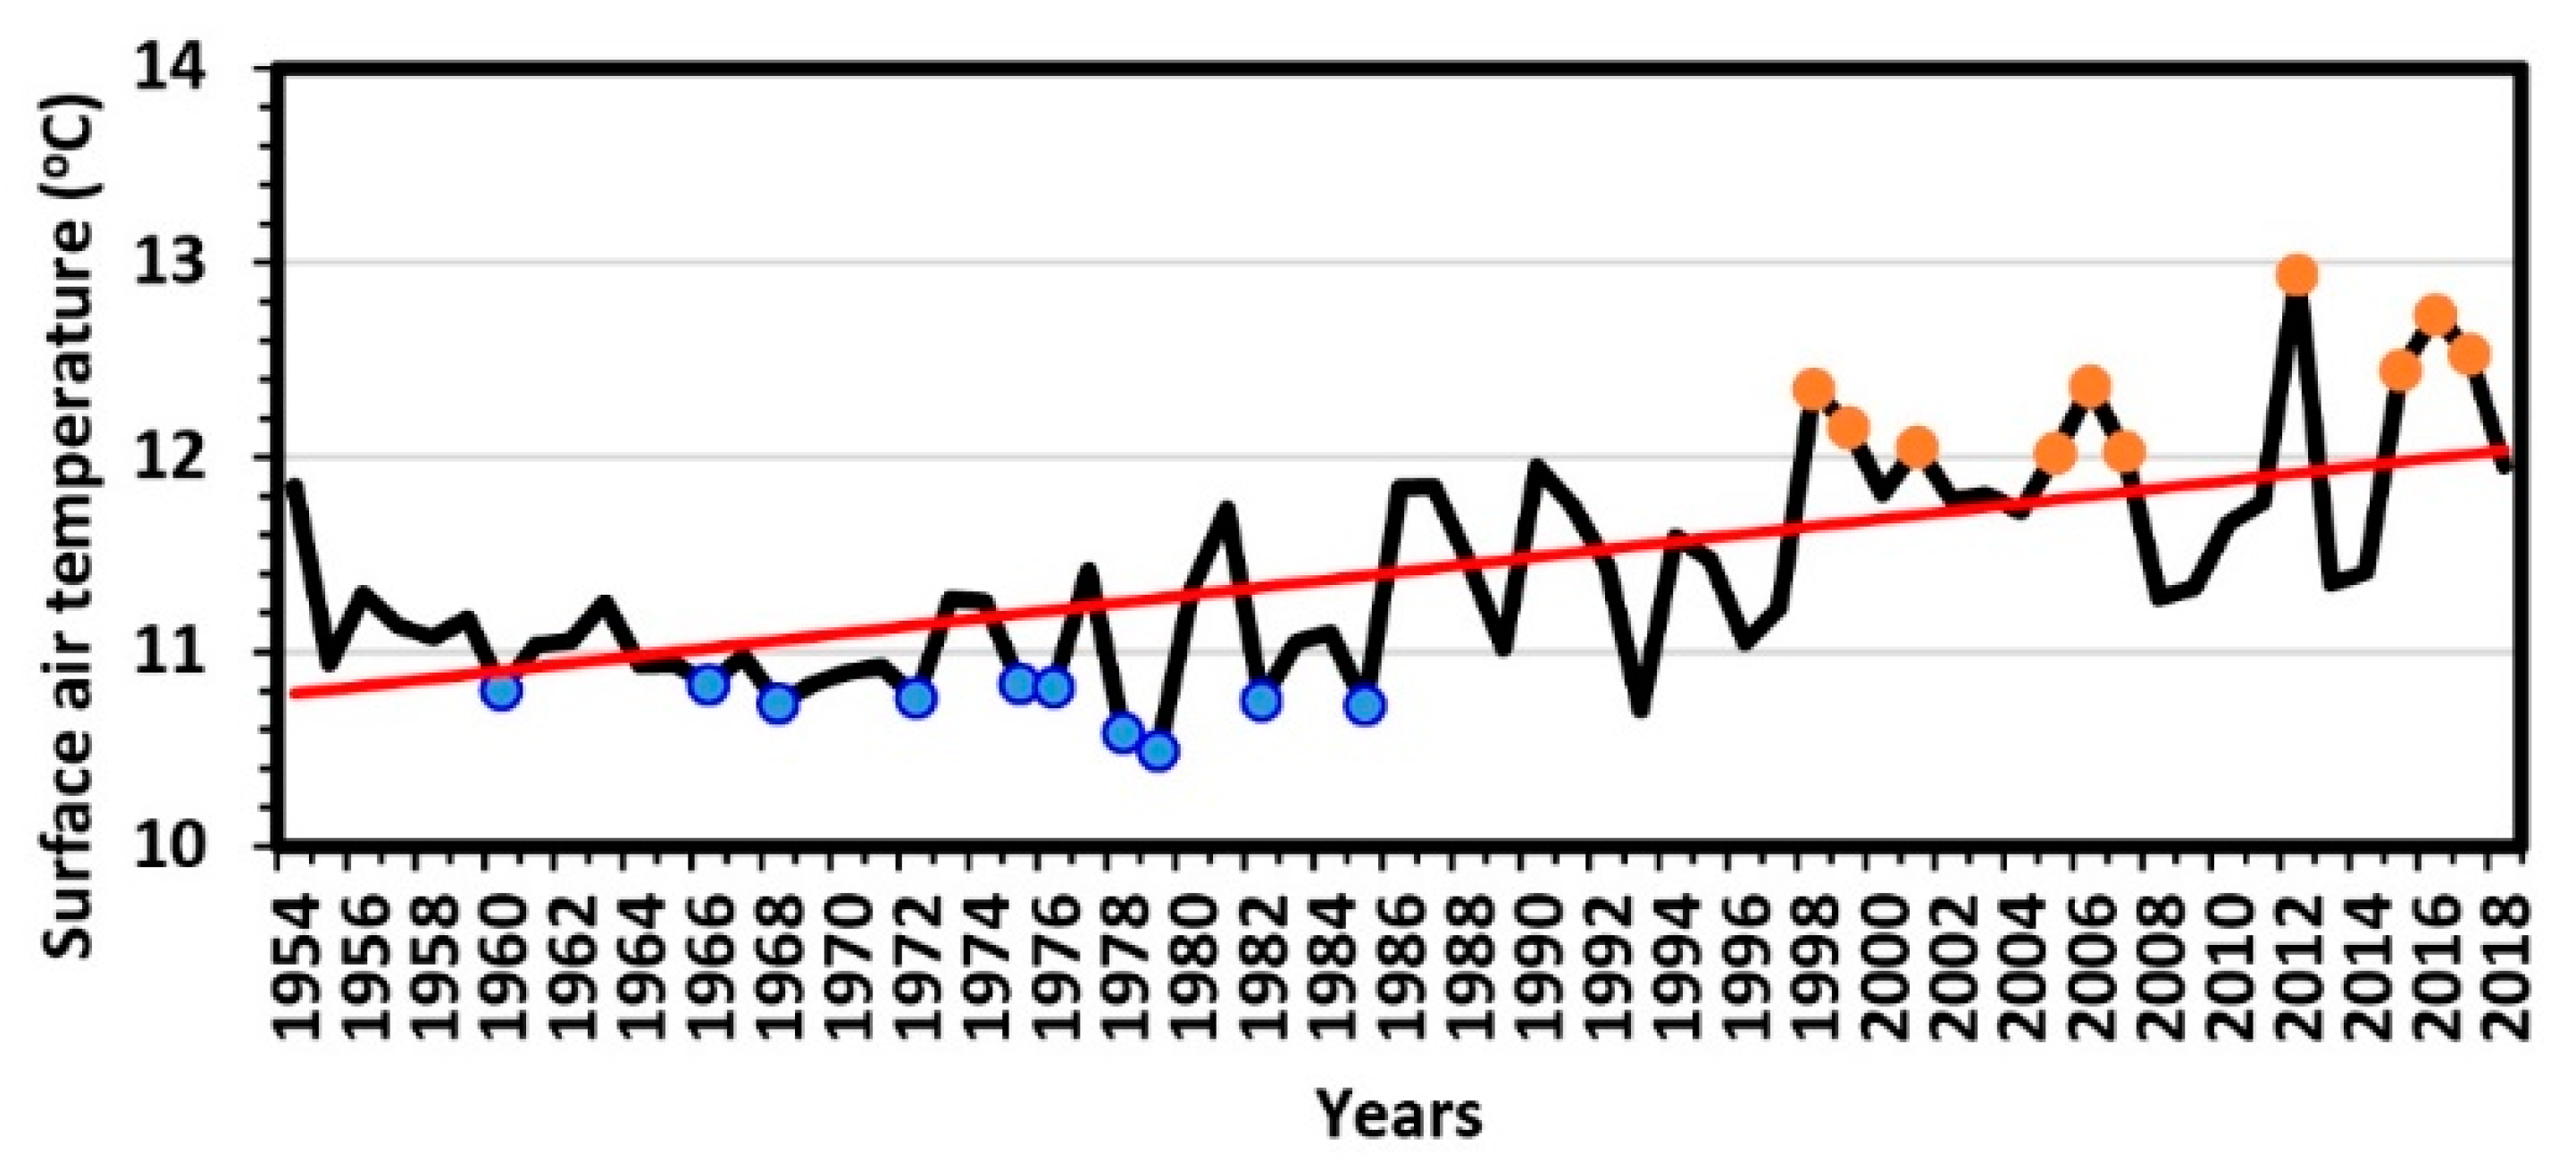
Figure 1. U.S. annual average surface air temperature (°C) over the time period 1954 to 2018. The 10 strongest positive anomaly years (denoted by solid orange circles) of 2012, 2016, 2017, 2015, 2006, 1998, 1999, 2001, 2007, and 2005, are referred to as the warmest years, and the 10 strongest negative anomaly years (denoted by solid blue circles) of 1979, 1978, 1985,1968, 1982, 1972, 1960, 1976, 1966, and 1975, are referred to as the coldest years.
Atmosphere 12 00567 g001
Figure 2. Composites of surface air temperature anomaly (°C) over time periods of (a) 1959 to 1988, and (b) 1989 to 2018. The Tornado Alley is defined as the core area of (E)F1-(E)F5 tornado counts of 50 or more per 1° × 1° grid box over a 30-year period with orange color in (a) and green color in (b).
Atmosphere 12 00567 g002
Figure 3. Composites of 500-hPa air temperature anomaly (°C) over time periods of (a) 1959 to 1988, and (b) 1989 to 2018. Tornado Alley is defined as the core area of (E)F1-(E)F5 tornado counts of 50 or more per 1° × 1° grid box over a 30-year period with orange color in (a) and green color in (b).
Atmosphere 12 00567 g003
Figure 4. Composite for 10 coldest years of (a) surface air temperature anomaly (°C) with relative warm centers labelled by A1 and A2, and (b) mean sea level pressure anomaly (Pa). The (E)F1-(E)F5 tornado counts (contours) over the same period are in green colors in (a) and (b).
Atmosphere 12 00567 g004
Figure 5. Composite for 10 warmest years of (a) surface air temperature anomaly (°C) with relative warm centers labelled by B1 and B2, and (b) mean sea level pressure anomaly (Pa). The (E)F1-(E)F5 tornado counts (contours) over the same period are in green colors in (a) and (b).
Atmosphere 12 00567 g005
Figure 6. Spatial distribution of correlation coefficients (a) between (E)F1-(E)F5 tornado count (1954-2018) and meridional wind speed (m s−1) and (b) between (E)F1-(E)F5 tornado count (1954-2018) and omega (ω, Pa s−1). The shaded areas indicate a statistically significant level of >95%.
Atmosphere 12 00567 g006
Figure 7. (a) Number of 20+ tornado day (in orange) and composites of surface air temperature anomaly (°C) over the time period of 1959 to 1988, and (b) number of 20+ tornado day (in blue) and composites of surface air temperature anomaly (°C) over the time period of 1989 to 2018.
Atmosphere 12 00567 g007
Figure 8. Composite for 10 coldest years of (a) surface air temperature anomaly (°C) with relative warm centers labelled A1 and A2, and (b) mean sea level pressure anomaly (Pa). The number of 20+ tornado days (contours) over the same period are in green colors in (a) and (b).
Atmosphere 12 00567 g008
Figure 9. Composite for 10 warmest years of (a) surface air temperature anomaly (°C) with relative warm centers labelled B1 and B2, and (b) mean sea level pressure anomaly (Pa). The number of 20+ tornado days (contours) over the same period are in green colors in (a) and (b).
Atmosphere 12 00567 g009
Figure 10. Monthly averaged (E)F1-(E)F5 tornado counts over the entire continental U.S.
Atmosphere 12 00567 g010
Figure 11. Composite differences between high and low event years of (a) mean sea level pressure (Pa) (shaded), (b) 500-hPa air temperature (°C) (shaded), and (c) 850-hPa geopotential height (m) (shaded) and horizontal velocity (m s−1). Tornado Alley is defined as the core area of (E)F1-(E)F5 tornado counts of 50 or more per 1° × 1° grid box over a 30-year period with orange color contours (in the cold period) and white color contours (in the warm period) in (b).
Atmosphere 12 00567 g011
Figure 12. Composite differences (shaded) between high and low event years of (a) the 500–1000 hPa wind speed shear (m s−1), (b) 850-hPa omega (Pa s−1), and (c) convective available potential energy (CAPE) (J Kg−1). Tornado Alley is defined as the core area of (E)F1-(E)F5 tornado counts of 50 or more per 1° × 1° grid box over a 30-year period with orange color contours (in the cold period) and white color contours (in the warm period) in (a).
Atmosphere 12 00567 g012
Table 1. Tornado intensity-based weight.
IntensitySpeed Range (m s−1)Median Speed (m s−1)Weight
EF138.4–49.243.80.24
EF249.6–60.4550.38
EF360.8–73.867.30.57
EF474.2–89.481.80.84
EF5>89.489.41.00
Table 2. t test for U.S. tornado days (statistical significance denoted by green colors).
Tornado Days1+2+5+10+15+20+25+30+35+40+45+50+
t statistic1.7171.4181.1142.4152.8622.8322.7151.4600.5803.1942.2483.198
tα1.9601.6451.6451.9602.5762.5762.5761.6451.6452.5761.9602.576
α0.050.100.100.050.010.010.010.100.100.010.050.01
Publisher’s Note: MDPI stays neutral with regard to jurisdictional claims in published maps and institutional affiliations.