Article

Major Floods and Tropical Cyclones over Bangladesh: Clustering from ENSO Timescales

Institute for Climate and Application Research, Nanjing University of Information Science and Technology, Nanjing 210000, China
Atmosphere 2021, 12(6), 692; https://doi.org/10.3390/atmos12060692
Submission received: 7 April 2021 / Revised: 25 May 2021 / Accepted: 26 May 2021 / Published: 28 May 2021

Abstract

:
The present study analyzed major floods and tropical cyclones (TCs) over Bangladesh on El Niño-Southern Oscillation (ENSO) timescales. The geographical location, low and almost flat topography have introduced Bangladesh as one of the most vulnerable countries of the world. Bangladesh is highly vulnerable to the extreme hazard events like floods and cyclones which are impacted by ENSO. ENSO is mainly a tropical event, but its impact is global. El Niño (La Niña) represents the warm (cold) phase of the ENSO cycle. Rainfall and cyclonic disturbances data have been used for the period of 70 years (1948–2017) and compared with the corresponding observations of the Southern Oscillation Index. Result shows that major flood events occurred during the monsoon period, and most of them are during the La Niña condition, consistent with the historical archives of flood events in Bangladesh. Synoptic conditions of these events are well matched during La Niña condition. On the other hand, the major TC cases are in the period of either pre-monsoon or post-monsoon season. The pre-monsoon cases are under neutral (developing La Niña) or El Niño and the post-monsoon cases are under La Niña, consistent with climatology studies that La Niña is favorable to have more intense TCs over the Bay of Bengal.

1. Introduction

Bangladesh is located at the interface of two contrasting settings with the Bay of Bengal (BoB) to the south and the Himalayas to the north. This provides the country the life-giving monsoon, on the one hand, and the catastrophic disasters like tropical cyclone (TC), storm surge, flood, drought, and erosion, on the other [1]. The geographical vulnerability of Bangladesh lies in the fact of an exceedingly flat, low-lying, alluvial plain covered by over 230 rivers and rivulets with approximately 580 km of exposed coastline along the BoB. As a result of its geography, Bangladesh frequently suffers from devastating floods, TCs and storm surges, tornadoes, riverbank erosion, and drought etc. [2,3] which is highly impacted by the El Niño-Southern Oscillation, a main source of year-to-year variability in weather and climate for many areas of the world [4].
The El Niño-Southern Oscillation (ENSO) is a global scale ocean/atmosphere phenomenon between the Pacific and Indo-Australian regions. In the Pacific Ocean, three basic states exist—El Niño, La Niña, or Neutral [5]. El Niño refers to the above-average sea-surface temperatures that periodically develop across the east-central equatorial Pacific. It represents the warm phase of the ENSO cycle and La Niña refers to the periodic cooling of sea-surface temperature across the east-central equatorial Pacific. It represents the cold phase of the ENSO cycle, and is sometimes referred to as a Pacific cold episode [6]. El Niño is an extensive warming of the upper ocean in the tropical eastern Pacific lasting more than 5 months. Usually the Niño3 index is defined as the mean sea surface temperature anomaly to climatology over the region 5° N–5° S, 150° W–90° W to identify El Niño events. Quantitative definition of an El Niño needs a Niño3 index to be larger than 0.5° for 5 months at least [7]. In addition, the warmer than average waters were shown to be closely related to a global atmospheric pressure oscillation known as the Southern Oscillation.
ENSO has an influence on flood which is defined as a relatively high flow of water that overtops the natural or artificial banks of a stream [8]. Flood causes major damage to life and property (i.e., land and buildings) in Bangladesh [9]. For example, the flood in 1987 affected 39.9% area in Bangladesh which was devastating in nature compared to previous flood years i.e., 1955, 1963, 1969, 1970, and 1974 [10]. An increased amount of precipitation can cause flooding in Bangladesh [10]. An above normal monsoon downpour in the Ganges-Brahmaputra-Meghna drainage system is thought to be the primary cause of the 1988 flood in Bangladesh. The causes of floods are thoroughly discussed by Brammer [10]. Another natural hazard, for example, a devasting TC depends on its intensity. The BoB is a favorable breeding ground of TCs [10,11,12,13,14,15,16,17,18,19,20,21] and Bangladesh is the worst sufferer due to cyclonic casualties in the world [16]. About 5.5% of the TCs of the global total form in the BoB [11,12,13,14,15,16,17,18,19,20,21,22] and about 1% hit Bangladesh. On the other hand, if the TC disasters due to each of which the minimum death tolls were 5000 are considered, then it is found that a death toll of about 53% of the global total occurred in Bangladesh [1,2,3].
ENSO has also impact on TCs. During strong El Niño years, Bangladesh has not faced any catastrophic cyclone but experienced a high number when ENSO condition is neutral for example, during 1960–1970 period there was no strong El Niño but neutral and Bangladesh faced eighteen cyclones [23] during that time. Singh et al. [24] found a reduction rate of severe TC activity over the BoB in pre-monsoon and post-monsoon season during warm phases of ENSO. They also investigated the impact of Southern Oscillation on the cyclogenesis over the BoB during the summer monsoon and found more depressions formed in El Niño years.
Two interesting results were reported by Mandal [25,26] regarding the recurving and landfall properties of the TCs of the BoB with respect to ENSO activity. In the North Indian Ocean, about 35% and 65% of the TCs are recurving and non-recurving types, respectively. TCs tracks analysis during severe El Niño years (1901 to 1990) showed 39% and 61% TCs have found to be recurving and non-recurving types, respectively and those TCs formed in the BoB, mostly cross the Indian coast (south of 20° N) in the El Niño years whereas in La Niña years, most of the cyclones crossed coastal regions (north of 20° N) of West Bengal and Bangladesh [25,26]. In the present study, the major floods and TCs are identified and categorized under El Niño, La Niña, and neutral ENSO. Moreover, the recurving properties of the TCs that hit Bangladesh are also categorized during ENSO time scales. This will be helpful to tackle the future climate change in Bangladesh.
TCs in BoB and their relationship with ENSO have been investigated in many earlier studies [27,28,29]. The influence of ENSO on TC activities in the BoB during post-monsoon season is studied by Girishkumar and Ravichandan [19] and they found more TCs formed in La Niña years than El Niño years. During La Niña years, the existence of low-level cyclonic vorticity, enhanced convection, and high TC heat potential in the BoB provided favorable conditions for TC activities [27].
This paper categorizes the major floods and TCs that affected Bangladesh on the ENSO timescales and attempts to find out the mechanisms behind it during those events by considering the synoptic conditions. The structure of this paper is organized as follows. The rainfall, TCs, and synoptic data are described in Section 2. Section 3 presents the results of the major floods and TCs activity over the Bangladesh by considering El Niño, La Niña and Neutral phase. Mechanisms are discussed also in Section 3 and conclusion is provided in Section 4.

2. Data and Methods

The El Niño and La Niña years are identified from the multivariate ENSO Index (Table 1). The Southern Oscillation Index (SOI) is calculated from the monthly fluctuations in the air pressure difference between Tahiti and Darwin. This SOI uses the surface pressure normalized by a standard deviation. Sustained negative values of the SOI indicate El Niño episodes and positive values of the SOI are associated with La Niña episode [6,30]. These data (1948–2017) were collected from Bureau of Meteorology, Australia. The same period of quality controlled rainfall data in Bangladesh were collected from both Bangladesh Meteorological Department and Bangladesh Water Development Board, respectively. The data are then compared against the corresponding SOI data on a monthly basis. To find out the major inland floods of Bangladesh, 35% affected area are considered and therefore, 7 floods are identified. The events of the floods are collated in tabular form as function of time by considering El Niño and La Niña. Neutral considers the SOI value which is in between +0.5 and −0.5.
BoB TCs data have been collected from Bangladesh Meteorological Department and India Meteorological Department. The data are again compared against the corresponding SOI data on monthly basis. Again, to find out the major tropical cyclones of Bangladesh, maximum sustained wind speeds is considered and therefore, 12 tropical cyclones are identified. The TC event is collated in tabular form as a function of time under El Niño and La Niña. Surface precipitable water, surface pressure, sea level pressure, precipitation and surface runoff anomalies are calculated from NOAA Physical Science Laboratory using NCEP/NCAR reanalysis data. The NCEP/NCAR reanalysis does not accurately depict the pressure and rainfall from tropical cyclones, but it is considered to be more representative of the large-scale composite synoptic environment. Monthly ENSO SST series are downloaded from NOAA physical sciences laboratory. The vertical wind shear (u and v as zonal and meridional velocity components respectively) is calculated according to the formula below
( u 200 u 850 ) 2 + ( v 200 v 850 ) 2
The low-level vorticity and relative humidity here are represented by 850-hPa pressure level vorticity and relative humidity. Wind, vorticity, and humidity data are downloaded from NOAA physical sciences laboratory.

3. Results

3.1. Categorizing of Major Floods on ENSO Timescales

The monthly and seasonal percentage of the total annual rainfall from 1948 to 2017 have been shown in Figure 1. The highest percentage of the total annual rainfall (21.1%) is observed in the month of July (Figure 1a). Besides, the percentage of the total annual rainfall is relatively high in June (19.93%), August (17.14%), and September (13.05%). On the other hand, the percentage of the total annual rainfall (0.08%) is lowest in February (Figure 1a). There are mainly four seasons in Bangladesh—winter (December–February), pre-monsoon (March–May), monsoon (June–August) and post-monsoon (October–November). Seasonally, the highest percentage of the total annual rainfall (70.6%) is observed in monsoon and lowest (1.4%) in winter (Figure 1b). Pre-monsoon and post-monsoon contribute 20% and 8% of total respectively (Figure 1b).
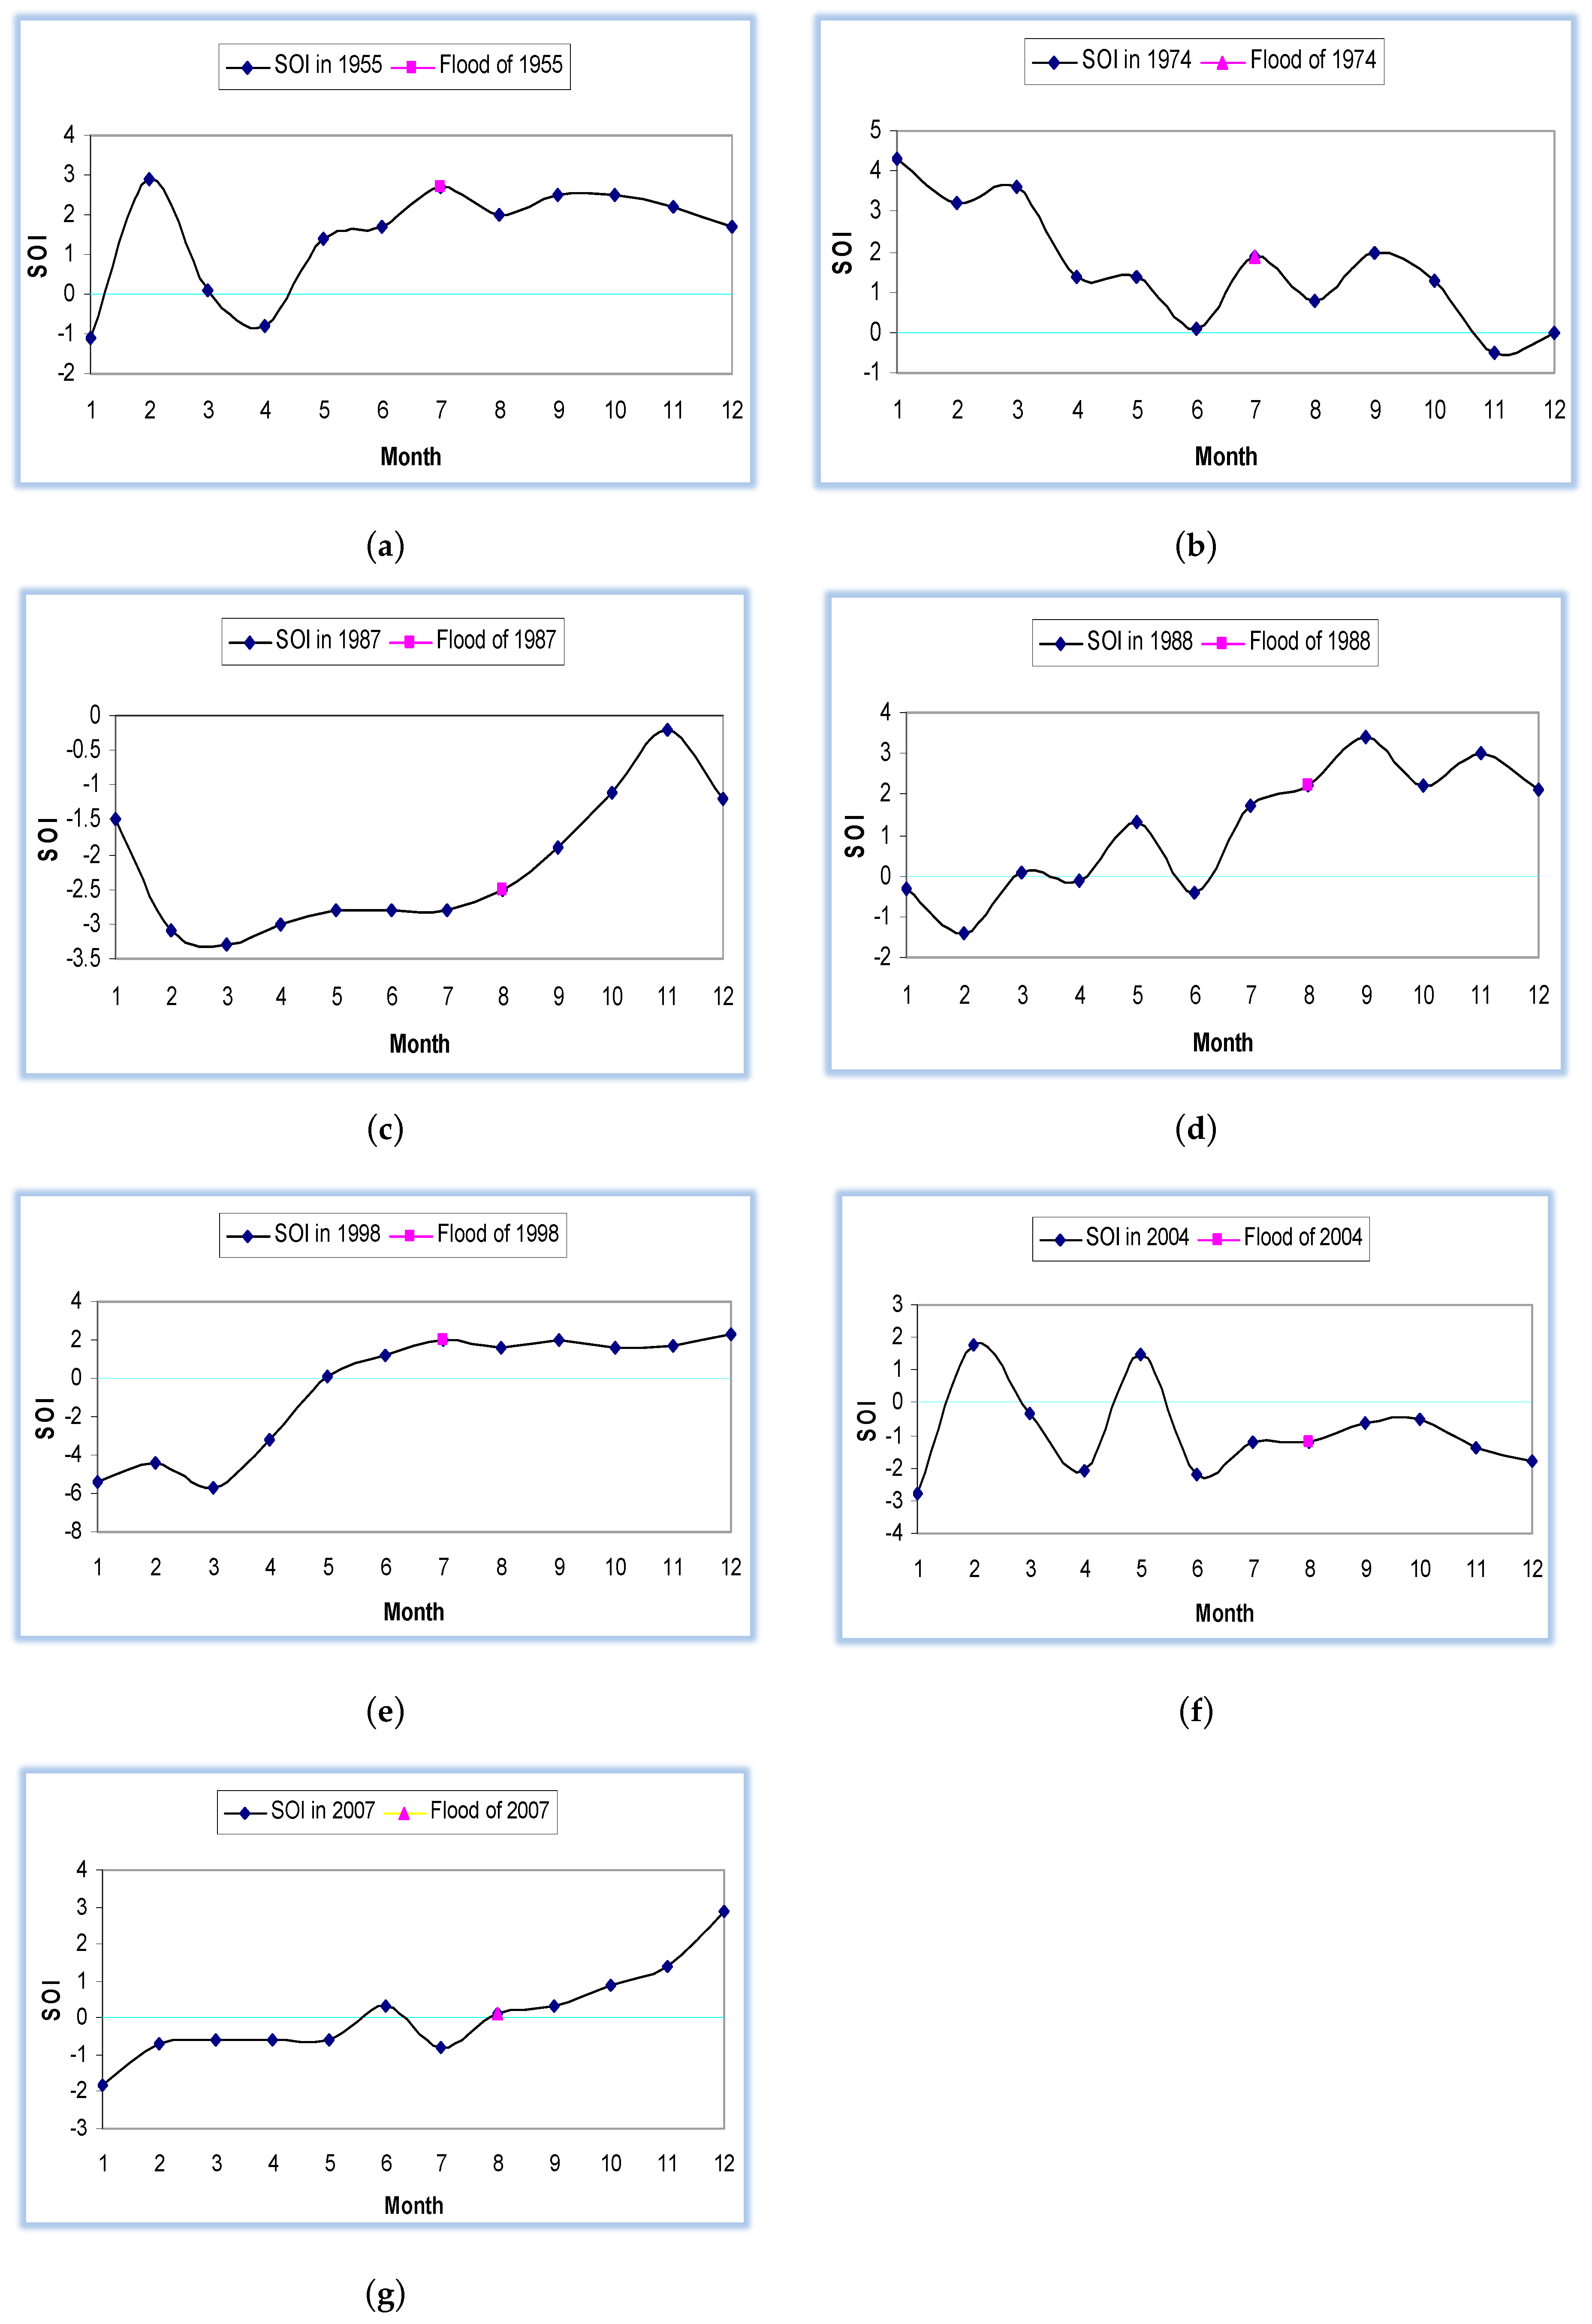
As shown in Figure 1b, Bangladesh receives most of the rainfall during monsoon season when the floods generally occur depending on the rainfall intensity in the catchments of the rivers. The major flood years have been categorized based on the amount of large affected area (at least one third portion of Bangladesh). At least two-third of the total area in Bangladesh was affected by the flood of 1988 and 1998 whereas, at least one-third part of Bangladesh was affected by the flood of 1955, 1974, 1987, 2004, and 2007 (Table 2). These years are then considered under the phase of ENSO to find which years belong to which ENSO phase (Table 2) so that a conclusion can be made on major floods of Bangladesh (Figure 2a–g) under ENSO timescales. The flood years of 1955 (Figure 2a), 1974 (Figure 2b), 1988 (Figure 2d), 1998 (Figure 2e) belong to La Niña and 1987 (Figure 2c), 2004 (Figure 2f) in El Niño and 2007 (Figure 2g) belongs to neutral ENSO phase.
A flood occurred during July–August in 1955 which inundated 34.20% area of Bangladesh and SOI indicates positive value in this time, as a result La Niña was prominent in that period (Figure 2a). La Niña (Figure 2a,b,d,e) was also prominent in 1974 (inundated about 36.6%), 1988 (inundated about 60%), 1998 (maximum inundated ~68% area of Bangladesh) and floods occurred in monsoon period (July–August). On the other hand, El Niño (Figure 2c,f) was also prominent in 1987 (inundated about 40%) and 2004 (inundated about 38%), respectively. A flood in 2007 (inundated about 42%) was recorded under neutral phase of ENSO (Figure 2g).

3.2. Categorizing of Major TCs on ENSO Timescales

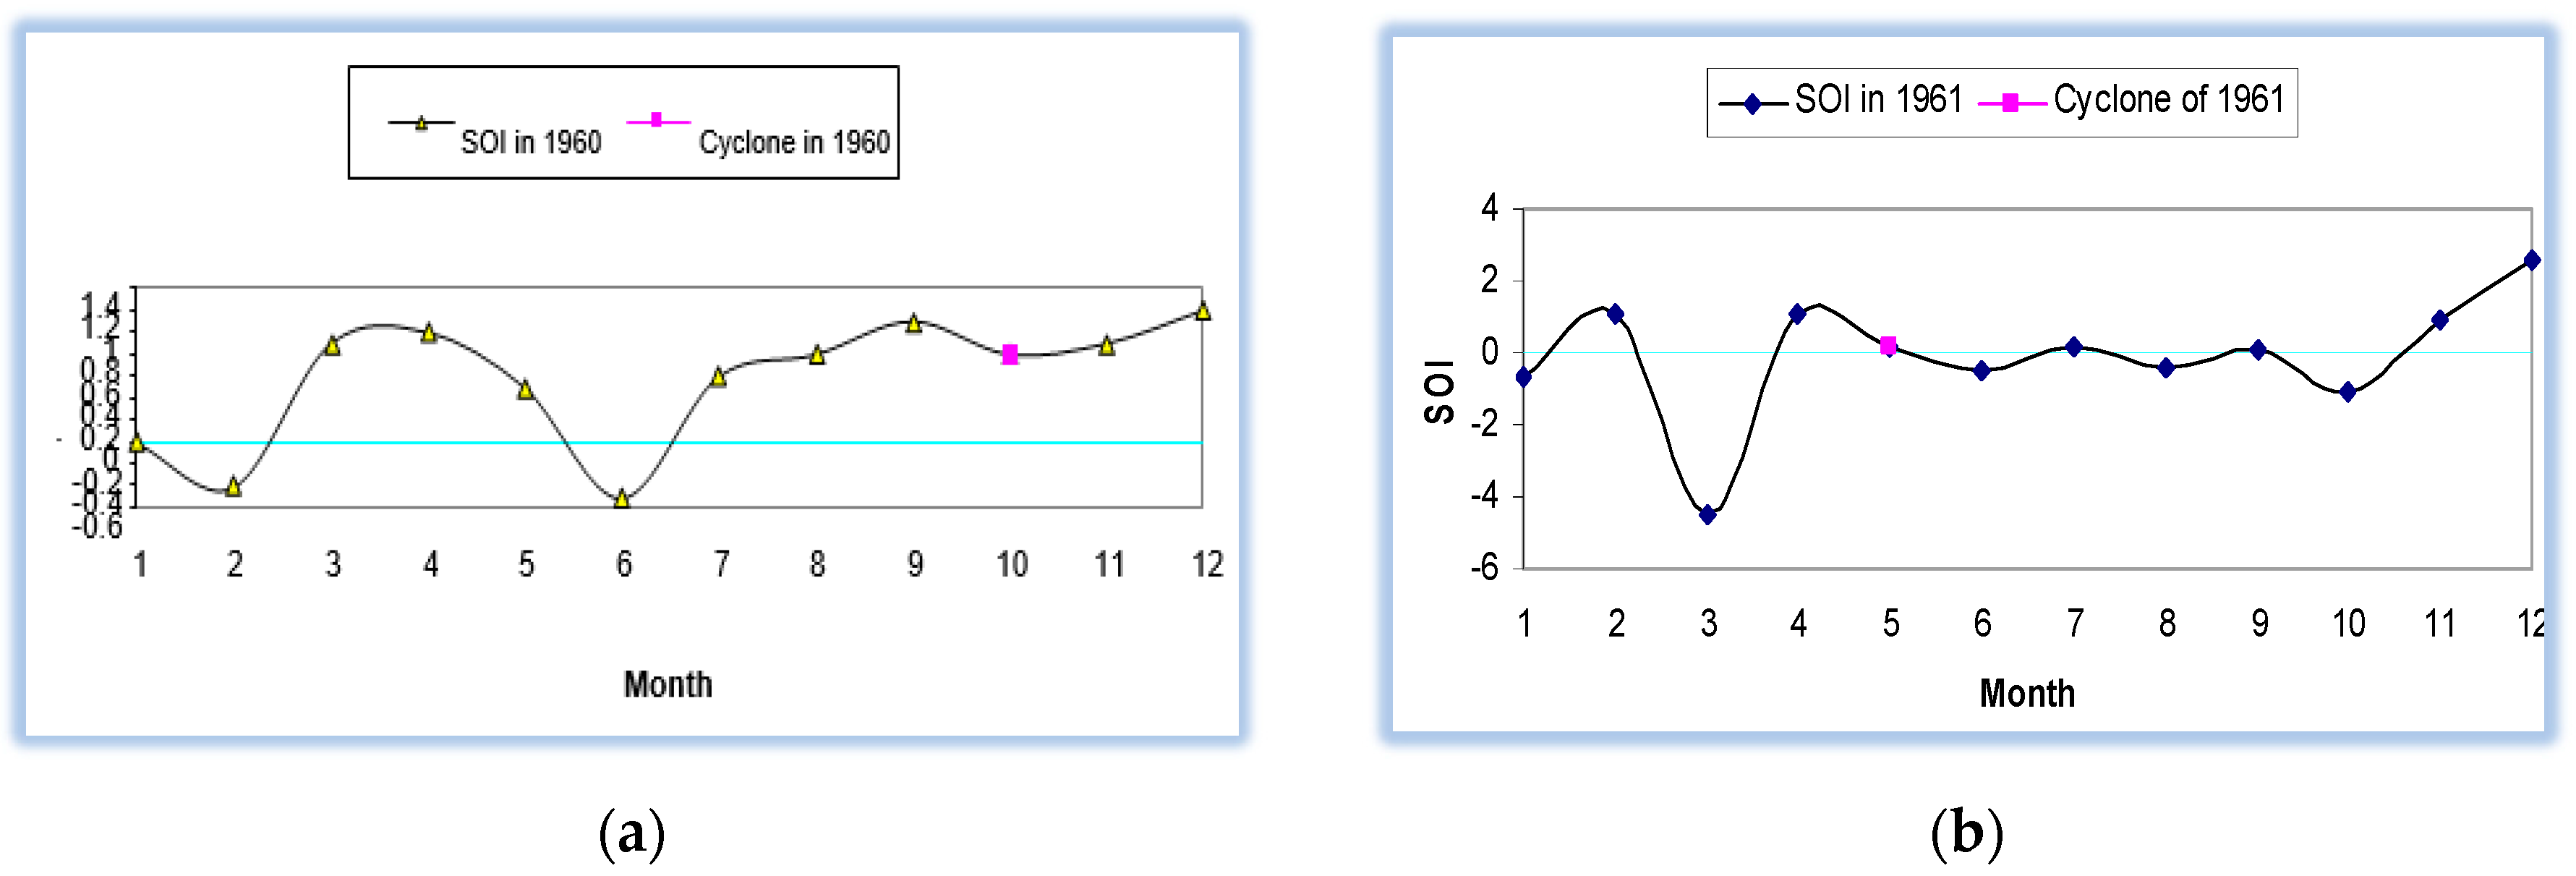
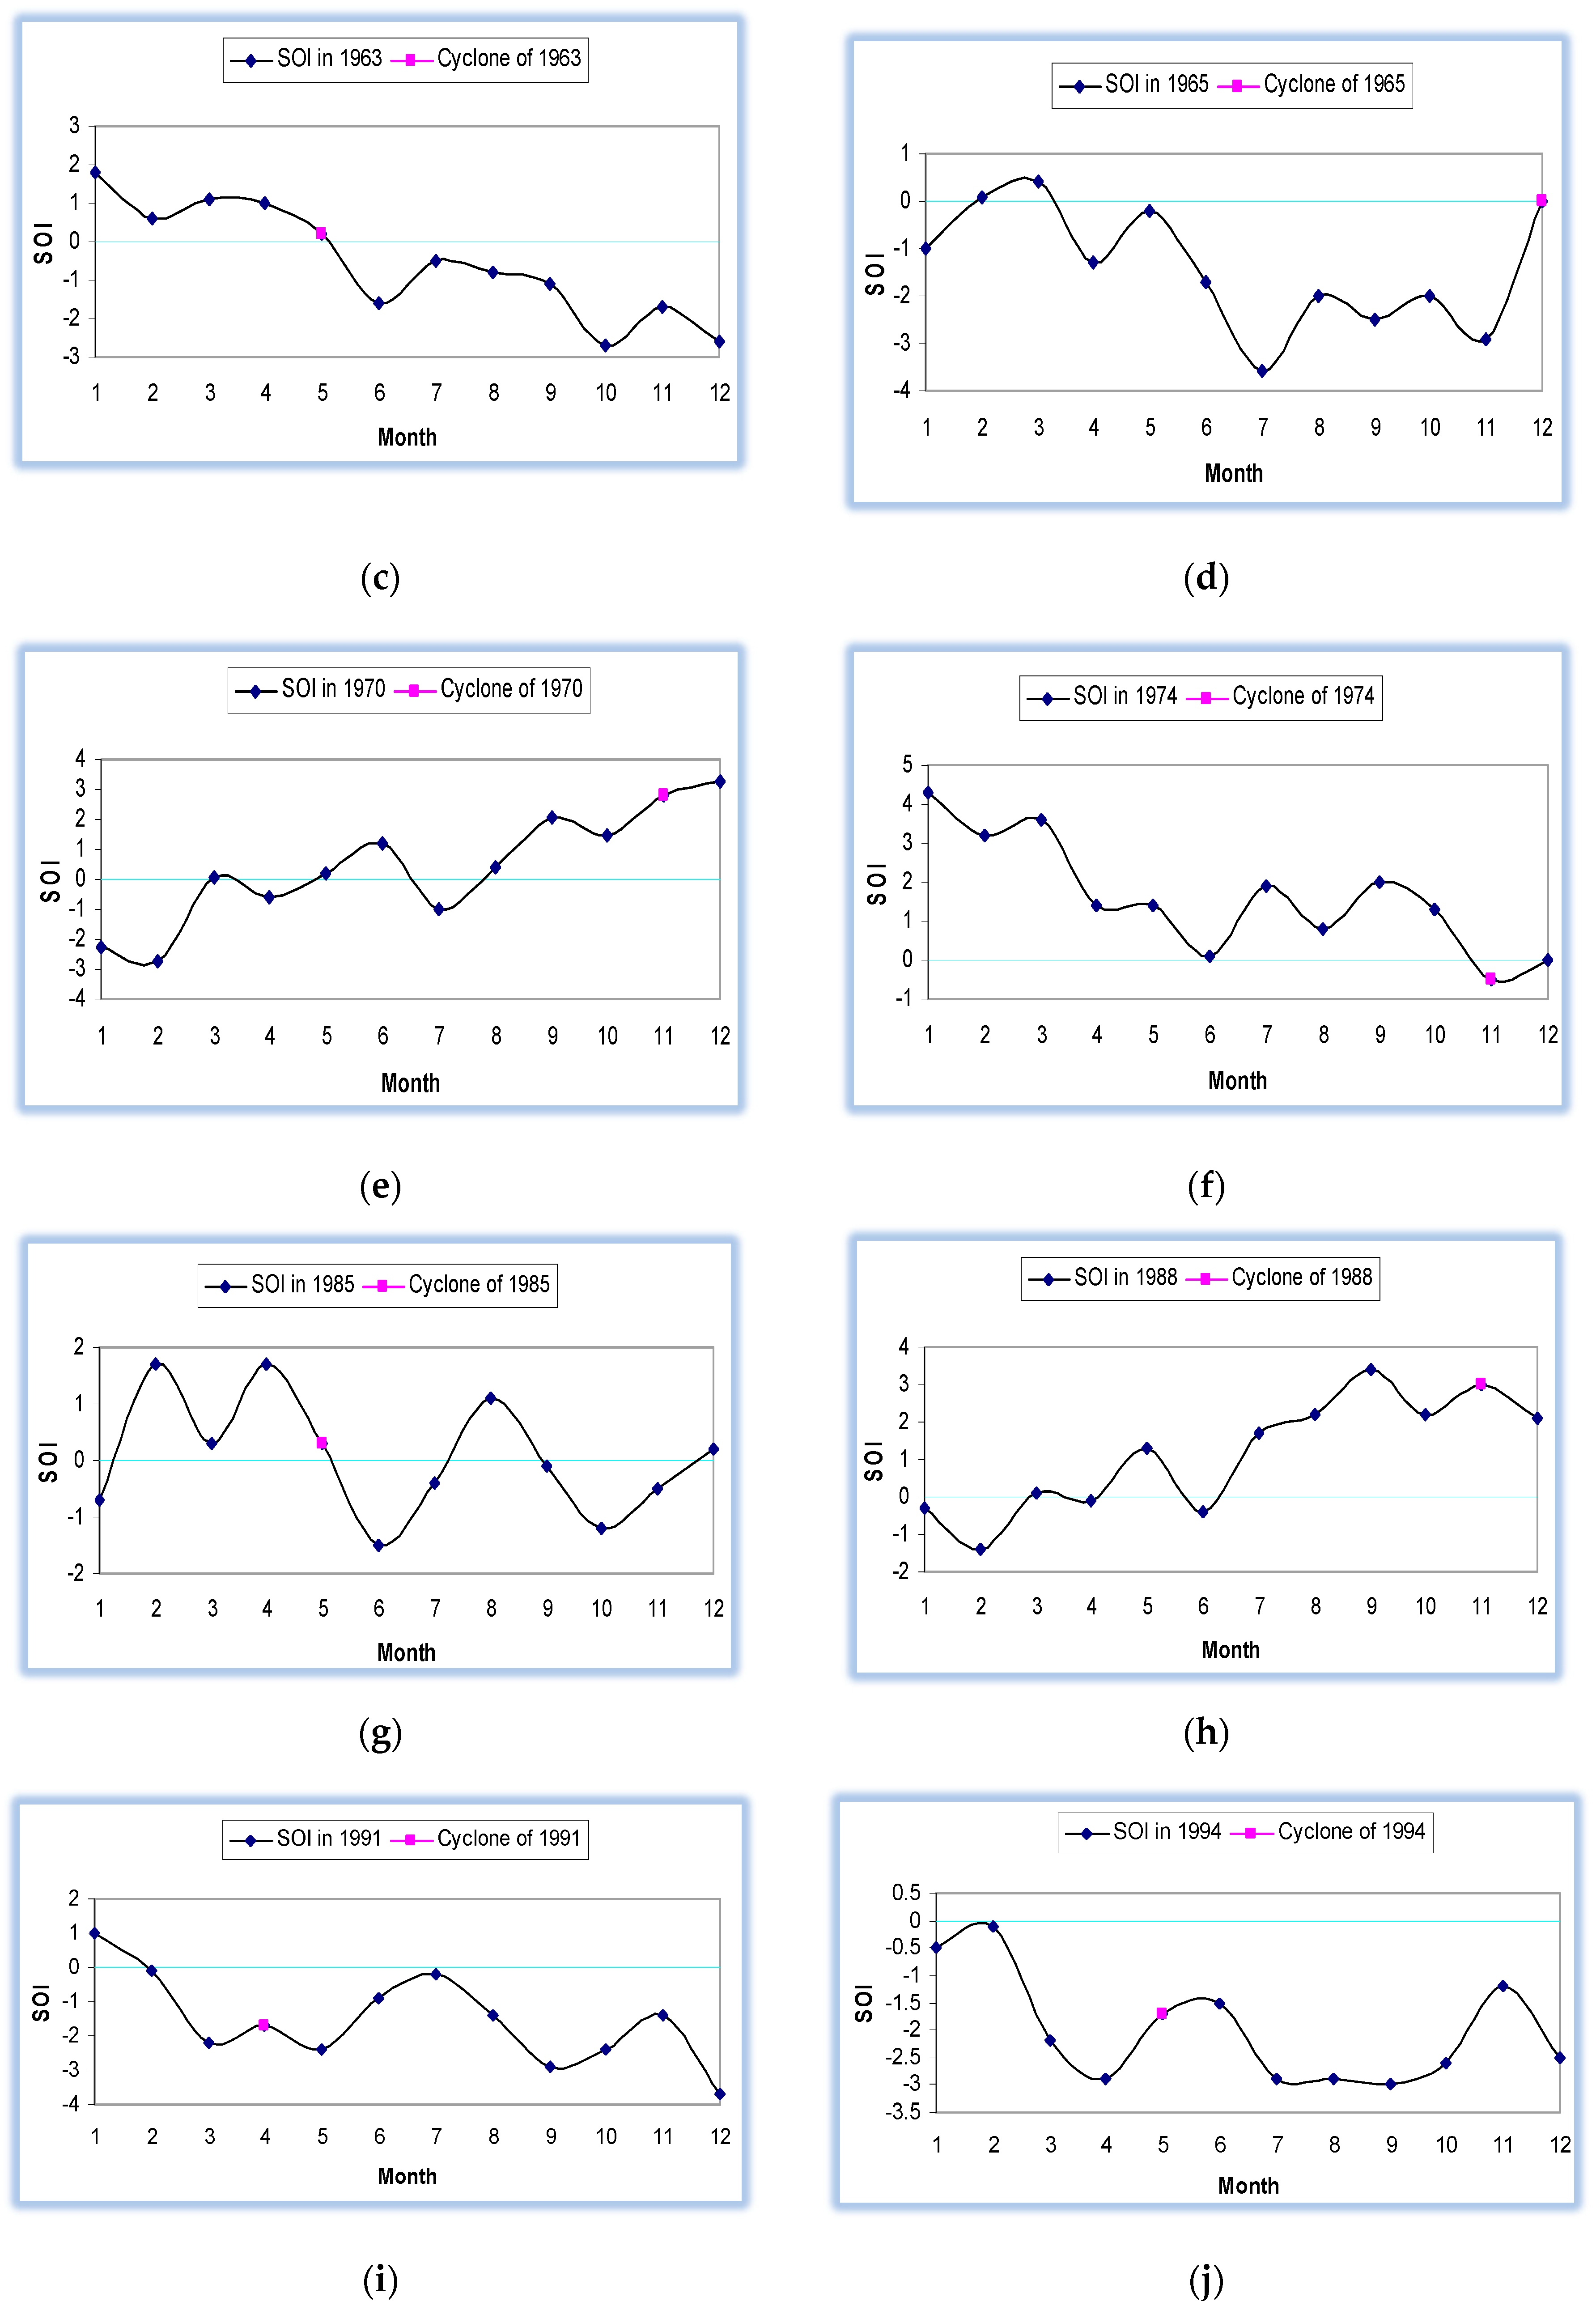
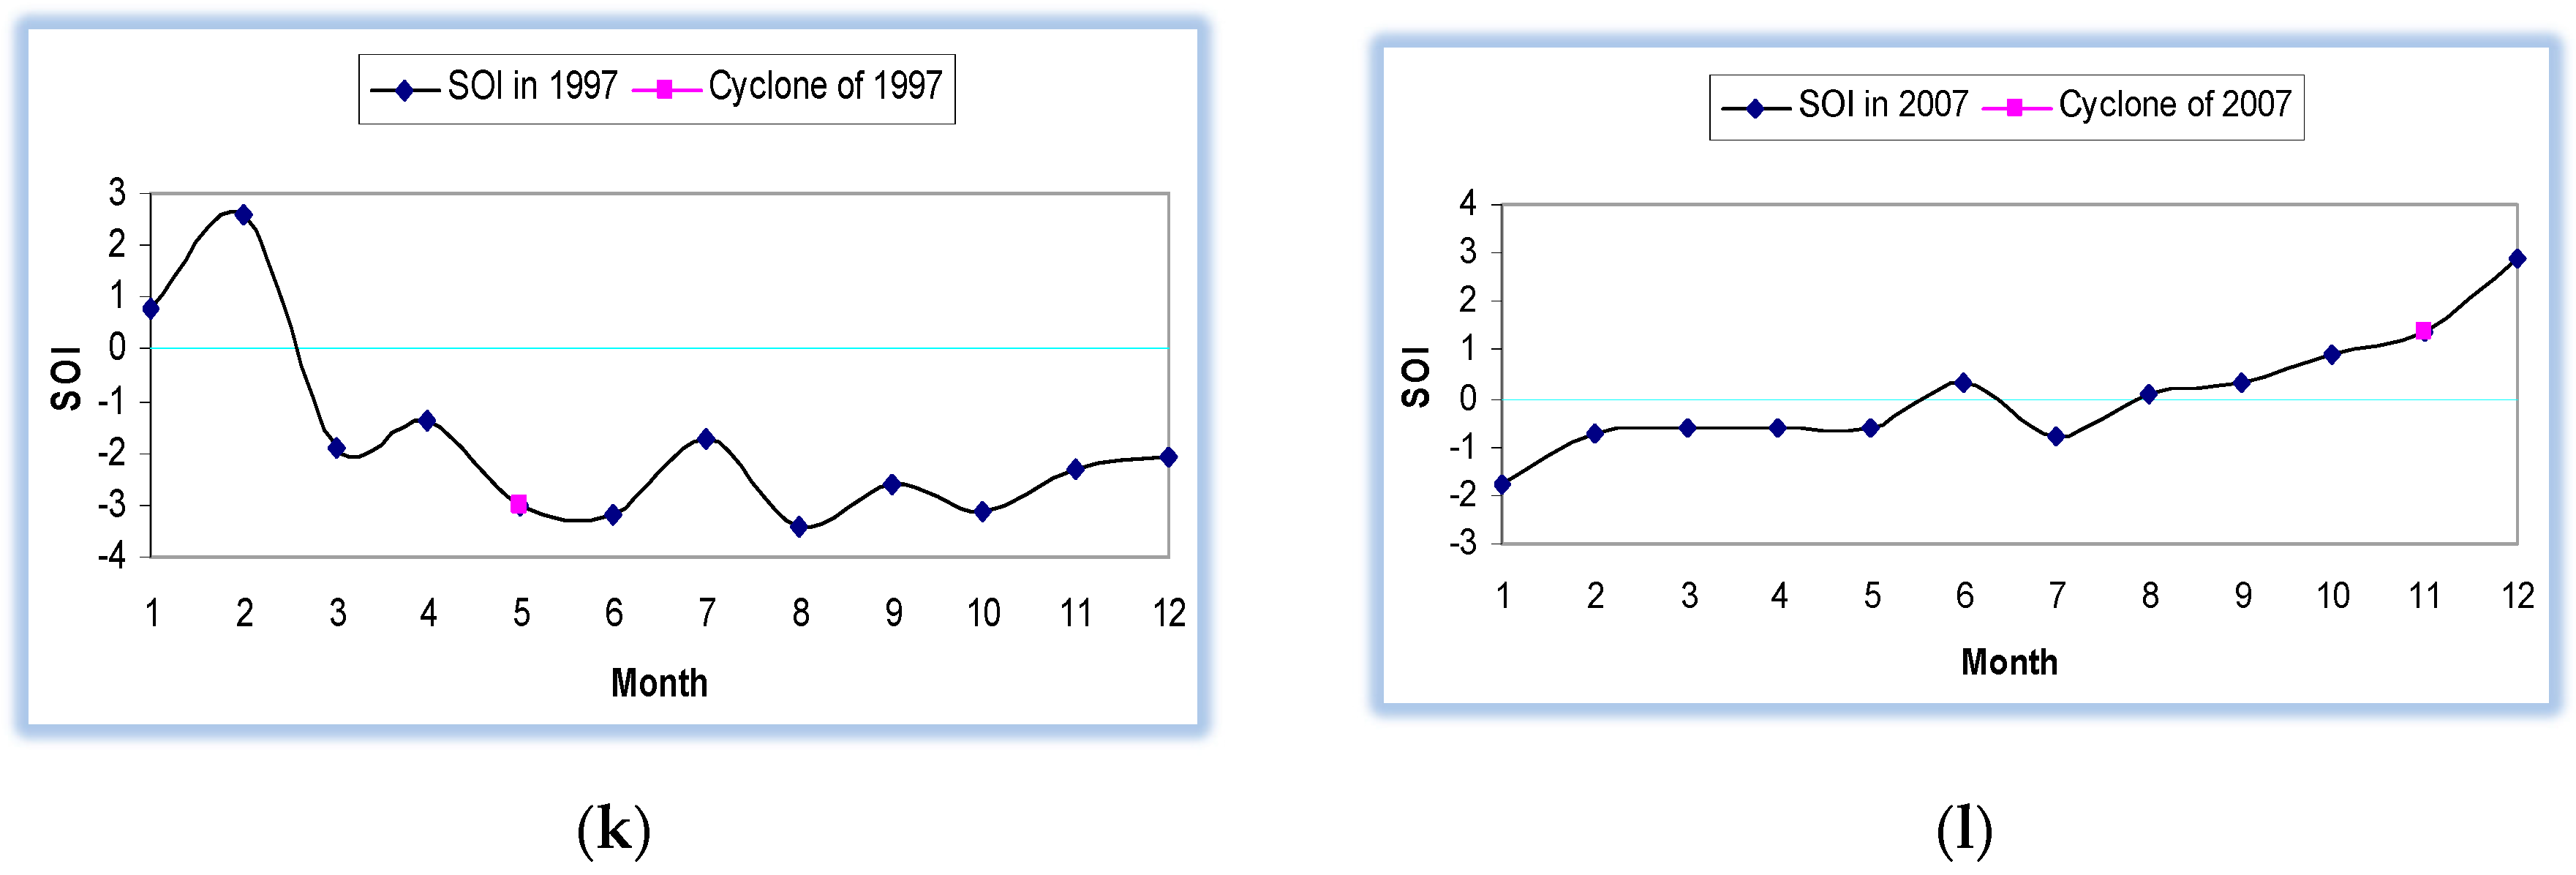
Twelve severe cyclonic storms with hurricane speed (on the basis of maximum wind speeds) were identified (Table 3). La Niña (Figure 3a,e,h,l) was prominent in 1960 (wind speed 193 km/h), 1970 (wind speed 193 km/h), 1988 (wind speed 193 km/h), and 2007 (wind speed 193 km/h). On the other hand, El Niño (Figure 3i,j,k) was also prominent in 1991 (wind speed 225 km/h), 1994 (wind speed 200 km/h), and 1997 (wind speed 230 km/h), respectively. Rest five TCs 1961 (wind speed 161 km/h), 1963 (wind speed 202 km/h), 1965 (wind speed 184 km/h), 1974 (wind speed 161 km/h), 1985 (wind speed 154 km/h) were under neutral phase of ENSO (Figure 3b–d,f,g).
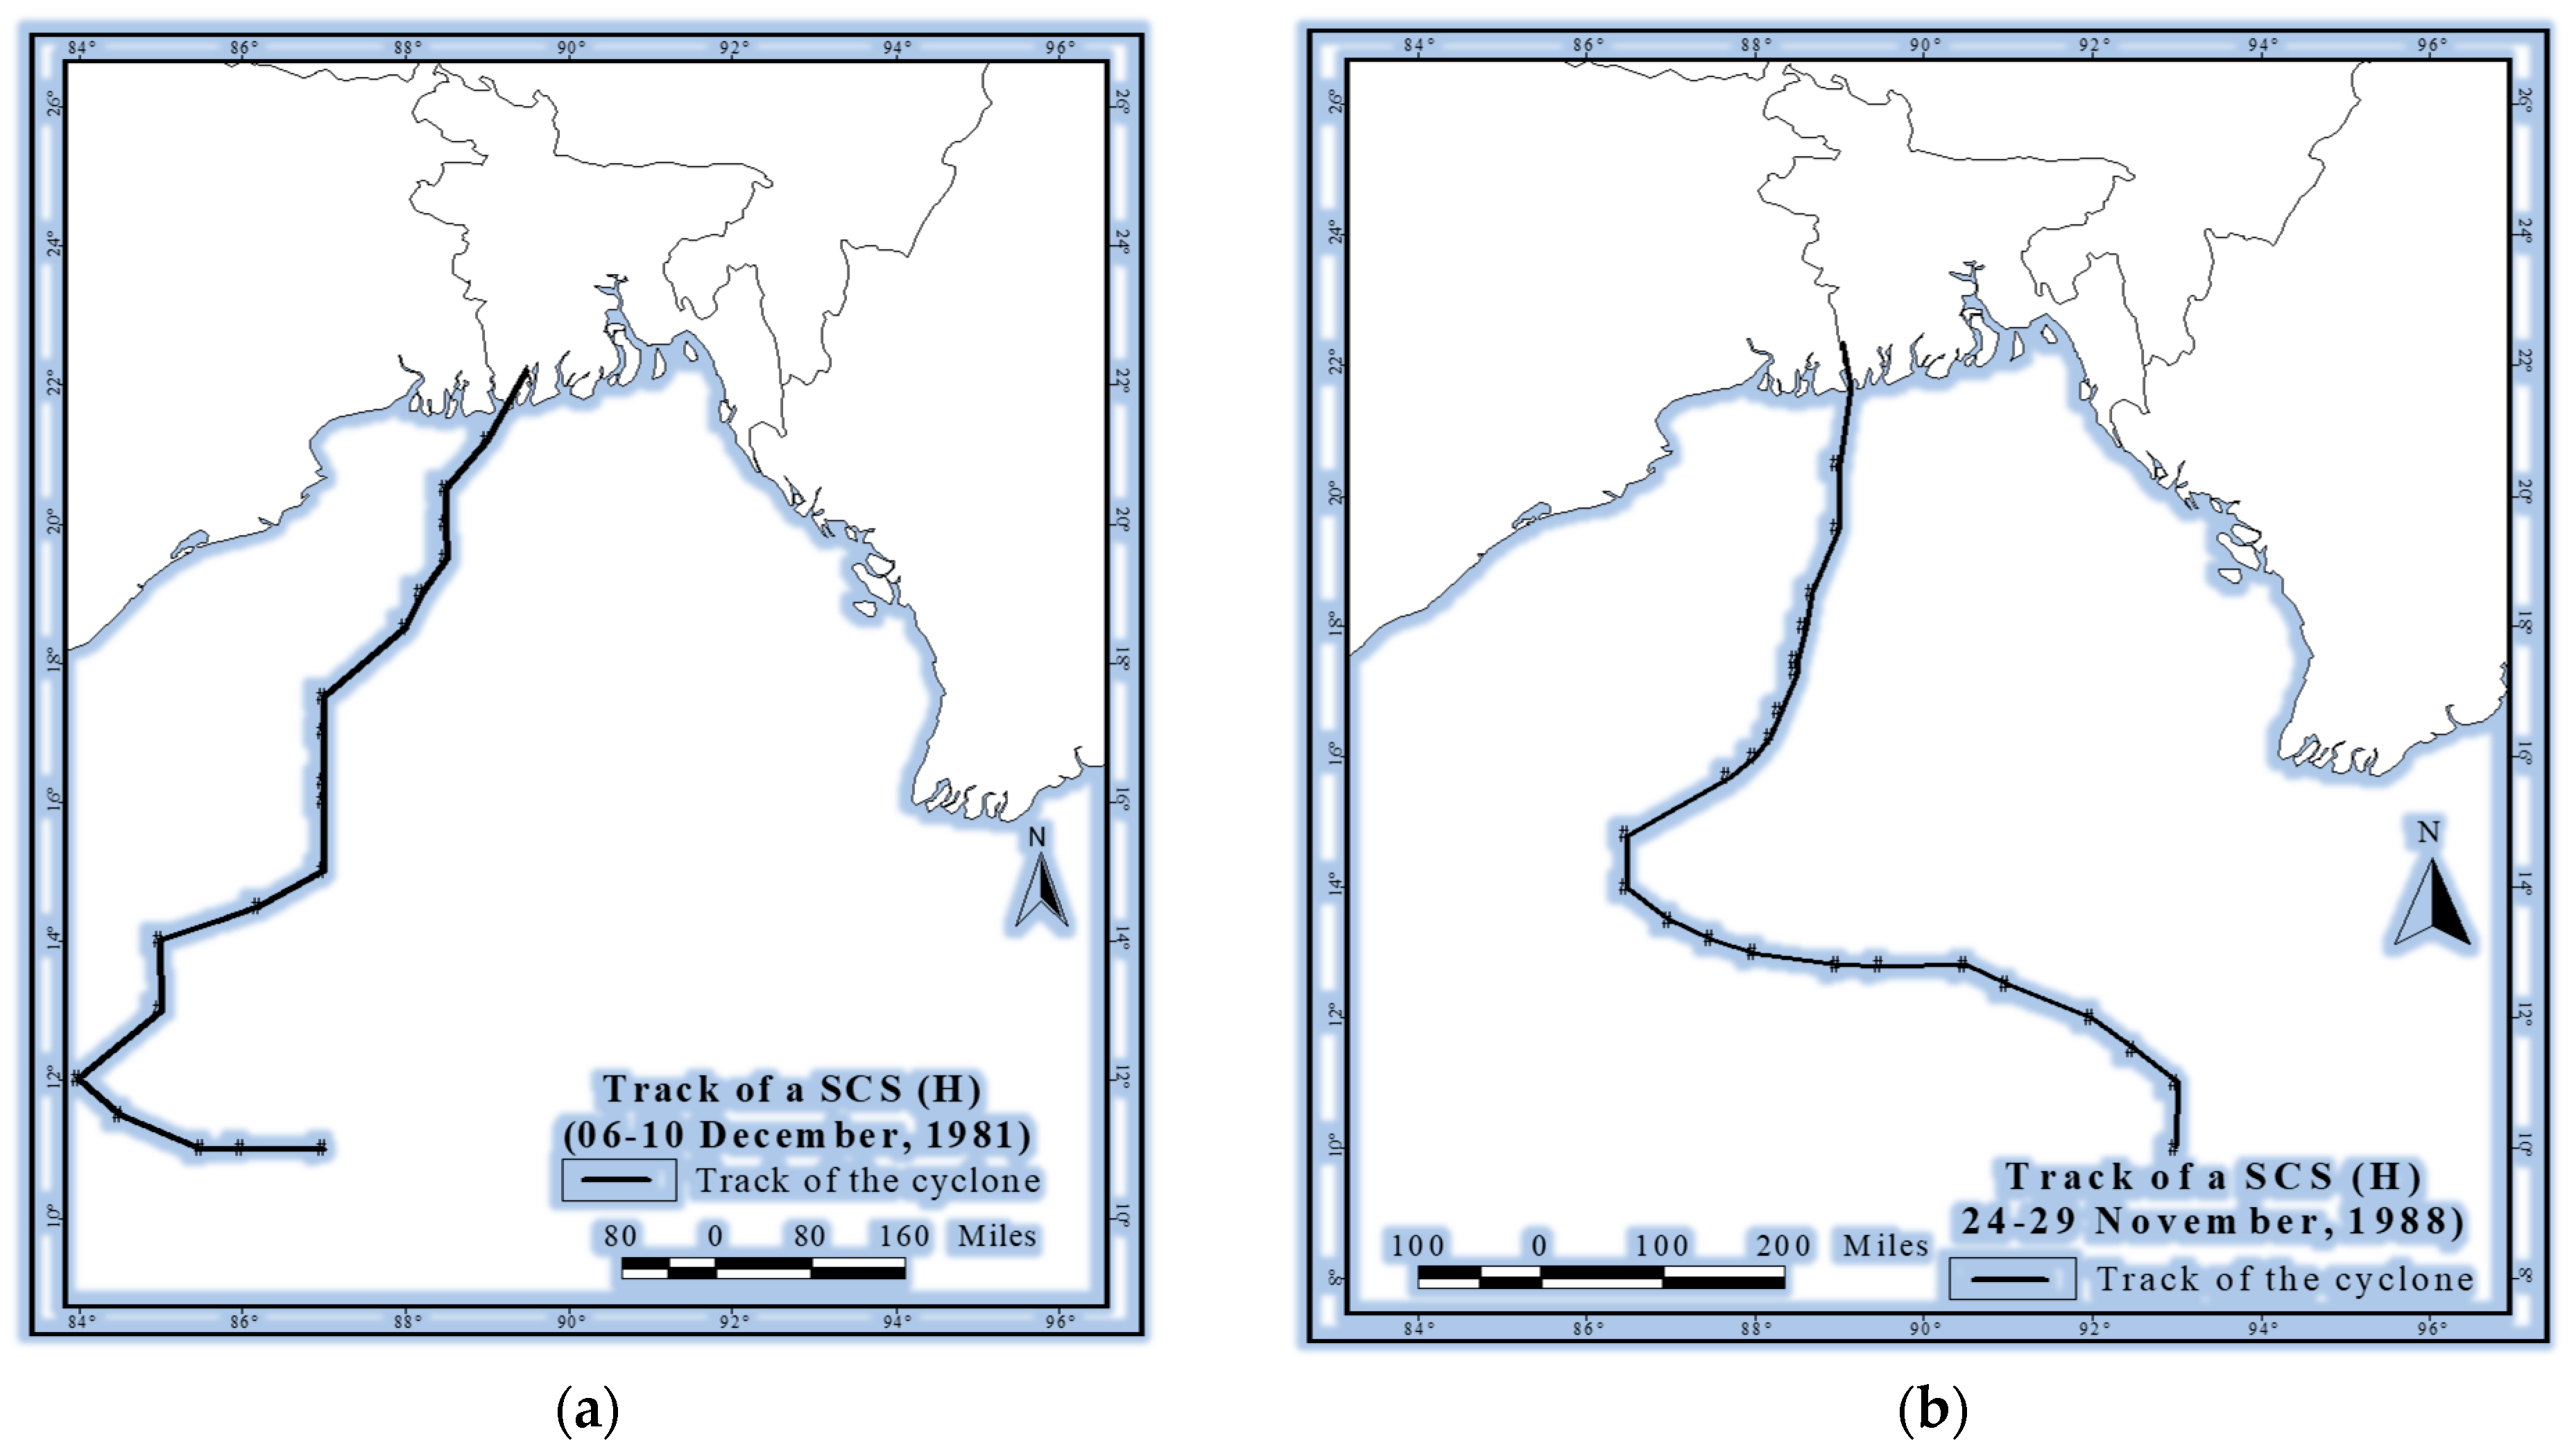
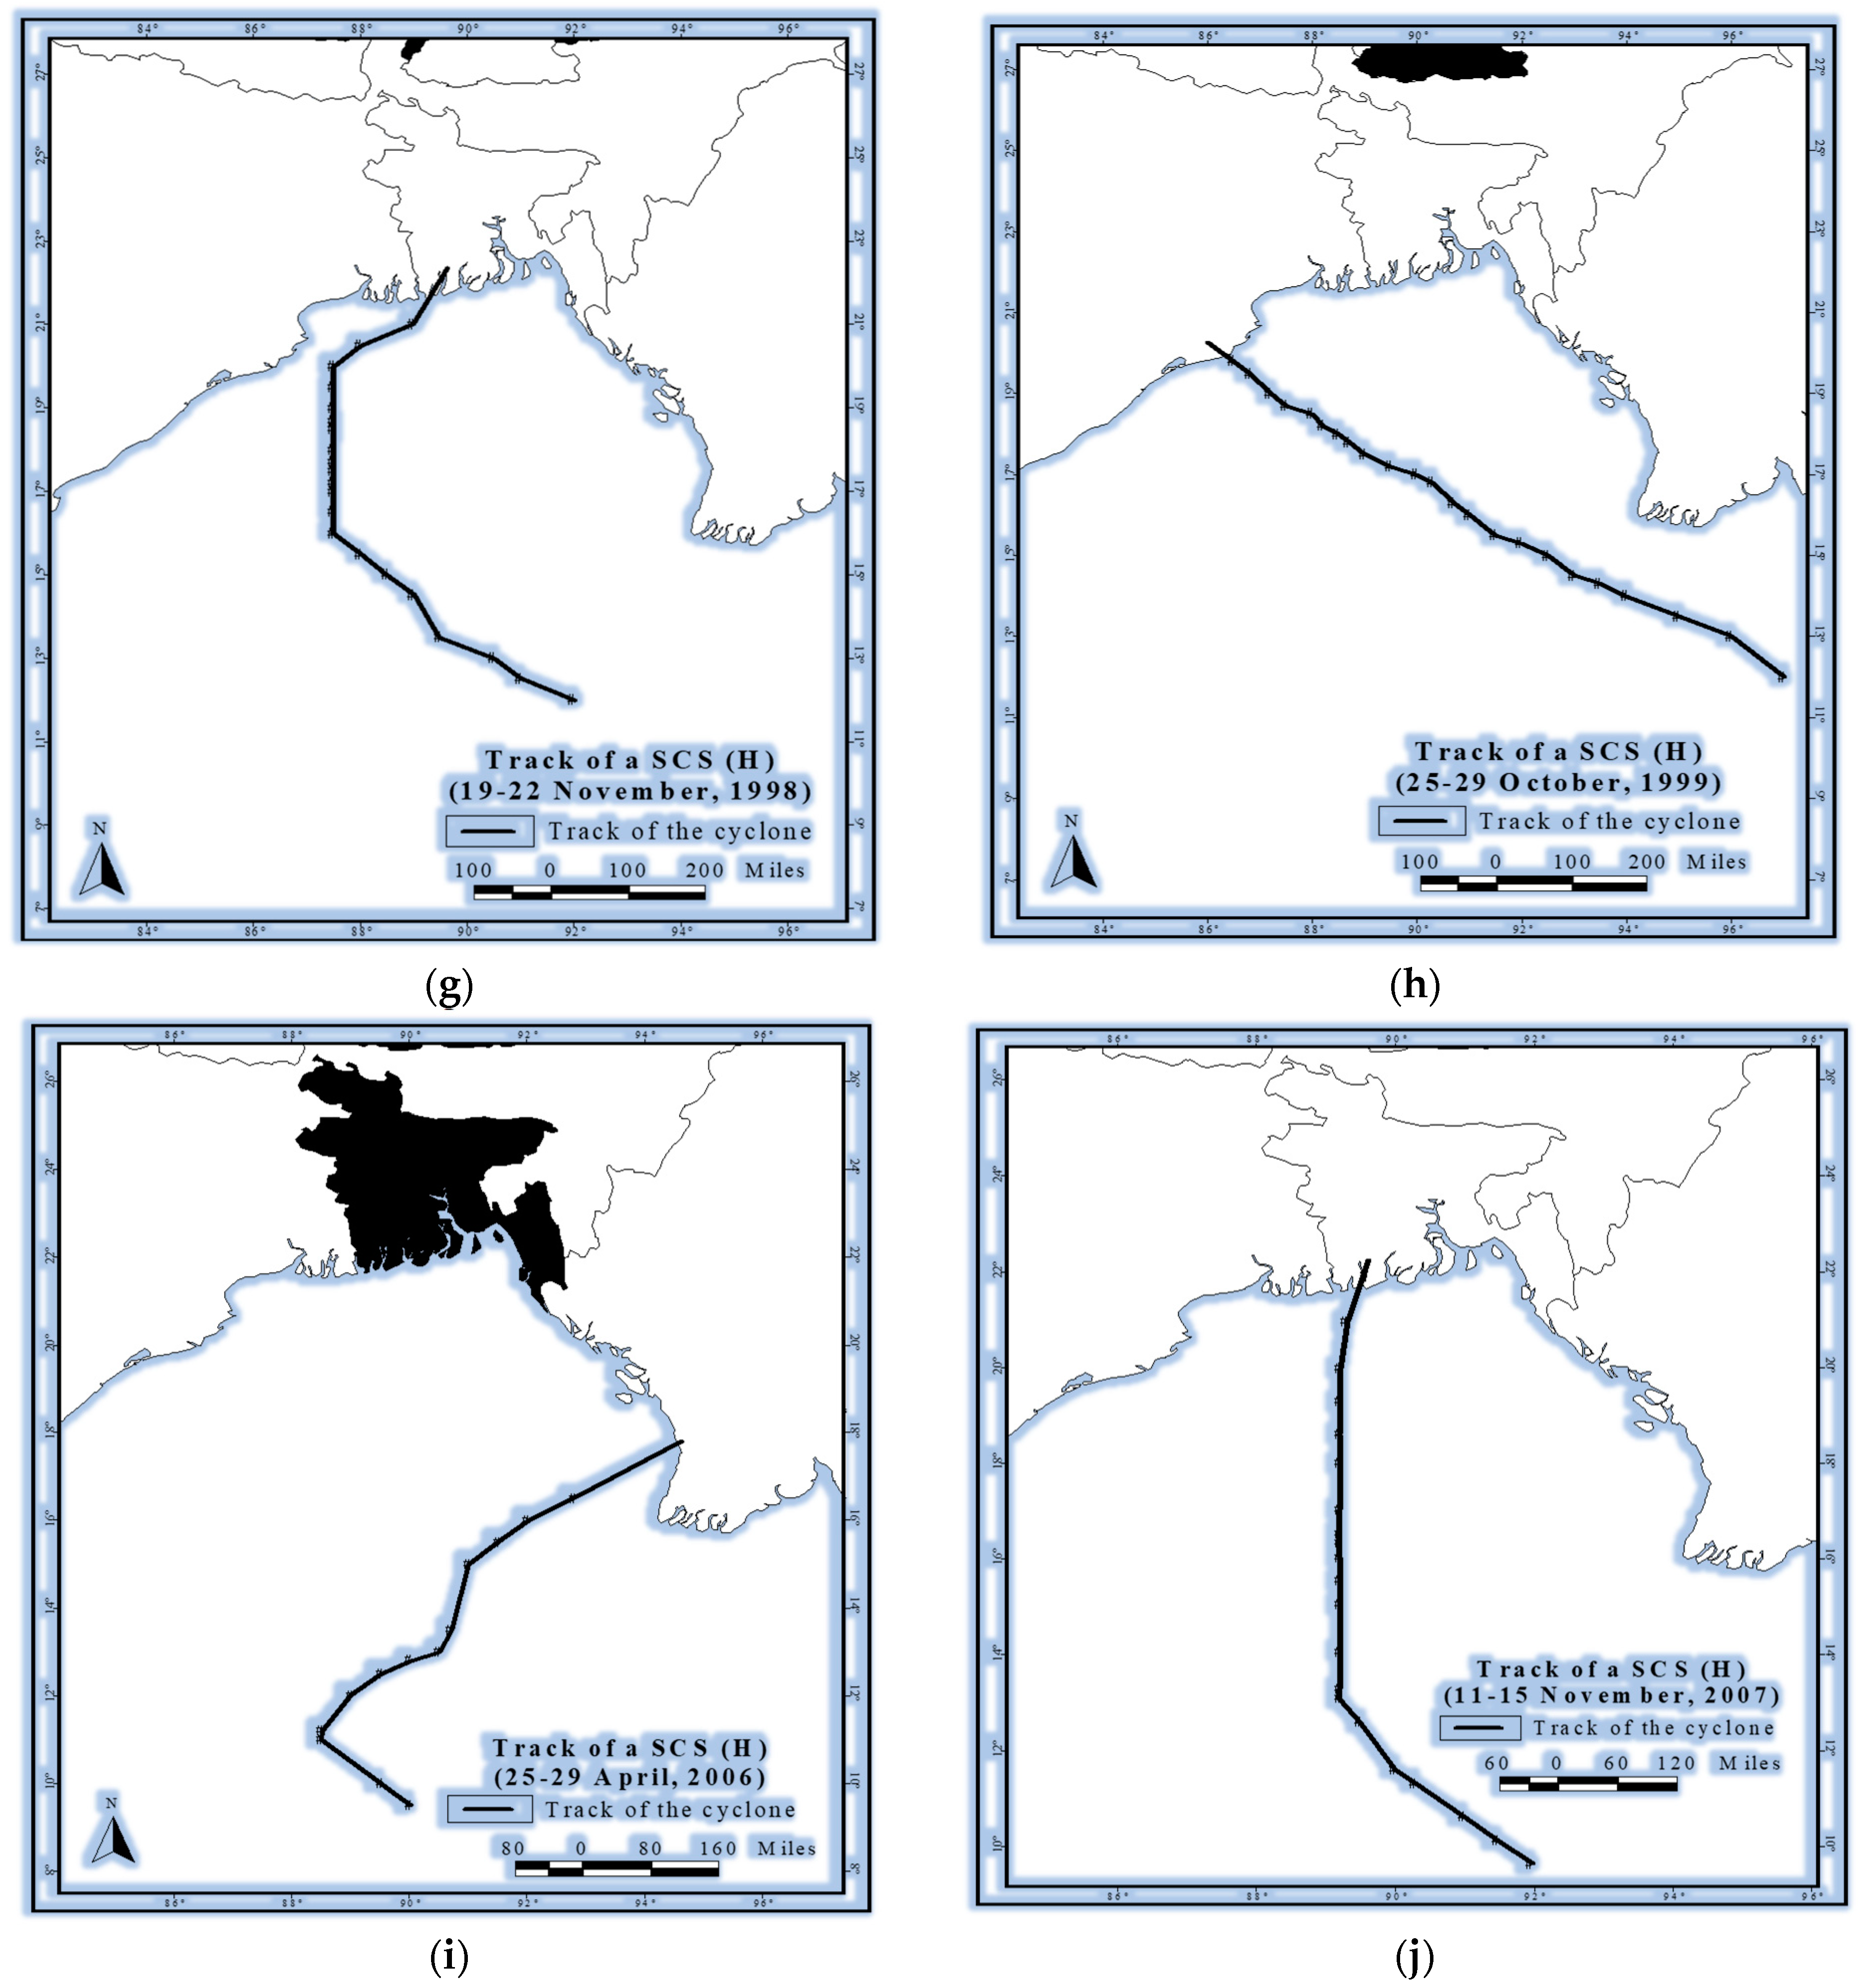
As a case study among ten cyclones, the re-curvature of cyclone tracks has been studied (Figure 4a–j). Ten TCs tracks analysis over the BoB (affected Bangladesh) show that the re-curvature takes place between 14–19° N for those developed in El Niño and 12–16° N for those developed in La Niña with one exception of 29 October, 1999 cyclone which had no re-curvature (Table 4 and Figure 4a–j).

3.3. Mechanisms

The ENSO affects Indian monsoon through an interaction between the equatorial Walker circulation and the regional Hadley circulation, which are considered as the world’s two prominent and important atmospheric zonal and meridional circulations, respectively. There is a reduction of rainfall in Bangladesh for all seasons during El Niño events and Bangladesh did not face any catastrophic flood during the strong El Niño events. However, the weak El Niño and the transitional time from El Niño to La Niña are favourable for having floods and TCs in Bangladesh. There is a strong correlation between monsoon years and strong La Niña events. During El Niño years, Bangladesh is not struck by any catastrophic cyclone but when the ENSO index is small (either negative or positive) and when 28.5 ℃ isotherm stays left of 165° E longitude then Bangladesh is likely being hit by a cyclone. This is the case for seeing cyclones in the pre-monsoon season in El Niño events. When the ENSO index is positive, Walker circulation is strong, atmospheric pressure in pacific is high and wind is easterly. During the negative ENSO index phase, the Walker circulation is weakened, and the easterly wind is reversed. When the Walker circulation is weakened then Hadley circulation gets stronger. The strength of Bangladesh monsoon is governed by the movements of cyclonic disturbances formed in the Pacific. During the weak or moderate El Niño events, the Hadley circulation may not be very strong and allows some of the tropical disturbances to cross into the BoB and enter up to Bangladesh region causing flood and cyclone, as Bangladesh falls between 22 and 26° N of the equator [22].
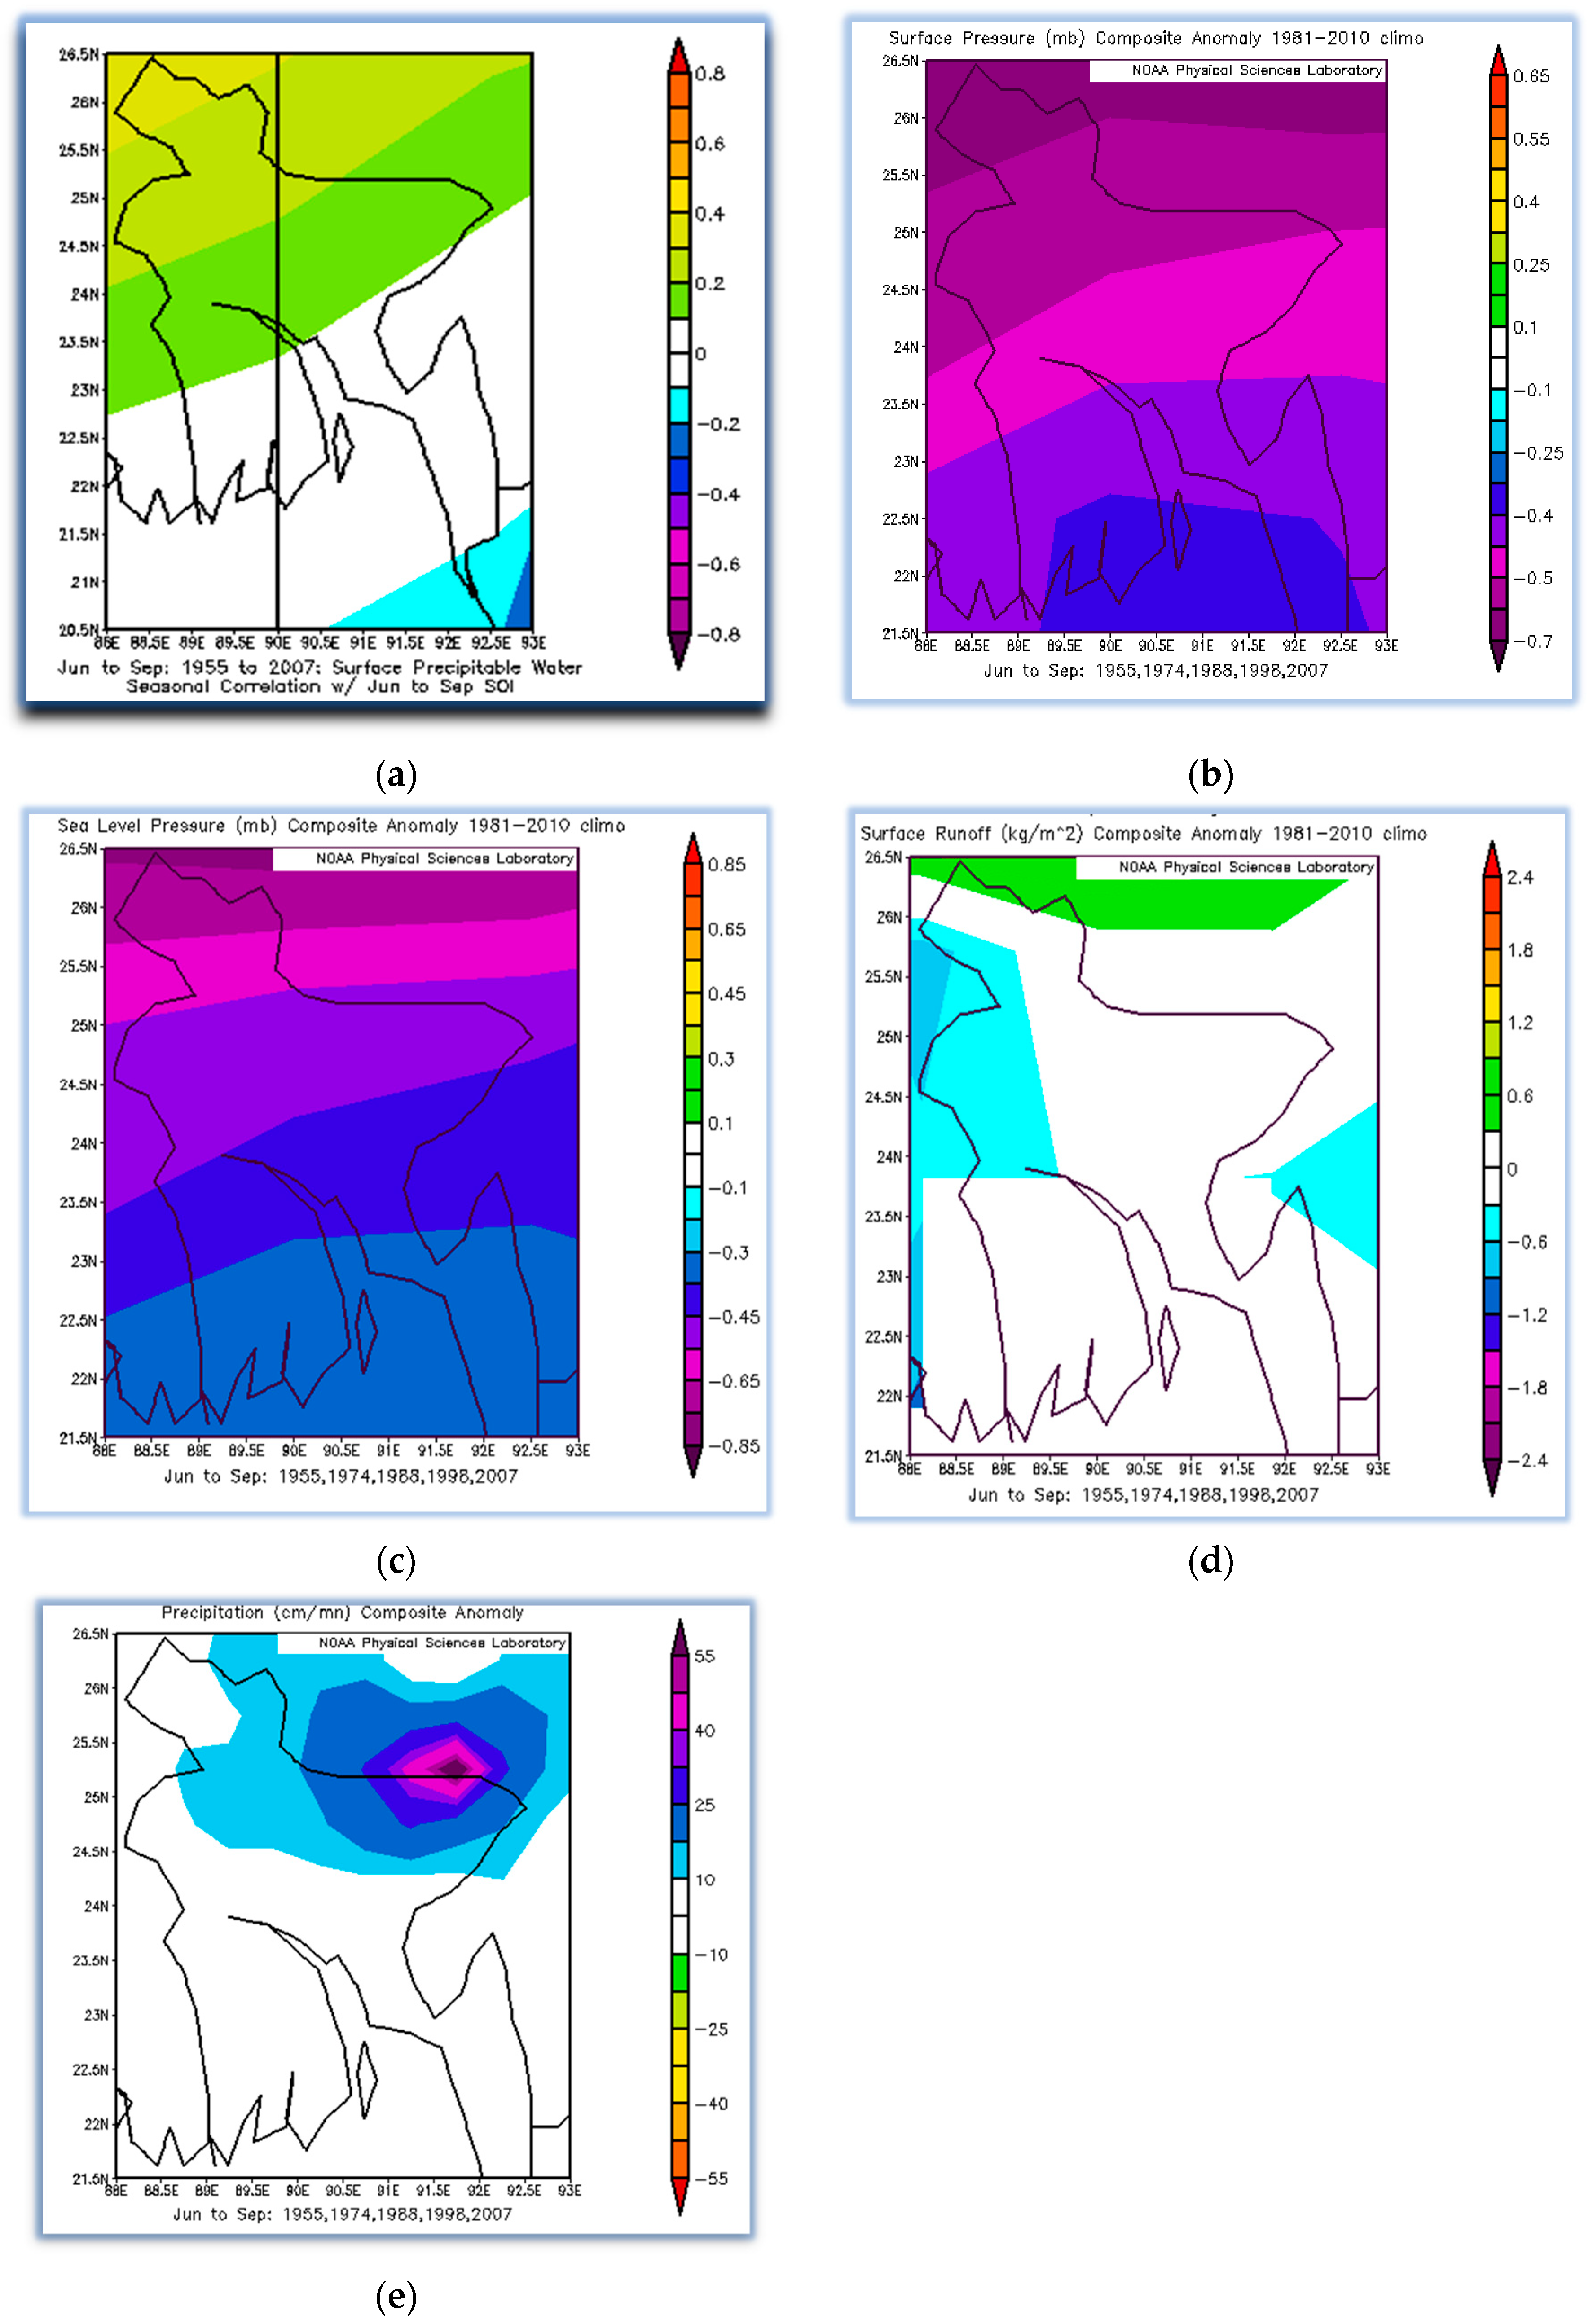
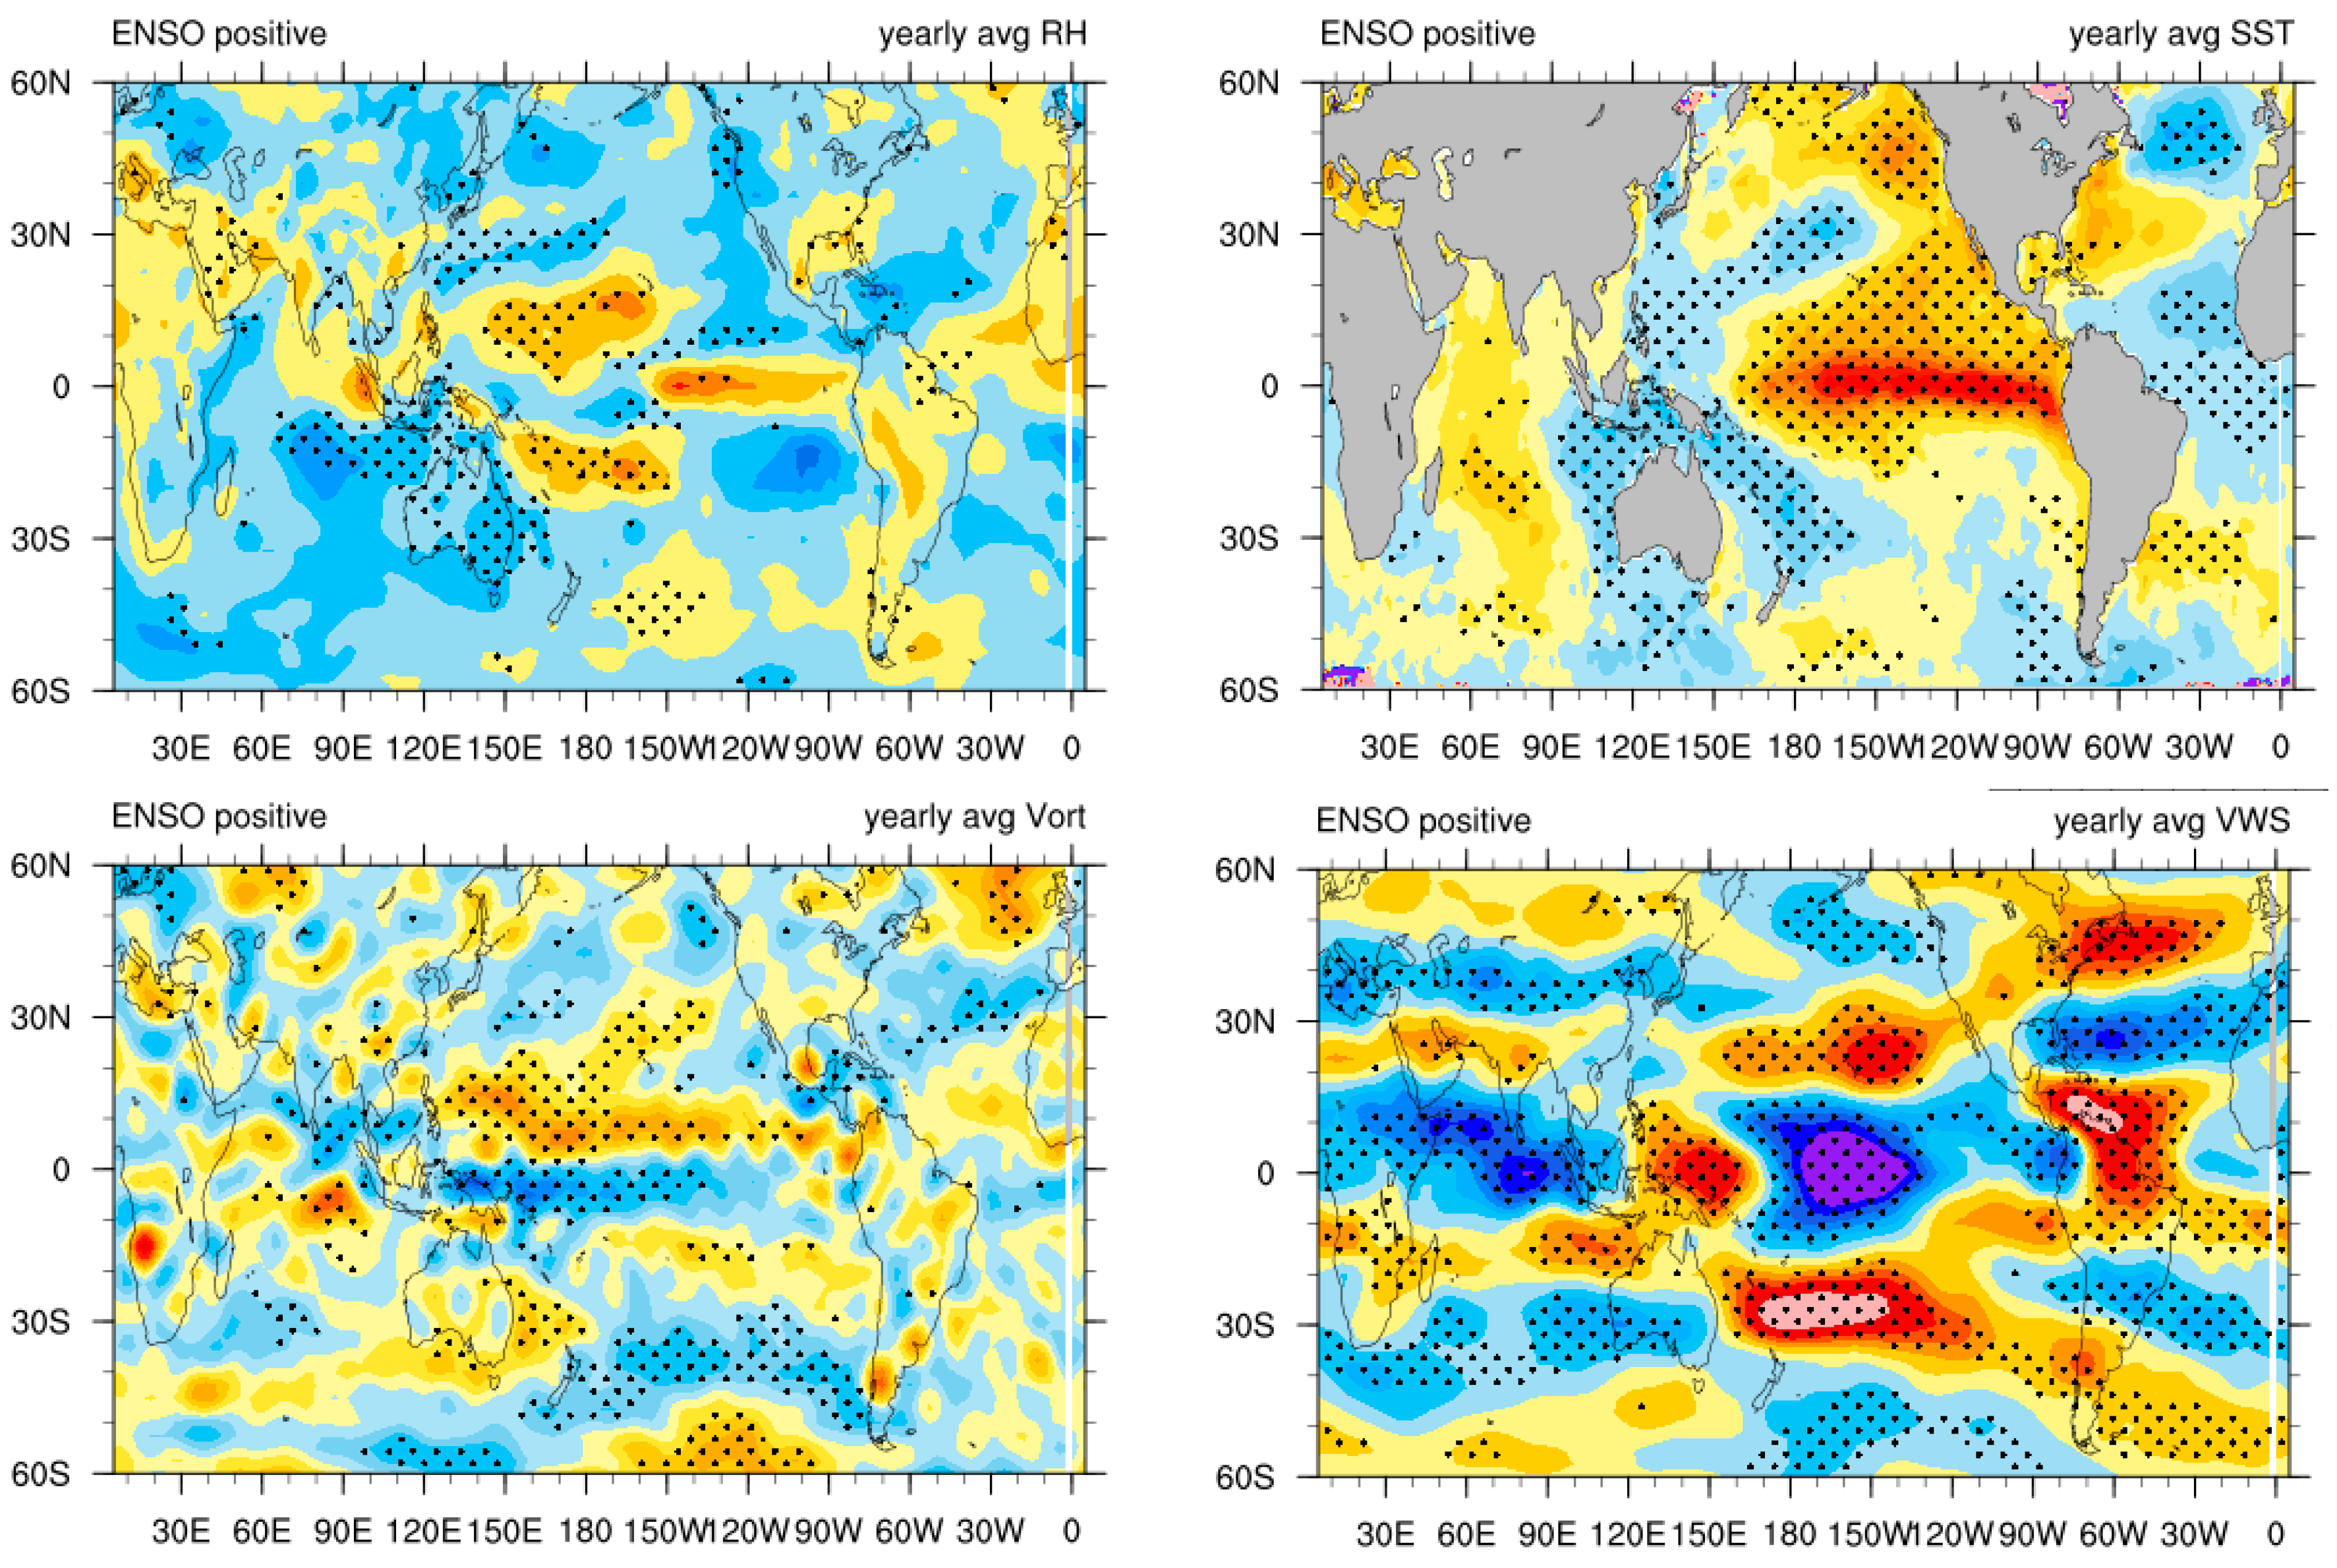
As shown in Section 3.1 and Section 3.2, Bangladesh faces more floods and TCs during La Niña. Figure 5 shows the composite anomalies of precipitable water, surface pressure, sea level pressure, surface runoff, and precipitation during La Niña events. We can see that these synoptic conditions are favourable in La Niña. For example, the surface precipitable water is positively correlated in the northern area of Bangladesh (Figure 5a) where the major river systems in Bangladesh are located and Himalaya is also located in the north of Bangladesh. Other synoptic variables (surface pressure, sea level pressure, surface runoff, and precipitation climatology) are favorable for flood events in La Niña (Figure 5b–e). Figure 6 shows the annual average anomalies of relative humidity, sea surface temperature, vorticities, and vertical wind shear in La Niña phase. During La Niña period, the low vertical wind shear and enhanced low level vorticity, relative humidity, sea surface temperature are more favorable environment for TC development in the BoB. This is consistent with the study by Wahiduzzaman et al. [29].

4. Conclusions

The geographical location, land characteristics, multiplicity of rivers, and the monsoon climate render Bangladesh highly vulnerable to natural hazards like TC, storm surge, flood, drought, tornado, riverbank erosion etc. Flood and TC are not a new phenomenon in Bangladesh. A total of 7 floods and 14 TCs were more devasting and catastrophic in terms of their intensity and percentage of total affected area.
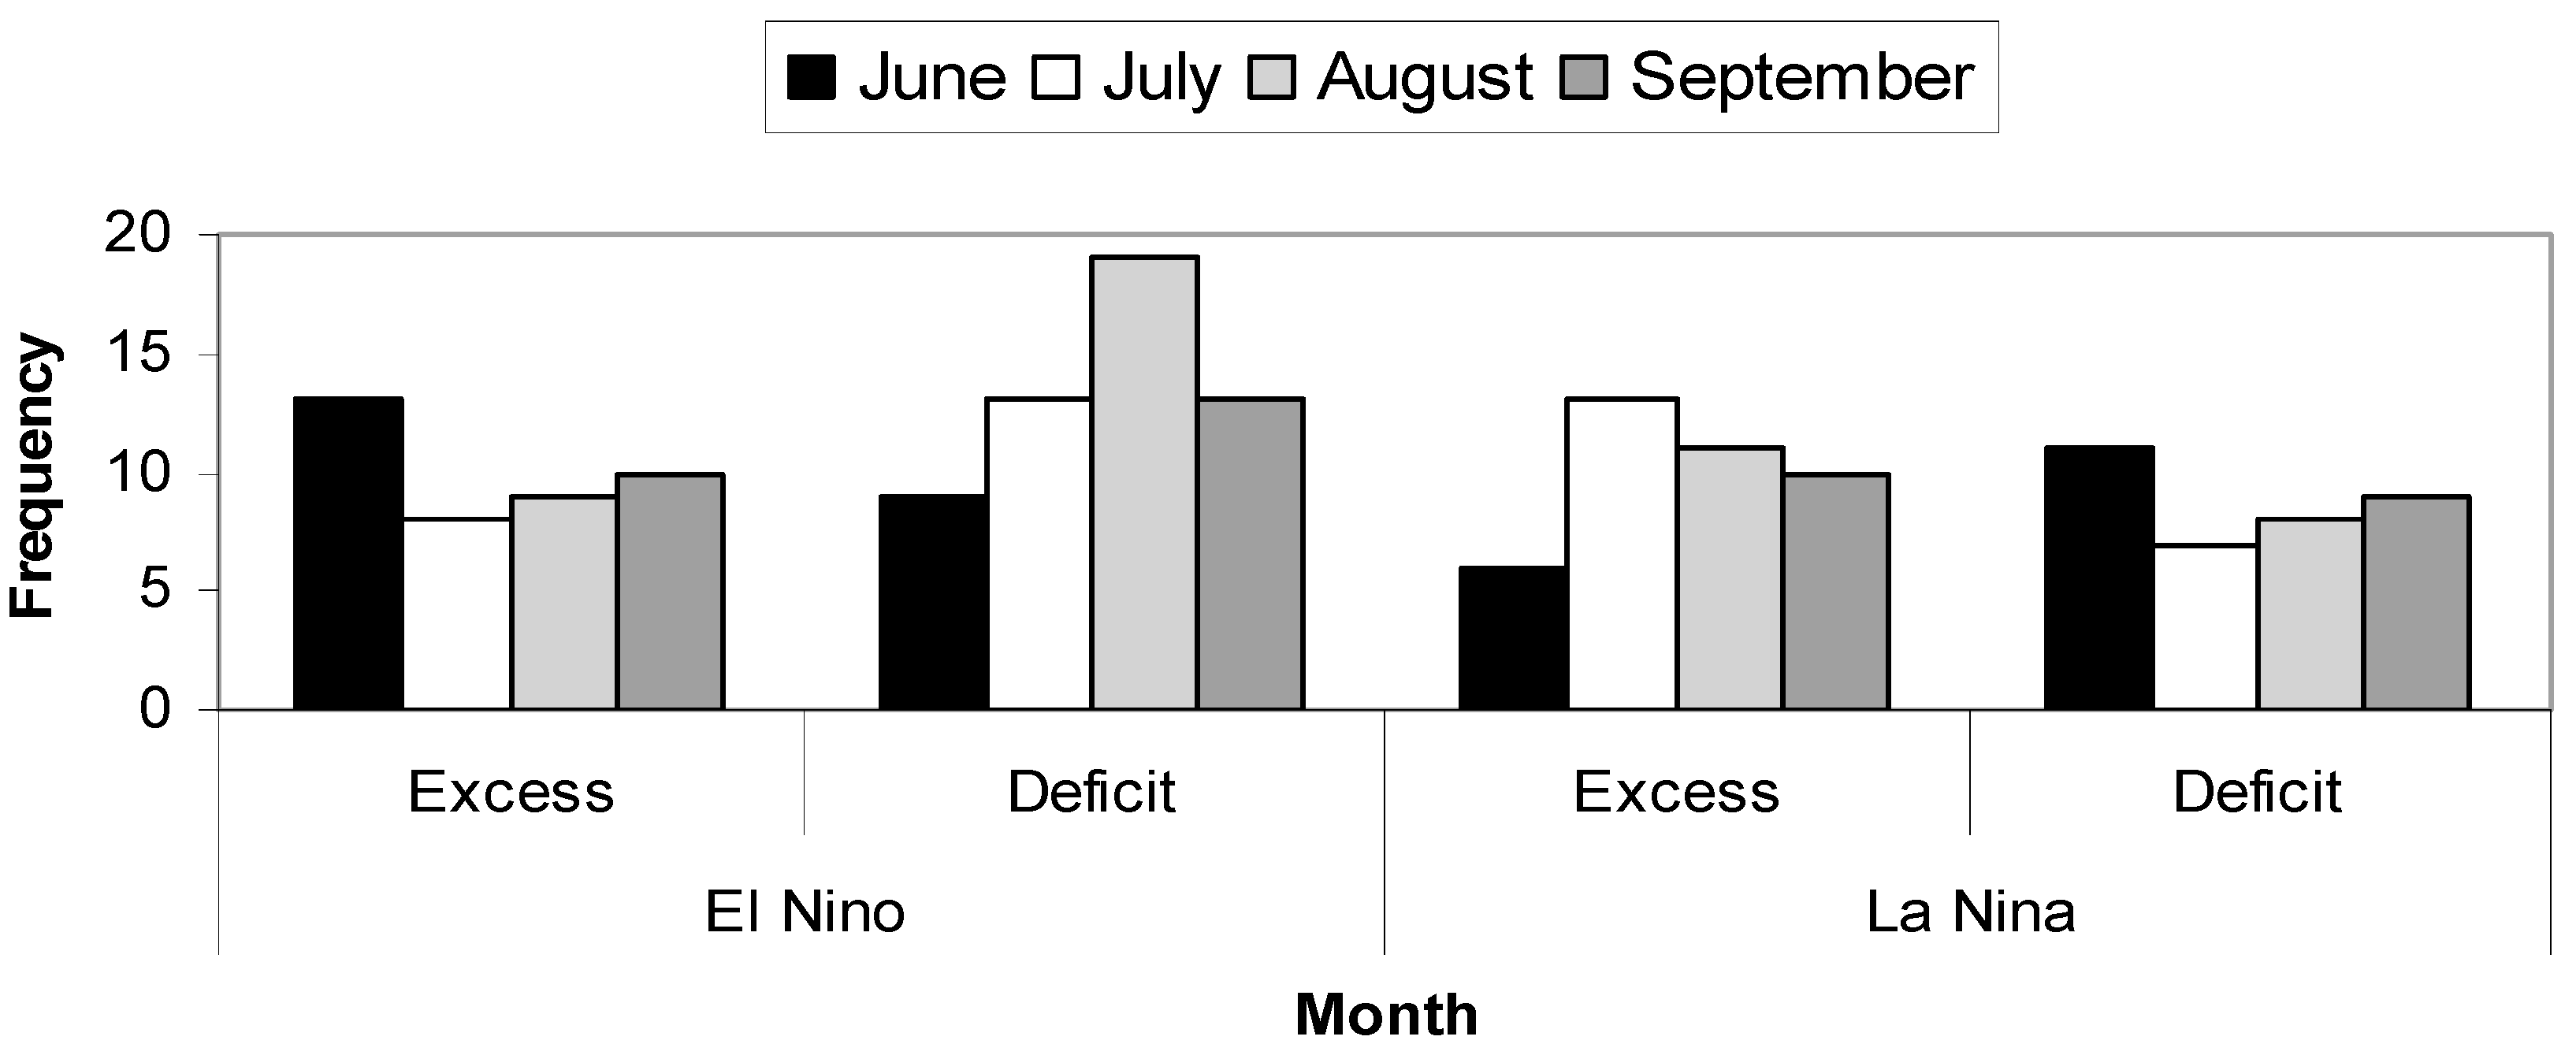
In an El Niño event, excess rainfall is seen in July and deficit is observed in August–September and during the La Niña event, the excess rainfall is observed in July–September (Figure 7). Floods occurred during July–September and the flooding years of 1955, 1974, 1988, 1998, and 2007 were found under La Niña and 1987, 2004 were in El Niño. About 5 floods were interlinked with excess rainfall and La Niña event whereas 2 floods were under the deficit rainfall and El Niño event. So, the excess and deficit of rainfall are not always responsible for a flood occurrence in Bangladesh.
Four cyclones belong to La Niña condition which hit northern and north-western part of Chittagong and three cyclones belong to El Niño condition which hit southern part of Chittagong with exception of 1991 and the rest five cyclones belong to neutral ENSO. Among these five cyclones, four cyclones are found under weak La Niña and if the neutral condition is not considered then Bangladesh faces more TCs during La Niña. The re-curvature takes place in higher latitudes for those developed in El Niño than La Niña phase. Synoptic variables support the occurrence of major floods and TCs in Bangladesh under La Niña phase.

Funding

This work is supported by Special Grant from China Postdoctoral Science Foundation (No.2020T130311).

Institutional Review Board Statement

Not applicable.

Informed Consent Statement

Not applicable.

Data Availability Statement

Data will be available upon request.

Conflicts of Interest

The author declares no conflict of interest.

References

  1. Ali, A. Vulnerability of Bangladesh to climate change and sea level rise through tropical cyclones and storm surges. Water Air Soil Pollut. 1996, 92, 171–179. [Google Scholar]
  2. Ali, A. Climate change impacts and adaptation assessment in Bangladesh. Clim. Res. 1999, 12, 109–116. [Google Scholar] [CrossRef]
  3. Ali, A. Cyclone; Bangla Academy: Dhaka, Bangladesh, 1999; p. 147. [Google Scholar]
  4. Zebiak, S.E.; Cane, M.A.A. Model El Niño–Southern Oscillation. Mon. Weather Rev. 1987, 115, 2262–2278. [Google Scholar] [CrossRef] [Green Version]
  5. Wallace, J.M. El Niño and Climate Prediction; Washington University Press: Washington, DC, USA, 1994; Volume 3, p. 142. [Google Scholar]
  6. Wang, H.J.; Zhang, R.H.; Cole, J.; Chavez, F. El Niño and the related phenomenon Southern Oscillation (ENSO), The largest signal in interannual climatic variation. Proc. Natl. Acad. Sci. USA 1999, 96, 11071–11072. [Google Scholar] [CrossRef] [Green Version]
  7. Pastor, R. El Niño Climate Pattern Forms in Pacific Ocean; USA Today: McLean, VA, USA, 2006. [Google Scholar]
  8. Miah, M.M. Flood in Bangladesh; Academic Publishers: Dhaka, Bangladesh, 1988. [Google Scholar]
  9. Islam, A.R.M.T.; Talukdar, S.; Mahato, S.; Kundu, S.; Eibek, K.U.; Pham, Q.B.; Kuruki, A.; Linh, N.T.T. Flood susceptibility modelling using advanced ensemble machine learning models. Geosci. Front. 2021, 12, 101075. [Google Scholar] [CrossRef]
  10. Brammer, H. Floods in Bangladesh: Geographical background to the 1987 and 1988 floods. Geogr. J. 1990, 156, 12–22. [Google Scholar] [CrossRef]
  11. Mohapatra, M.; Bandyopadhyay, B.K.; Tyagi, A. Best track parameters of tropical cyclones over the North Indian Ocean: A review. Nat. Hazards 2012, 63, 1285–1317. [Google Scholar] [CrossRef]
  12. Singh, O.P.; Ali-Khan, T.M.; Rahman, M.S. Changes in the frequency of tropical cyclones over the North Indian Ocean. Meteorol. Atmos. Phys. 2000, 75, 11. [Google Scholar] [CrossRef]
  13. Wahiduzzaman, M.; Yeasmin, A. Statistical forecasting of tropical cyclone landfall activities over the North Indian Ocean rim. Atmos. Res. 2019, 227, 89–100. [Google Scholar] [CrossRef]
  14. Wahiduzzaman, M.; Oliver, E.C.J.; Wotherspoon, S.J.; Holbrook, N.J. A climatological model of North Indian Ocean tropical cyclone genesis, tracks and landfall. Clim. Dyn. 2017, 49, 2585–2603. [Google Scholar] [CrossRef]
  15. Balaguru, K.; Taraphdar, S.; Leung, L.R.; Foltz, G.R. Increase in the intensity of postmonsoon Bay of Bengal tropical cyclones. Geophys. Res. Lett. 2014, 41, 3594–3601. [Google Scholar] [CrossRef]
  16. Sahoo, B.; Bhaskaran, P.K. Assessment on historical cyclone tracks in the Bay of Bengal, east coast of India. Int. J. Clim. 2016, 36, 95–109. [Google Scholar] [CrossRef]
  17. Wahiduzzaman, M.; Oliver, E.C.J.; Klotzbach, P.J.; Wotherspoon, S.J.; Holbrook, N.J. A statistical seasonal forecast model of North Indian Ocean tropical cyclones using the Quasi-biennial Oscillation. Int. J. Clim. 2019, 39, 934–952. [Google Scholar] [CrossRef]
  18. Wahiduzzaman, M.; Yeasmin, A. A kernel density estimation approach of North Indian Ocean tropical cyclone formation and the association with convective available potential energy and equivalent potential temperature. Meteorol. Atmos. Phys. 2020, 132, 603–612. [Google Scholar] [CrossRef]
  19. Girishkumar, M.S.; Ravichandran, M. The influences of ENSO on tropical cyclone activity in the Bay of Bengal during October-December. J. Geophys. Res. Ocean. 2012, 117. [Google Scholar] [CrossRef]
  20. Wahiduzzaman, M.; Oliver, E.; Wotherspoon, S.; Luo, J.J. Statistical forecasting of tropical cyclones over the North Indian Ocean and the role of El Niño-Southern Oscillation. Clim. Dyn. 2020, 54, 1571–1589. [Google Scholar] [CrossRef]
  21. Girishkumar, M.S.; Suprit, K.; Vishnu, S.; Prakash, V.P.T.; Ravichandran, M. The role of ENSO and MJO on rapid intensification of tropical cyclones in the Bay of Bengal during October–December. Theor. Appl. Climatol. 2015, 120, 797–810. [Google Scholar] [CrossRef]
  22. Felton, C.S.; Subrahmanyam, B.; Murty, V.S.N. ENSO-modulated cyclogenesis over the Bay of Bengal. J. Clim. 2013, 26, 9806–9818. [Google Scholar] [CrossRef]
  23. Choudhury, A.M. Bangladesh Floods, Cyclones & the ENSO. In Proceedings of the International Monsoon Conference, Trieste, Italy, 9–13 May 1994; WCRP-84 and WMO/TD-No. 619. WMO: Geneva, Italy, 1994. [Google Scholar]
  24. Singh, O.P.; Khan, T.M.A.; Rahman, S. Probable reasons for enhanced cyclogenesis in the Bay of Bengal during July–August of ENSO years. Glob. Planet. Chang. 2001, 29, 135–147. [Google Scholar] [CrossRef]
  25. Mandal, G.S. Low Frequency Oscillation and Seasonal Variability of Tropical Cyclones; Topics Chairman and Rapporteur’s Report of the Second WMO Workshop on Tropical Cyclones (IWTC-II); WMO/TD No. 319; World Meteorological Organization: Geneva, Switzerland, 1989. [Google Scholar]
  26. Mandal, G.S. Low Frequency Oscillation and Seasonal Variability of Tropical Cyclones of North Indian Ocean. Ph.D. Thesis, Jadavpur University, Kolkata, India, 1990; pp. 406–444. [Google Scholar]
  27. Girishkumar, M.S.; Thanga Prakash, V.P.; Ravichandran, M. Influence of Pacific Decadal Oscillation on the relationship between ENSO and tropical cyclone activity in the Bay of Bengal during October–December. Clim. Dyn. 2014, 44, 3469–3479. [Google Scholar] [CrossRef]
  28. Wahiduzzaman, M.; Yeasmin, A.; Luo, J.J. Seasonal movement prediction of tropical cyclone over the North Indian Ocean by using atmospheric climate variables. Atmos. Res. 2020, 245, 105089. [Google Scholar] [CrossRef]
  29. Wahiduzzaman, M.; Yeasmin, A.; Luo, J.J.; Quadir, D.A.; Amstel, A.V.; Cheung, K.W.; Yuan, C. Markov Chain Monte Carlo simulation and regression approach guided by El Niño-Southern Oscillation to model the tropical cyclone occurrence over the Bay of Bengal. Clim. Dyn. 2021, 5, 1–12. [Google Scholar]
  30. Wahiduzzaman, M.; Luo, J.J. A statistical analysis on the contribution of El Niño-Southern Oscillation to the rainfall and temperature over Bangladesh. Meteorol. Appl. Phys. 2021, 133, 55–68. [Google Scholar] [CrossRef]
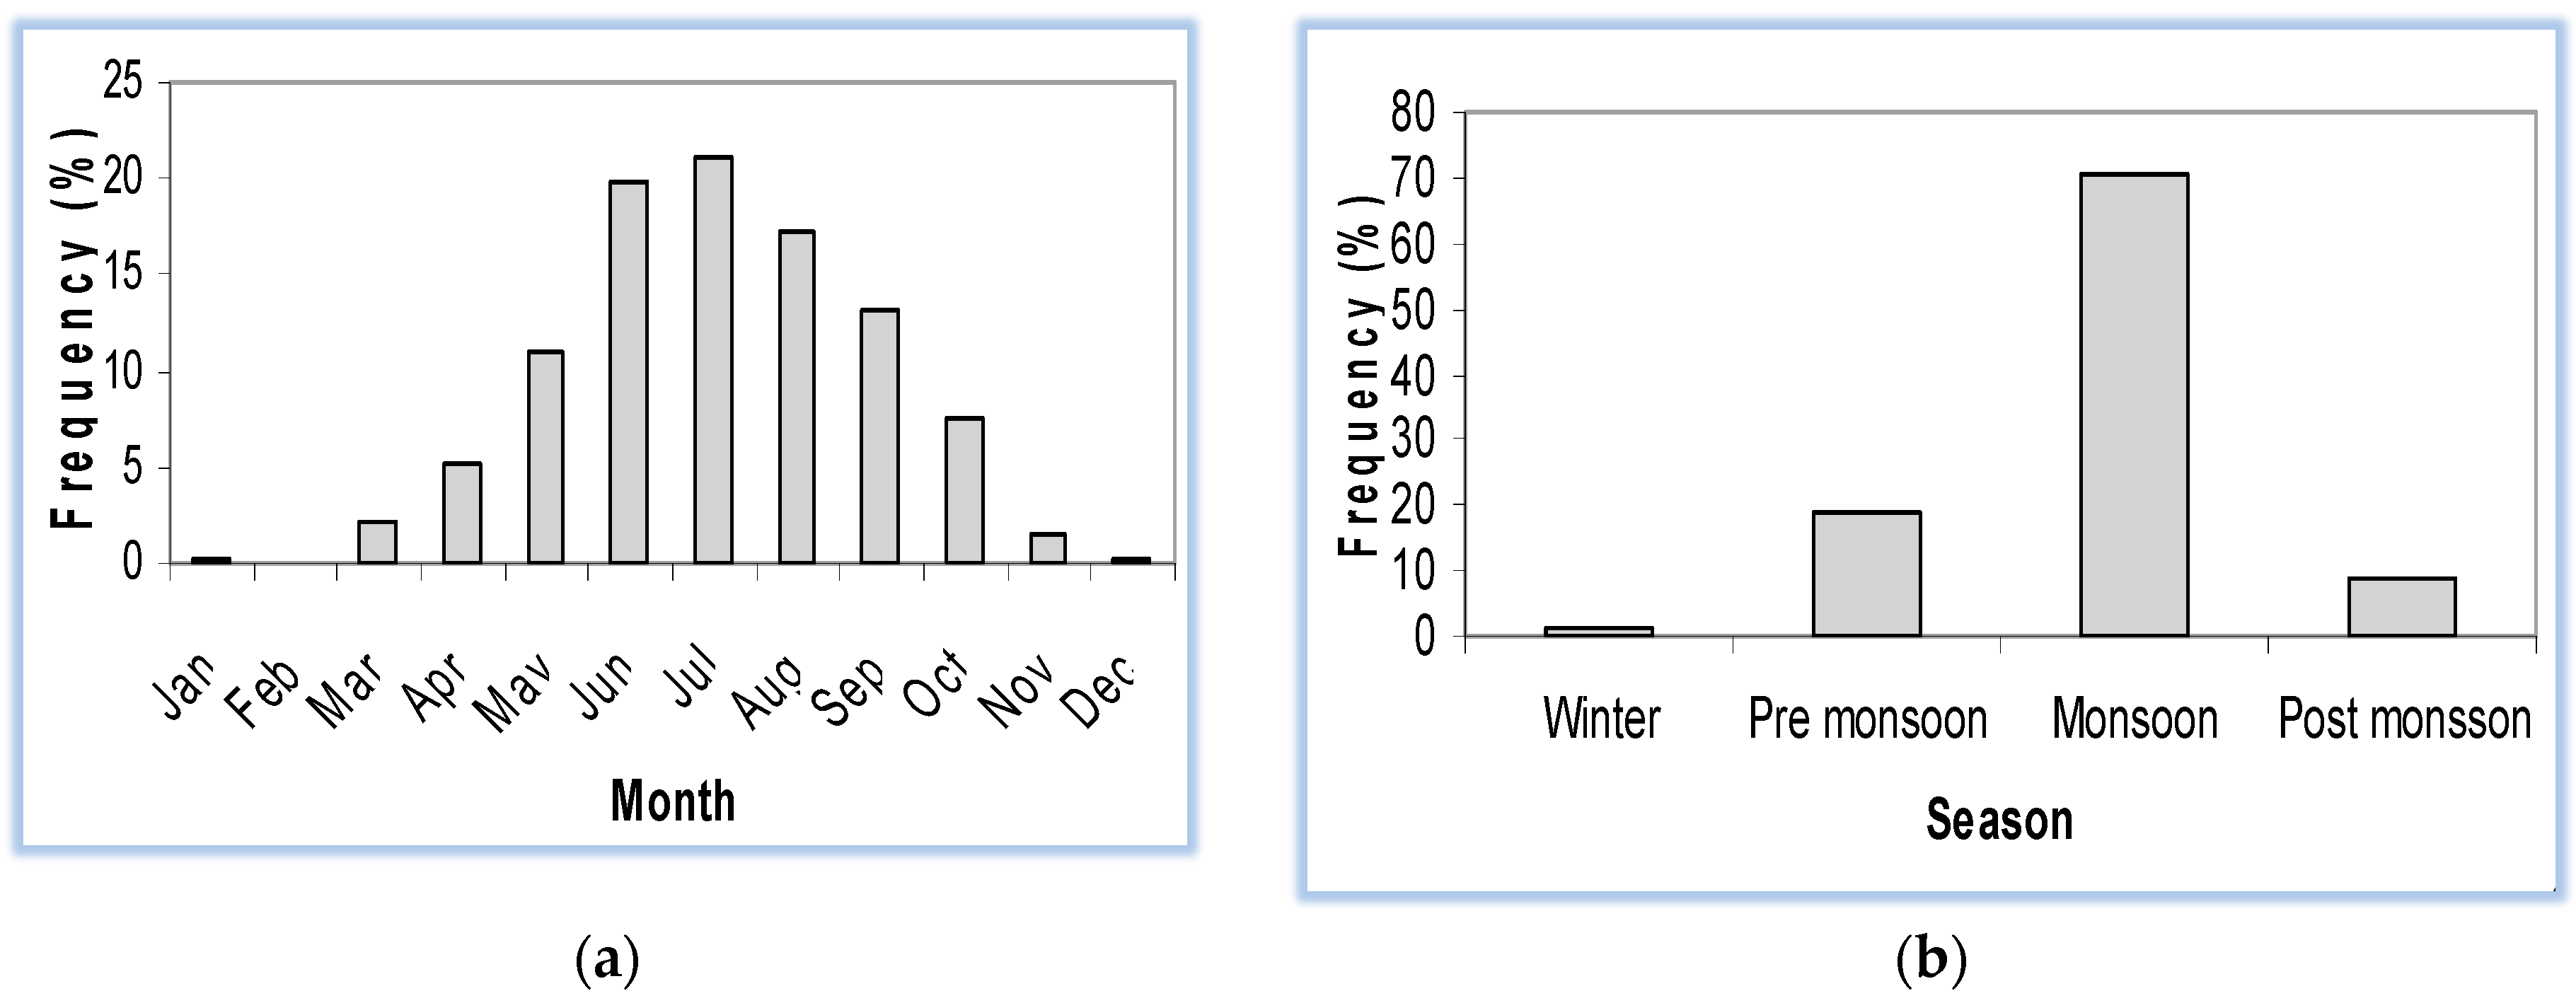
Figure 1. Monthly (a) and seasonal (b) percentage of the total annual rainfall during 1948–2017.
Atmosphere 12 00692 g001
Figure 2. Seven major floods (a) 1955, (b) 1974, (c) 1987, (d) 1988, (e) 1998, (f) 2004, (g) 2007 over Bangladesh during ENSO phase. Black line represents the variability of SOI, and green line is the base line where positive value (>0.5) of SOI indicates El Niño, negative value (<−0.5) indicates La Niña, and rest (−0.5 to 0.5) shows the neutral ENSO. Magenta dot indicates the month of the year when flood started.
Atmosphere 12 00692 g002
Figure 3. Twelve major cyclones (a) 1960, (b) 1961, (c) 1963, (d) 1965, (e) 1970, (f) 1974, (g) 1985, (h) 1988, (i) 1991, (j) 1994, (k) 1997, (l) 2007 over Bangladesh under ENSO phase. Black line represents the variability of SOI, and green line is the base line where positive value (>0.5) of SOI indicates El Niño, negative value (<−0.5) indicates La Niña, and rest (−0.5 to 0.5) shows the neutral ENSO phase. Magenta dot indicates the month of the year when cyclone started.
Atmosphere 12 00692 g003aAtmosphere 12 00692 g003bAtmosphere 12 00692 g003c
Figure 4. Ten major TC tracks in (a) 1981, (b) 1988, (c) 1991, (d) 1992, (e) 1995, (f) 1997, (g) 1998, (h) 1999, (i) 2006, and (j) 2007 over Bangladesh during ENSO. Black line and dot represent the track and movement over time.
Atmosphere 12 00692 g004aAtmosphere 12 00692 g004bAtmosphere 12 00692 g004c
Figure 5. Synoptic conditions (a) surface precipitable water, (b) surface pressure, (c) sea level pressure, (d) surface runoff, and (e) precipitation anomaly) during La Niña.
Atmosphere 12 00692 g005
Figure 6. Relative humidity, sea surface temperature, vorticities, and vertical wind shear anomalies during ENSO positive/La Niña phase. Blue (Yellow, Red, and Pink) shade represents negative (positive) units. Dot points indicate >5% significance level.
Atmosphere 12 00692 g006
Figure 7. Frequency of excess and deficit of rainfall during monsoon under El Niño and La Niña.
Atmosphere 12 00692 g007
Table 1. Identified years under the phase of ENSO.
Phase of ENSOYears
El Niño1958, 1966, 1973, 1978, 1980, 1983, 1987, 1988, 1992, 1995, 1998 2003, 2007, 2010, 2014
La Niña1950, 1951, 1955, 1956, 1962, 1971, 1974, 1976, 1989, 1999, 2000 2008, 2011, 2012
Neutral1948–1949, 1952–1954, 1957, 1959–1961, 1963–1965, 1967–1970, 1972, 1975, 1977, 1979, 1981–1982, 1984–1986, 1990–1991, 1993–1994, 1996–1997, 2001–2002, 2004–2006, 2009, 2013–2014, 2015–2016.
Table 2. Categorizing the major floods in Bangladesh on ENSO timescales.
YearFlood Affected Area (Sq km)Affected Area (%)SOIPhase of ENSO
195550,70034.22.4La Niña
197452,72036.61.4La Niña
198757,49139.9−2.2El Niño
198889,970632.8La Niña
1998100,250681.9La Niña
200455,00038−1.2El Niño
200762,28942.20.1Neutral
Table 3. Categorizing of major TCs in Bangladesh.
YearMonthCrossing AreaSOIPhase of ENSO
196030–31 OctoberNorth Part of Chittagong0.8La Niña
19615–9 MayMeghna Estuary0.2Neutral
196328 MayNorth Part of Chittagong0.2Neutral
19657–15 DecemberCox’s Bazar0Neutral
197013 NovemberNorth Part of Chittagong2.8La Niña
197424–28 NovemberChittagong−0.5Neutral
198522–25 MayChittagong0.3Neutral
198824–30 NovemberKhulna3La Niña
199125–30 AprilNorth Part of Chittagong−2El Niño
199424 April–2 MayTeknaf−1.7El Niño
199715–19 MayTeknaf−3El Niño
200711–15 NovemberKhulna Barisal1.4La Niña
Table 4. Re-curvature analysis of the major ten cyclones over Bangladesh during ENSO.
CycloneMonthSOIENSO PhasePoint of Formation (N)Lat. of Re-Curvature (N)Point of Landfall (N)
1981December0.7La Niña11°12°–16°21.2°
1988November3La Niña10°14°20.5°
1991April−2El Niño11.5°16°22.3°
1992November−1.4El Niño9.5°16°21°
1995November−0.1El Niño7.5°14°20°
1997May−3El Niño7.5°19°21.8°
1998November1.7La Niña12°16°21°
1999October1.5La Niña12°Straight19.8°
2006April1.5La Niña9.5°12°16.5°
2007November1.4La Niña9.5°12°21°
Publisher’s Note: MDPI stays neutral with regard to jurisdictional claims in published maps and institutional affiliations.