
Influence of Atmospheric Circulation on Cloudiness and Cloud Types in Petuniabukta and Svalbard-Lufthavn in Summer 2016

 , , and
Abstract
:1. Introduction
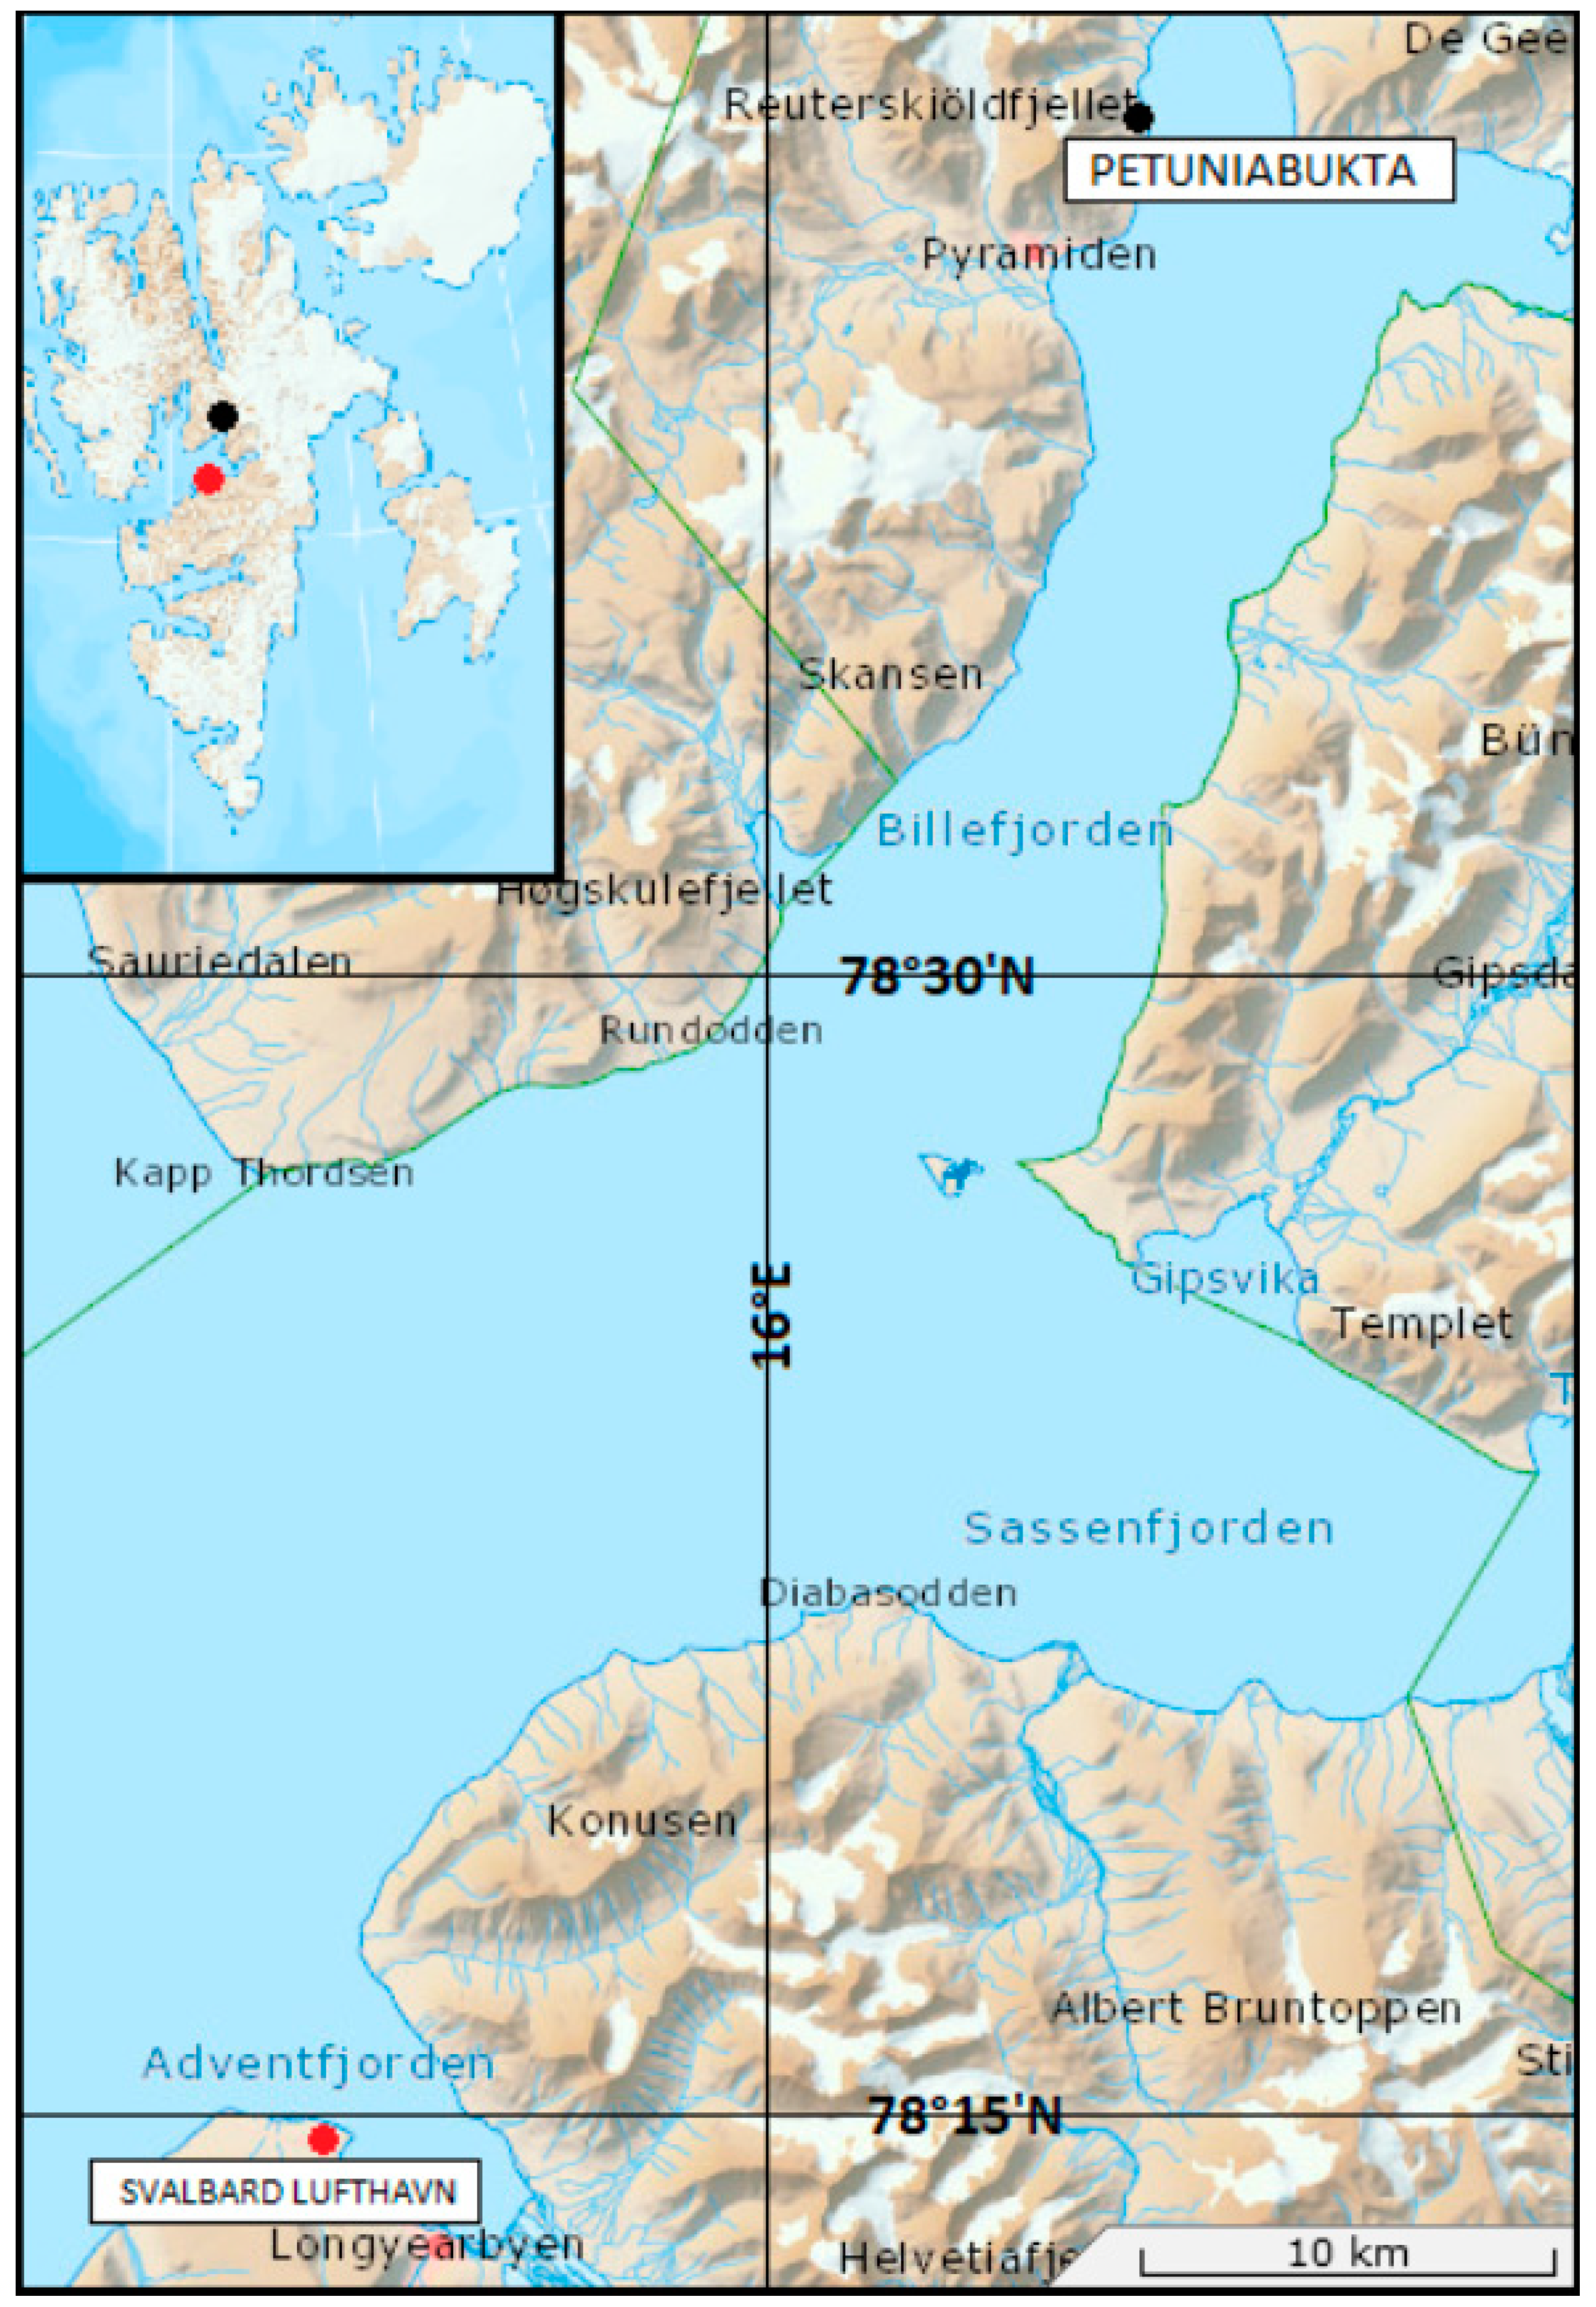
Study Area
2. Materials and Methods
3. Results
3.1. Synoptic Conditions during the Study Period
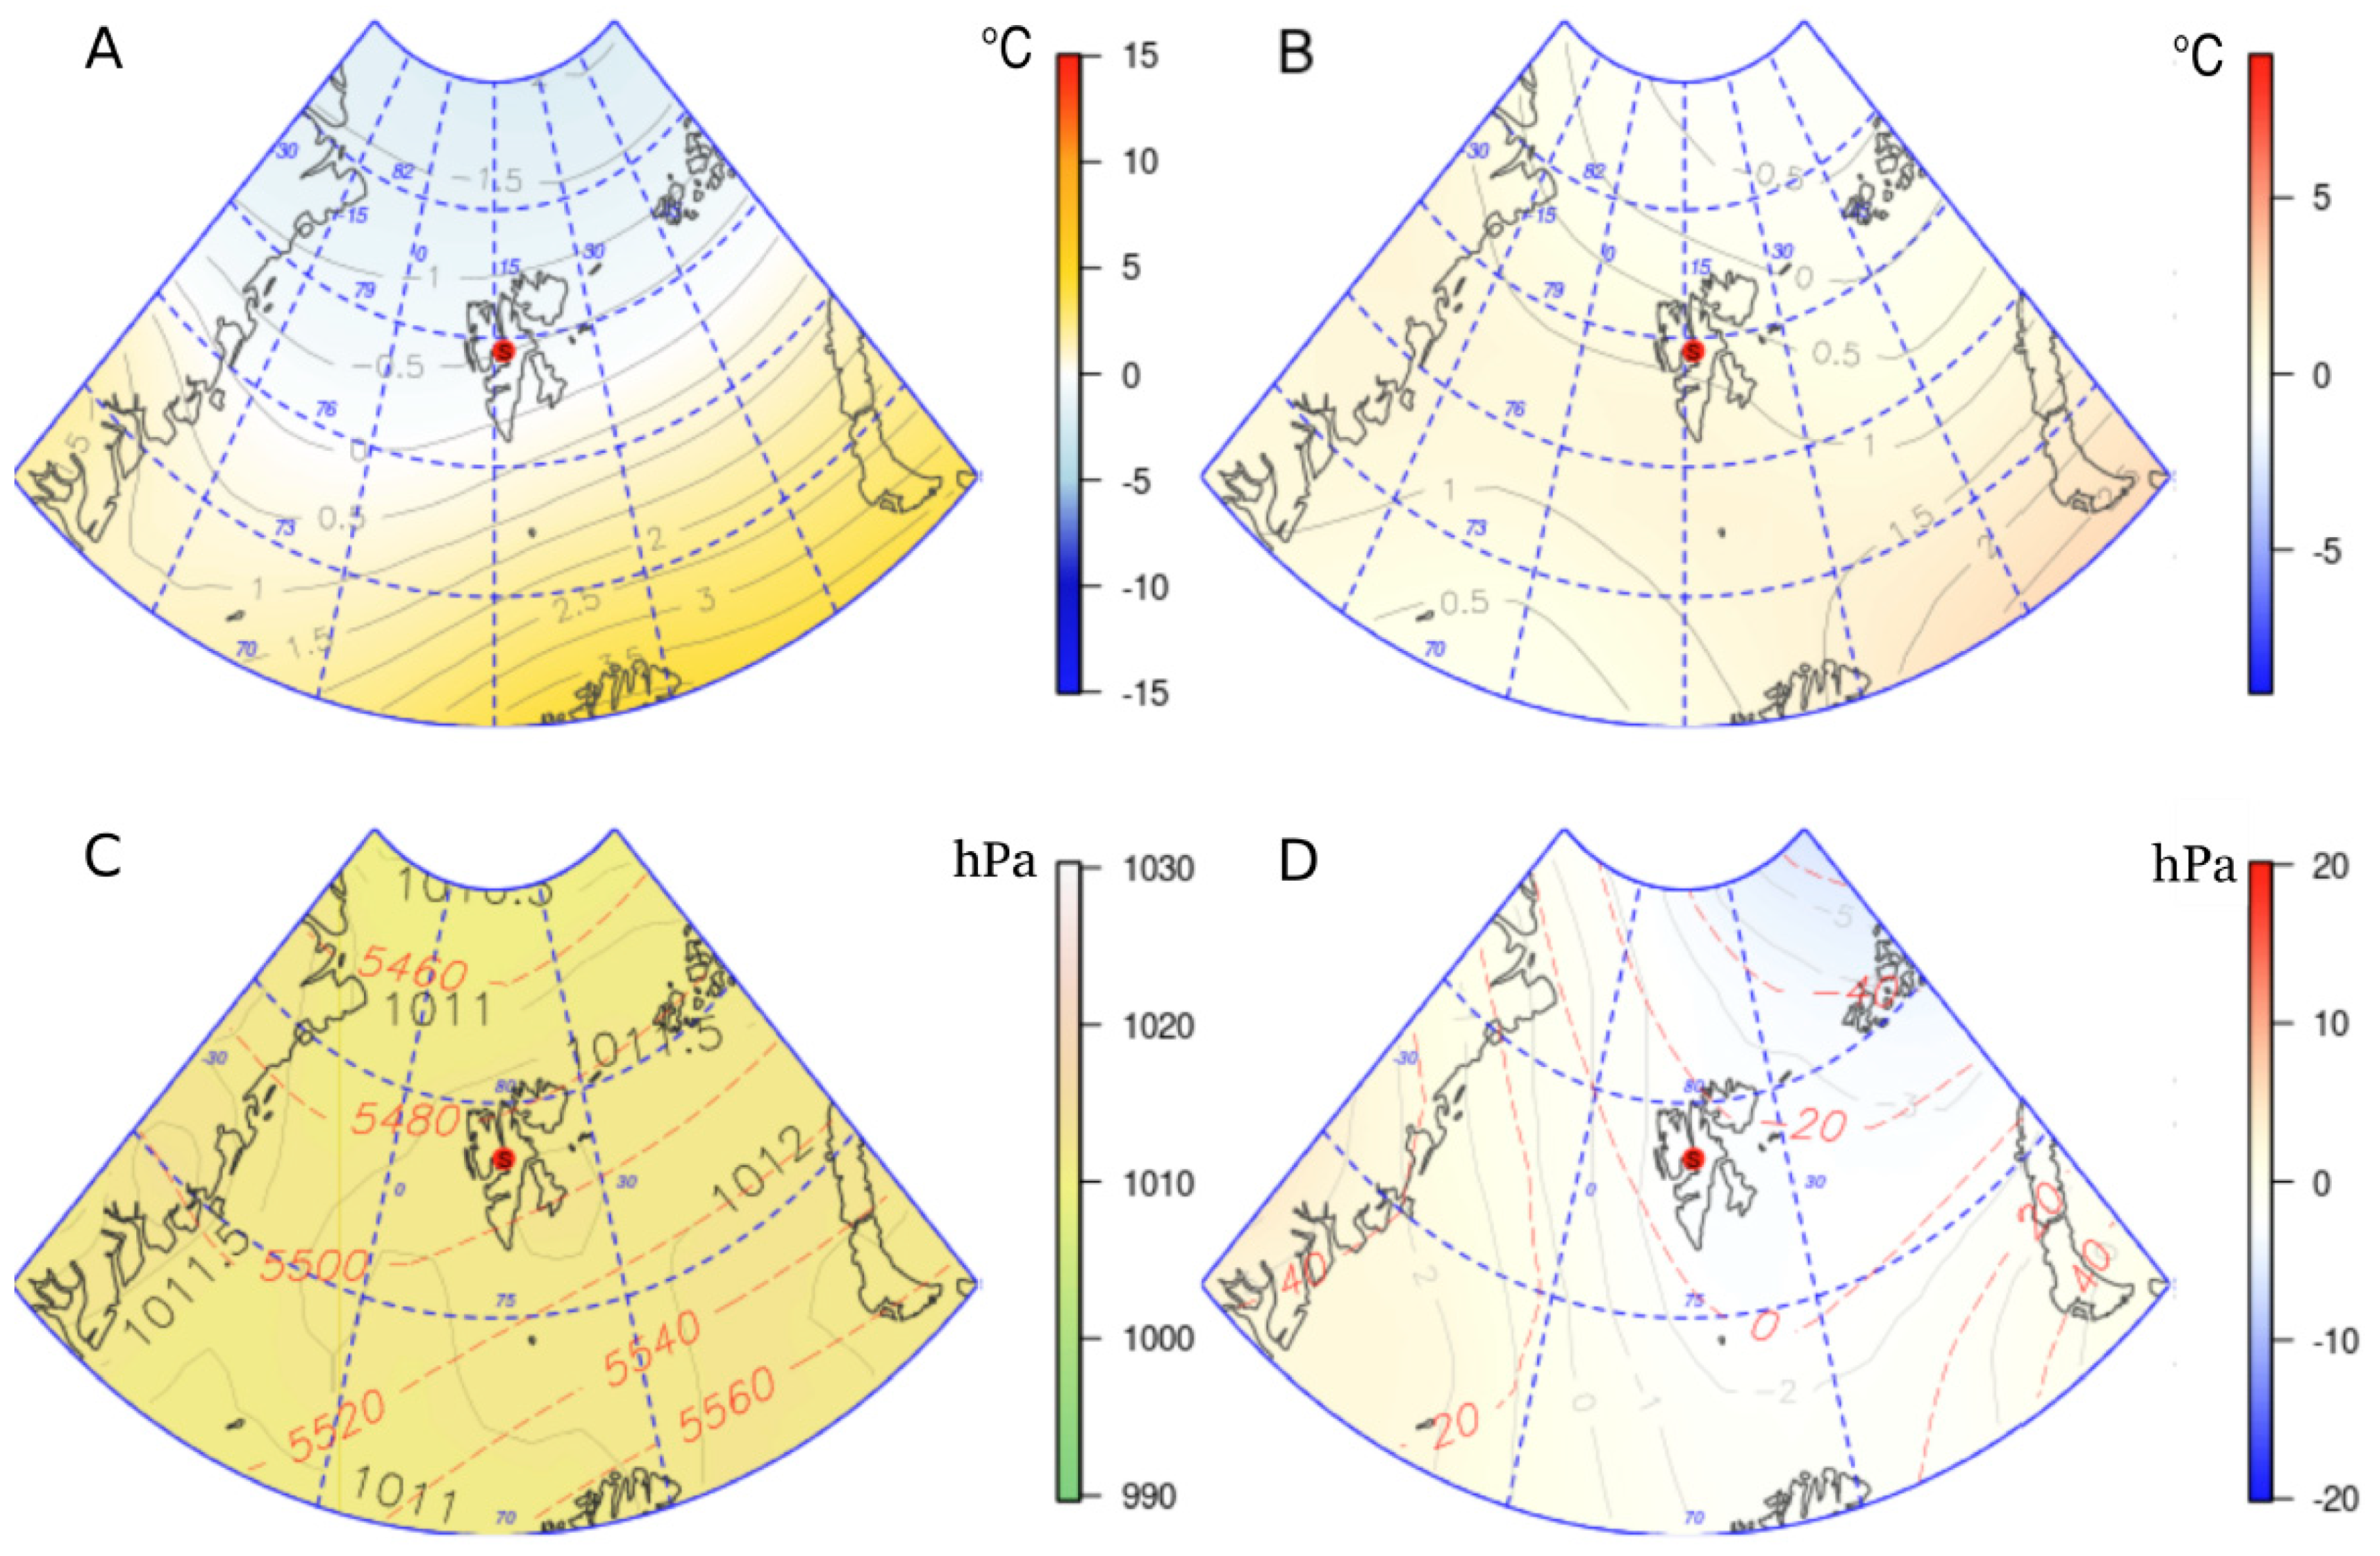
3.2. Synoptic Conditions on Days with Small Cloudiness
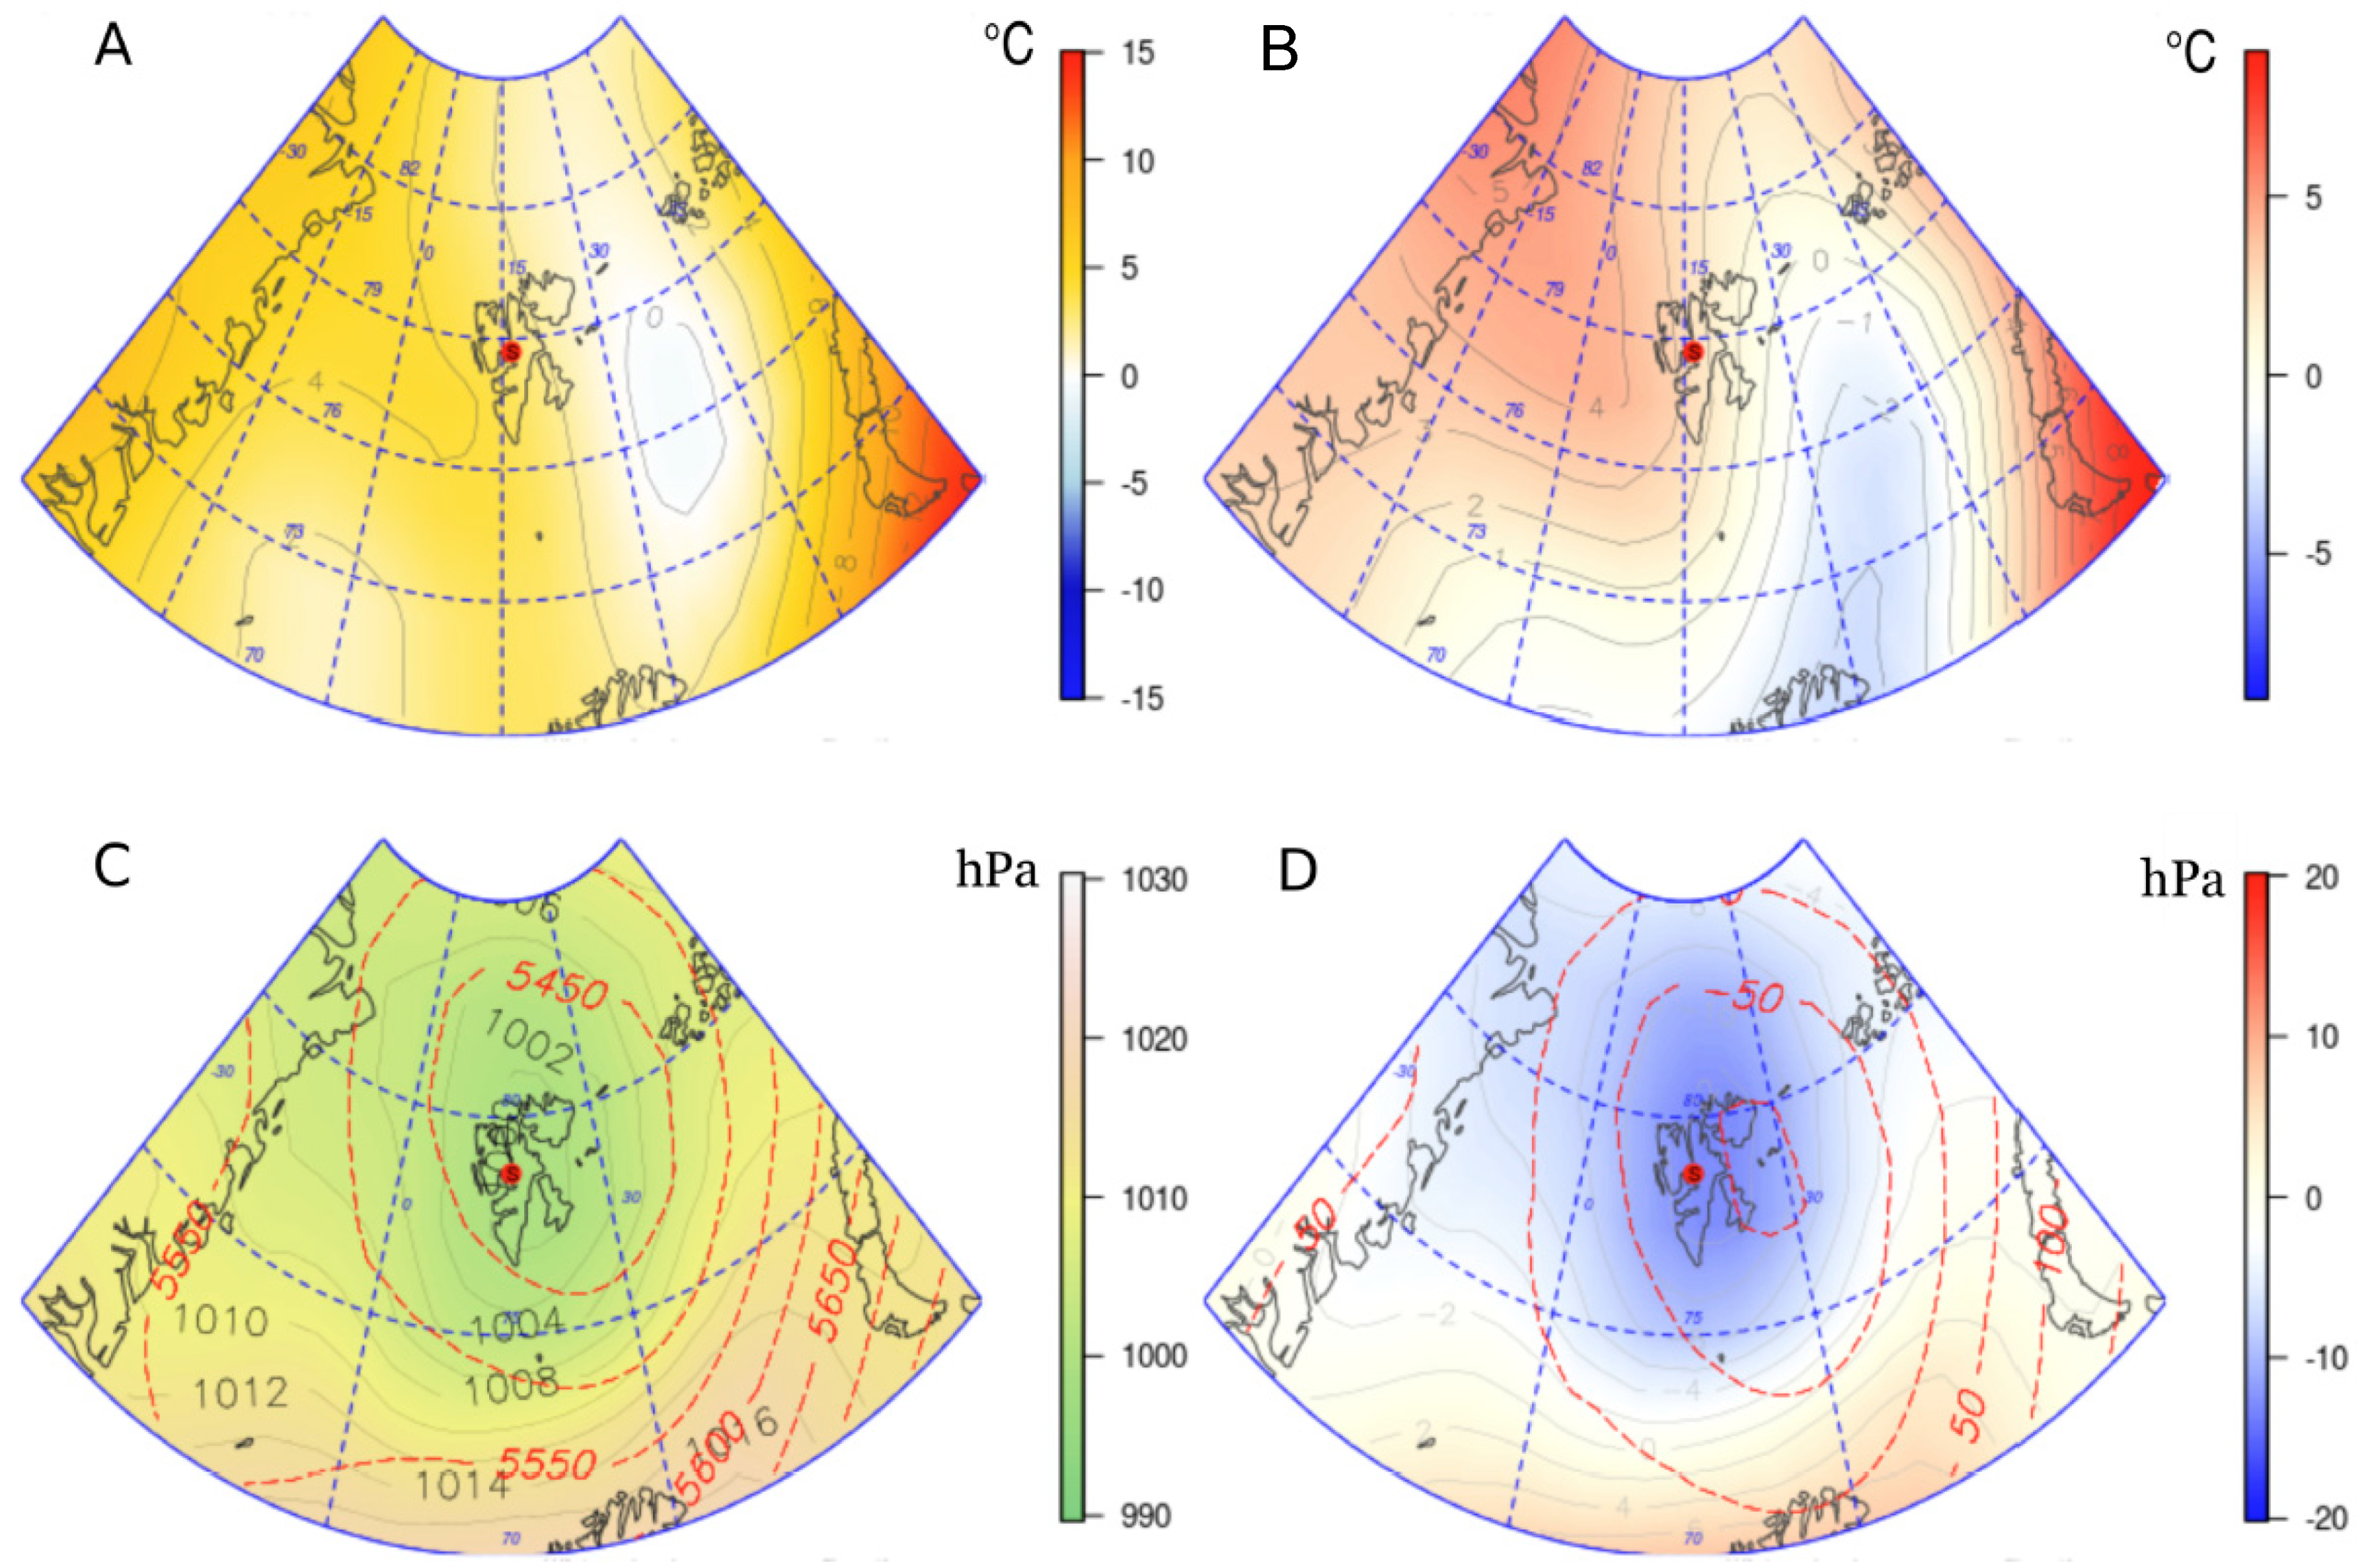
3.3. Synoptic Conditions on Days with Considerable Cloudiness
4. Discussion
5. Conclusions
- The average cloud cover in summer 2016 was lower in Svalbard-Lufthavn (6.0 oktas) than in Petuniabukta (6.6 oktas). Small cloudiness was associated mainly with a high-pressure system or the edge of one. Large cloudiness occurred in low-pressure systems, a low-pressure trough, and on the north or north-western wedge of a high-pressure system. According to the typology proposed by Niedźwiedź, maximum cloudiness in both stations is related to the cyclonic circulation types SWc and Cc and one type of anticyclonal type SWa. Apart from that, in Svalbard-Lufthavn type Bc plays a significant role, as does type NWc in Petuniabukta. Minimal cloudiness in both stations occurred with the NEa type of circulation.
- 2.
- Local features of cloudiness are recorded most clearly in the structure of middle-level and low-level clouds. The frequency of middle-level clouds was much lower in Petuniabukta where Stratus clouds dominated, while Stratocumulus prevailed in Svalbard-Lufthavn. This means that the occurrence of cloud types is associated with the direction of air mass advection and may as well suggest the influence of local environmental conditions. This issue was indicated by [38] in work on factors influencing simulated changes in future Arctic cloudiness.
Author Contributions
Funding
Institutional Review Board Statement
Informed Consent Statement
Data Availability Statement
Conflicts of Interest
References
- Boucher, O.; Randall, D.; Artaxo, P.; Bretherton, C.; Feingold, G.; Forster, P.; Kerminen, V.-M.; Kondo, Y.; Liao, H.; Lohmann, U.; et al. Book Clouds and aerosols. In Climate Change 2013: The Physical Science Basis. Contribution of Working Group I to the Fifth Assessment Report of the Intergovernmental Panel on Climate Change; Cambridge University Press: Cambridge, UK, 2013; pp. 571–657. [Google Scholar]
- Bernstein, L.; Bosch, P.; Canziani, O.; Chen, Z.; Christ, R.; Riahi, K. IPCC, 2007: Climate Change 2007: Synthesis Report; IPCC: Geneva, Switzerland, 2008; ISBN 2-9169-122-4. [Google Scholar]
- Niedźwiedź, T.; Ustrnul, Z. The influence of synoptic situations on the formation of clouds in Hornsund. In XVI Sympozjum Polarne; Wyd. Uniwersytetu w Toruniu: Toruń, Poland, 1989; pp. 158–160. [Google Scholar]
- Brohan, P.; Kennedy, J.J.; Harris, I.; Tett, S.F.; Jones, P.D. Uncertainty estimates in regional and global observed temperature changes: A new data set from 1850. J. Geophys. Res. Atmos. 2006, 111, 1–21. [Google Scholar] [CrossRef] [Green Version]
- Shiobara, M.; Yabuki, M.; Kobayashi, H. A polar cloud analysis based on Micro-pulse Lidar measurements at Ny-Alesund, Svalbard and Syowa, Antarctica. Phys. Chem. Earth 2003, 28, 1205–1212. [Google Scholar] [CrossRef]
- Gayet, J.-F.; Mioche, G.; Dörnbrack, A.; Ehrlich, A.; Lampert, A.; Wendisch, M. Microphysical and optical properties of Arctic mixed-phase clouds. the 9 April 2007 case study. Atmos. Chem. Phys. 2009, 9, 6581–6595. [Google Scholar] [CrossRef] [Green Version]
- Jourdan, O.; Mioche, G.; Garrett, T.J.; Schwarzenböck, A.; Vidot, J.; Xie, Y.; Shcherbakov, V.; Yang, P.; Gayet, J.-F. Coupling of the microphysical and optical properties of an Arctic nimbostratus cloud during the ASTAR 2004 experiment: Implications for light-scattering modelling. J. Geophys. Res. Atmos. 2010, 115, 1–16. [Google Scholar] [CrossRef] [Green Version]
- Bierwirth, E.; Ehrlich, A.; Wendisch, M.; Gayet, J.-F.; Gourbeyre, C.; Dupuy, R.; Herber, A.; Neuber, R.; Lampert, A. Optical thickness and effective radius of Arctic boundary-layer clouds retrieved from airborne nadir and imaging spectrometry. Atmos. Meas. Tech. 2013, 6, 1189–1200. [Google Scholar] [CrossRef] [Green Version]
- O’Neill, N.T.; Baibakov, K.; Hesaraki, S.; Ivanescu, L.; Martin, R.V.; Perro, C.; Chaubey, J.P.; Herber, A.; Duck, T.J. Temporal and spectral cloud screening of polar winter aerosol optical depth (AOD): Impact of homogeneous and inhomogeneous clouds and crystal layers on climatological-scale AODs. Atmos. Chem. Phys. 2016, 16, 12753–12765. [Google Scholar] [CrossRef] [Green Version]
- Dörnbrack, A.; Gisinger, S.; Pitts, M.C.; Poole, L.R.; Maturilli, M. Multilevel cloud structures over Svalbard. Mon. Weather Rev. 2017, 145, 1149–1159. [Google Scholar] [CrossRef] [PubMed] [Green Version]
- Matuszko, D.; Soroka, J. Book Cloudiness over Spitsbergen, Based on Observations Made at the Polish Polar Station in Hornsund, 2013; Instytut Geografii i Gospodarki Przestrzennej, UJ: Kraków, Poland, 2013; p. 96. [Google Scholar]
- Marsz, A. Cloudiness and sunshine duration. In Book Climate and Climate Change at Hornsund, Svalbard; Gdynia Maritime University: Gdynia, Poland, 2013; pp. 101–125. [Google Scholar]
- Gluza, A.; Siłuch, M.; Siwek, K. Comparison of some selected meteorological elements of the Summer season between Hornsund and Calypsobyen stations (Spitsbergen). Probl. Klimatol. Polarn. 2004, 14, 183–188. (In Polish) [Google Scholar]
- Przybylak, R.; Kejna, M.; Araźny, A.; Maszewski, R.; Gluza, A.; Hojan, M.; Zwoliński, Z. Diversification of Meteorological Conditions on the Western Coast of Spitsbergen during Summer Season of 2006; Uniwersytet im. Mikołaja Kopernika: Toruń, Poland, 2007; pp. 179–194. [Google Scholar]
- Kejna, M.; Przybylak, R.; Araźny, A. The influence of cloudiness and synoptic situations on the solar radiation balance in the area of Kaffiøyra (NW Spitsbergen) in the summer seasons 2010 and 2011. Bull. Geography. Phys. Geogr. Ser. 2012, 5, 77–95. [Google Scholar] [CrossRef] [Green Version]
- Aas, K.S.; Bernstein, T.K.; Boike, J.; Etzelműller, B.; Kristjánsson, J.E.; Maturilli, M.; Schuler, T.V.; Stordal, F.; Westermann, S. A comparison between simulated and observed surface energy balance at the Svalbard Archipelago. J. Appl. Meteorol. Climatol. 2015, 54, 1102–1119. [Google Scholar] [CrossRef] [Green Version]
- Rachlewicz, G. Meteorological conditions in Petunia Bay (central Spitsbergen) during summer seasons 2000 and 2001. Probl. Klimatol. Polarn. 2003, 13, 127–138. [Google Scholar]
- Láska, K.; Chládová, Z.; Ambrožová, K.; Husák, J. Cloudiness and weather variation in central Svalbard in July 2013 as related to atmospheric circulation. Czech Polar Rep. 2013, 3, 184–195. [Google Scholar] [CrossRef]
- Przybylak, R.; Araźny, A.; Gluza, A.; Hojan, M.; Migała, K.; Sikora, S.; Zwoliński, Z. Diversification of meteorological conditions on the western coast of Spitsbergen during the summer season of 2005. Probl. Klimatol. Polarn. 2006, 16, 125–138. [Google Scholar]
- Bednorz, E.; Kaczmarek, D.; Dudlik, P. Atmospheric conditions governing anomalies of the summer and winter cloudiness in Spitsbergen. Theor. Appl. Climatol. 2016, 123, 1–10. [Google Scholar] [CrossRef] [Green Version]
- Łupikasza, E.; Lipiński, O. Cloud cover over Spitsbergen and its relation to atmospheric circulation (1983–2015). Geogr. Pol. 2017, 90, 21–38. [Google Scholar] [CrossRef] [Green Version]
- Láska, K.; Witoszová, D.; Prošek, P. Weather patterns of the coastal zone of Petuniabukta (Central Spitsbergen) in the period 2008–2010. Pol. Polar Res. 2012, 33, 297–318. [Google Scholar] [CrossRef]
- Niedźwiedź, T. Kalendarz Typów Cyrkulacji Atmosfery dla Spitsbergenu—Zbiór Komputerowy, 2013, Uniwersytet Śląski, Katedra Klimatologii, Sosnowiec. 2013. Available online: http://www.kk.wnoz.us.edu.pl/nauka/kalendarz-typow-cyrkulacji/ (accessed on 20 September 2019).
- Kalnay, E.; Kanamitsu, M.; Kistler, R.; Collins, W.; Deaven, D.; Gandin, L.; Zhu, Y. The NCEP/NCAR 40-year reanalysis project. Bull. Am. Meteorol. Soc. 1996, 77, 437–472. [Google Scholar] [CrossRef] [Green Version]
- Rachlewicz, G.; Styszyńska, A. Comparison of the course air temperature in Petuniabukta and Svalbard-Lufthavn (Isfjord, Spitsbergen) in the years 2001–2003). Probl. Klimatol. Polarn. 2007, 17, 121–134. [Google Scholar]
- Przybylak, R. Book The Climate of the Arctic; Kluwer Academic Publishers: Dordrecht, The Netherlands, 2003; pp. 1–286. [Google Scholar]
- Lipiński, O.; Łupikasza, E. The role of atmospheric circulation in shaping total cloudiness over Spitsbergen (1983–2013). Przegląd Geogr. 2016, 88, 317–337. [Google Scholar] [CrossRef] [Green Version]
- Schweiger, A.J.; Key, J.R. Arctic cloudiness: Comparison of ISCCP-C2 and NIMBUS-7 satellite-derived cloud products with surface-based climatology. J. Clim. 1992, 5, 1514–1527. [Google Scholar] [CrossRef] [Green Version]
- Kotarba, A.; Widawski, A. The satellite cloud climatology in 2007 above Svalbard in relation to atmospheric circulation conditions. Probl. Klimatol. Polarn. 2008, 18, 127–140. [Google Scholar]
- Kryza, M.; Szymanowski, M.; Migała, K. Estimation of the real-sky total solar irradiation for the Werenskjold glacier (SW Spitsbergen) with the r.sun model (SW Spitsbergen). Pr. Studia Geogr. 2011, 47, 435–442. (In Polish) [Google Scholar]
- Abe, M.; Nozawa, T.; Ogura, T.; Takata, K. Effect of retreating sea ice on Arctic aloud cover in simulated recent global warming. Atmos. Chem. Phys. 2016, 16, 14343–14356. [Google Scholar] [CrossRef] [Green Version]
- Araźny, A. Annual course of relative air humidity in the Norwegian Arctic from 1971 to 2000. Probl. Klimatol. Polarn. 2003, 13, 107–115. [Google Scholar]
- Niedźwiedź, T. The main features of circulation over Spitsbergen. Problemy Klimatologii Polarnej 2006, 16, 91–105. [Google Scholar]
- Kendzierski, S.; Kolendowicz, L.; Półrolniczak, M. The influence of synoptic condition patterns on air temperature and humidity in Petuniabukta (Svalbard) in summer 2016. Pol. Polar Res. 2018, 39, 371–392. [Google Scholar]
- Przybylak, R. Spatial differentiation of air temperature and relative humidity on the western coast of Spitsbergen in 1979–1983. Pol. Polar Res. 1992, 13, 113–130. [Google Scholar]
- Adamczyk, R.; Ustrnul, Z. Total cloudiness with relation to the atmospheric circulation in the European polar region. Probl. Klimatol. Polarn. 2008, 18, 79–88. [Google Scholar]
- Vavrus, S.; Waliser, D.; Schweiger, A.; Francis, J. Simulations of 20th and 21st century Arctic clouds in the global climate models assessed in the IPCC AR4. Clim. Dyn. 2009, 33, 1099–1115. [Google Scholar] [CrossRef]
- Vavrus, S.; Bhatt, U.S.; Alexeev, V.A. Factors influencing simulated changes in future arctic cloudiness. J. Clim. 2011, 24, 4817–4830. [Google Scholar] [CrossRef]
- Denstadli, J.M.; Jacobsen, J.K.S. More Clouds on the Horizon? Polar Tourists’ Weather Tolerances in the Context of Climate Change. Scand. J. Hosp. Tour. 2014, 14, 80–99. [Google Scholar] [CrossRef]
- Hellemeier, J.A.; Yang, R.; Sarazin, M.; Hickson, P. Weather at selected astronomical sites—An overview of five atmospheric parameters. Mon. Not. R. Astron. Soc. 2019, 482, 4941–4950. [Google Scholar] [CrossRef]
- Liu, Y.; Zhao, L. The preliminary analysis of sunshine durations with meteorological data for the Chinese Giant Solar Telescope site survey. Mon. Not. R. Astron. Soc. 2013, 434, 1674–1680. [Google Scholar] [CrossRef] [Green Version]
- Shikhovtsev, A.Y.; Bolbasova, L.A.; Kovadlo, P.G.; Kiselev, A.V. Atmospheric parameters at the 6-m Big Telescope Alt-azimuthal site. Mon. Not. R. Astron. Soc. 2020, 493, 723–729. [Google Scholar] [CrossRef]
- IPCC. Climate Change 2007: The Physical Science Basis, Summary for Policymakers; IPCC: Geneva, Switzerland, 2007; p. 18. [Google Scholar]


| Types of Clouds | WMO Cloud Symbol |
|---|---|
| Cumulus (Cu) | CL1, CL2 |
| Stratocumulus (Sc) | CL4, CL5 |
| Stratus (St) | CL6, CL7 |
| Nimbostratus (Ns) | CM2, CM7 |
| Cumulonimbus (Cb) | CL3, CL9 |
| Altostratus (As) | CM1 |
| Altocumulus (Ac) | CM3, CM4, CM5, CM6, CM7, CM8, CM9 |
| Cirrus (Ci) | CH1, CH2, CH3, CH4 |
| Cirrostratus (Cs) | CH5, CH6, CH7, CH8 |
| Cirrocumulus (Cc) | CH9 |
| Anticyclonic Situation | Cyclonic Situation | ||||
|---|---|---|---|---|---|
| Number | Symbol | Direction of Air Mass Advection, Geostrophic Wind | Number | Symbol | Direction of Air Masses Advection, Geostrophic Wind |
| 1 | Na | North | 11 | Nc | North |
| 2 | NEa | North–East | 12 | NEc | North–East |
| 3 | Ea | East | 13 | Ec | East |
| 4 | SEa | South–East | 14 | SEc | South–East |
| 5 | Sa | South | 15 | Sc | South |
| 6 | SWa | South–West | 16 | SWc | South-West |
| 7 | Wa | West | 17 | Wc | West |
| 8 | NWa | North–West | 18 | NWc | North–West |
| 9 | Ca | central anticyclonic situation (high center) | 19 | Cc | central cyclonic, center of low |
| 10 | Ka | anticyclonic wedge or ridge of high pressure | 20 | Bc | trough of low pressure (different directions of air flow and frontal system in the axis of trough) |
| 21 | x | Col—saddle point or indeterminable situation | |||
| Level of Clouds | Number of Groups of 8NCLCMCH (According to WMO) | Sum [%] | ||||||||
|---|---|---|---|---|---|---|---|---|---|---|
| 1 | 2 | 3 | 4 | 5 | 6 | 7 | 8 | |||
| Svalbard-Lufthavn | CL | 1 | 0 | 0 | 0 | 89 | 3.0 | 6.2 | 0.8 | 100 |
| CM | 0.6 | 7.4 | 49.4 | 10.8 | 1.7 | 0 | 30.1 | 0 | 100 | |
| CH | 11.5 | 0 | 3.8 | 11.5 | 0 | 3.8 | 4.0 | 65.4 | 100 | |
| Petunia bukta | CL | 9.8 | 2 | 0 | 0 | 27.9 | 57 | 0 | 3.3 | 100 |
| CM | 4.3 | 0 | 30.4 | 13 | 26.1 | 0 | 26.2 | 0 | 100 | |
| CH | 8.3 | 0 | 11.1 | 13.9 | 0 | 0 | 0 | 66.7 | 100 | |
| Na | NEa | Ea | SEa | Sa | SWa | Wa | NWa | Ca | Ka | Nc | NEc | Ec | SEc | Sc | SWc | Wc | NWc | Cc | Bc | x | |
|---|---|---|---|---|---|---|---|---|---|---|---|---|---|---|---|---|---|---|---|---|---|
| Svalbard Lufthavn | 5 | 1 | 0 | - | - | 7 | 6 | - | 4 | 4 | 6 | 5 | 7 | - | - | 7 | 6 | 6 | 7 | 7 | 7 |
| Petunia bukta | 6 | 2 | 0 | - | - | 8 | 6 | - | 4 | 5 | 7 | 4 | 7 | - | - | 8 | 6 | 8 | 8 | 7 | 7 |
| Types of Clouds | SYNOP | Na | NEa | Ea | SEa | Sa | SWa | Wa | NWa | Ca | Ka | Nc | NEc | Ec | SEc | Sc | Ca | Bc | NWc | Cc | Bc | x | |
|---|---|---|---|---|---|---|---|---|---|---|---|---|---|---|---|---|---|---|---|---|---|---|---|
| Svalbard-Lufthavn | Cumulus | CL1, CL2 | 1 | 15 | - | - | - | - | - | - | - | 1 | - | - | - | - | - | - | - | - | - | - | - |
| Stratocumulus | CL4, CL5 | 30 | - | - | - | - | 41 | 28 | - | 27 | 28 | 36 | 25 | 27 | - | - | 40 | 31 | 32 | 23 | 29 | 47 | |
| Stratus | CL6, CL7 | 1 | - | - | - | - | 3 | 15 | - | - | 4 | - | - | 1 | - | - | 2 | 1 | - | 7 | 10 | - | |
| Nimbostratus | CM2, CM7 | 2 | - | - | - | - | 1 | - | - | - | 4 | 5 | - | 16 | - | - | 3 | 1 | 11 | 20 | 3 | - | |
| Cumulonimbus | CL3, CL9 | - | - | - | - | - | - | - | - | - | - | - | - | - | - | - | - | - | - | - | - | - | |
| Altostratus | CM1, CM2 | - | - | - | - | - | - | - | - | - | 1 | - | - | 1 | - | - | 3 | 1 | 4 | 5 | 1 | - | |
| Altocumulus | CM3, CM4, CM5, CM6, CM7, CM8, CM9 | 21 | 15 | - | - | - | 3 | - | - | 27 | 12 | 11 | 11 | 23 | - | - | 7 | 15 | 19 | 13 | 10 | - | |
| Cirrus | CH1, CH2, CH3, CH4 | 8 | - | 7 | - | - | 1 | 3 | - | 9 | 11 | 11 | 11 | 3 | - | - | - | 4 | - | - | 3 | - | |
| Cirrostratus | CH5, CH6, CH7, CH8 | - | - | - | - | - | 1 | - | - | - | - | 2 | 7 | - | - | - | - | 3 | 5 | - | 2 | - | |
| Cirrocumulus | CH9 | - | - | - | - | - | - | - | - | - | - | - | - | - | - | - | - | - | - | - | - | - | |
| Petuniabukta | Cumulus | CL1, CL2 | 2 | 15 | 7 | - | - | - | 5 | - | 9 | 12 | - | 20 | - | - | - | - | 4 | 4 | - | - | - |
| Stratocumulus | CL4, CL5 | 20 | 15 | - | - | - | 18 | 15 | - | 18 | 7 | 18 | - | 11 | - | - | 3 | 10 | 6 | - | 9 | - | |
| Stratus | CL6, CL7 | 8 | - | - | - | - | 22 | 20 | - | - | 16 | 16 | 7 | 17 | - | - | 38 | 17 | 18 | 32 | 29 | 47 | |
| Nimbostratus | CM2, CM7 | 2 | - | - | - | - | 3 | - | - | - | 4 | - | - | 1 | - | - | 3 | 6 | 1 | - | 1 | - | |
| Cumulonimbus | CL3, CL9 | - | - | - | - | - | - | - | - | - | - | - | - | - | - | - | - | - | - | - | - | - | |
| Altostratus | CM1, CM2 | - | - | - | - | - | - | - | - | - | - | - | - | - | - | - | - | - | - | - | 1 | - | |
| Altocumulus | CM3, CM4, CM5, CM6, CM7, CM8, CM9 | - | - | 79 | - | - | 7 | 15 | - | - | - | - | - | - | - | - | - | - | - | - | - | - | |
| Cirrus | CH1, CH2, CH3, CH4 | - | 8 | 7 | - | - | - | - | - | 5 | - | - | 7 | - | - | - | - | - | - | - | 2 | 6 | |
| Cirrostratus | CH5, CH6, CH7, CH8 | 3 | 31 | - | - | - | - | - | - | - | - | - | 13 | - | - | - | - | 6 | - | - | - | - | |
| Cirrocumulus | CH9 | - | - | - | - | - | - | - | - | 5 | 1 | - | - | - | - | - | - | 1 | - | - | - | - |
Publisher’s Note: MDPI stays neutral with regard to jurisdictional claims in published maps and institutional affiliations. |
© 2021 by the authors. Licensee MDPI, Basel, Switzerland. This article is an open access article distributed under the terms and conditions of the Creative Commons Attribution (CC BY) license (https://creativecommons.org/licenses/by/4.0/).
Share and Cite
Kolendowicz, L.; Półrolniczak, M.; Kendzierski, S.; Szyga-Pluta, K.; Láska, K. Influence of Atmospheric Circulation on Cloudiness and Cloud Types in Petuniabukta and Svalbard-Lufthavn in Summer 2016. Atmosphere 2021, 12, 724. https://doi.org/10.3390/atmos12060724
Kolendowicz L, Półrolniczak M, Kendzierski S, Szyga-Pluta K, Láska K. Influence of Atmospheric Circulation on Cloudiness and Cloud Types in Petuniabukta and Svalbard-Lufthavn in Summer 2016. Atmosphere. 2021; 12(6):724. https://doi.org/10.3390/atmos12060724
Chicago/Turabian StyleKolendowicz, Leszek, Marek Półrolniczak, Sebastian Kendzierski, Katarzyna Szyga-Pluta, and Kamil Láska. 2021. "Influence of Atmospheric Circulation on Cloudiness and Cloud Types in Petuniabukta and Svalbard-Lufthavn in Summer 2016" Atmosphere 12, no. 6: 724. https://doi.org/10.3390/atmos12060724