Article

Assessing the Factors of Dengue Transmission in Urban Environments of Pakistan

1
International Center for Climate and Environment Sciences, Institute of Atmospheric Physics, Chinese Academy of Sciences, Beijing 100029, China
2
Department of Environmental Sciences, International Islamic University, Islamabad 46300, Pakistan
3
Earth System Physics, The Abdus Salam International Centre for Theoretical Physics, 34151 Trieste, Italy
4
Department of Zoology, Faculty of Bio-Sciences, Cholistan University of Veterinary and Animal Sciences, Bahawalpur 63100, Pakistan
*
Authors to whom correspondence should be addressed.
Atmosphere 2021, 12(6), 773; https://doi.org/10.3390/atmos12060773
Submission received: 27 April 2021 / Revised: 8 June 2021 / Accepted: 11 June 2021 / Published: 16 June 2021
(This article belongs to the Section Biometeorology and Bioclimatology)

Abstract

:
The rationale of this study is to highlight the significance of relationships of dengue transmission with climate and societal factors for four major cities in Pakistan (i.e., Islamabad, Rawalpindi, Lahore, and Karachi). These cities have been observed to report higher numbers of dengue cases in the last few years, with the highest number of cases reported during 2011. With careful consideration, the relationships of dengue transmission with climate factors, human population density, and traveling in the study areas have been taken into account. Regression model and generalized linear mixed model (GLM) with Markov chain Monte Carlo (MCMC) algorithm are computed to determine the relationships and random effects of different social (human population density, traveling) and climate (minimum-maximum temperatures, and rainfall) factors on dengue transmission. Neural network (NN) with multilayer perceptron algorithm is used to analyze the normalized importance of different covariates relative to dengue transmission. The results show that minimum temperature and rainfall, together with societal factors, significantly affecting the transmission of dengue in the study areas. The magnitude of these relationships is also shown by the results of the neural network. GLM also shows the significant random effects of minimum temperature, rainfall, human population density, and traveling on dengue transmission during the studied years (2009–2018).

1. Introduction

Recently, climate related studies on dengue transmission have been conducted for different cities of Pakistan [1,2], but the significance of its (i.e., dengue transmission) relationships with societal and climate parameters require further investigation. In Pakistan, most dengue cases were reported after the onset of the summer monsoon season [1]. The monsoon system allows significant moisture transfer to the wide geographical region of the Indian Subcontinent, which highly affects the human population as well as the population of Aedes aegypti, a female dengue mosquito [3,4]. The summer monsoon season comprising the months of July, August, and September; contributing 50–75% of the total annual rainfall in Pakistan [5]. Due to the summer monsoon season, humid and warmer conditions prevail over Karachi and generally over the Indian Subcontinent [6,7]. The Indian monsoon rainfall did not show high fluctuations during the past century, but it has experienced several inter-decadal variations during the last decade [8]. Pakistan lies in the subtropical region and receives less overall rainfall, but the inter-decadal variations have caused severe flash flooding of the drainage systems [9]. Pakistan has been experiencing unceasing flood risks during the last decade, with a severe flood in the year 2010 that affected around 20 million people. These flood events have badly affected the economy and lives throughout the country [10]. Due to these extreme events, the greater summer rainfall combined with sharp seasonal temperature transitions may cause substantial additional and increased variability of runoff, and its adverse effects on human populations such as the spread of vector borne diseases [11,12]. Larval abundance is also associated with increased rainfall and minimum temperatures [13]. Reference [14] reported the outbreak of different infectious diseases after flooding in Romania, the Czech Republic, and Italy. Similarly, outbreaks of dengue fever after flooding have also been reported in Pakistan [15]. Mean monthly minimum and maximum temperature for the months of July-October in Islamabad, Rawalpindi, Lahore, and Karachi were higher than the normal temperature in 2010 and 2011 and caused major dengue outbreaks [1]. The urban areas of the studied cities have increased rapidly over the last decade. The continuously growing human population has also caused disturbances in urbanization patterns. The limited space of 3000–7000 people/km2 of human population density is prone to dengue outbreak in Vietnam [16]. The increased urbanization and population show the positive impact on dengue transmission in the study areas by affecting the local weather parameters [1]. Because dengue was absent from this region (i.e., Pakistan/Indian Subcontinent) for an extended period of time, many reasons have been proposed to demonstrate its re-emergence [17], and this study aims to fill this research gap. The intensity and timing of disease outbreaks can be predicted by analyzing the mean minimum and maximum temperatures, wind speed, and relative humidity; whereas, by analyzing rainfall, seasonal timings of epidemics may be predicted. These factors are effective when analyzed with specific time lags in the laboratory experiments [4]. The minimum temperature and maximum total rainfall plays significant role in dengue transmission in southern Taiwan [18]. Different studies have found maximum and minimum temperatures being important factor in dengue fever transmission in Singapore and Pakistan [1,19]. Reference [19] did not find a high correlation between rainfall and dengue incidence in Singapore, whereas [20] found a relationship between rainfall and dengue incidence in Brazil, Peru, and Bangkok. Relative humidity was found to be negatively associated with dengue fever incidence in sub-tropical Taiwan [21]. Such studies have highlighted the multiple avenues by which climatic factors may influence dengue fever transmission in different regions.
The annual morbidity ratio in Southeast Asia was 159 per 1000 ill returned travelers during epidemic years and 50 per 1000 travelers during non-epidemic years [22]. Dengue has been reported in returning travelers in the United States and France [23,24]. Cases of vector borne diseases have also been reported among migrants and returning travelers in Thailand and Tunisia [25,26]. The subtropical climate along with the monsoon environment provides suitable conditions for vectors to flourish, and hence dengue fever has been found endemic in these regions [27]. The transmission rate of vector borne diseases is also high among migrants from high endemic areas in Thailand [28]. Micro and macro level studies have been conducted in Pakistan [1,2] that demonstrate the connection between dengue transmission in urban environments with societal and climate parameters. However, it is important to understand the degree of dependence of vector borne diseases, specifically dengue fever, on various societal and climate factors in urban environments. The relationship of dengue transmission with traveling, societal, and climate covariates for Pakistan is lacking in the scientific literature. For this purpose, this study has accounted for the relationships between the dengue transmission in urban regions, climate, and societal factors in four different cities of Pakistan—i.e., Islamabad, Rawalpindi, Lahore, and Karachi—for the period of 2009–2018.

2. Material and Methods

2.1. Study Region

This study was conducted for four cities of Pakistan—i.e., Islamabad, Rawalpindi, Lahore, and Karachi. Islamabad is the federal capital of Pakistan and lies in the north of Rawalpindi; without any definite boundary between both cities, hence regarded as twin cities. Islamabad and Rawalpindi lies in the Potwar region comprising mountains and plains [1]. Lahore is the second most populous city of Pakistan, lies in the eastern Potwar region and is regarded as capital of the Punjab province. The Ravi River passes through the west of Lahore irrigating the large part of the city. Karachi lies in the southeast of Pakistan and is the most populous city of the country. Arabian Sea lies in the south of Karachi. Karachi comprises rolling and flat plains with hills on the northern and western boundaries of the urban region (Figure 1).

2.2. Data

The confirmed cases of dengue fever for study region were acquired from database of the Government of the Punjab and Sind, and the National Institute of Health (NIH), Islamabad. Travelers’ data of national highways was collected from the National Highway Authority Pakistan, data of traveling by airways was acquired from the Civil Aviation Authority Pakistan, and data of train traveling was acquired from the Economic Survey of Pakistan. The population data was collected from the National Institute of Population Studies, Islamabad. To study the relationship of dengue with climate covariates, the mean monthly maximum/minimum temperature in °C and the total monthly rainfall in millimeters (mm) were taken into account for the summer monsoon months of July, August, and September and a post monsoon month, i.e., October, from 2009–2018. These months were selected because higher number of dengue fever cases were reported during this time period [1]. The Climatic Research Unit Timeseries (CRU TS) v4.04 at 0.5° spatial resolution dataset for minimum/maximum temperature and rainfall was used to perform the analysis. CRU TS4.04 provides a high-resolution dataset calculated by applying angular-distance weighting interpolation. It provides monthly gridded fields for daily and sub-daily data. Societal covariates including travelers to the cities under study, highways, educational facilities, and human population density were processed from 2009–2018.

2.3. Data Analysis

Linear regression model was computed at 95% level of significance to analyze the relationship of social and climate covariates with dengue occurrence in study areas. The model was used to explain the relationship between two variables by fitting a linear equation to the observed data. In this study, the relationship of dengue was linearly analyzed with the climate and social covariates. The model also numerically measures the association denoted by ‘R’ and the strength of the association of the observed data for the two given variables; denoted by ‘R2’. The regression model is given by Equation (1)
Y = a + b X
where X is the explanatory variable and Y is the dependent variable. The intercept is represented by a, and b is the slope of the line.
The hypothesis assumed for our regression analysis is defined as follows:
Hypothesis 1.
Dengue transmission is not affected by (social and climate) factors.
Hypothesis 2.
Dengue transmission is affected by (social and climate) factors.
Generalized linear mixed model (GLMM) with Markov chain Monte Carlo (MCMC) algorithm was computed at 95% level of significance to see the random effects of climate and social covariates on dengue transmission. Random effect is the construct test of randomly involved factors in confidence intervals to determine their possible effects on the dependent variable. The generalized linear mixed model was used in the study of dengue occurrence in 160 micro regions of Brazil [29]. This model is useful in cases of non-normal longitudinal data sets. It enables to fit the linear mixed effect models to the sampled data. The ‘mixed’ procedure fits model more generally compared to the general linear model procedure and it involves all models in the variance components. This model is equally important to manage the unequal variances and correlated data because it uses a link function to model the responses of the different variables such as the log link. The general equation for the random effects excluding the residuals is shown in Equation (2)
η = X β + Z γ
where η represents the combination of the fixed and random effects. β is a px1 column vector of the fixed-effects regression coefficients; in this study we have five fixed effects predictors—i.e., mean monthly minimum and maximum temperatures, rainfall, population, and traveling. γ is a qx1 vector of the random effects, which are modeled as deviations from the fixed effect β , which is calculated as the mean, and the results have been discussed.
The link function g (⋅) relates the output y to the linear predictor η .
The GLMM for the conditional expectation of y is:
g (E(y)) = η ; it is conditional because the expected value depends on the level of the predictors.
The MCMC method is a more robust strategy for marginalizing the random effects and this algorithm for GLMM has become an active research area [30,31]. The Markov Chain is a mathematical system that undergoes transitions from one state to another. It is a random process usually characterized as memoryless (the Markov property of stochastic), and the next state depends only on the current state and not on the sequence of events that preceded it. A Markov chain is a sequence of random variables X1, X2, X3,… with the Markov property namely that, given the present state, the future and past states are independent.
Mathematically, this feature is represented in Equation (3) as
P r   ( X n + 1 = x | X 1 = x 1 ,   X 2 = x 2 , ,   X n = x n ) = P r   ( X n + 1 = x | X n = x n )
where P r represents the conditional probability of an event depending on the current state. If both conditional probabilities are well defined, i.e., if
P r   ( X n + 1 = x | X n = x n ) > 0
The possible values of Xi form a countable set S called the ‘state space’ of the chain.
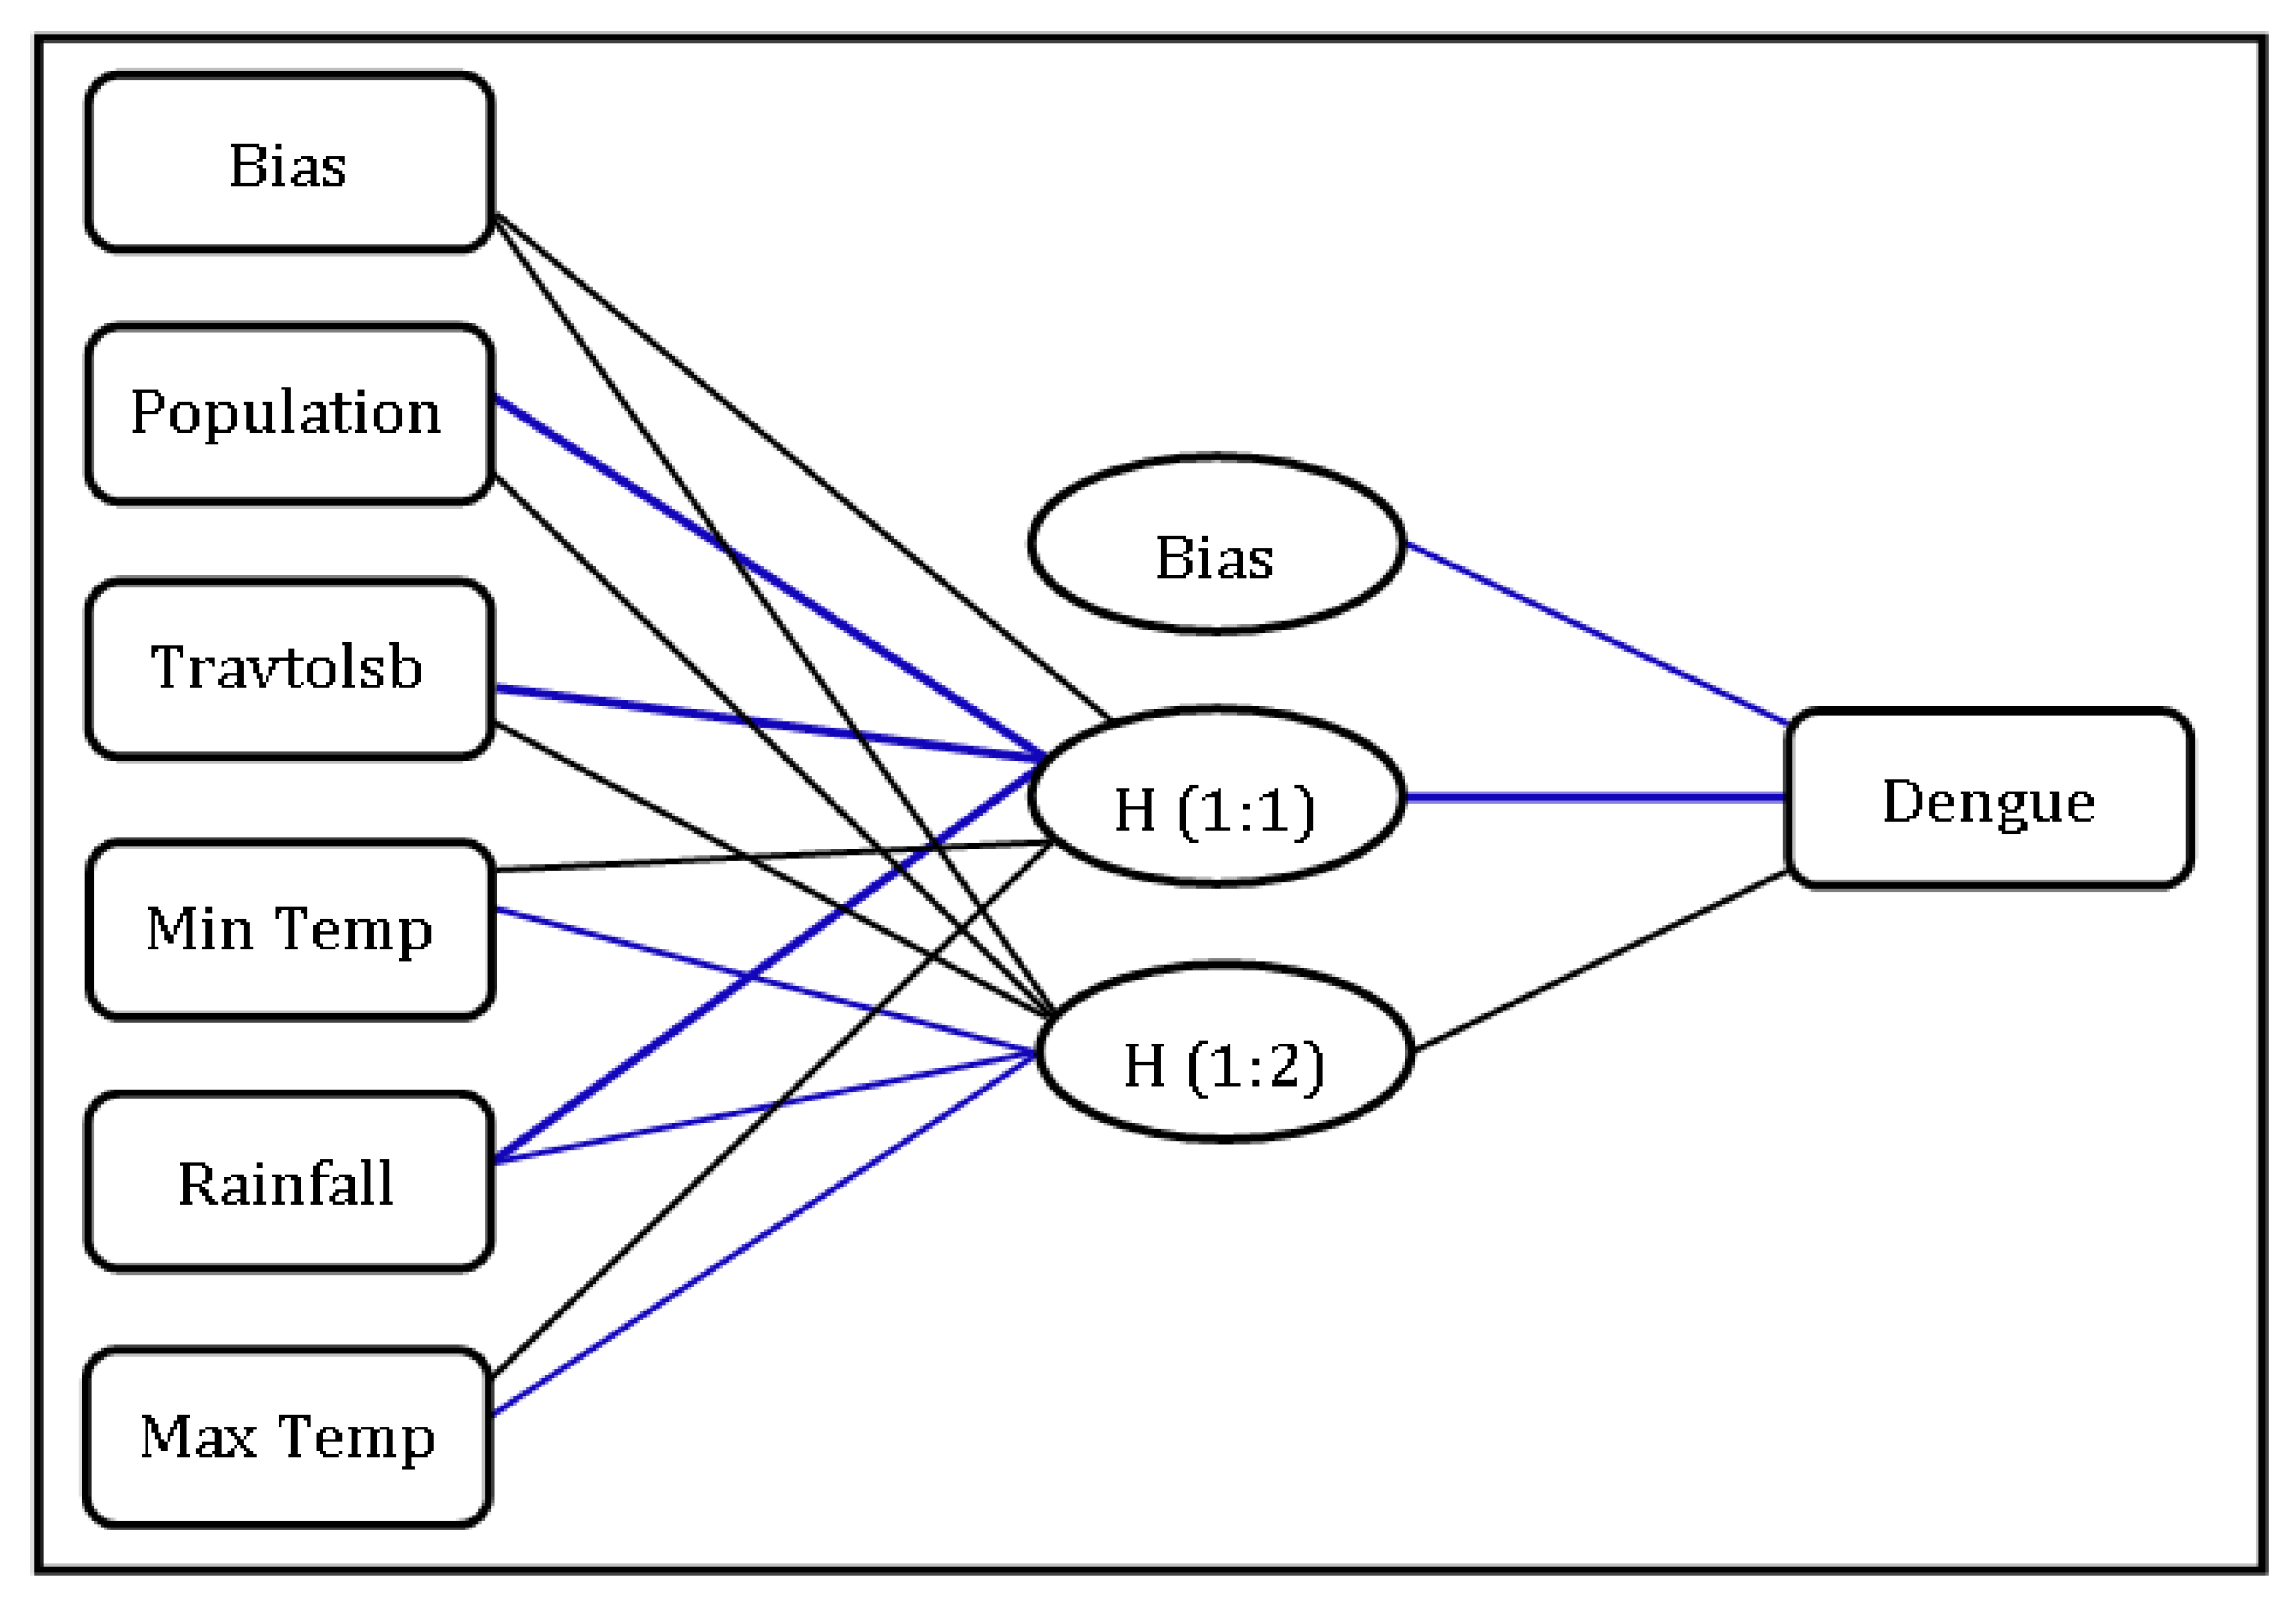
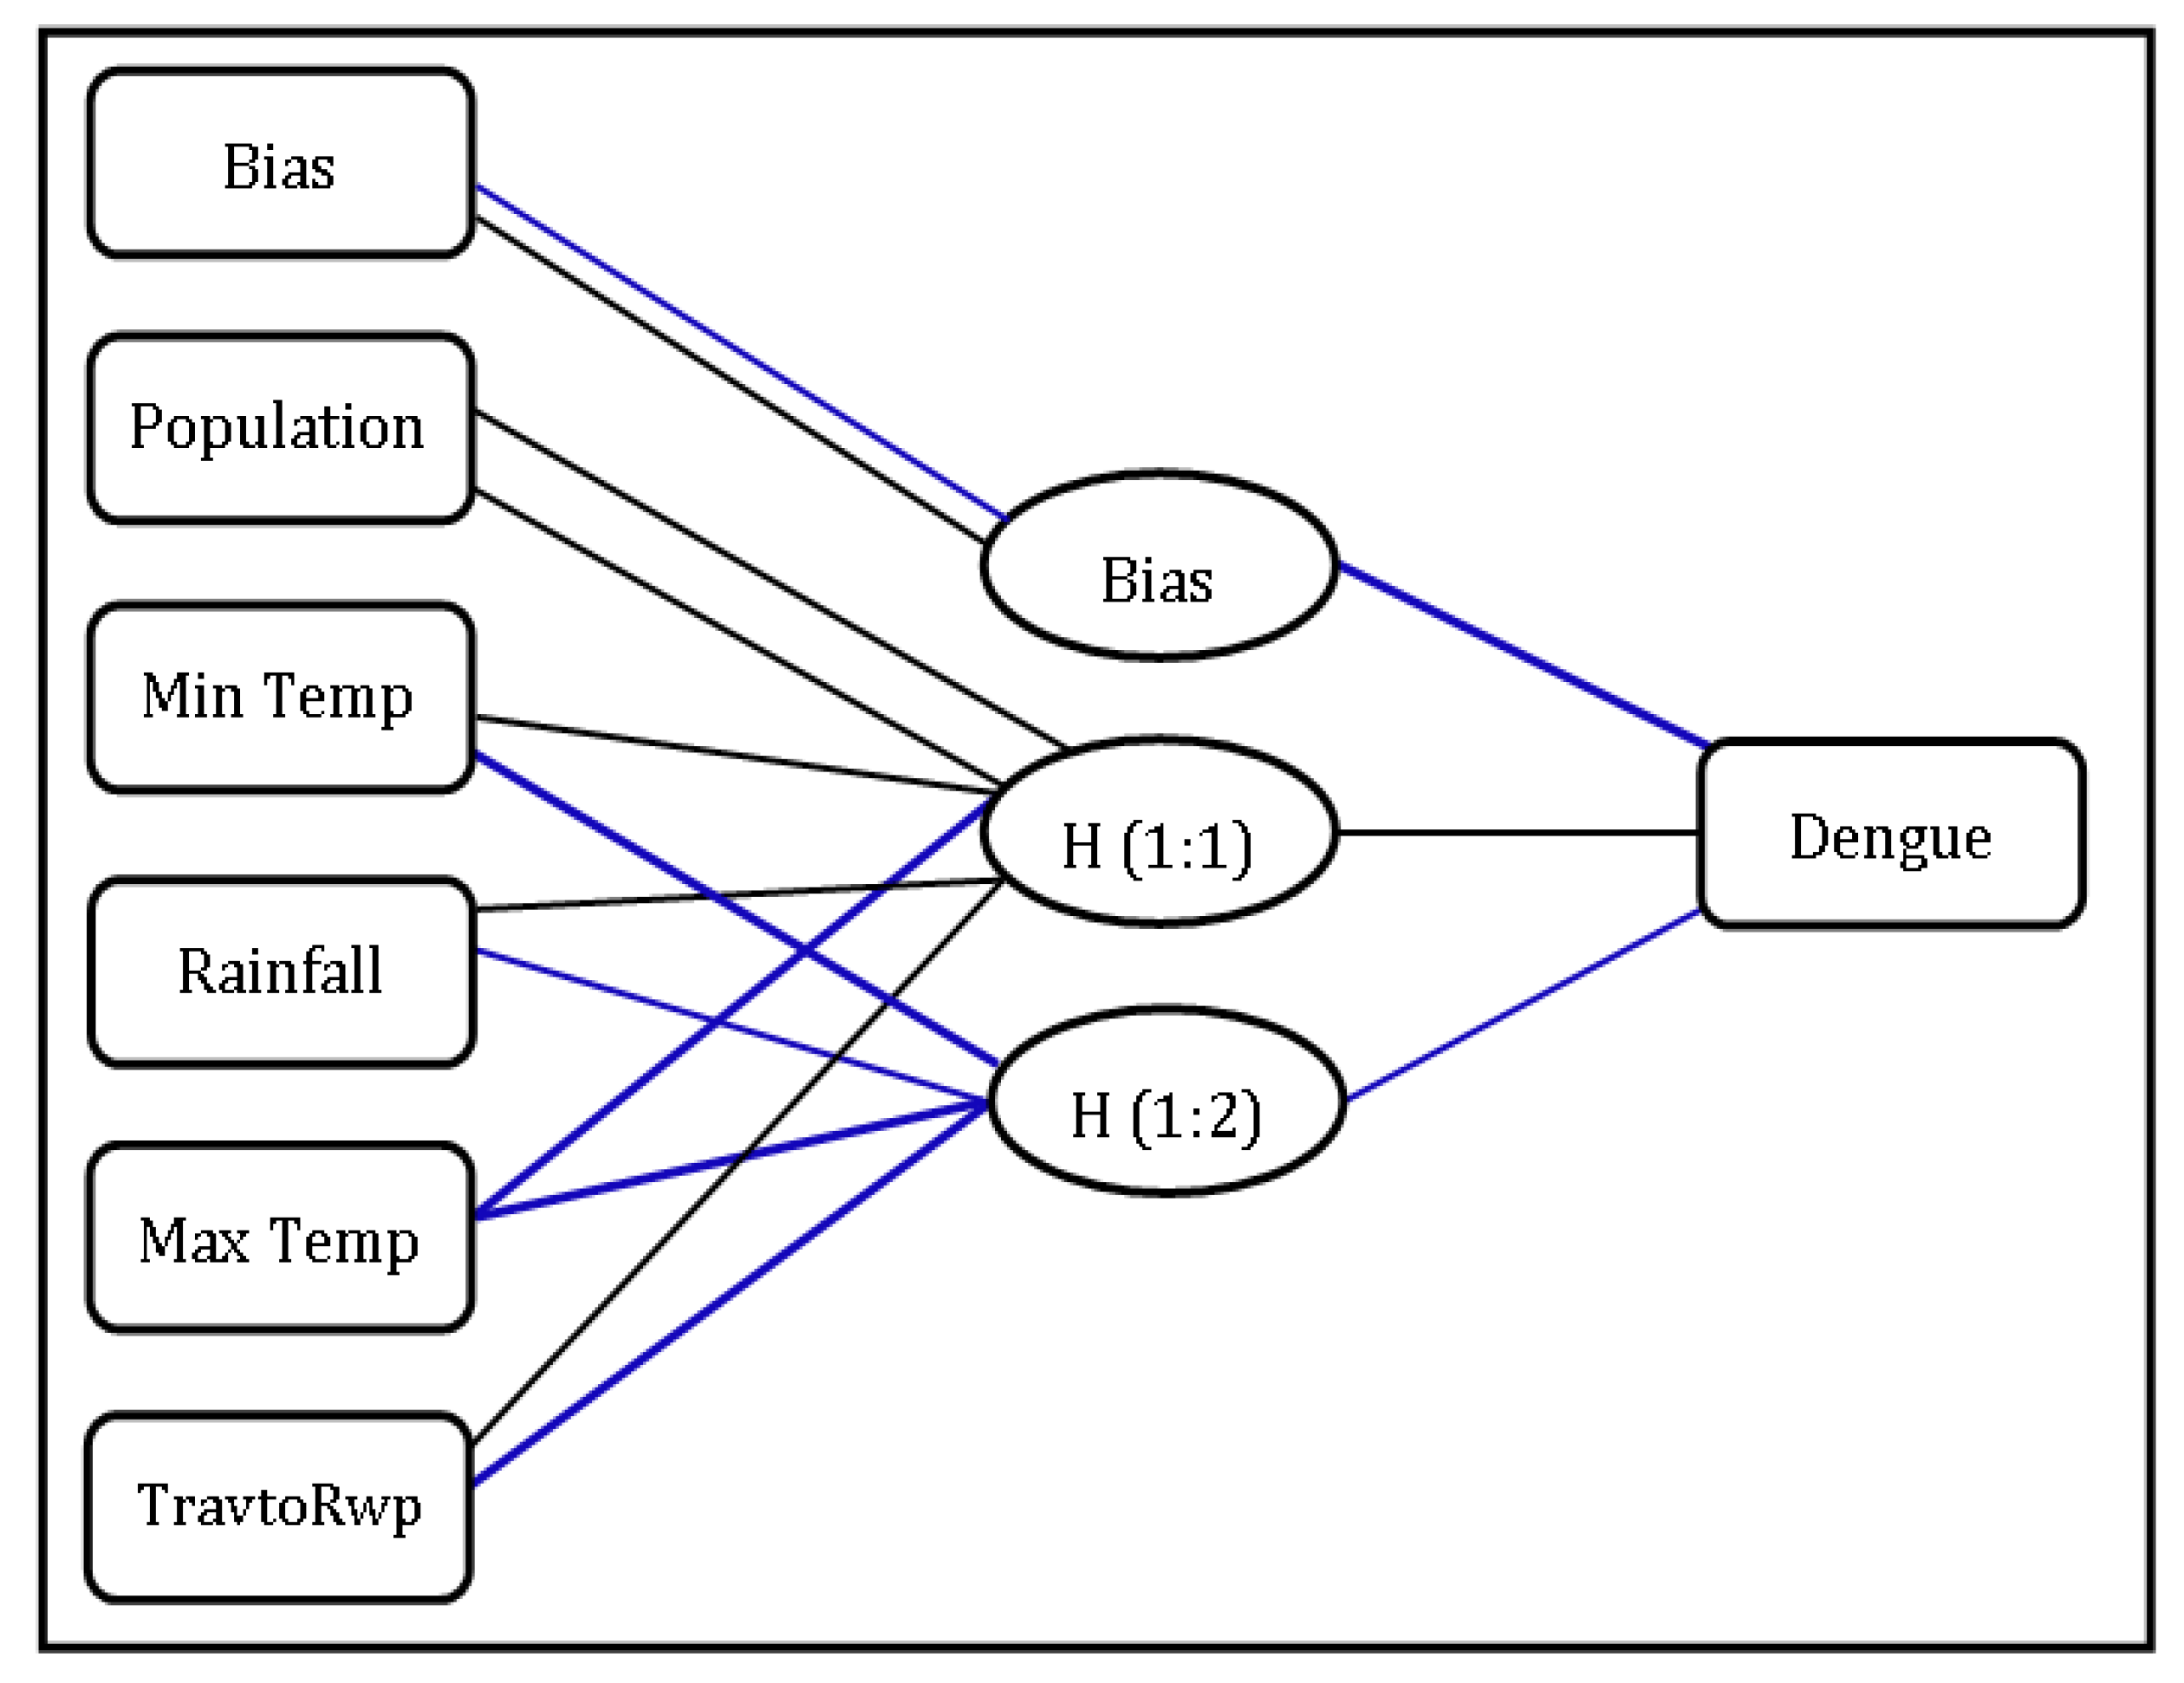
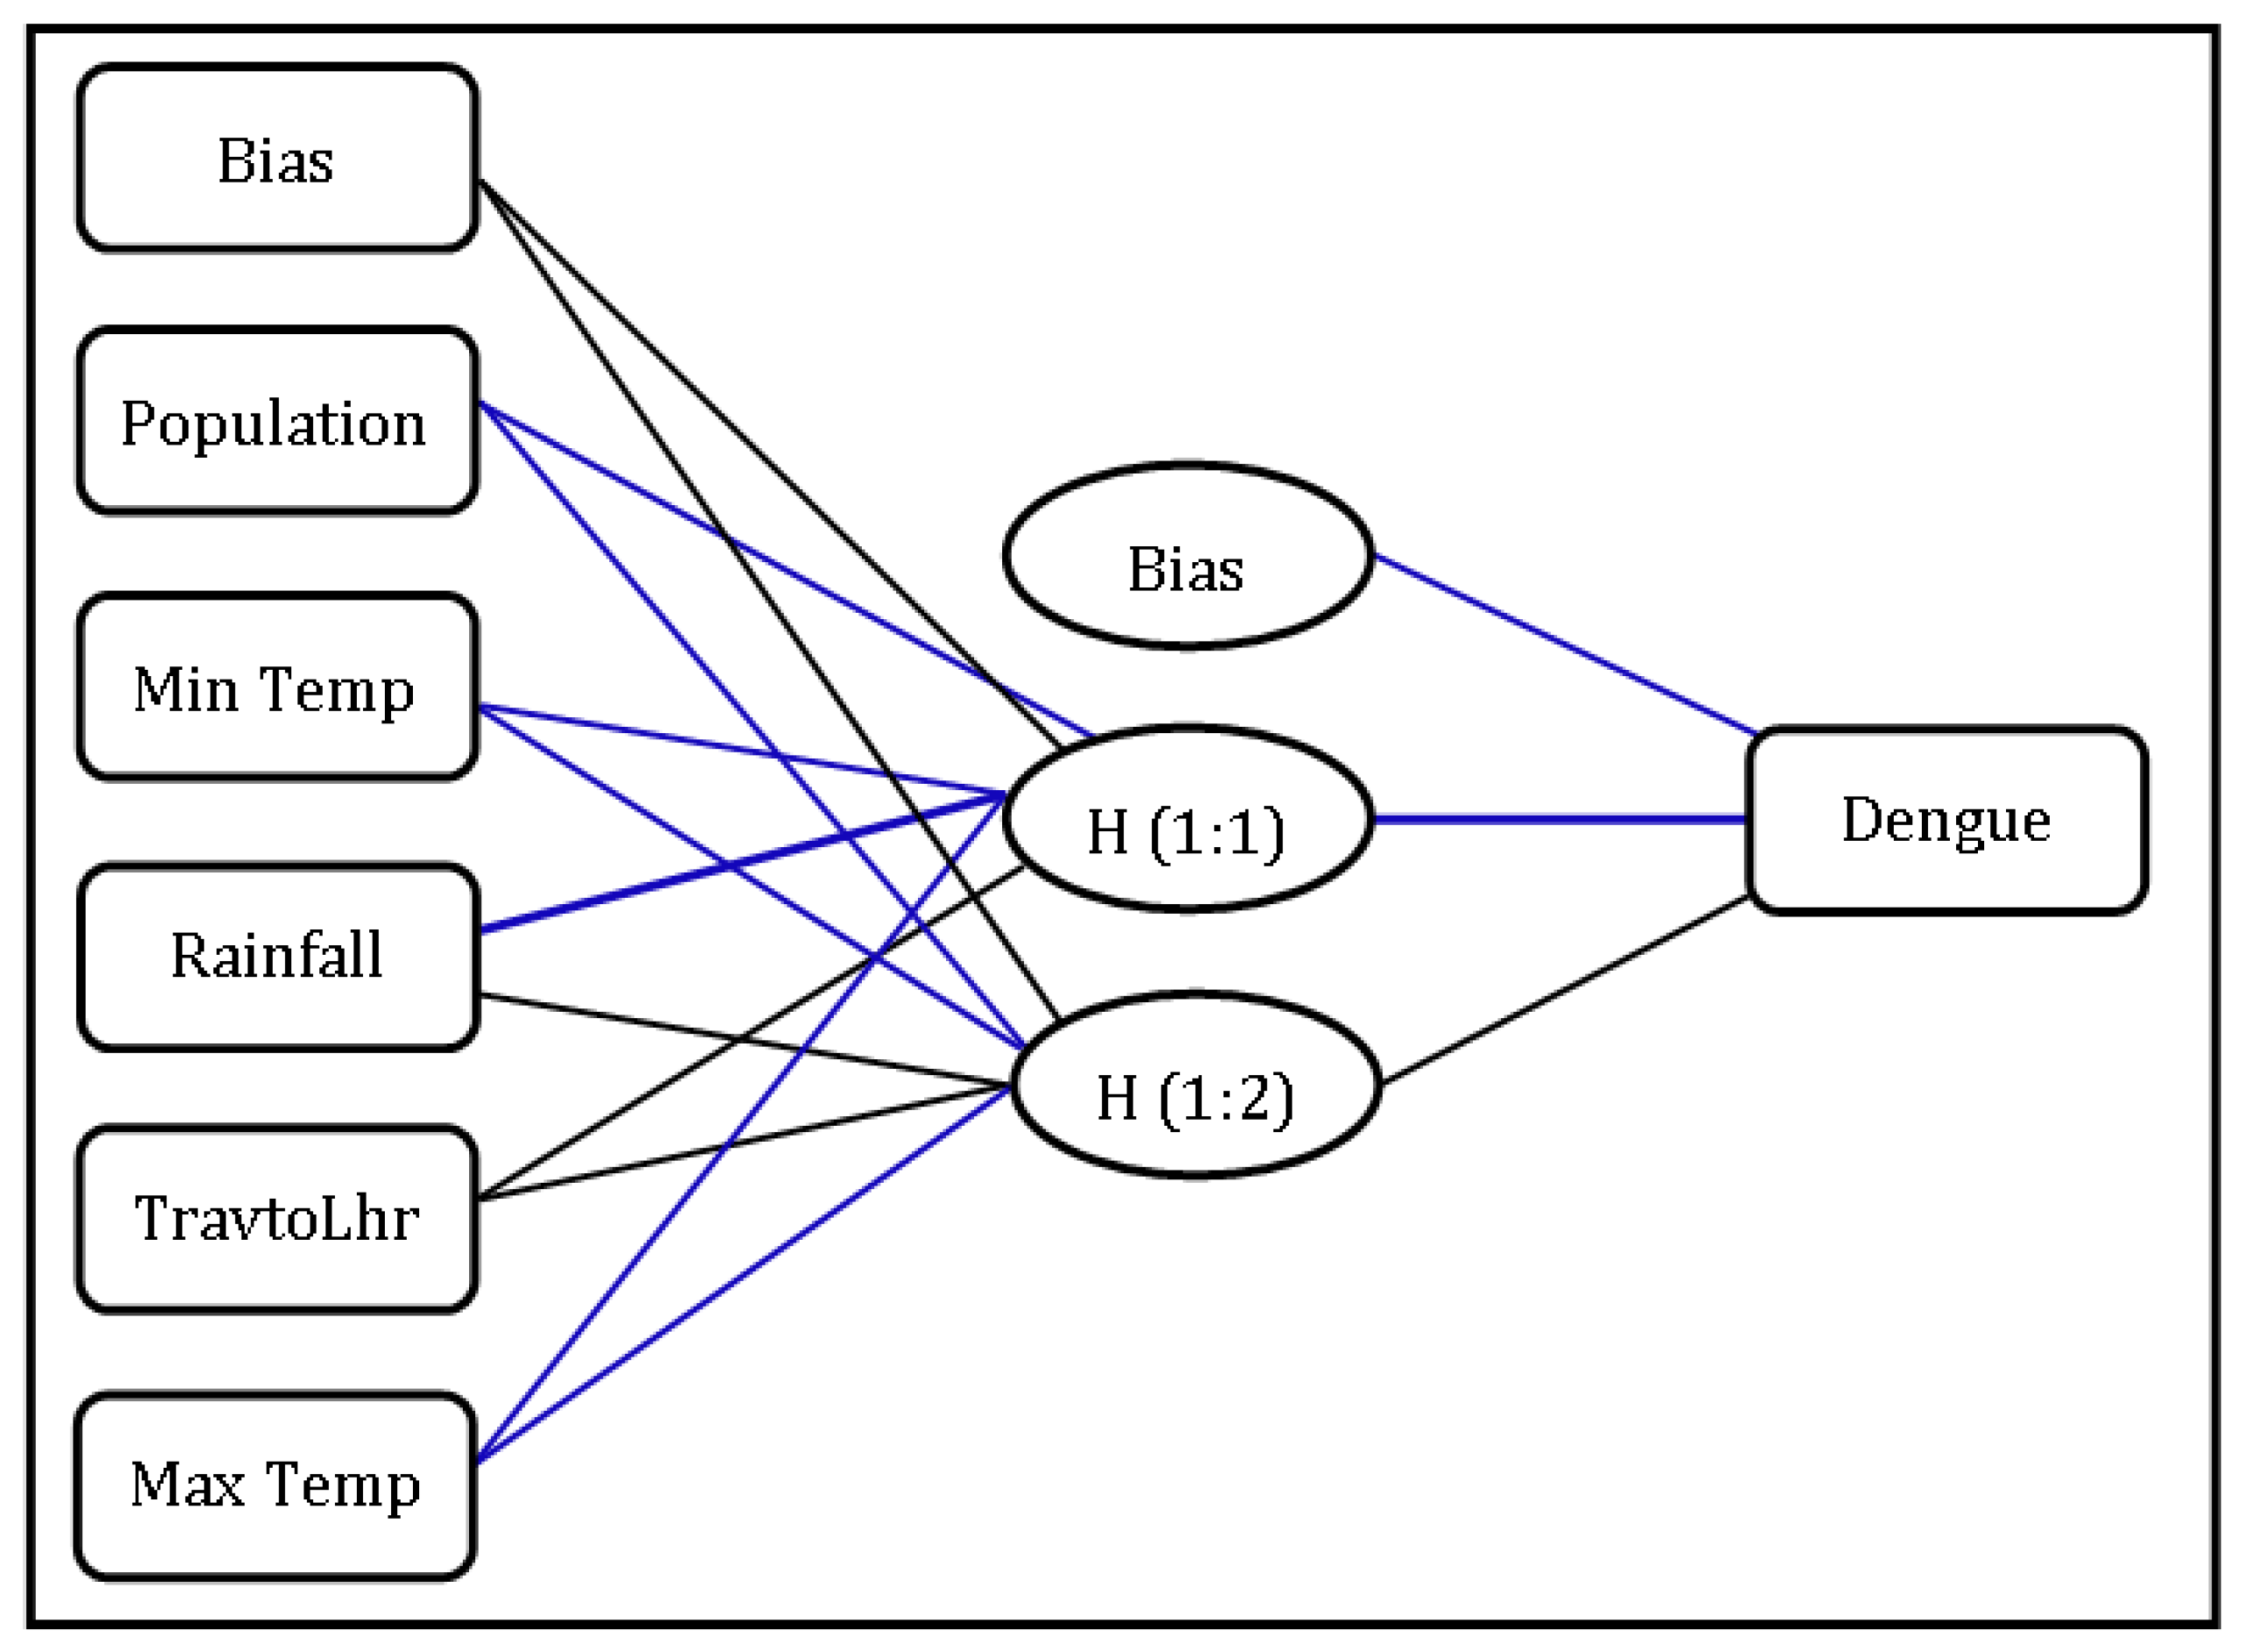
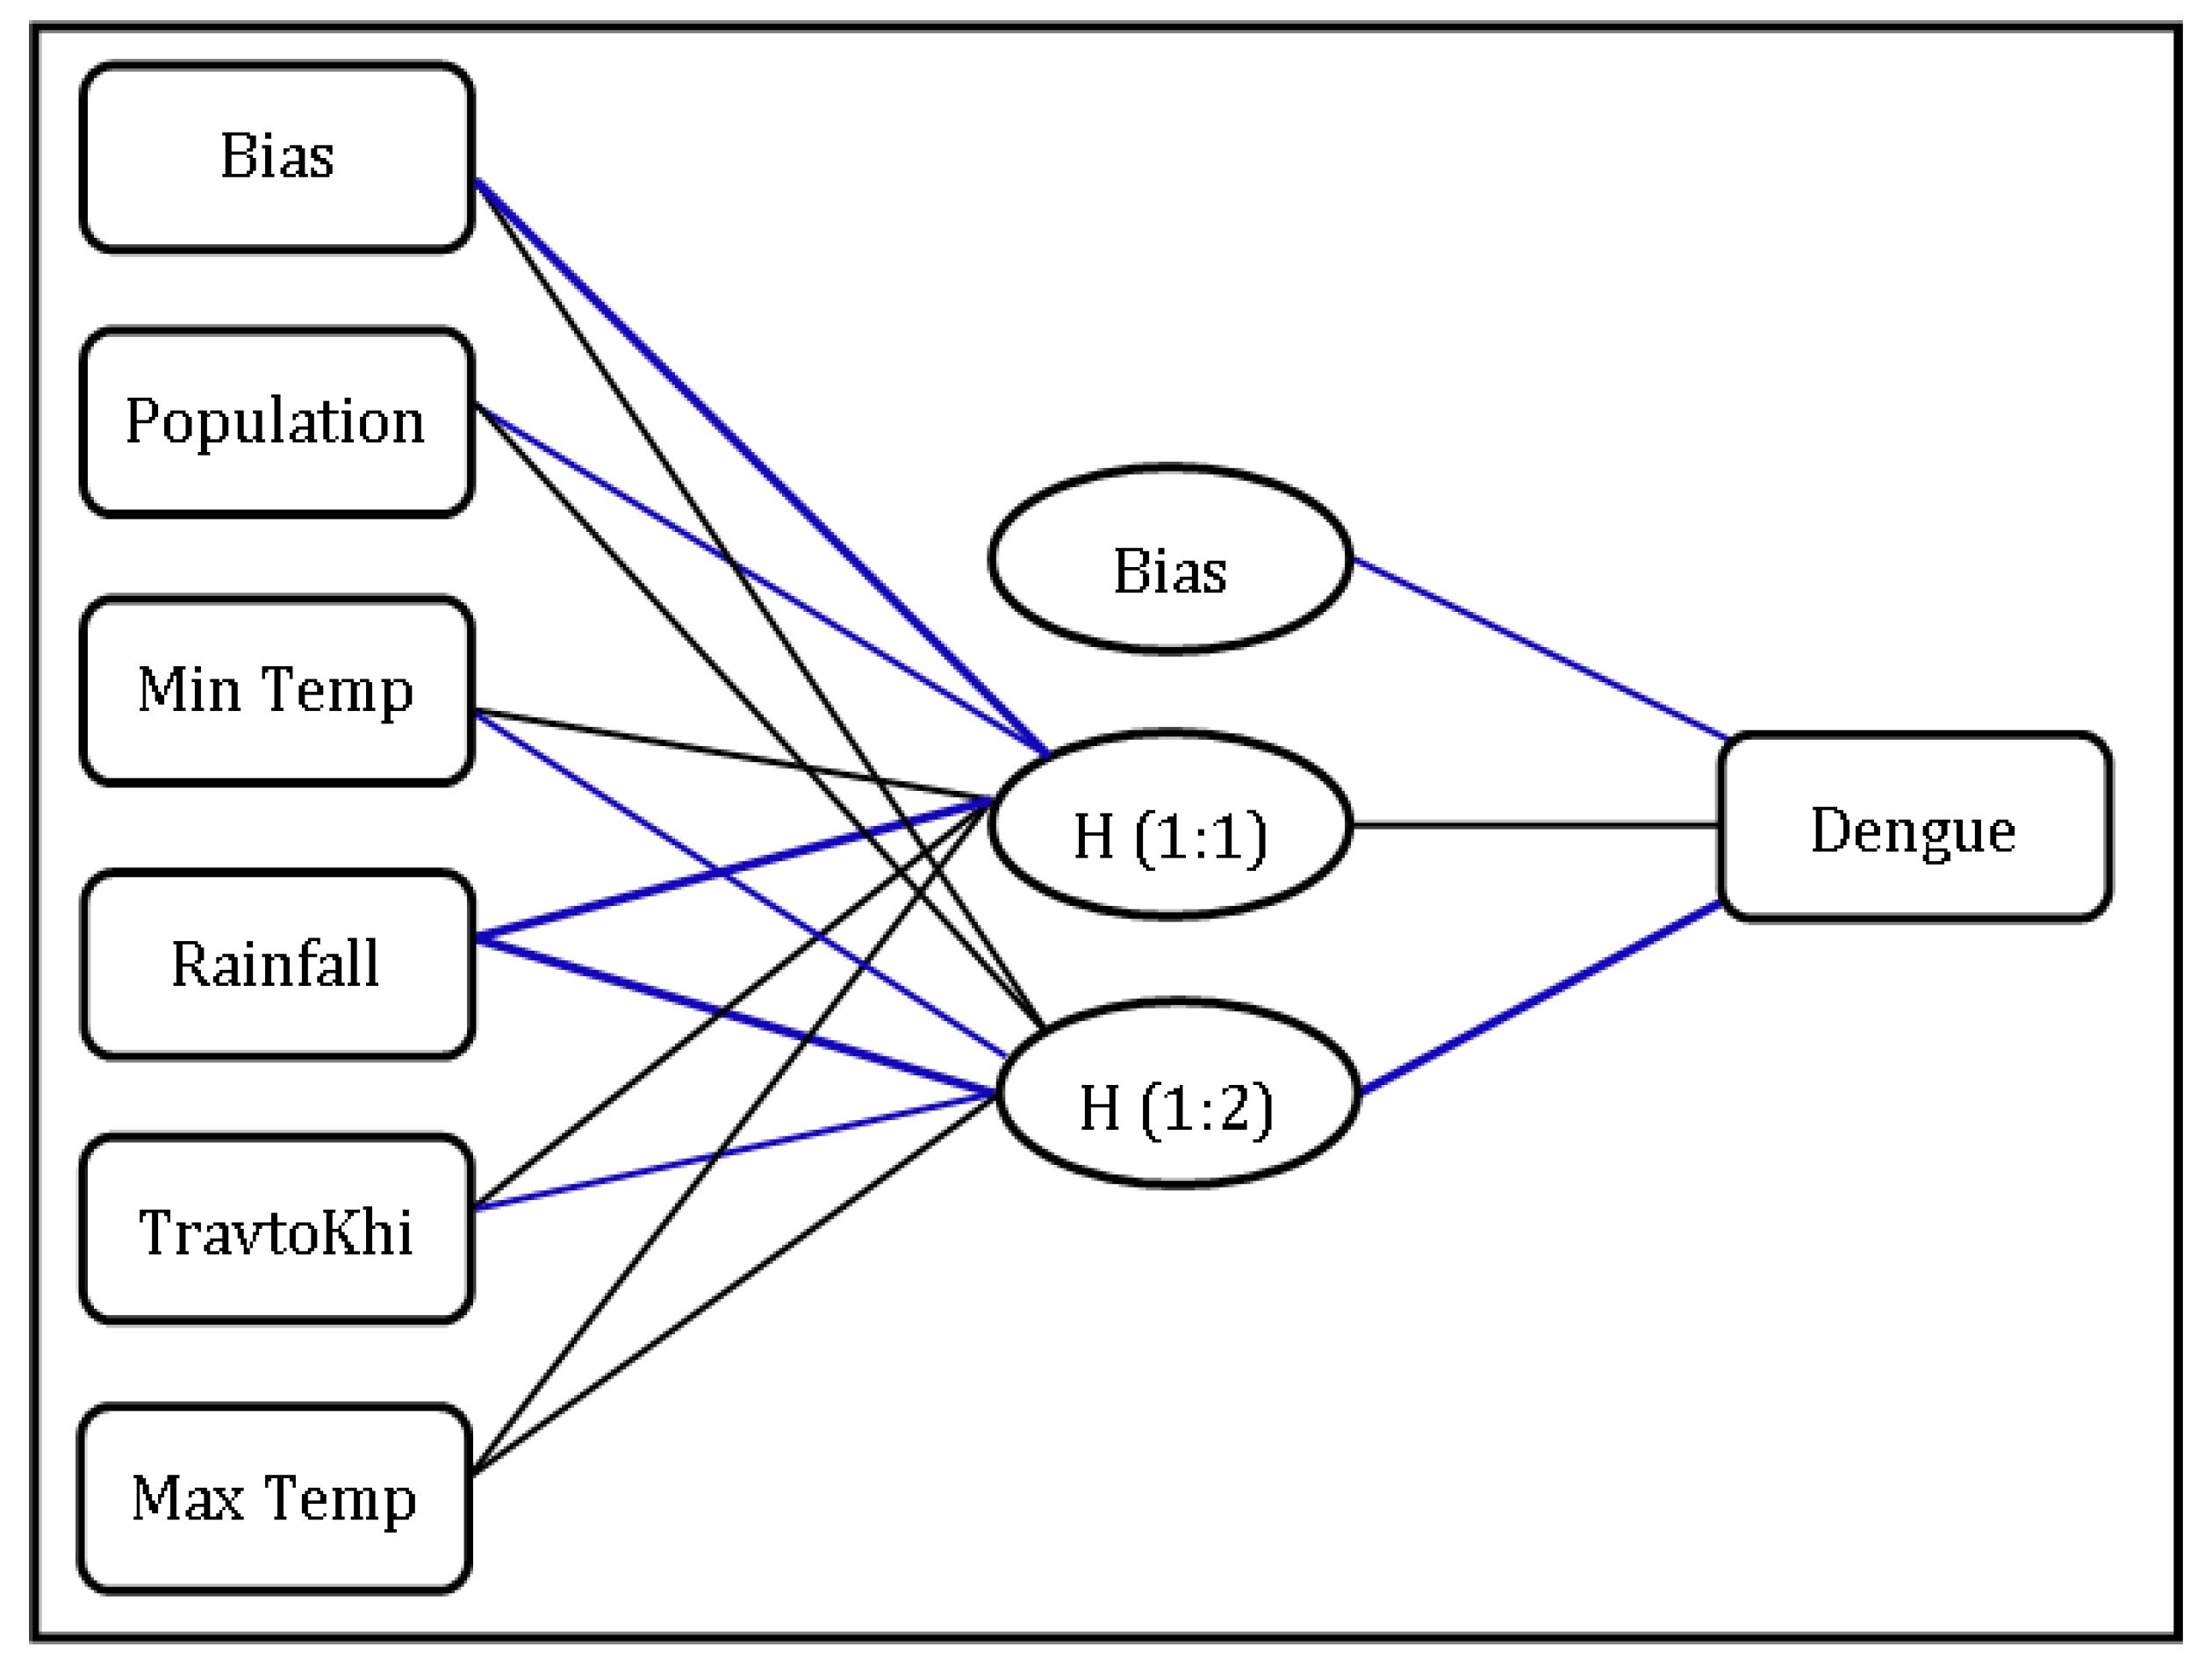
The NN with multilayer perceptron algorithm was computed at 95% level of significance for analyzing the normalized importance and the association of dengue transmission with the social and climate covariates in the study areas. The importance of an independent variable is measured by the change in the value of the network’s model prediction for different values of the independent variable. Normalized importance is calculated as the importance values divided by the largest importance values. It is expressed as percentages [32,33]. NN is the machine learning method used to estimate functions that may depend on a large number of inputs. NN is usually presented by the systems of interconnected ‘neurons’ or ‘nodes’ that exchange information between them. A multilayer perceptron is a feed-forward artificial neural network architecture that models multi-layer function and transforms it into a two-layer function. It uses the supervised learning technique for network and training called ‘backpropagation’ and produces results in the form of directed graphs with numerical weights. The color code of the directed line in the graph shows the relationship whereas its thickness shows the magnitude of the relationship. Multilayer activation function is used in all neurons to map the weighted inputs to the output of all neurons. Through this function, any number of layers may be reduced to a two-layer input–output model with a hidden layer. The two main activation functions are shown in Equation (5)
y ( v i ) = tanh ( v i )   a n d   y ( v i ) = ( 1 + e v i ) 1
where yi is the output of the ith node—i.e., the neuron—and vi is the weighted sum of the input synapses. Both of the activation functions have been applied concurrently to reduce any number of layers in the two-layer model. Processes occur in the perceptron by altering the connection weights after every processed piece of data, on the basis of the amount of error occurred in the output in comparison to the expected result. This is called the supervised learning technique and is carried out through backpropagation—i.e., the generalization of the least mean squares algorithm in the linear perceptron. The error in the output node is represented by j at the nth data point by e j ( n ) = d j ( n ) y j ( n ) , where d is the targeted value and y is the value produced by the perceptron. The corrections to the errors of the nodes are made by Equation (6)
ε ( n ) = 1 2 j e j 2 ( n )
The change in each weight can be found by the gradient descent shown in Equation (7)
Δ ω j i ( n ) = η ε ( n ) v j ( n ) y i ( n )
y i is the neuron and η is the processing rate that ensures the fast convergence of weights without oscillations. The calculation of the derivative depends on the induced varying local field v j . The change in the output nodes is shown by Equation (8)
ε ( n ) v j ( n ) = e j ( n ) φ v i ( n )
where the derivative of the activation function is φ that does not vary itself. For change in the weights to the hidden node, the derivative can be shown by Equation (9)
ε ( n ) v j ( n ) = φ ( v i ( n ) ) k ε ( n ) v k ( n ) ω j k ( n )
It depends on the change of the kth node weight that represents the output layer. The change in the output layer weights according to the derivative of the activation function is required for the change in the hidden layer weights. Hence, this shows the algorithm of the backpropagation of the activation function.
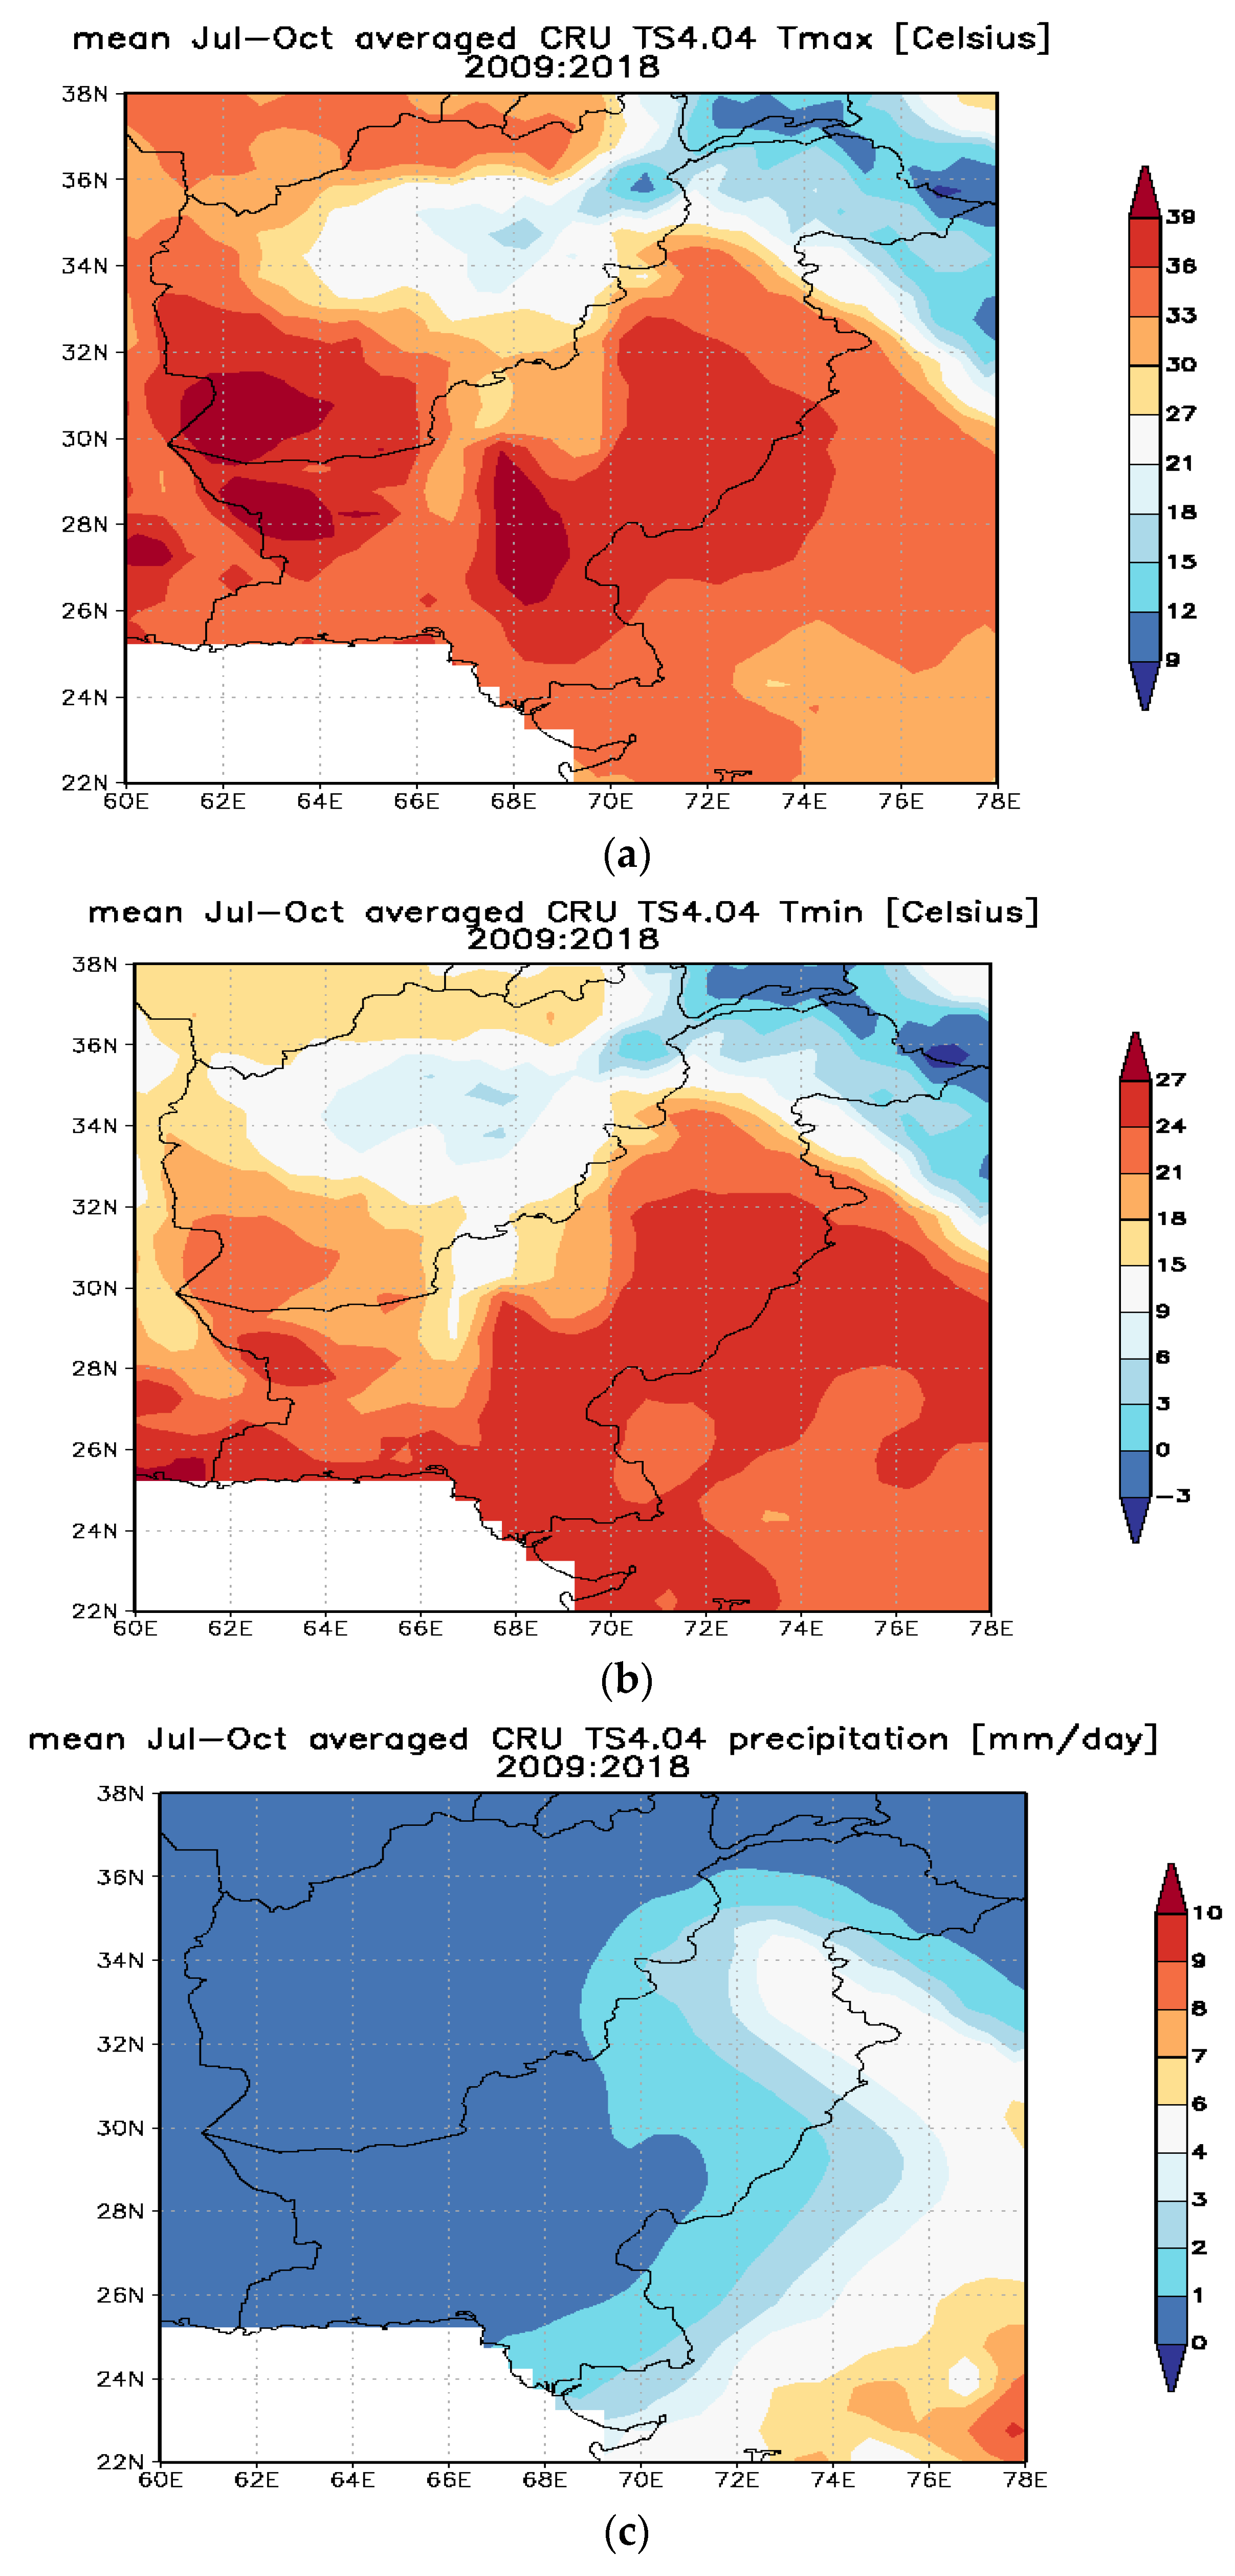
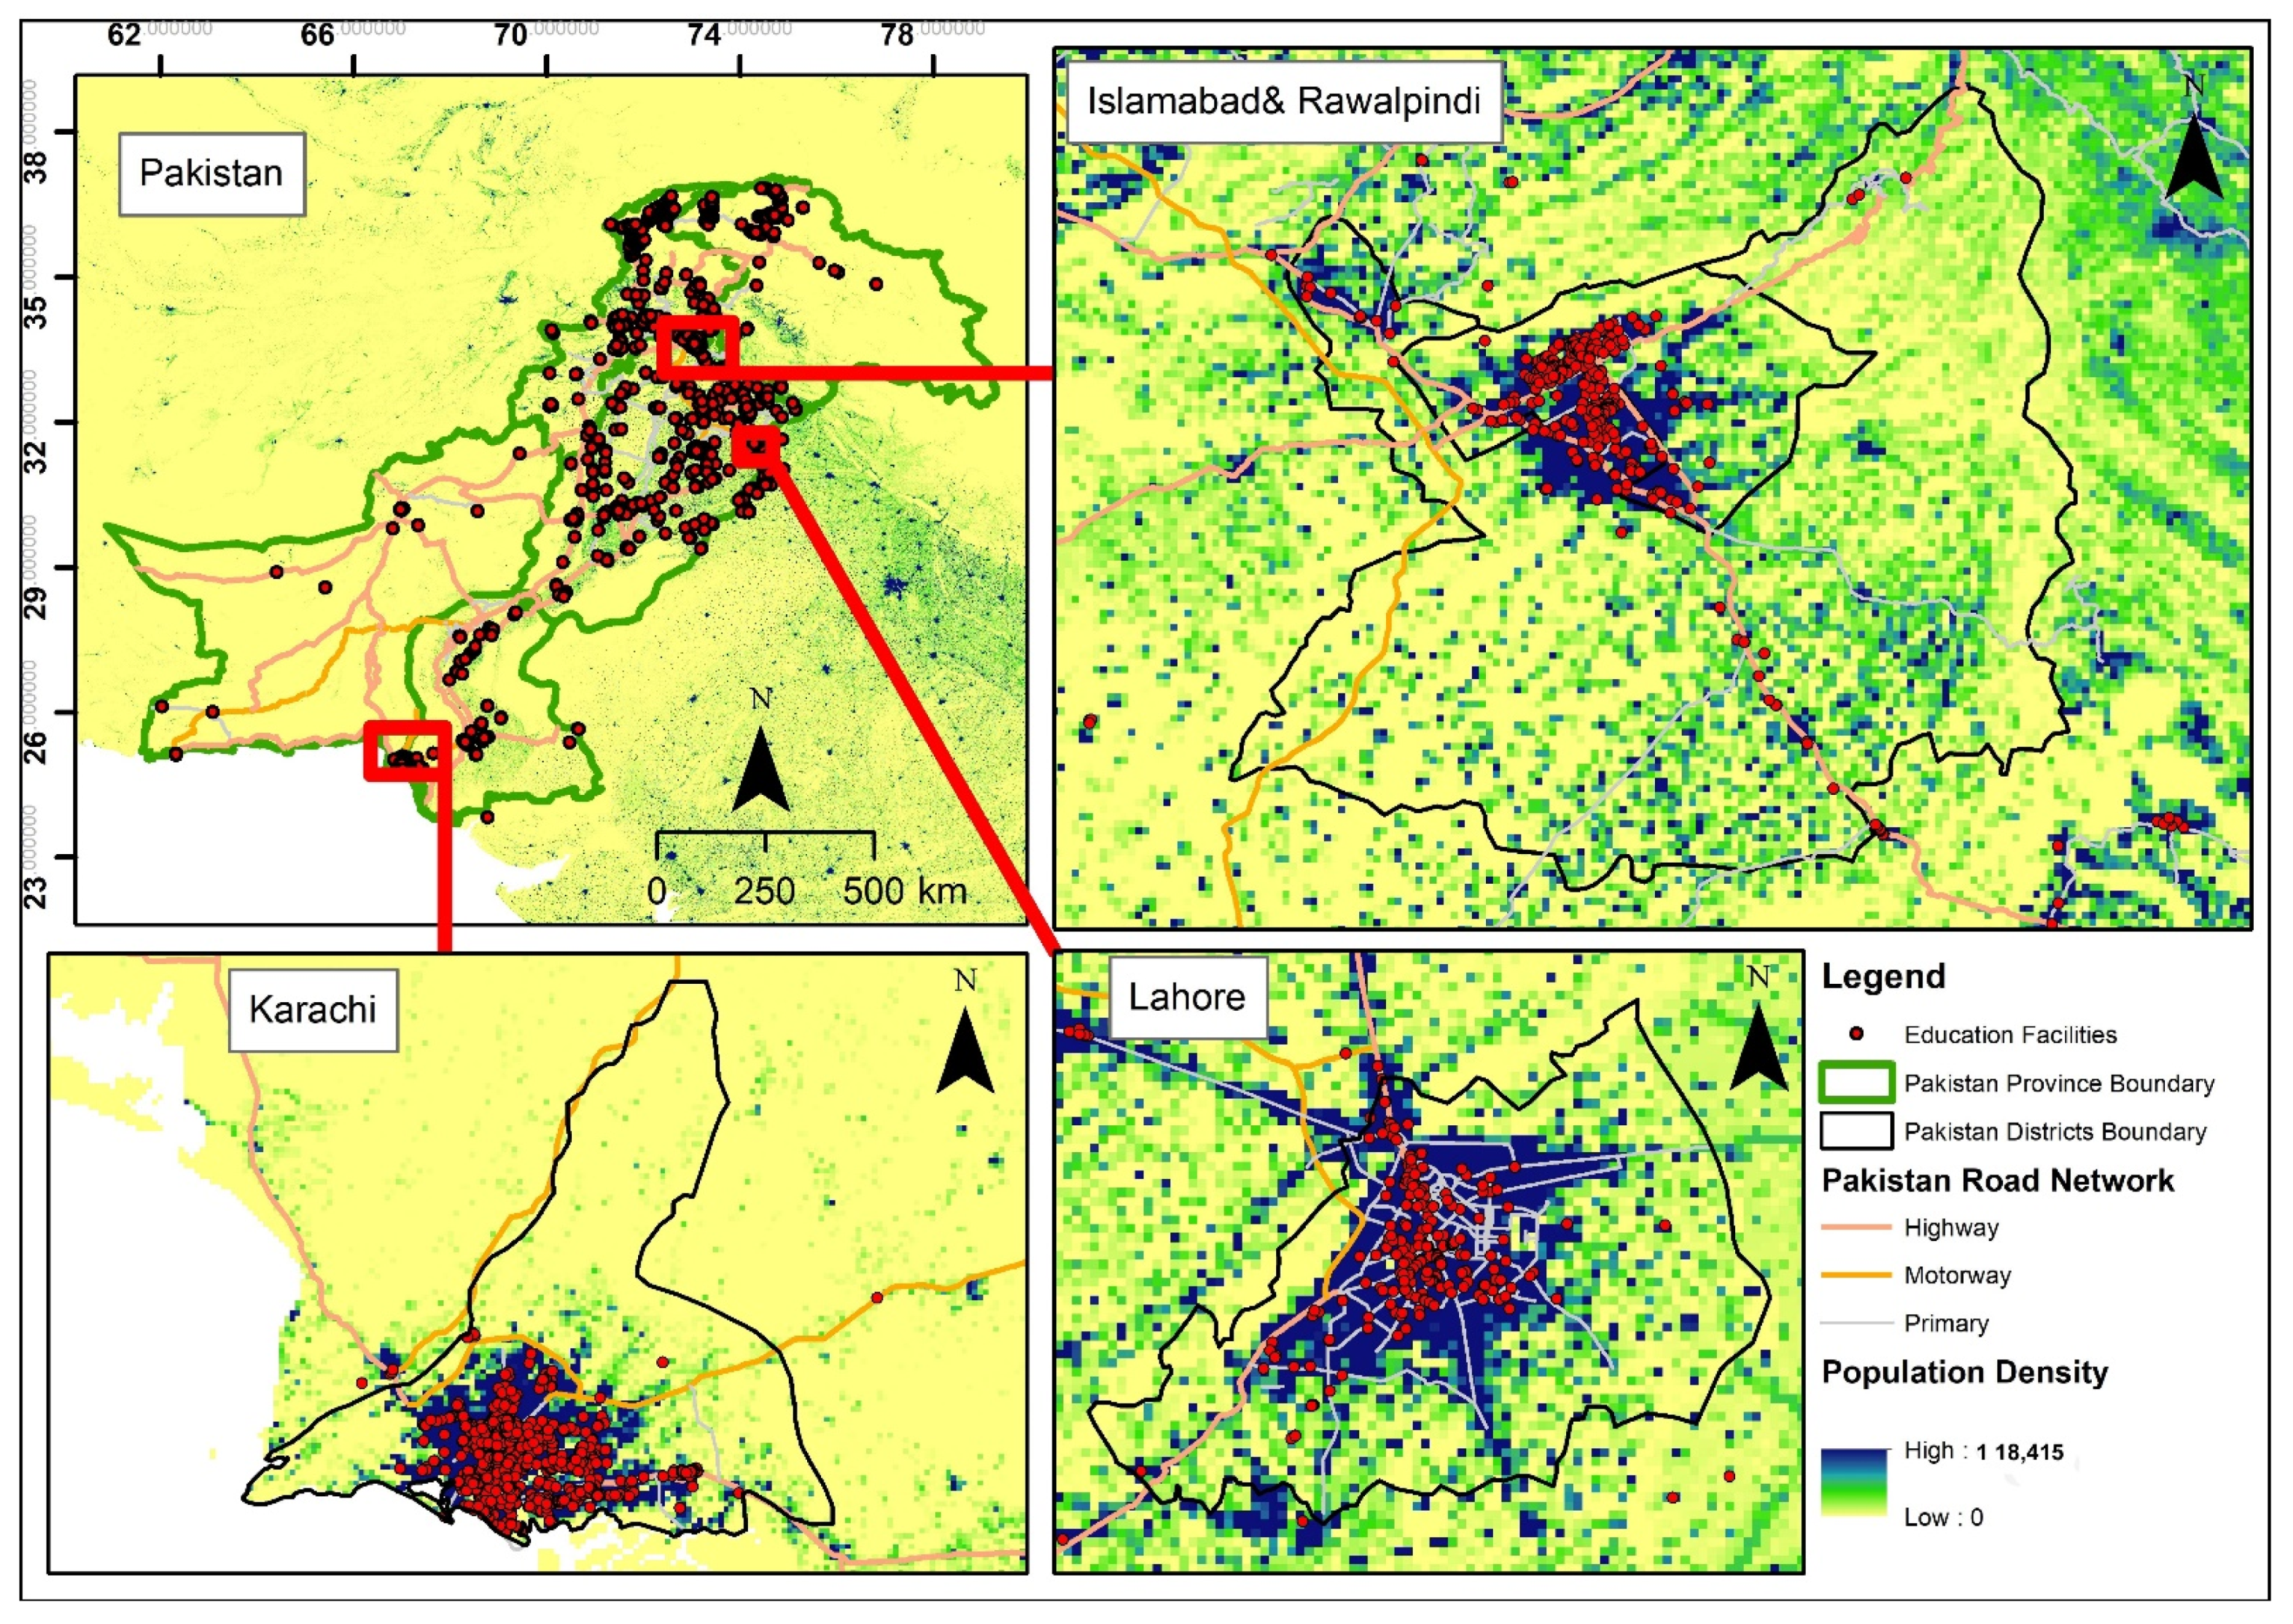
The climate/socio-economic representative maps were produced using GrADS v2.2.0 and ArcGIS v10.8, respectively. These maps were processed to show the spatial differences among cities under study which affected the dengue transmission. The climatic factors (i.e., minimum/maximum temperatures and rainfall) were plotted for averages over four months (i.e., July–October) for the period of 2009–2018.

3. Results

3.1. Minimum Temperature

An increase in the minimum temperature is the main contributing factor for the increased rate of dengue transmission in the study areas. The normalized importance of the minimum temperature in dengue transmission is shown in Table 1, Table 2, Table 3 and Table 4. The results show that within the minimum temperature range of 25.5–28 °C, more dengue cases are reported in all study areas, as shown in Figure 2. As the minimum temperature increases, more dengue cases are reported, especially in Rawalpindi, Lahore, and Karachi.

3.2. Maximum Temperature

The normalized importance of the maximum temperature in dengue transmission is shown in Table 1, Table 2, Table 3 and Table 4. The results show that within the maximum temperature range of 32–34 °C ( ± 0.5 °C), more dengue cases are reported in all study areas, as shown in Figure 3. As the maximum temperature increases or fall below the range, fewer dengue cases are reported. Hence, this maximum temperature range creates the most favorable conditions for dengue transmission during the studied months in all study areas.

3.3. Rainfall

According to Table 1, Table 2, Table 3 and Table 4, rainfall has the highest normalized importance for dengue transmission in Islamabad, Rawalpindi, and Lahore, whereas it has comparatively less normalized importance for Karachi. The highest number of dengue cases were reported during the summer monsoon months of July, August, and September and the post monsoon month of October. As the total monthly rainfall increases, the dengue incidence also increases in all study areas, as shown in Figure 4. Wet environments created favorable conditions for dengue transmission.

3.4. Human Population Density

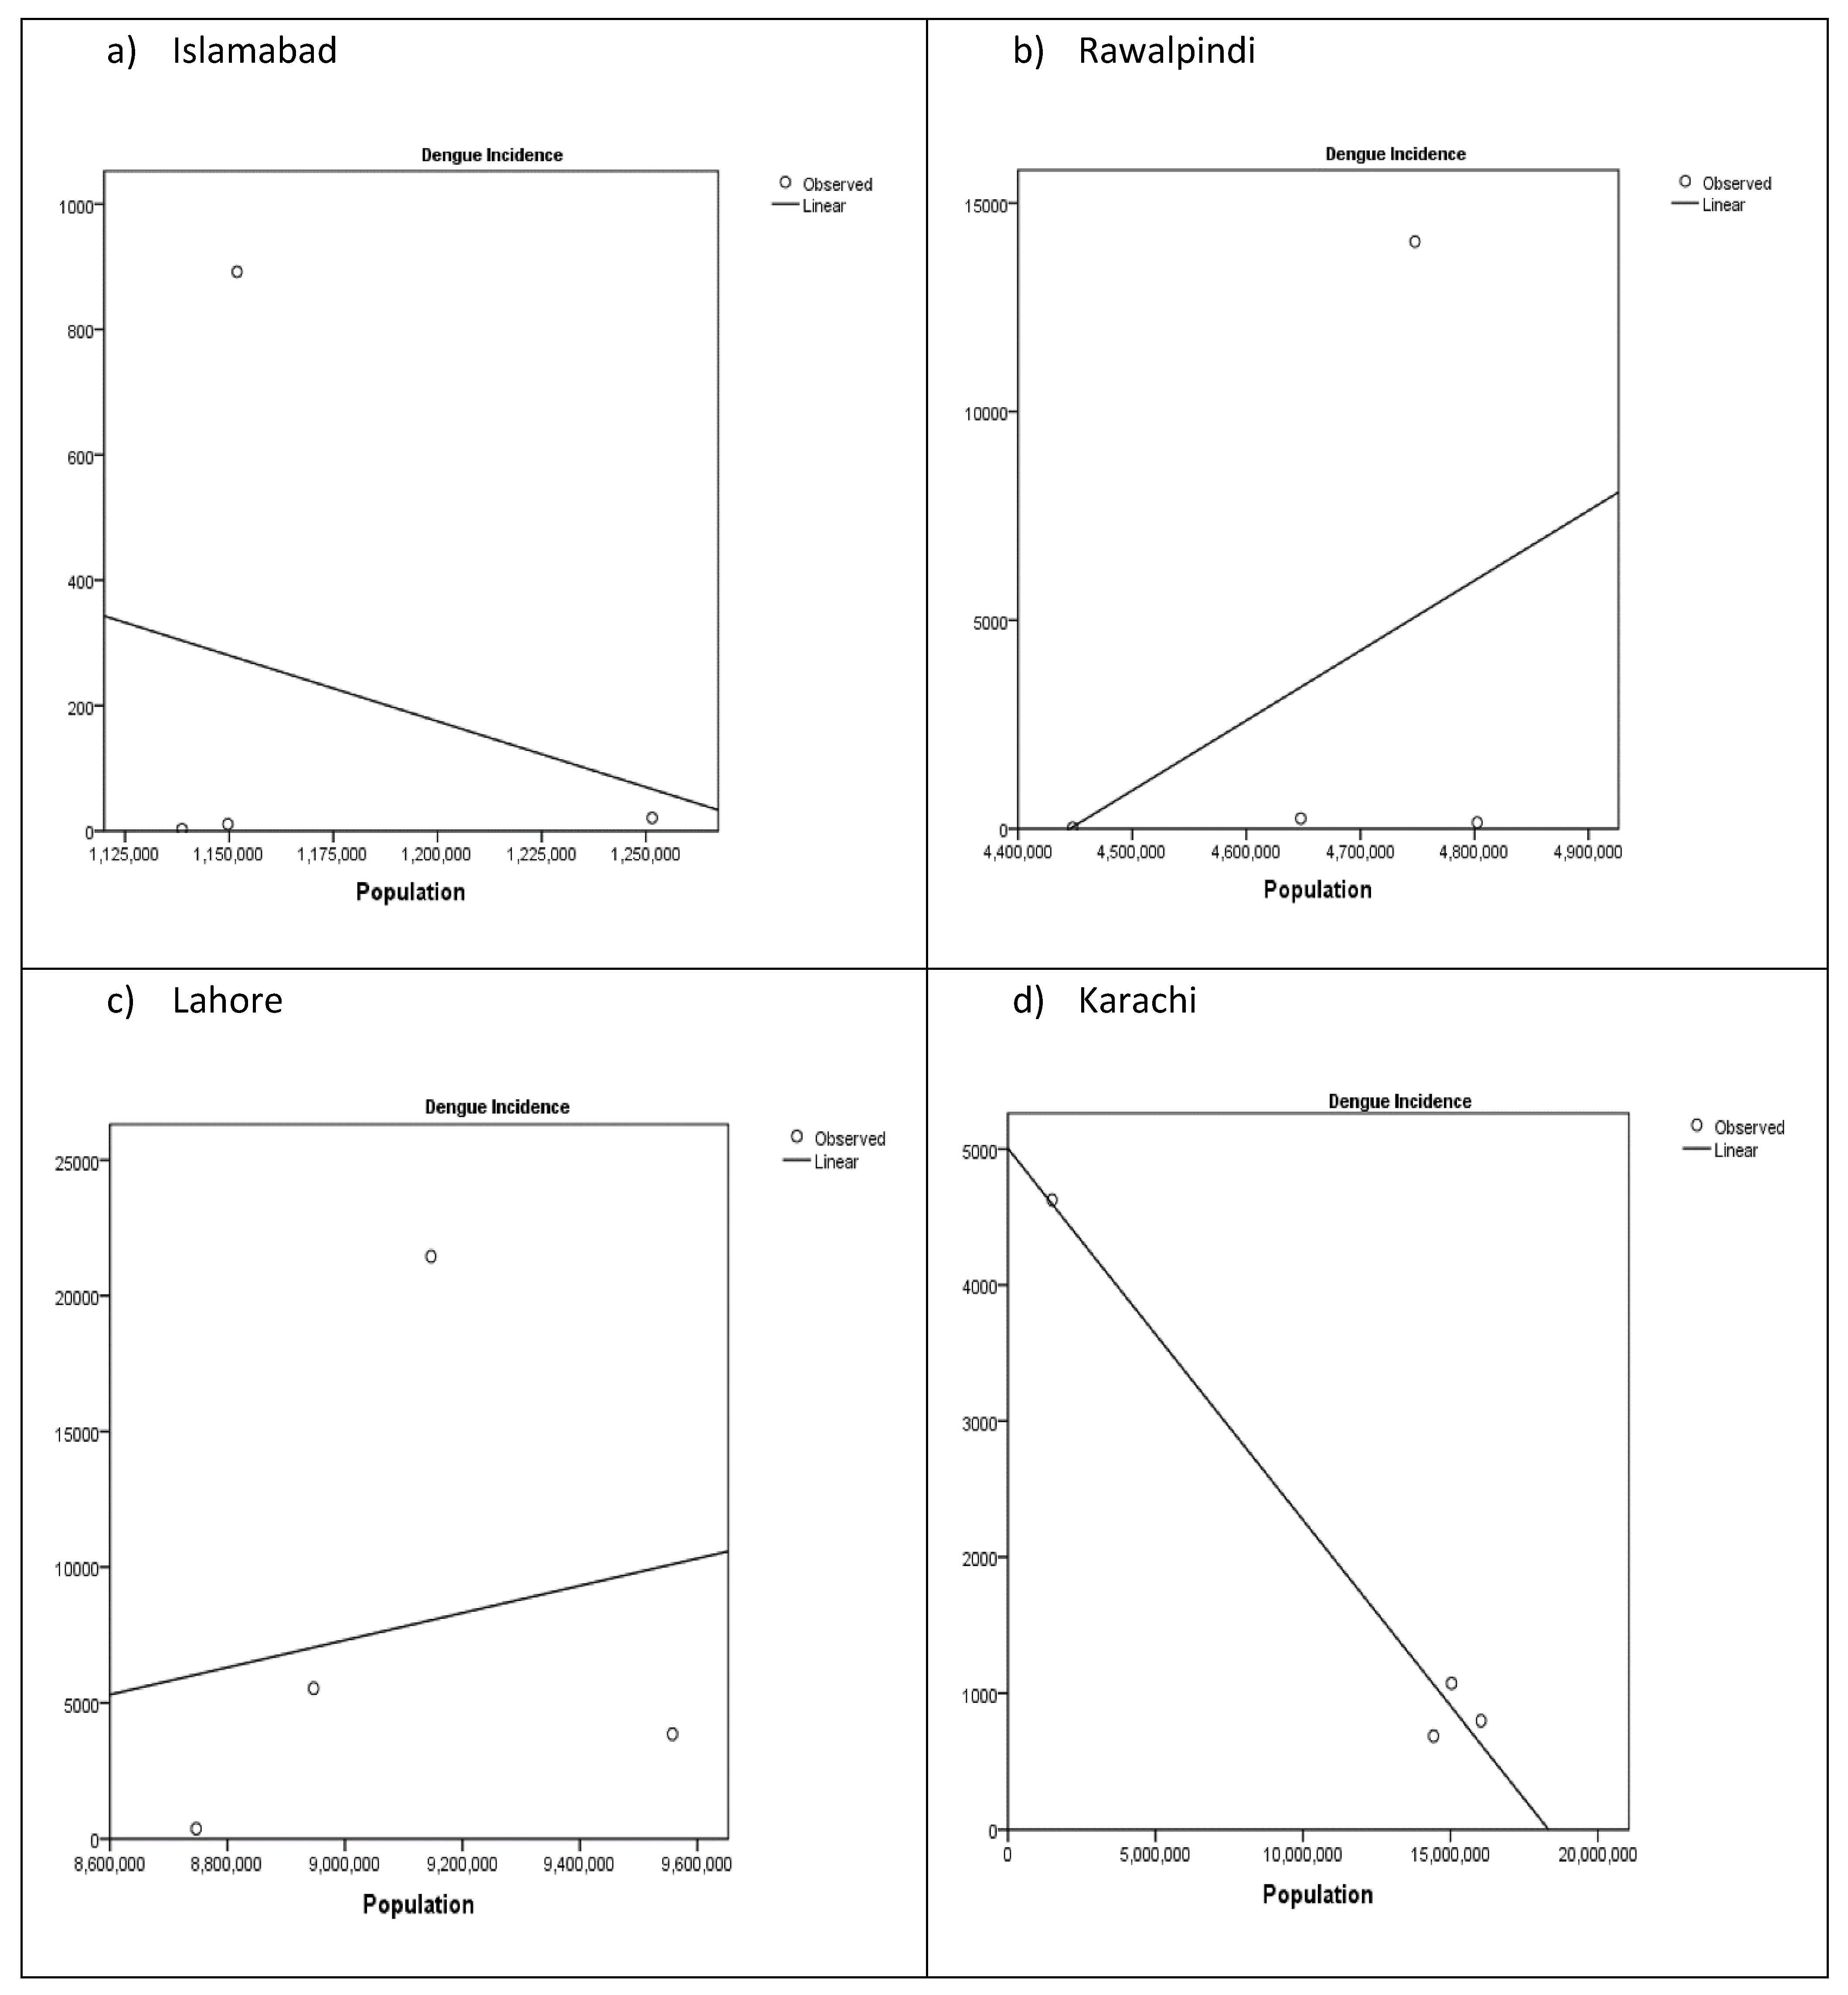
Rapid increase in the size of human population during the past decade is also one of the major contributing factors for the rapid increase in dengue transmission in all the four cities under study. An increase in the dengue incidence with an increase in human population density is shown in Figure 5. The results of the normalized importance indicate the contribution percentage of human population increase in dengue transmission, as shown in Table 1, Table 2, Table 3 and Table 4. The magnitude of the relationship of all studied climate and societal factors by NN is shown in Figure 6, Figure 7, Figure 8 and Figure 9.

3.5. Traveling toward Study Region

Another societal factor contributing to dengue transmission is traveling toward the cities under study from other cities. Traveling to the cities is of high normalized importance for Islamabad and Karachi, whereas traveling has comparatively less normalized importance for Rawalpindi and Lahore, as shown in Table 1, Table 2, Table 3 and Table 4.

3.6. Random Effect Calculated by GLMM

The results of the GLMM show that all the factors under study have significant random effects on dengue transmission. These factors significantly contribute to the disease transmission in Islamabad, Rawalpindi, and Lahore, whereas there may be other hidden factors that may be contributing to the dengue transmission in Karachi, which require further investigation.

3.7. Spatial Characteristics of Study Regions

The averaged maximum temperature in Lahore is highest as compared to Islamabad, Rawalpindi, and Karachi during 2009–2018. The averaged minimum temperature remained higher in Lahore and Karachi as compared to Islamabad and Rawalpindi during 2009–2018. Islamabad and Rawalpindi received highest amount of rainfall among all study regions, Lahore received rainfall lower than twin cities whereas the Karachi received comparatively least amount of rainfall during 2009–2018 period (Figure 10a–c). The Figure 11 shows the educational facilities in the study regions, highway network connecting them with each other, and human population density.

4. Discussion

In this study, the degree of dependence of dengue transmission on different societal and climate factors has been shown by the regression model, the GLMM, and the NN.
A positive relationship was observed between the minimum temperature and dengue transmission in all study areas (Figure 2). The p < 0.05 for minimum temperature for all cities, indicating that the minimum temperature is significantly responsible for the dengue transmission. The value of R2 is 0.069 for Islamabad, 0.057 for Rawalpindi, 0.120 for Lahore, and 0.205 for Karachi, showing the dependence of dengue on the minimum temperature. A positive association was observed between the maximum temperature and dengue transmission in all study areas (Figure 3). The p < 0.05 for maximum temperature for all cities, indicating that the maximum temperature is significantly responsible for dengue spread in a given interval. However, fewer cases of dengue have been reported if the maximum temperature exceeds or falls below the specific interval (i.e., 32–34 °C ( ± 0.5 °C)). The value of R2 is 0.059 for Islamabad, 0.056 for Rawalpindi, 0.230 for Lahore, and 0.265 for Karachi, demonstrating the dependence of dengue on the maximum temperature. The increased minimum temperature and above normal rainfall in these areas has caused the dengue transmission. The increase in the minimum temperature increases the infection rate by 60% and shortens the incubation period of the mosquito vector by one-third, resulting in the rapid development of the vector [9]. This trend has also been observed in our study: as the minimum temperature increased, the rapid transmission of dengue occurred in the study areas. The temperature range for the survival of A. aegypti is 28–35 °C, and as the maximum temperature increases, the female mosquito reduces egg production, oviposition patterns and oviposition time [14]. The reduction in the density of the mosquito population has been observed in tropical areas when temperature reach approximately 35 °C, with an adverse effect on multiple aspects of mosquito biology. Maximum temperatures of 32–34 °C and dry spells of 3–4 days have the highest effect on the dengue transmission rate [1,26]. As the temperature increases above 34 °C, the mosquito population declines and the transmission rate is minimized. Similarly, the rate of transmission decreases as the temperature falls below the above-mentioned threshold temperature.
Similarly, a positive relationship was observed between rainfall and dengue transmission in all study areas (Figure 4). The p < 0.05 for rainfall for all cities, indicating that rainfall is significantly responsible for the dengue transmission. The value of R2 is 0.043 for Islamabad, 0.012 for Rawalpindi, 0.016 for Lahore, and 0.059 for Karachi, showing the dependence of dengue transmission on rainfall. The consecutive flooding in 2009–2010 in Pakistan due to summer monsoon rainfall affected the majority of the country, could be responsible for the transmission of dengue fever. After these floods, increased dengue cases were reported from all over Pakistan, particularly in the study areas. The southern part of the country has not frequently been subject to floods in the past; however, the intense flood of 2010 hit most of the country, including Sind Province and Karachi, because of the heavy summer monsoon rainfall and snowmelt flows from the glaciers. During 2011, the monsoon track deviated from the upper and central parts of the country towards the southwest and caused the worst floods, which led to the spread of dengue in Lahore and Rawalpindi. Severe rainfall with abnormal trends during 2011 compared to previous years was observed in the study areas. Rainfall was recorded to be approximately 18% below normal in July 2011 all over the country and 72% below normal in Sind province. 72% above normal rainfall was received in the months of August and September all over the country, and 248% above normal rainfall was received in Sind province in 2011. Wet spells from the 9–14 of August and the 29 of August to the 16 of September in 2011 brought heavy floods in Sind province and adjacent areas of Karachi. This flood negatively affected the socio-economic activities and human settlements all over Pakistan and caused a mega outbreak of dengue fever in 2011. The flood of 2011 swept away 1,388,331 houses; leaving 539,899 houses destroyed completely. People suffered from shortages of quality food, clean drinking water and other basic needs. According to [2], the flooding during 2011 also caused the displacement and migration of the population at high levels, especially from Karachi to other cities like Islamabad, Rawalpindi, and Lahore. This might one of the major causes of the high rate of dengue transmission in Islamabad, Rawalpindi, and Lahore during 2011, compared to Karachi.
A positive relationship was observed between the human population density and dengue transmission in all study areas (Figure 5). The p < 0.05 for human population density for all cities, indicating that dense human population is significantly responsible for the dengue transmission in study areas. The value of R2 is 0.063 for Islamabad, 0.141 for Rawalpindi, 0.035 for Lahore, and 0.981 for Karachi, showing the dependence of dengue on human population density in the study areas.
The NN analysis demonstrated the highest normalized importance of rainfall for dengue transmission in Islamabad, Rawalpindi and Lahore, whereas the highest normalized importance of minimum temperature for Karachi (Table 1, Table 2, Table 3 and Table 4). Relatively strong relationships between dengue, human population density, and traveling were observed for Islamabad, the minimum temperature and human population density were significant for Rawalpindi, the maximum temperature and human population density were significant for Lahore, and rainfall and traveling was significant for Karachi, as presented in Figure 6, Figure 7, Figure 8 and Figure 9 and Table 1, Table 2, Table 3 and Table 4.
The normalized importance/probability of all factors under study is shown in Table 1, Table 2, Table 3 and Table 4. Each parameter has contributed to the dengue transmission. Traveling to the study areas has also proven to be an important societal factor that is contributing significantly to the dengue transmission, particularly in Islamabad. The magnitude of their dependency is also shown by NN (see Figure 6, Figure 7, Figure 8 and Figure 9).
A GLMM with MCMC algorithm was used to investigate the collective random effects of the spatial–temporal factors during the studied years on dengue transmission in the study regions. Significant results were obtained for the random effects of all studied factors with the p < 0.05 for Islamabad, Rawalpindi, and Lahore. However, insignificant random effects were obtained for Karachi with p > 0.05. This finding shows that there may be other factors contributing to the dengue transmission in Karachi, which needs further investigation.
Rapidly increasing human population is the cause of rapidly increasing urbanization [1]. Increasing population and urbanization have provided the suitable environmental conditions for dengue transmission in the study areas. A large number of travelers visit Islamabad and Rawalpindi from different cities of the Punjab, Sind, and Baluchistan provinces, especially during the summer. These cities provide great excursions, especially in the foothills of the Himalayas—i.e., Murree Hills [34]—and provide access to the northern areas that serve as the most attractive tourist destinations of the country with numerous hill stations, fun activities, adventures, and picnic spots. These adventurous destinations include the Swat valley, Naran, and Mingora, among others. Most recently, after the government provided easy access to these places, the Swat valley has also reported higher number of dengue incidence during 2012–2014 [35]. Most of the educational facilities of the country are concentrated in Islamabad, Lahore, and Karachi which is supported by the developed network of highways/motorways. These educational facilities attract huge number of people for education and job purposes, increasing the human population density in the study regions. Rawalpindi, being adjacent to Islamabad, provides economical residential facilities for the people coming to Islamabad from other cities (Figure 10 and Figure 11).

5. Conclusions

This study shows the normalized importance and relationship of dengue transmission with societal and climate factors from 2009–2018. The societal factors include human population density and traveling to the cities under study, whereas the minimum and maximum temperatures and rainfall are the climate factors considered in this study. The control of dengue disease poses a challenge for its control in several countries around the globe, research of this kind may prove to be helpful in its mitigation through complete understanding of the factors and their contribution in its transmission. While an increase in human population density and dengue transmission have been widely discussed by [1], its definite relationship was unknown. To fill this gap, the relationship between population density and traveling to the cities under study for dengue transmission has been investigated by applying regression model, NN, and GLMM. Traveling to Islamabad has 74.8% normalized importance for dengue transmission, 20.8% for Rawalpindi, 11.8% for Lahore, and 63.2% for Karachi. Increased human population density has also shown high magnitude of its relationship with dengue transmission. Rainfall has the highest normalized importance with highest magnitude of the relationship with dengue transmission in Islamabad, Rawalpindi, and Lahore, whereas the minimum temperature has the highest normalized importance with highest magnitude of relationship with dengue transmission in Karachi. All studied factors show their contribution to the dengue transmission in Islamabad, Rawalpindi, and Lahore, whereas there may be other factors contributing to the disease transmission in Karachi that are still unknown. The ranges of minimum temperature (25.5–28 °C) and maximum temperature (32–34 °C ( ± 0.5 °C)) for the study areas have been determined. Due to spatial characteristics of study regions, huge number of people from other areas have attracted for tourism, education and job purposes supported by the developed infrastructure such as motorways and highways. After the increased number of reported dengue cases and deaths in recent years, the Government of Pakistan has set up surveillance cells, special clinics, dispensaries, and laboratories particularly for dengue diagnosis and cure to facilitate public health and to avoid the misdiagnosis of the disease. These recently established institutions are equipped with technologies and techniques for testing the dengue virus in patient blood samples; however, more work is required.

Author Contributions

B.K. designed the research, performed the analysis, interpreted the results and prepared the manuscript. C.B. and A.G. critically reviewed the manuscript. C.B. provided his expert opinion on regional scenarios, climate, and funding for publication. All authors have read and agreed to the published version of the manuscript.

Funding

This research is jointly funded by CAS-TWAS Centre of Excellence and the National Natural Science Foundation of China (grant no. 41630424).

Institutional Review Board Statement

Not applicable.

Informed Consent Statement

Not applicable.

Data Availability Statement

Not applicable.

Acknowledgments

Authors thank the ICCES, Institute of Atmospheric Physics, Chinese Academy of Sciences, Beijing, 100029, China for its support in conducting this research.

Conflicts of Interest

The authors declare no conflict of interest.

References

  1. Khalid, B.; Ghaffar, A. Dengue transmission based on urban environmental gradients in different cities of Pakistan. Int. J. Biometeor. 2015, 59, 267–283. [Google Scholar] [CrossRef]
  2. Khalid, B.; Ghaffar, A. Environmental risk factors and hotspot analysis of dengue distribution in Pakistan. Int. J. Biometeor. 2015, 59, 1721–1746. [Google Scholar] [CrossRef]
  3. Caley, T.; Malaizé, B.; Zaragosi, S.; Rossignol, L.; Bourget, J.; Martinez, P.; Giraudeau, J.; Charlier, K.; Zimmermann, N. New Arabian Sea records help deciphers orbital timing of Indo-Asian monsoon. Earth Planet. Sci. Lett. 2011, 308, 433–444. [Google Scholar] [CrossRef]
  4. Morin, C.; Comrie, A.C.; Ernst, K. Climate and dengue transmission: Evidence and implications. Environ. Health Perspect. 2013, 121, 1264–1272. [Google Scholar] [CrossRef]
  5. Kureshy, K. Geography of Pakistan; National Book Service Lahore: Lahore, Pakistan, 1988. [Google Scholar]
  6. Luckge, A.; Doose-Rolinski, H.; Khan, A.; Schulz, H.; von Rad, U. Monsoonal variability in the northeastern Arabian Sea during the past 5000-years: Geochemical evidence from laminated sediments. Palaeogeog. Palaeoclim. Palaeoecol. 2001, 167, 273–286. [Google Scholar] [CrossRef]
  7. Ali, S.; Khalid, B.; Kiani, R.S.; Babar, R.; Nasir, S.; Rehman, N.; Adnan, M.; Goheer, M.A. Spatio-temporal variability of summer monsoon onset over Pakistan. Asia-Pac. J. Atmos. Sci. 2020, 56, 147–172. [Google Scholar] [CrossRef] [Green Version]
  8. Goswami, B. Increasing trend of extreme rain events over India in a Warming Environment. Science 2006, 314, 1442–1445. [Google Scholar] [CrossRef] [Green Version]
  9. von Rad, U.; Schaaf, M.; Michels, K.; Schulzc, H.; Bergerd, W.H.; Sirocko, F. A 5000-yr record of climate change in varved sediments from the oxygen minimum zone off Pakistan, Northeastern Arabian Sea. Quat. Res. 1999, 51, 39–53. [Google Scholar] [CrossRef]
  10. Singapore Red Cross Society. Pakistan Floods the Deluge of Disaster-Facts & Figures as of 15 September 2010; Singapore Red Cross Society: Singapore, 2010. [Google Scholar]
  11. Dyurgerov, M.; Meier, M. Glaciers and the Changing Earth System: A 2004 Snapshot; Report of Institute of Arctic and Alpine Research: Boulder, CO, USA, 2005. [Google Scholar]
  12. Ahern, M.; Kovats, R.; Wilkinson, P.; Few, R.; Matthies, F. Global health impacts of floods: Epidemiologic evidence. Epidemiol. Rev. 2005, 27, 36–46. [Google Scholar] [CrossRef] [PubMed] [Green Version]
  13. Nagao, Y.; Thavara, U.; Chitnumsup, P.; Tawatsin, A.; Chansang, C.; Campbell-Lendrum, D. Climatic and social risk factors for Aedes infestation in rural Thailand. Trop. Med. Int. Health 2003, 8, 650–659. [Google Scholar] [CrossRef] [PubMed] [Green Version]
  14. WHO. Flooding and Communicable Diseases Fact Sheet: Risk Assessment and Preventive Measures; The World Health Organization: Geneva, Switzerland, 2006. [Google Scholar]
  15. Qaiser, G. Climate of Pakistan; National Drought Monitoring Center, Pakistan Meteorological Department: Islamabad, Pakistan, 2011.
  16. Zhang, Y.; Bi, P.; Hiller, J.E. Climate change and the transmission of vector-borne diseases: A review. Asia Pac. J. Public Health 2008, 20, 64–76. [Google Scholar] [CrossRef] [PubMed]
  17. Chowell, G.; Duen, D.J.C.; Miller, A.; Velazco, A.J.M.; Hyman, P.W.; Fenimore, C. Estimation of the reproduction number of dengue fever from spatial epidemic data. Math. Biosci. 2007, 208, 571–589. [Google Scholar] [CrossRef]
  18. Yu, H.; Yang, S.; Yen, H.; Christakos, G. A spatio-temporal climate-based model of early dengue fever warning in southern Taiwan. Stoch. Environ. Res. Risk Assess. 2011, 25, 485–494. [Google Scholar] [CrossRef]
  19. Pinto, E.; Coelho, M.; Oliver, L.; Massad, E. The influence of climate variables on dengue in Singapore. Int. J. Environ. Health Res. 2011, 21, 415–426. [Google Scholar] [CrossRef]
  20. Favier, C.; Degallier, N.; Dubois, M. Dengue epidemic modeling: Stakes and pitfalls. Asia Pac. 2005, 22, 1191–1194. [Google Scholar]
  21. Wu, P.; Lay, J.; Guo, H.; Lung, S.; Su, H. Higher temperature and urbanization affect the spatial patterns of dengue fever transmission in subtropical Taiwan. Sci. Total Environ. 2009, 407, 2224–2233. [Google Scholar] [CrossRef] [PubMed]
  22. Schwartz, E.; Weld, L.; Smith, W.A. Seasonality, annual trends, and characteristics of dengue among ill returned travelers, 1997–2006. Emerg. Infect. Dis. 2008, 14, 1081–1088. [Google Scholar] [CrossRef] [Green Version]
  23. Berrington, W.R.; Hitti, J.; Casper, C. A case report of dengue virus infection and acalculous cholecystitis in a pregnant returning traveler. Trav. Med. Infect. 2007, 5, 251–253. [Google Scholar] [CrossRef] [Green Version]
  24. Karch, S.; Dellile, M.-F.; Guillet, P.; Mouchet, J. African Malaria vectors in European aircraft. Lancet 2001, 357, 235. [Google Scholar] [CrossRef]
  25. Kritsiriwuthinan, K.; Ngrenngarmlert, W. Asymptomatic Malaria infections among foreign migrant workers in Thailand. Asian Pac. J. Trop. Med. 2011, 1, 560–563. [Google Scholar] [CrossRef] [Green Version]
  26. Alaya-Bouafif, N.B.; Chahed, M.K.; Bez, H.; Bellali, H.; Ayari, L.; Achour, N. Completeness of Malaria notification in Tunisia assessed by capture recapture method. Asian Pac. J. Trop. Dis. 2011, 1, 187–191. [Google Scholar] [CrossRef]
  27. Thaver, A.; Sobanim, A.; Qazib, F.; Khan, M.; Zafar, A.; Beg, M.A. Assessing the need for training: General practitioners’ knowledge, attitude and practice concerning dengue and Malaria in Karachi, Pakistan. Int. Health 2011, 3, 126–130. [Google Scholar] [CrossRef]
  28. Huguet, J.; Punpuing, S. International Migration in Thailand; International Organization for Migration: Bangkok, Thailand, 2005. [Google Scholar]
  29. Lowe, R.; Bailey, T.; Stephenson, D.; Graham, R.; Coelho, C.; Carvelho, M.; Barcello, C. Spatio-temporal modelling of climate-sensitive disease risk: Towards an early warning system for dengue in Brazil. Comput. Geosci. 2011, 3, 371–381. [Google Scholar] [CrossRef] [Green Version]
  30. Browne, W.; Draper, D. A comparison of Bayesian and likelihood-based methods for fitting multilevel models. Bayesian Anal. 2006, 1, 473–514. [Google Scholar] [CrossRef]
  31. Zhao, Y.; Staudenmayer, J.; Coull, B.; Wand, M. General design Bayesian generalized linear mixed models. Stat. Sci. 2006, 21, 35–51. [Google Scholar] [CrossRef] [Green Version]
  32. Alabi, M.A.; Issa, S.; Afolayan, R.B. An application of artificial intelligent neural network and discriminant analyses on credit scoring. Math Theory Model 2013, 3, 20–28. [Google Scholar]
  33. Rajalakshmi, P. Mode choice modelling based on work trips–artificial neural network model. Int. J. Innov. Res. Sci. Eng. Technol. 2013, 2, 360–369. [Google Scholar]
  34. Kausar, R.; Mirza, S.; Saboor, A.; Saleem, A.; Khalid, B. Role of ecotourism in promoting and sustaining conservation of nature: A case study of Murree forest recreational resort. Pak. J. Agric. Sci. 2013, 50, 463–468. [Google Scholar]
  35. Khan, J.; Khan, A. Incidence of dengue in 2013: Dengue outbreak in district Swat, Khyber Pakhtunkhwa, Pakistan. Int. J. Fauna Biol. Stud. 2015, 2, 1–7. [Google Scholar]
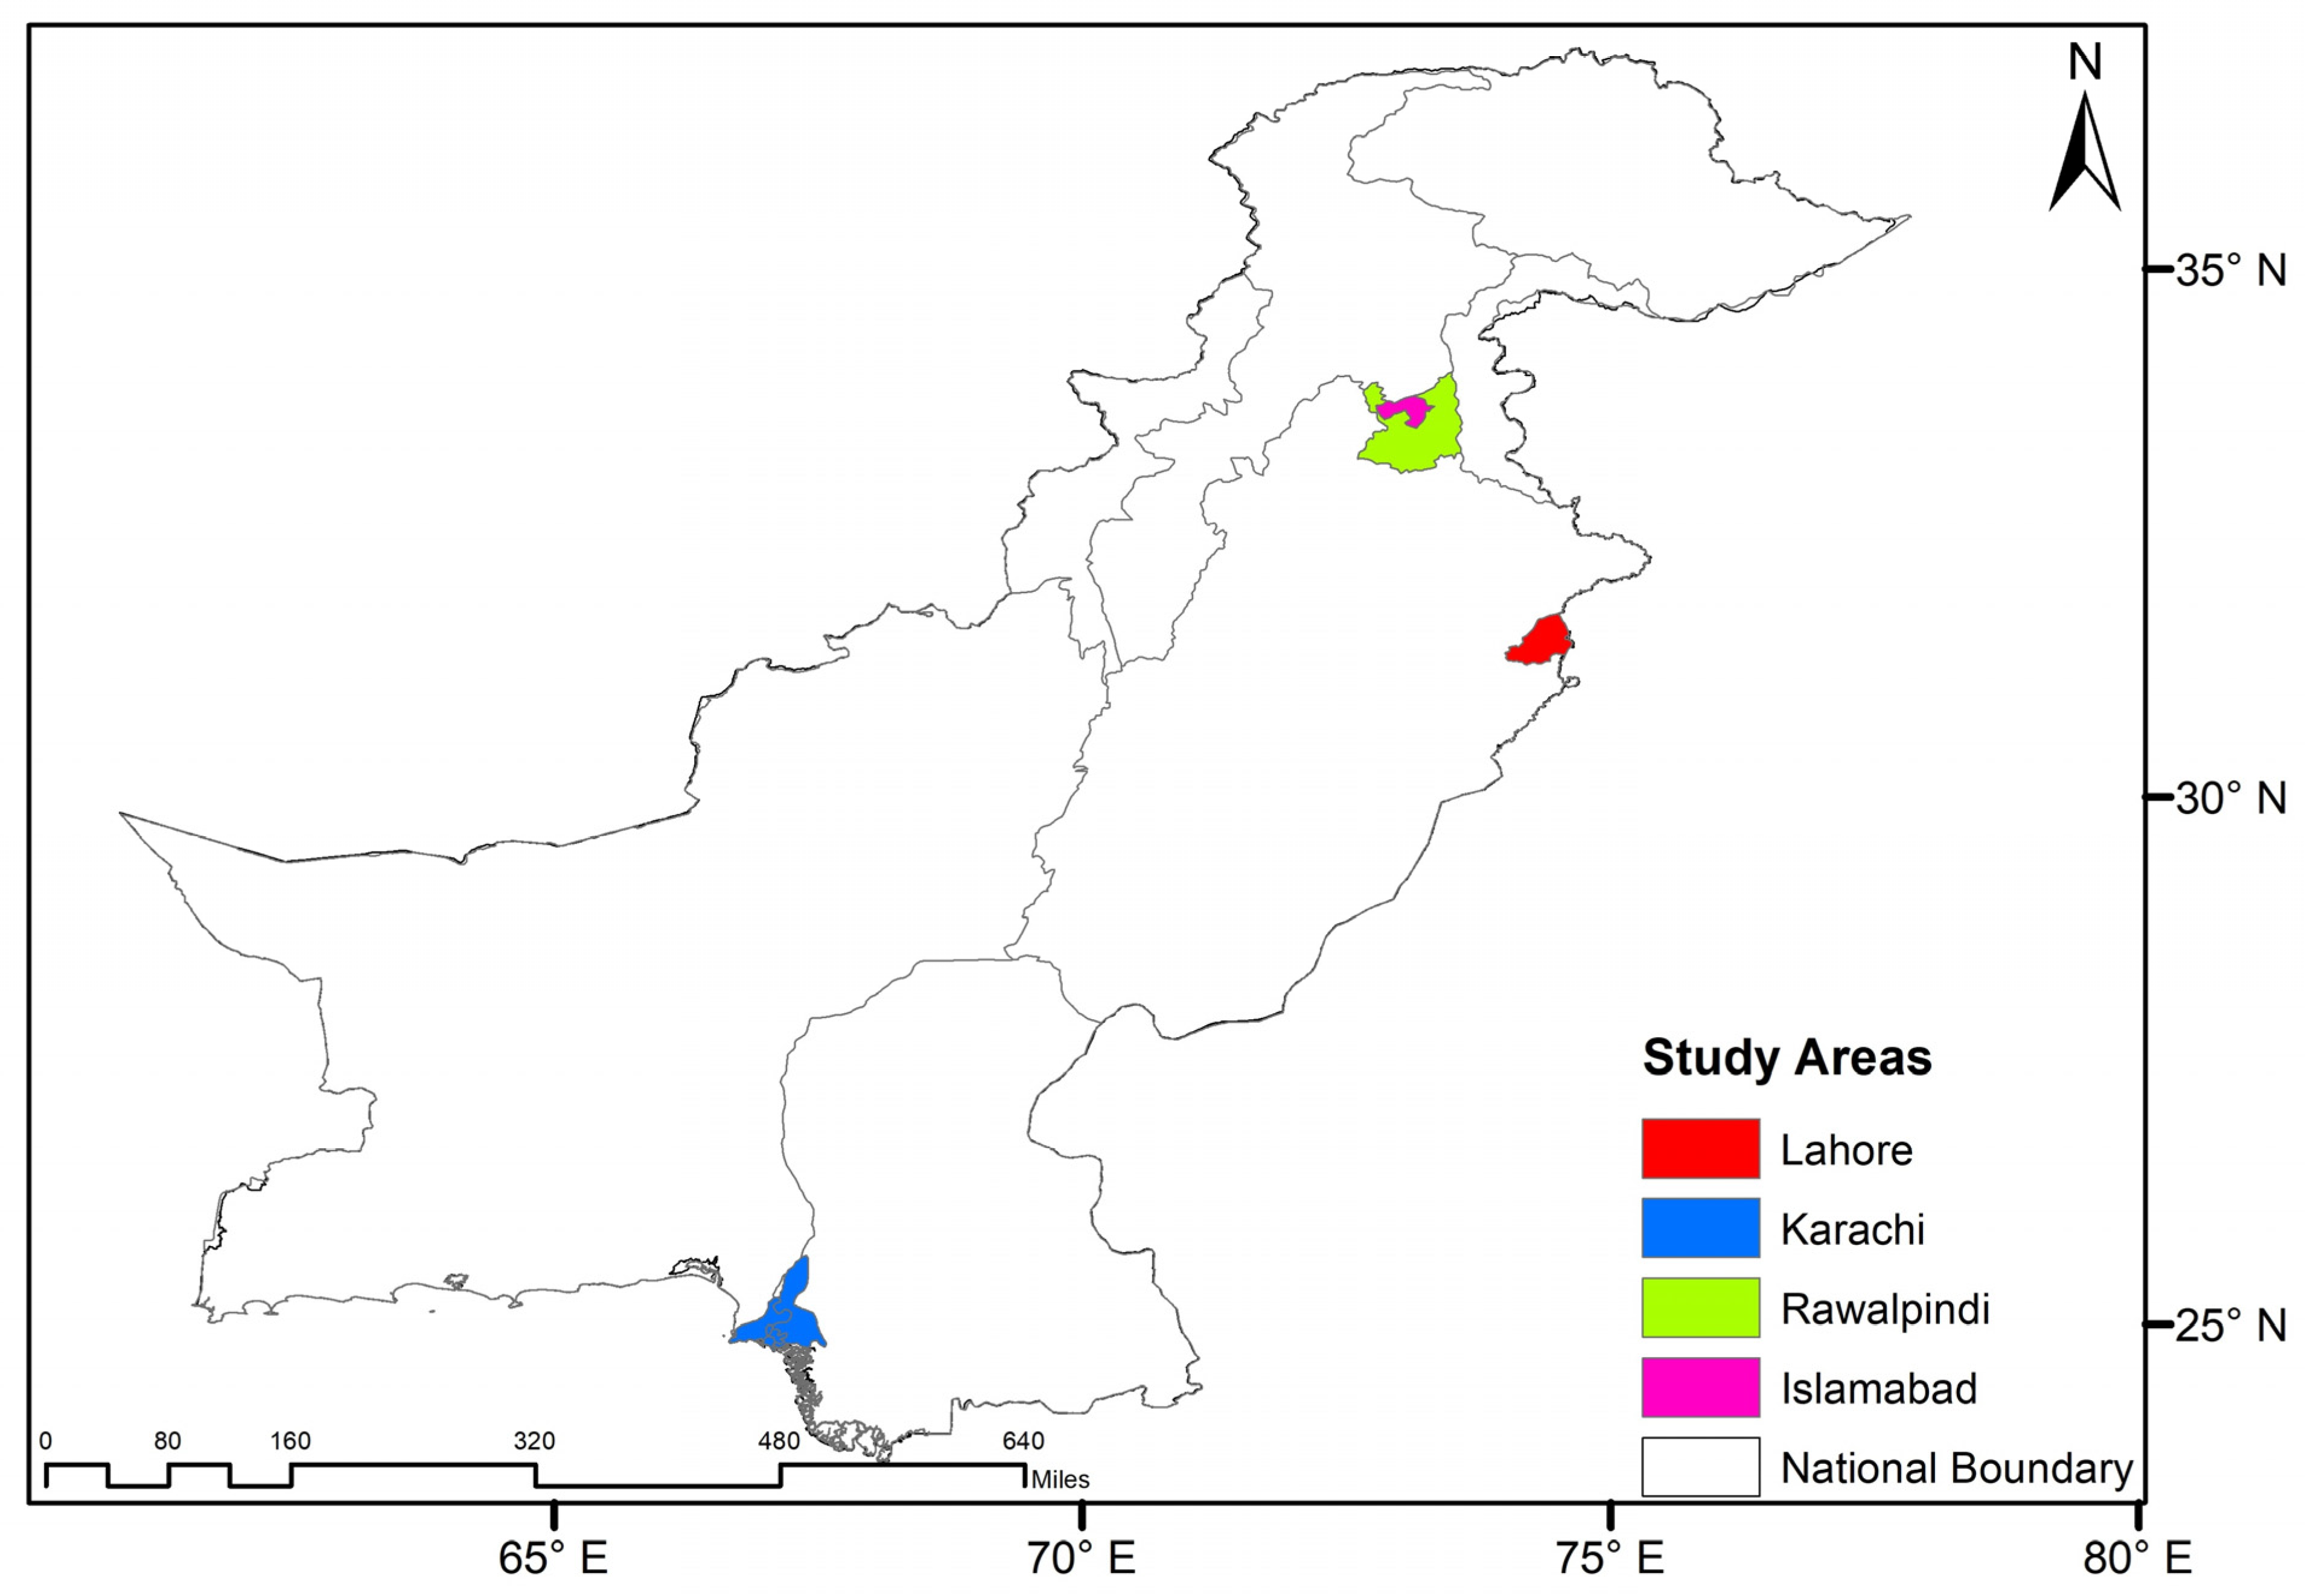
Figure 1. Study areas—i.e., Islamabad, Rawalpindi, Lahore, and Karachi—are shown with respect to their location on the map of Pakistan.
Atmosphere 12 00773 g001
Figure 2. Curve estimation regression for dengue fever cases and the minimum temperature (°C) in the study area.
Atmosphere 12 00773 g002
Figure 3. Curve estimation regression for dengue fever cases and the maximum temperature (°C) in the study area.
Atmosphere 12 00773 g003
Figure 4. Curve estimation regression for dengue fever cases and rainfall (mm) in the study area.
Atmosphere 12 00773 g004
Figure 5. Curve estimation regression for dengue fever cases and human population density in the study area.
Atmosphere 12 00773 g005
Figure 6. Neural network showing the relationship between social/climate covariates and dengue incidence in Islamabad.
Atmosphere 12 00773 g006
Figure 7. Neural network showing the relationship between social/climate covariates and dengue incidence in Rawalpindi.
Atmosphere 12 00773 g007
Figure 8. Neural network showing the relationship between social/climate covariates and dengue incidence in Lahore.
Atmosphere 12 00773 g008
Figure 9. Neural network showing the relationship between social/climate covariates and dengue incidence in Karachi.
Atmosphere 12 00773 g009
Figure 10. Averaged climate over Pakistan during July–October for 2009–2018 period (a) maximum temperature, (b) minimum temperature, (c) precipitation.
Atmosphere 12 00773 g010
Figure 11. Map showing the spatial characteristics of studied cities such as educational facilities, highways connecting studied cities, and human population density as societal factors, attracting people from other cities to the study region.
Atmosphere 12 00773 g011
Table 1. Normalized importance of independent variables/factors for the dengue transmission in Islamabad.
FactorsImportanceNormalized Importance
Population0.21067.8%
TravtoIsb0.24074.8%
MinTemp0.15249.2%
Rainfall0.309100.0%
MaxTemp0.09731.5%
Table 2. Normalized importance of independent variables/factors for the dengue transmission in Rawalpindi.
FactorsImportanceNormalized Importance
Population0.13735.1%
MinTemp0.36693.8%
Rainfall0.391100.0%
Maxtemp0.0216.7%
TravtoRwp0.08020.4%
Table 3. Normalized importance of independent variables/factors for the dengue transmission in Lahore.
FactorsImportanceNormalized Importance
Population0.14420.2%
MinTemp0.10324.7%
Rainfall0.582100.0%
TravtoLhr0.06911.8%
MaxTemp0.10914.1%
Table 4. Normalized importance of independent variables/factors for the dengue transmission in Karachi.
FactorsImportanceNormalized Importance
Population0.14042.2%
MinTemp0.332100.0%
Rainfall0.16148.5%
TravtoKhi0.21063.2%
MaxTemp0.15646.9%
Publisher’s Note: MDPI stays neutral with regard to jurisdictional claims in published maps and institutional affiliations.