
Future Projection of Precipitation Changes in the Júcar and Segura River Basins (Iberian Peninsula) by CMIP5 GCMs Local Downscaling


Abstract
:1. Introduction
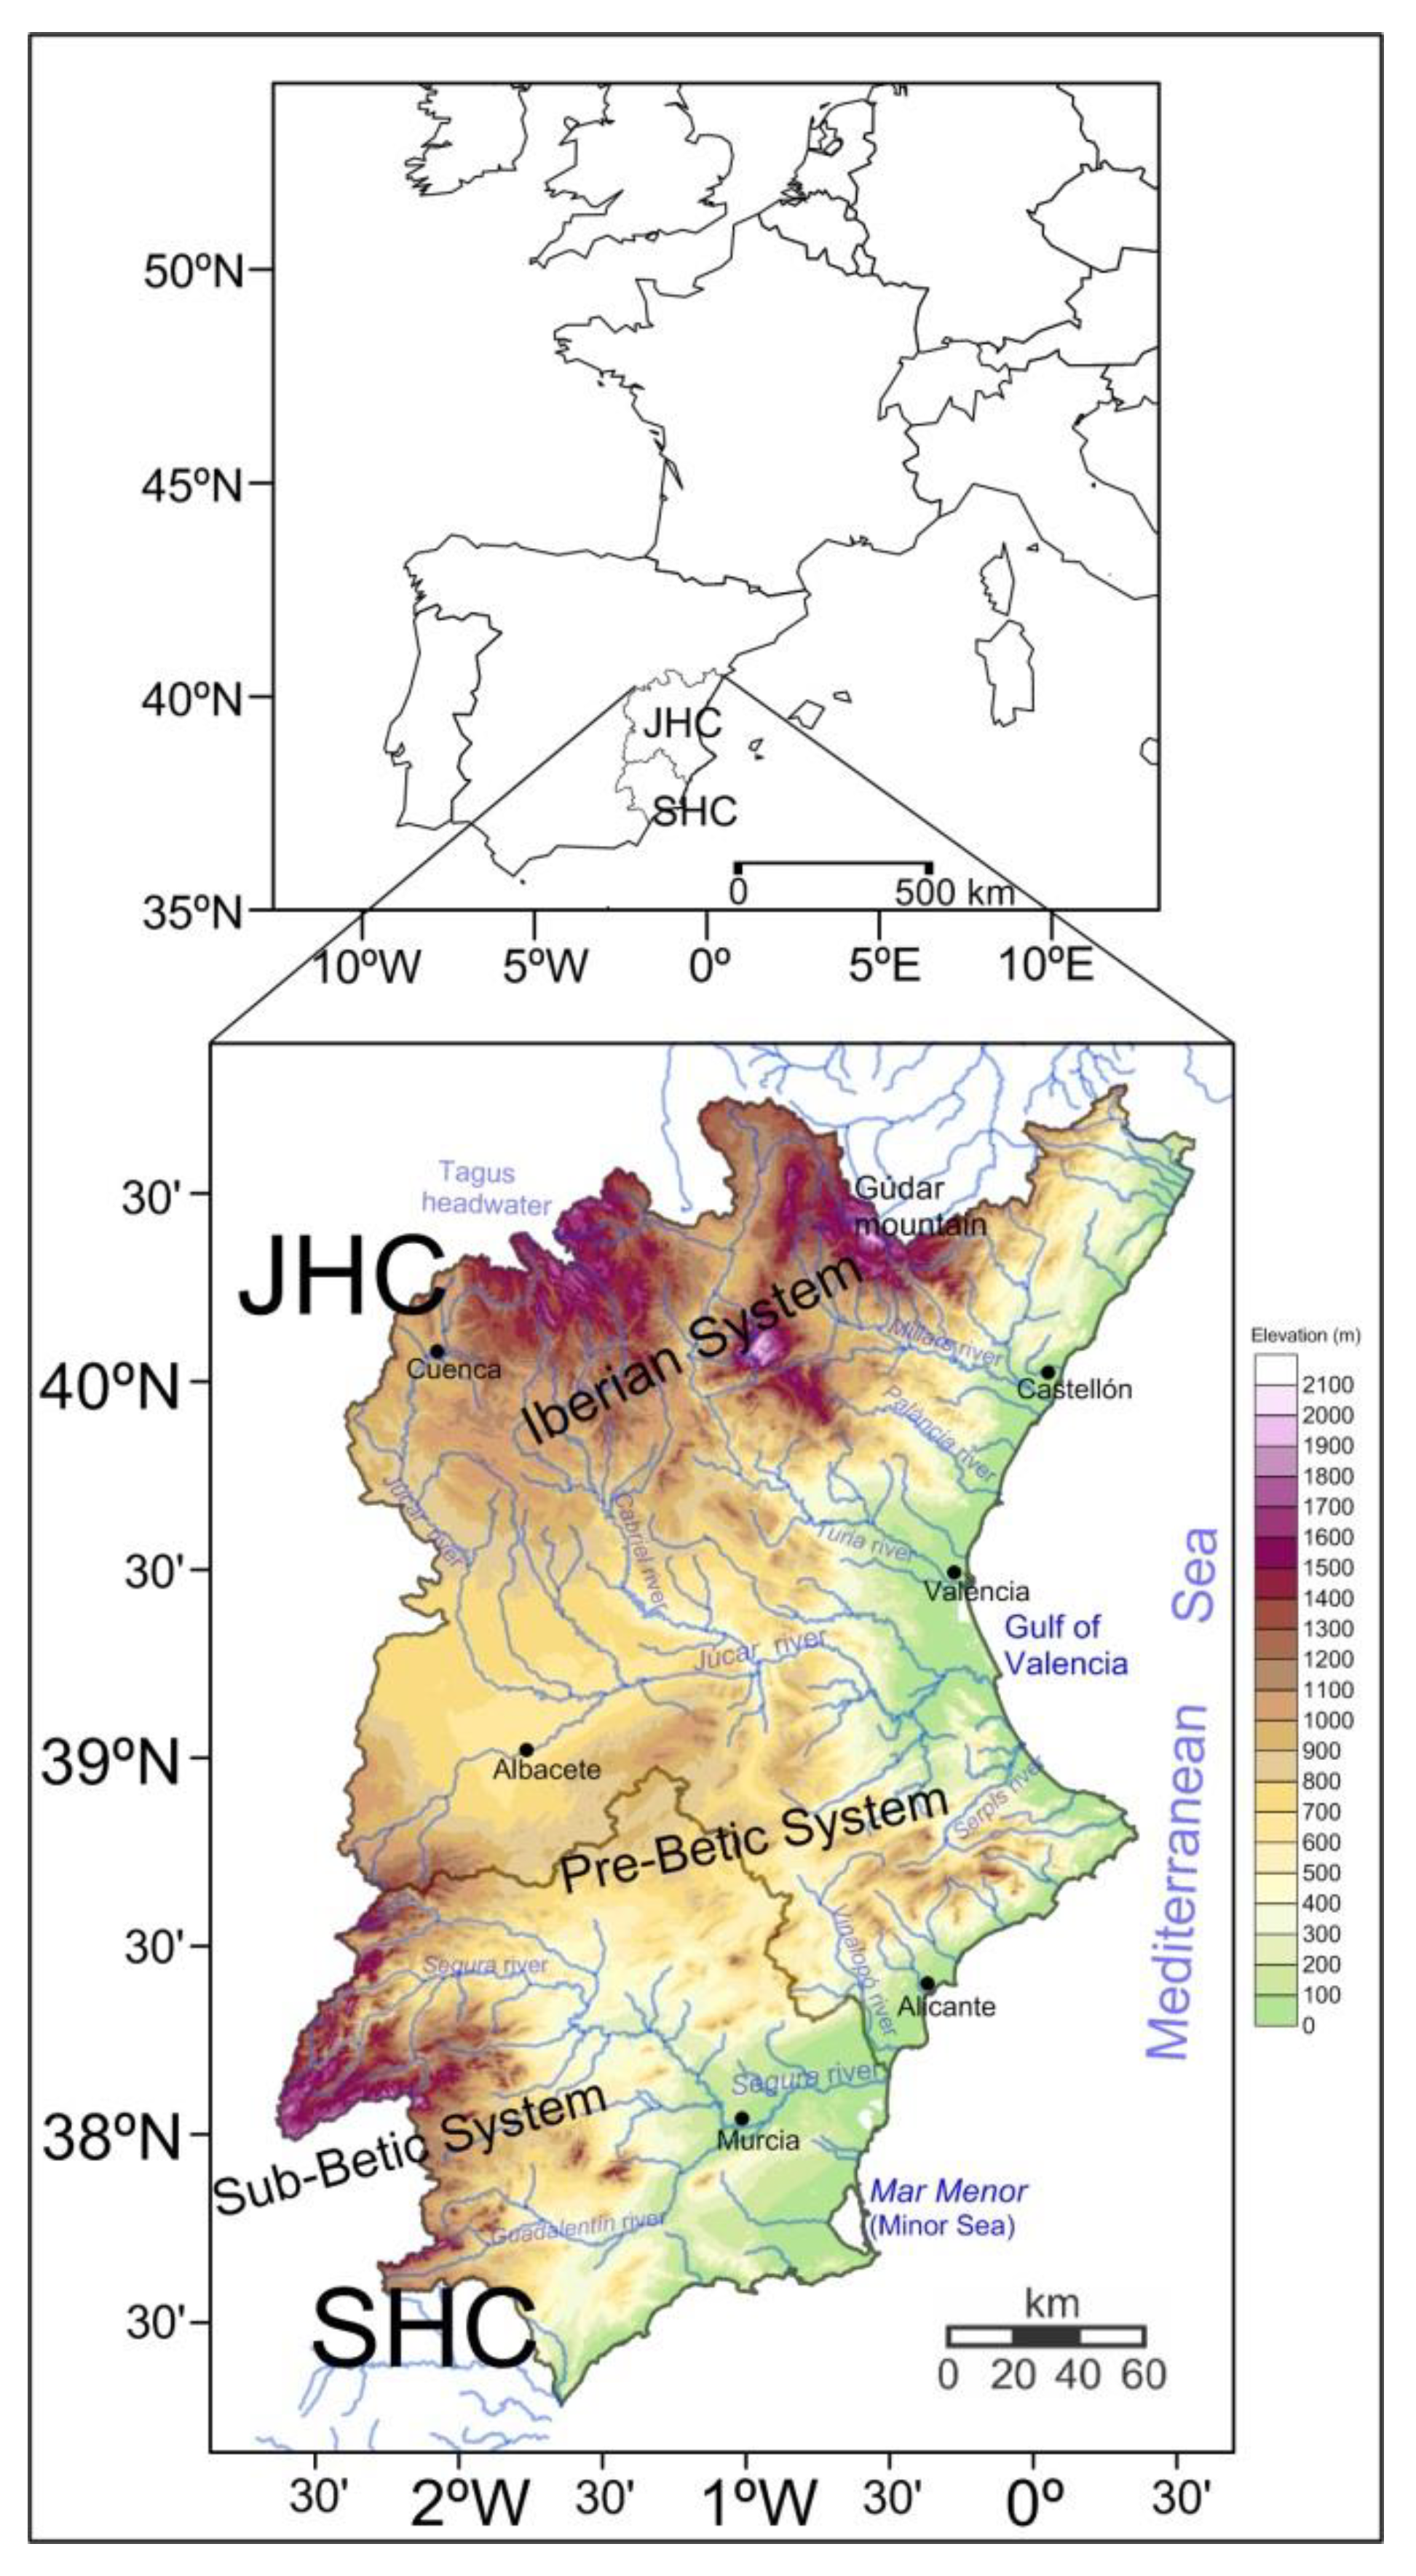
Study Site
2. Materials and Methods
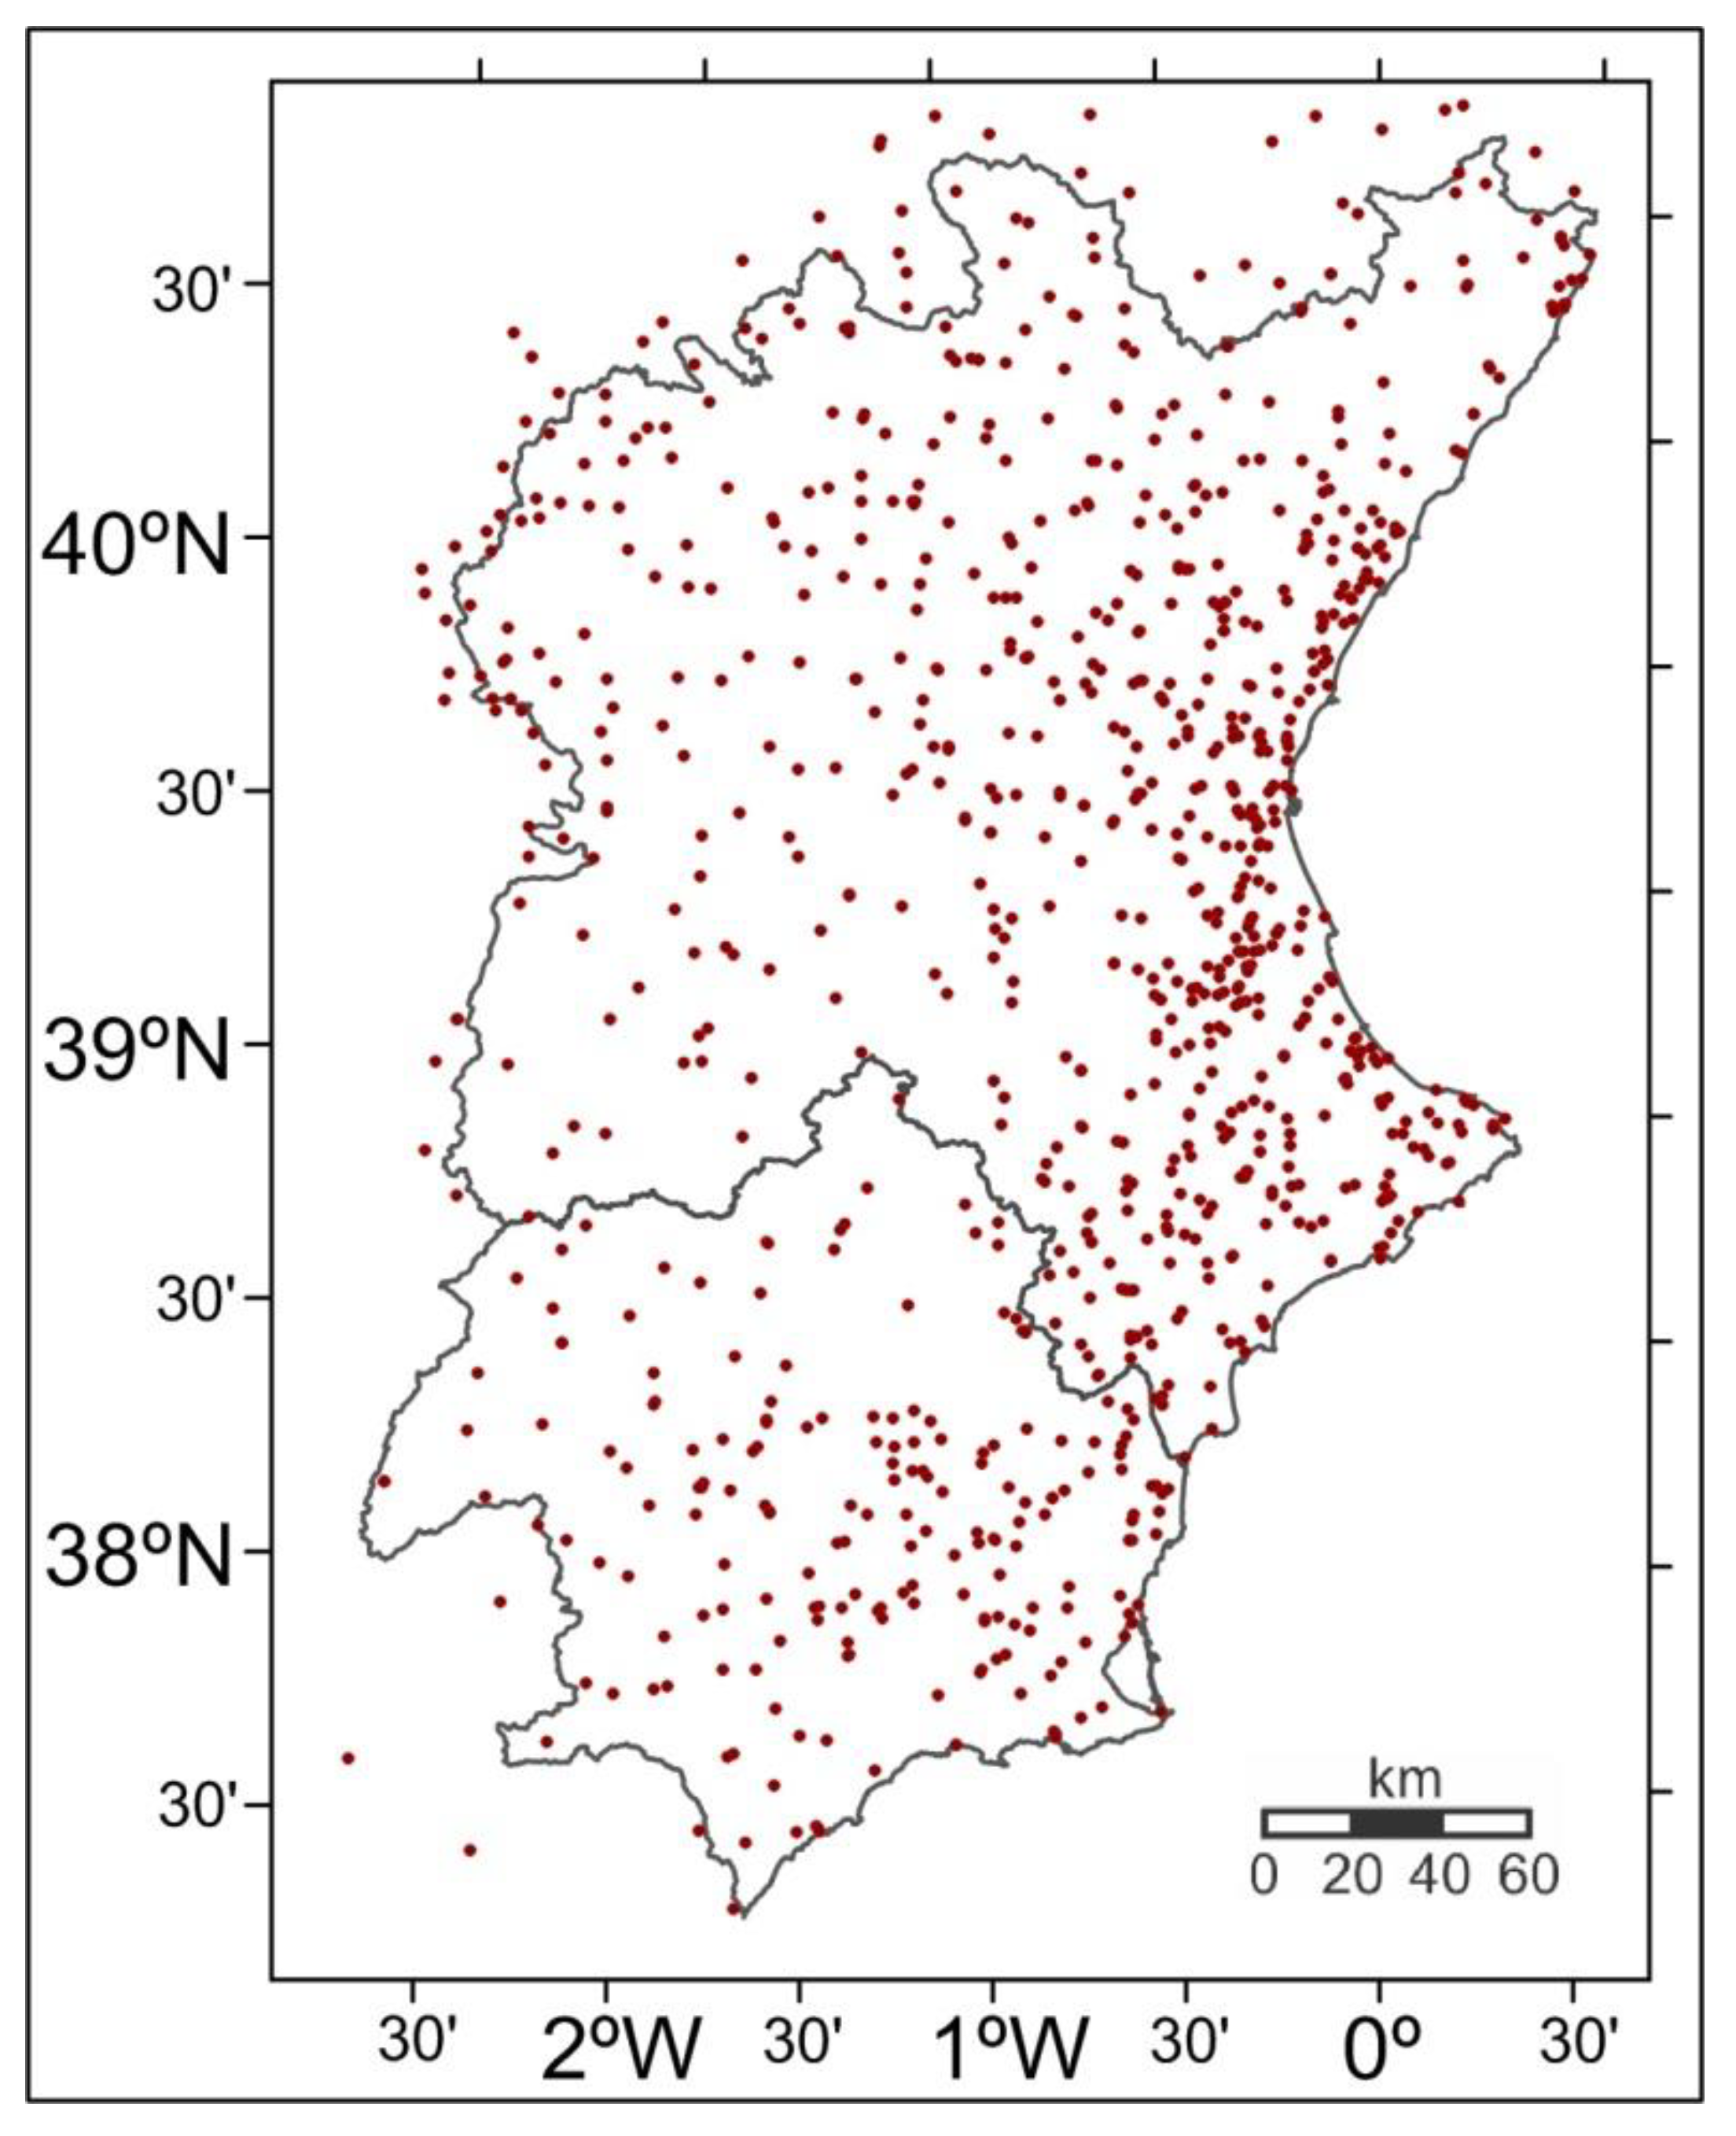
2.1. Climate Data Input
2.2. Statistical Downscaling of GCMs
3. Results
- −
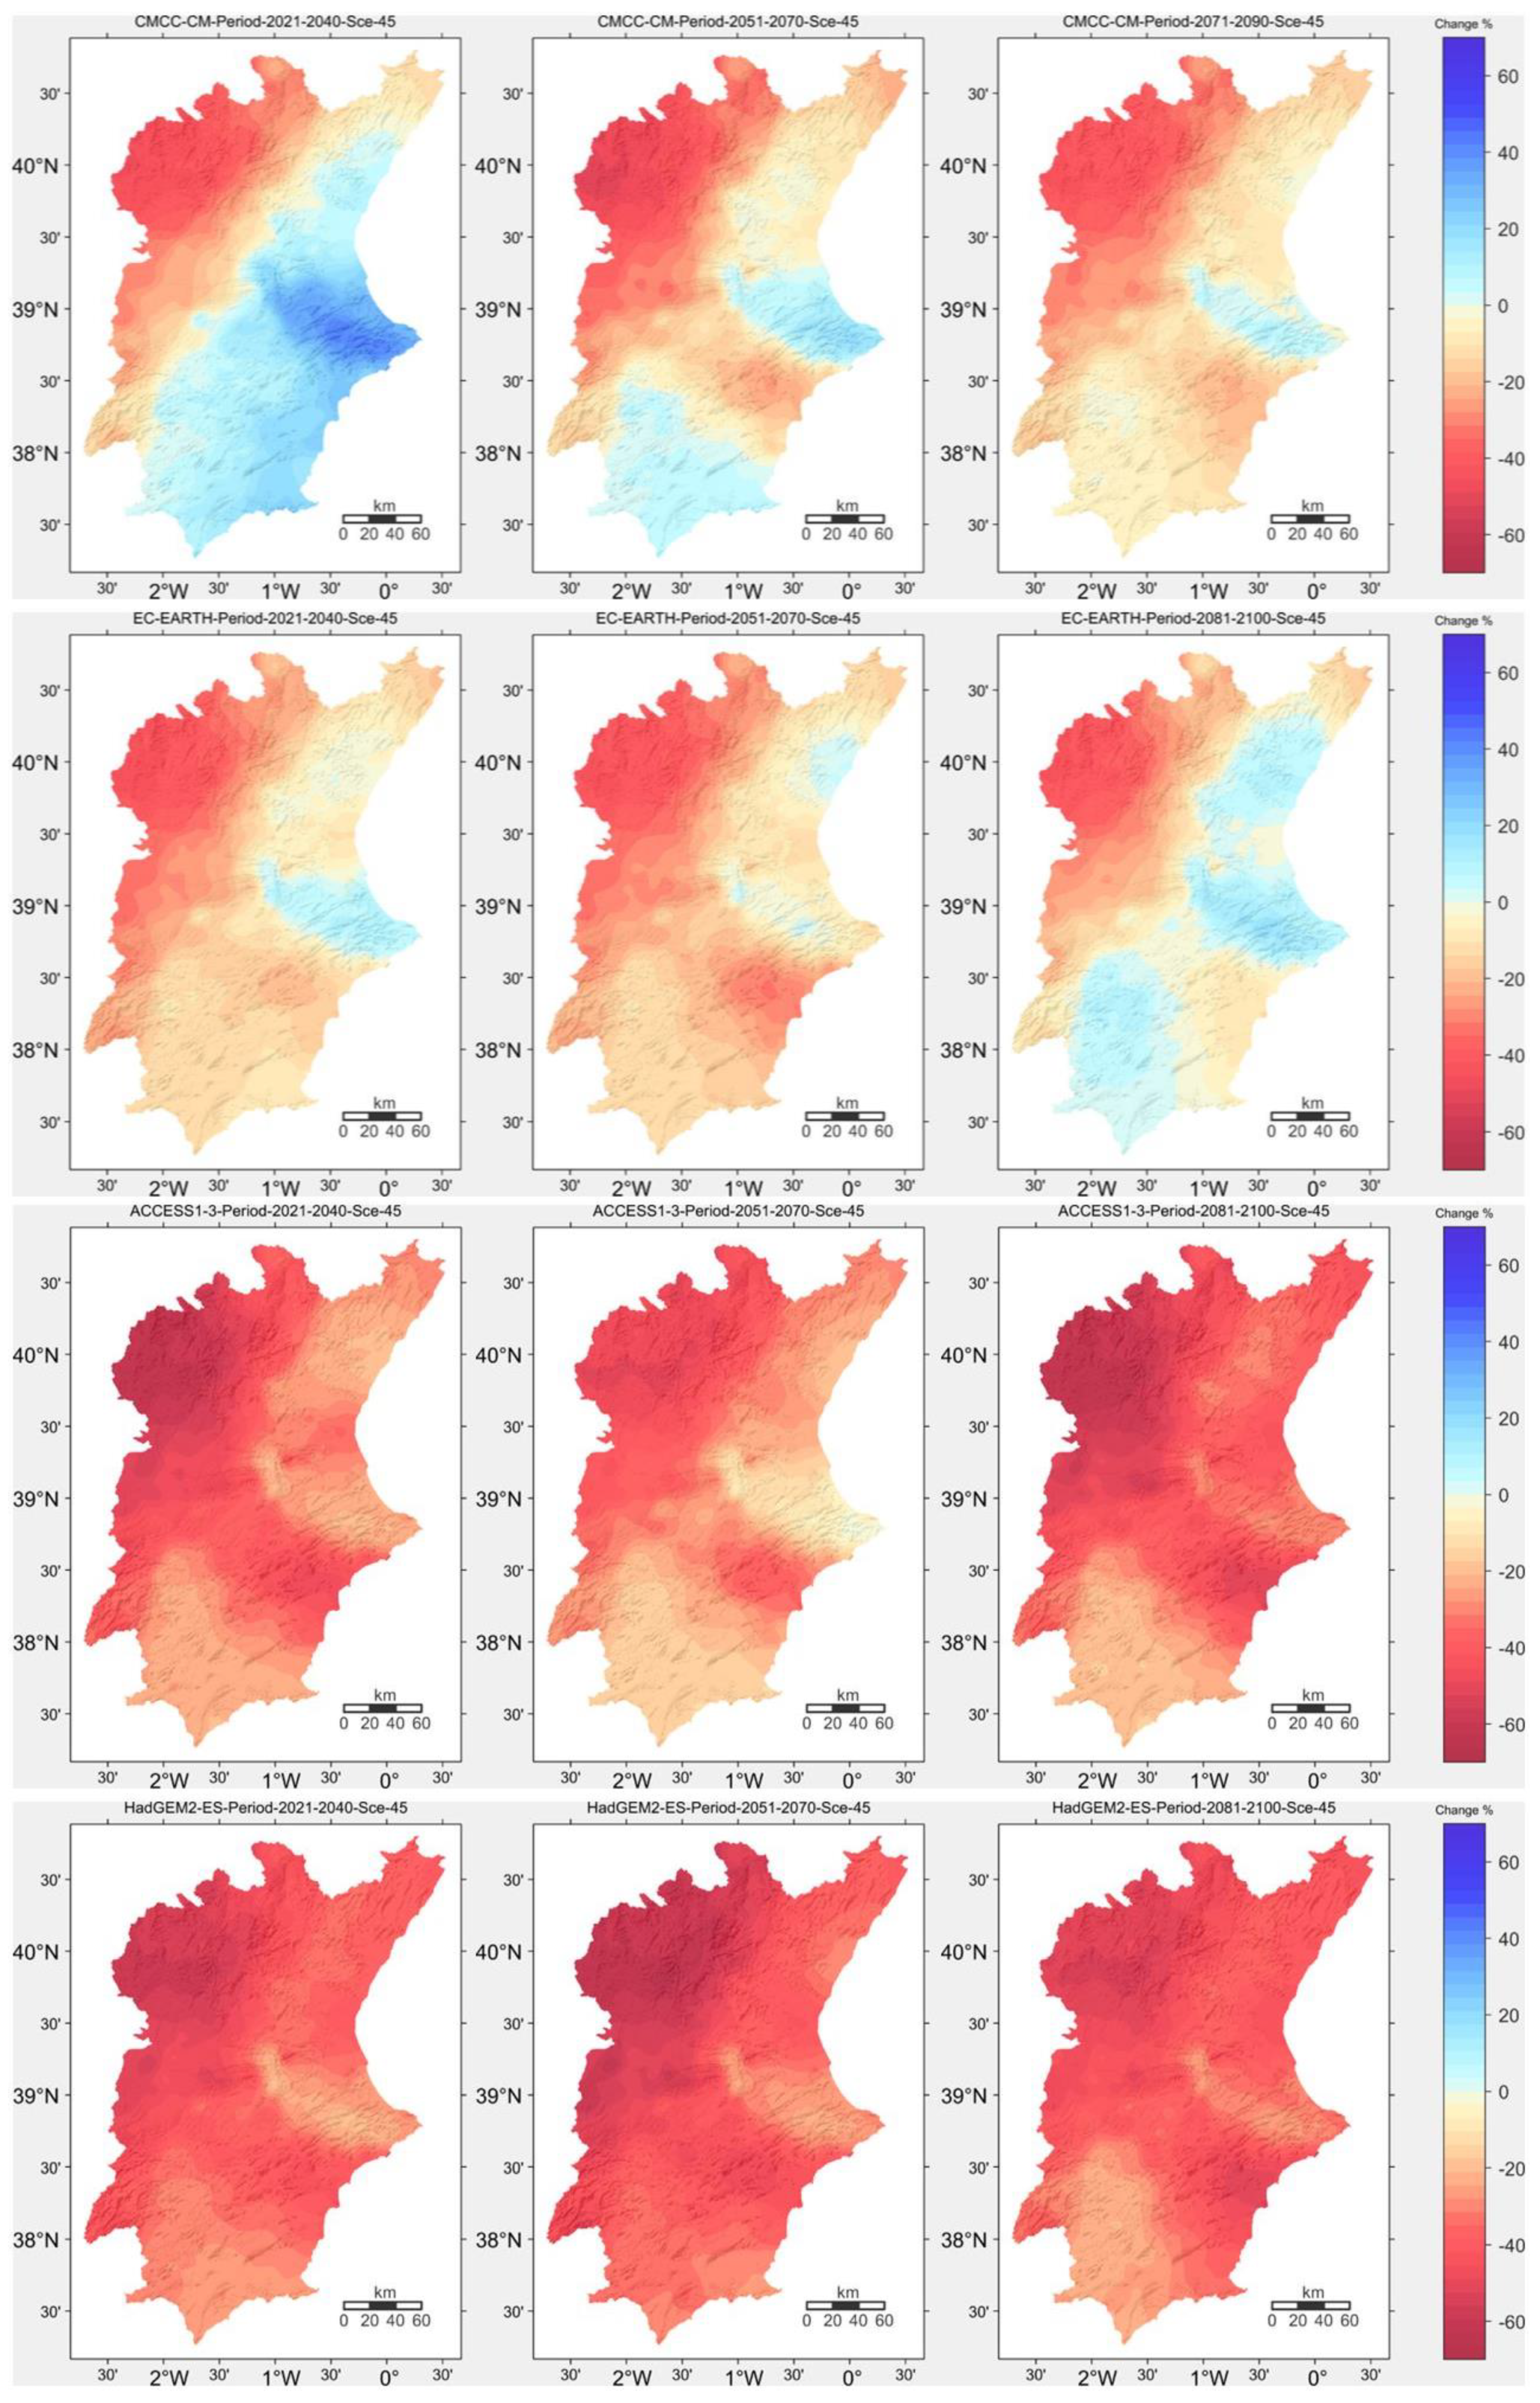
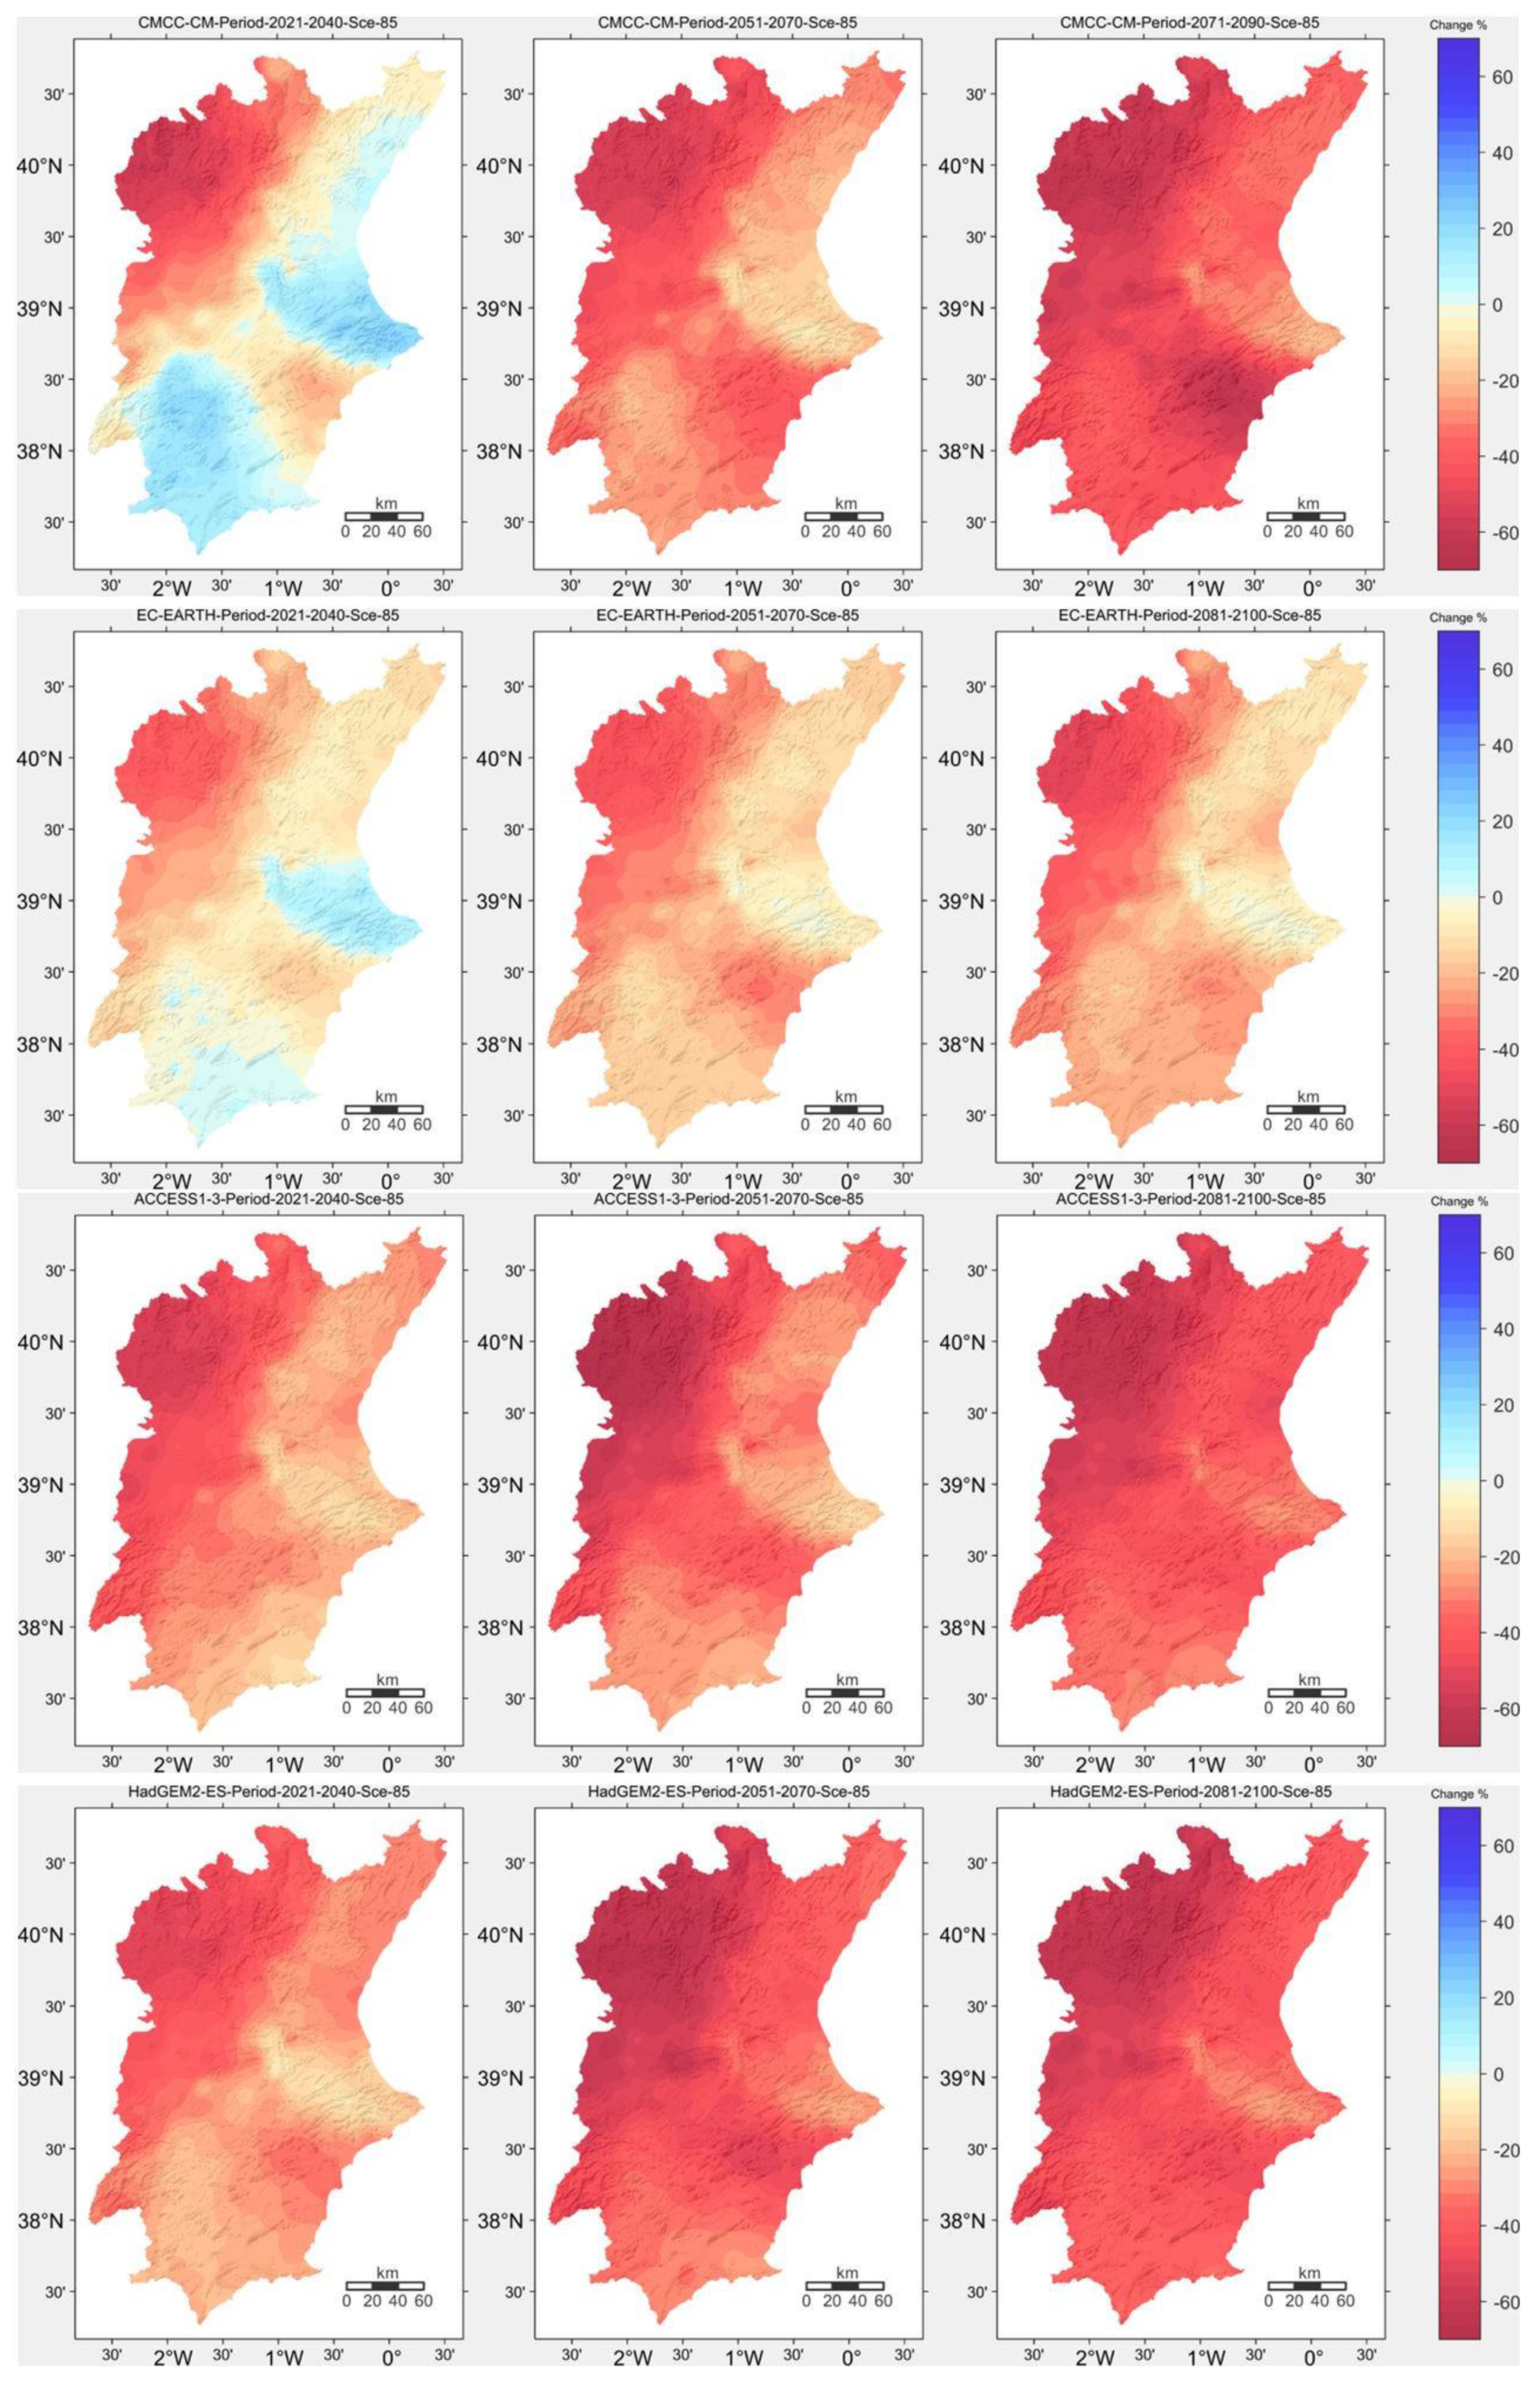
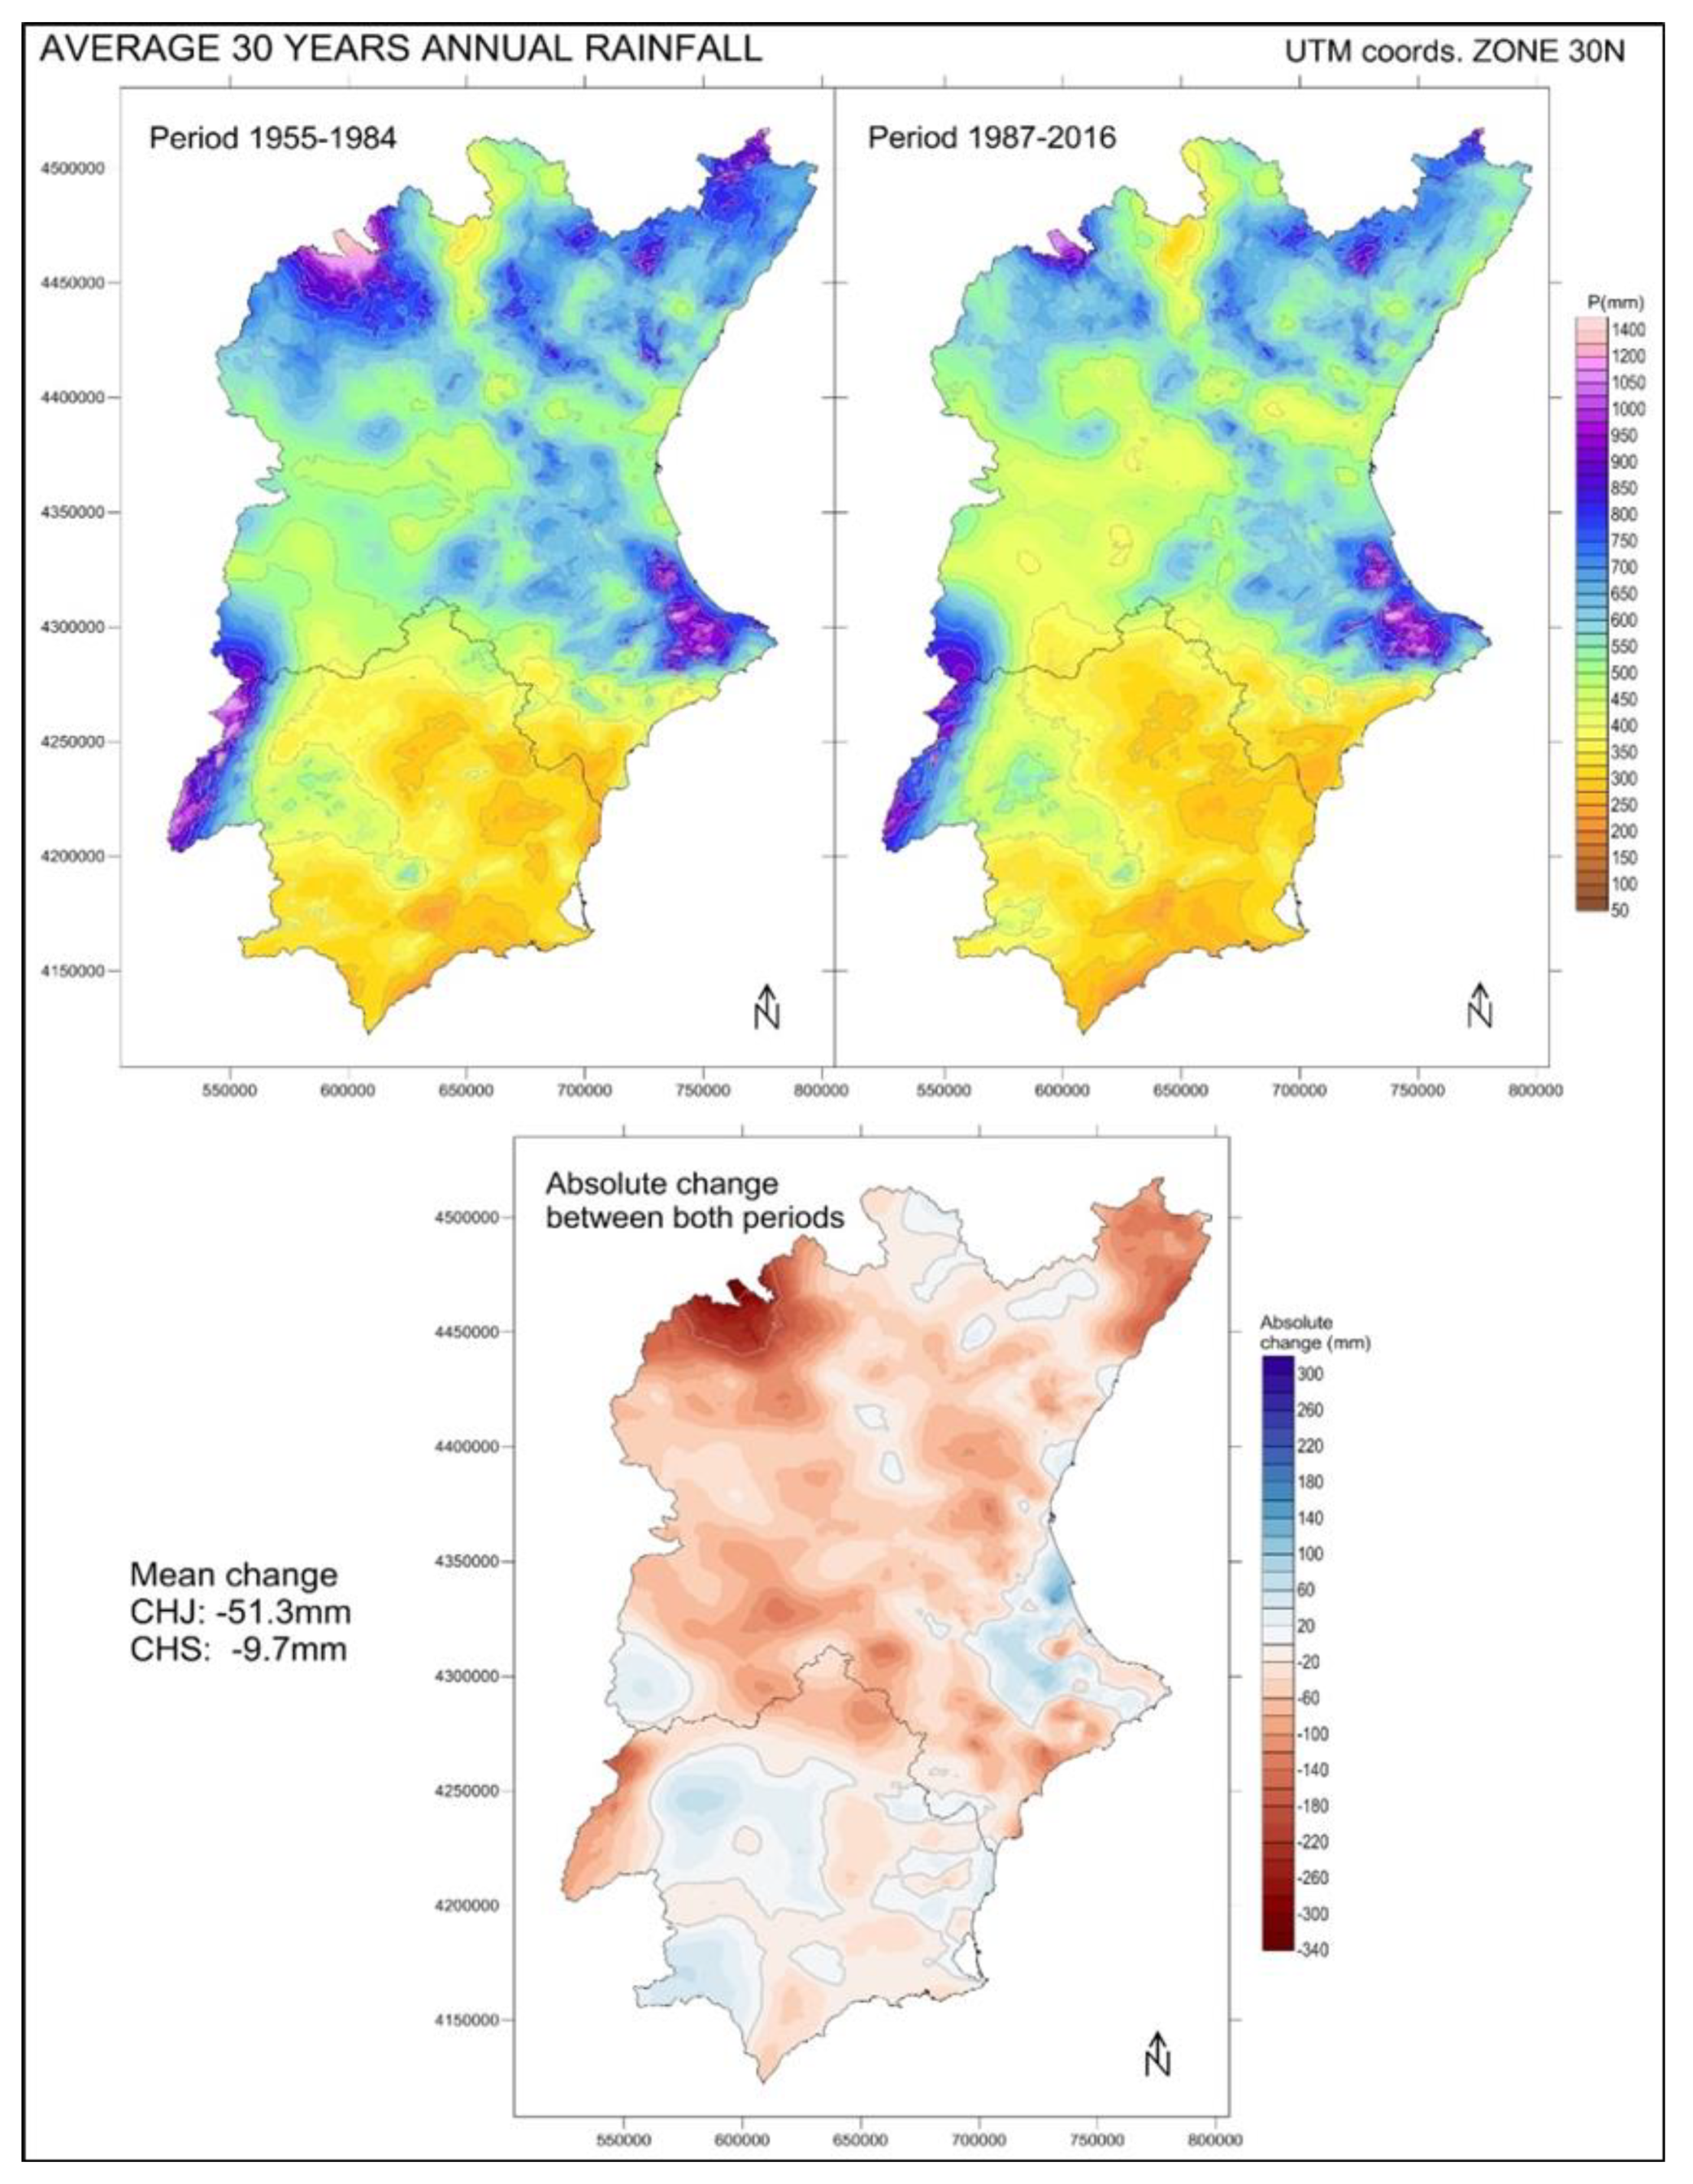
- Percentage of change (%) in the annual mean precipitation of the projected period in relation to the base period;
- −
- Percentage of change (%) in the mean seasonal precipitation of the projected period in relation to the base period. Complete months were considered as winter comprised December, January and February, spring included March, April and May, June, July and August formed summer, while autumn was formed by September, October and November;
- −
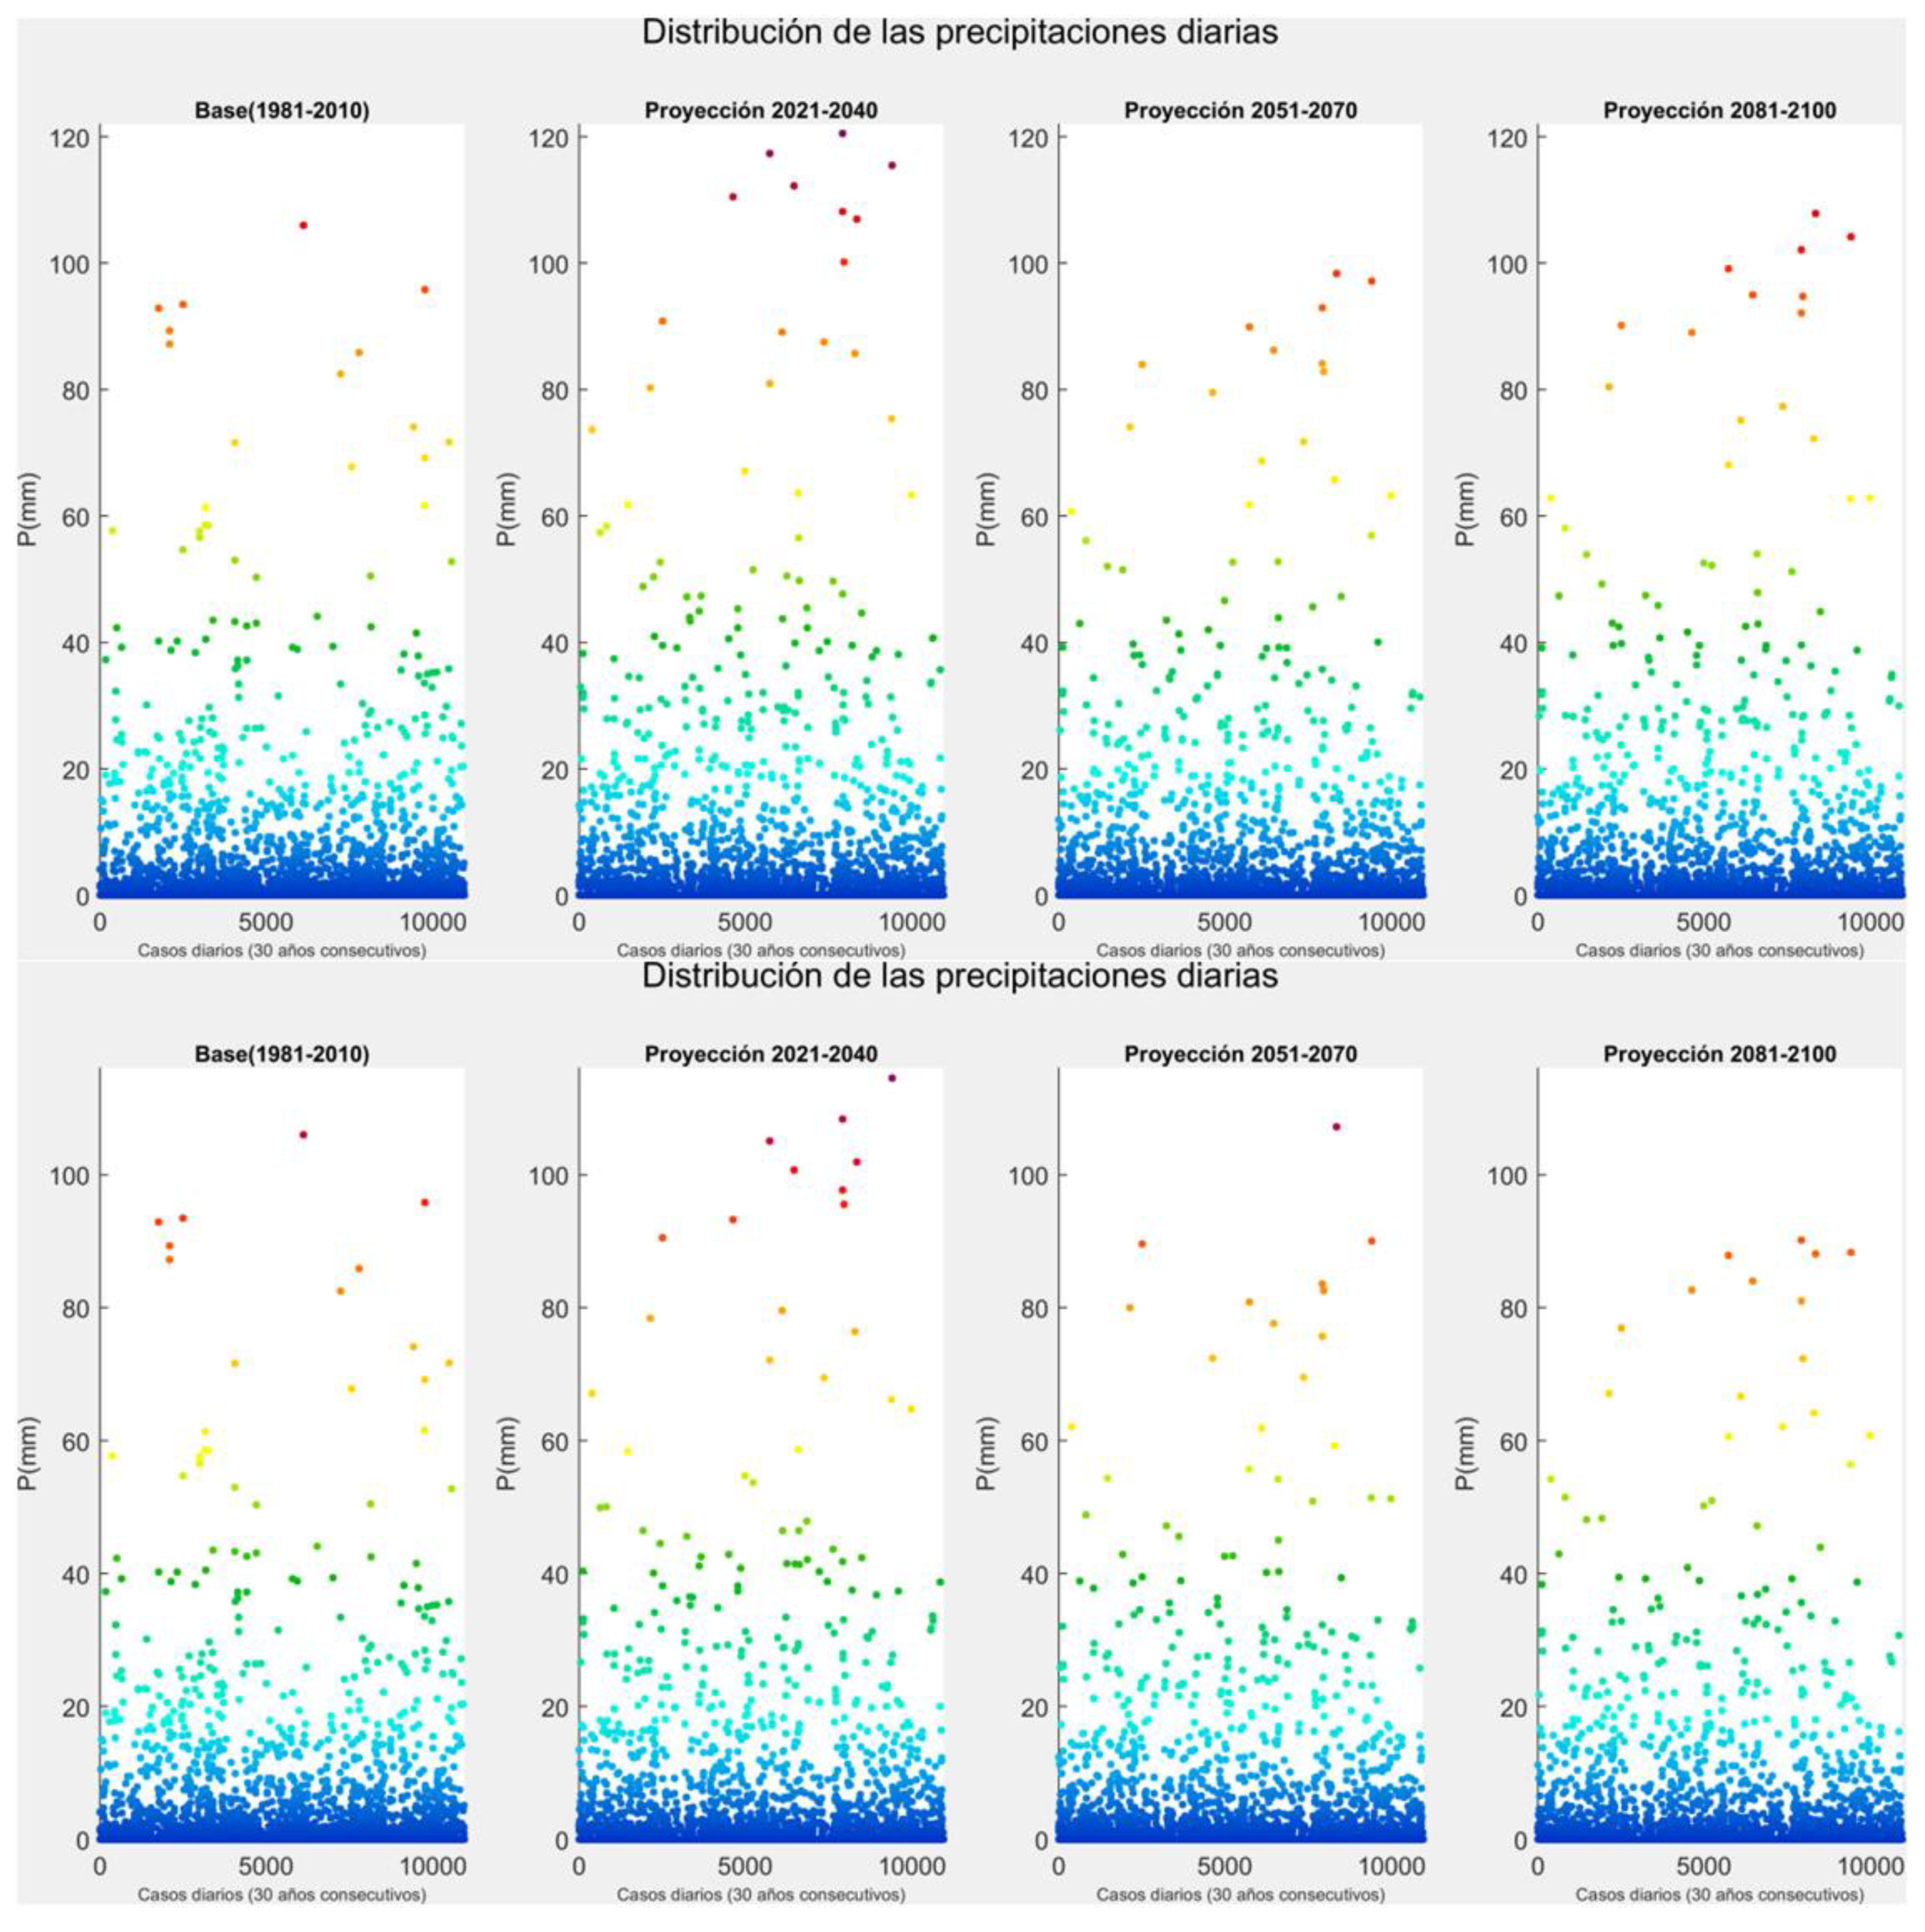
- Absolute changes in the mean daily rainfall amounts falling over the ≥99.9 percentile (extreme rainfalls) as regards to the base period;
- −
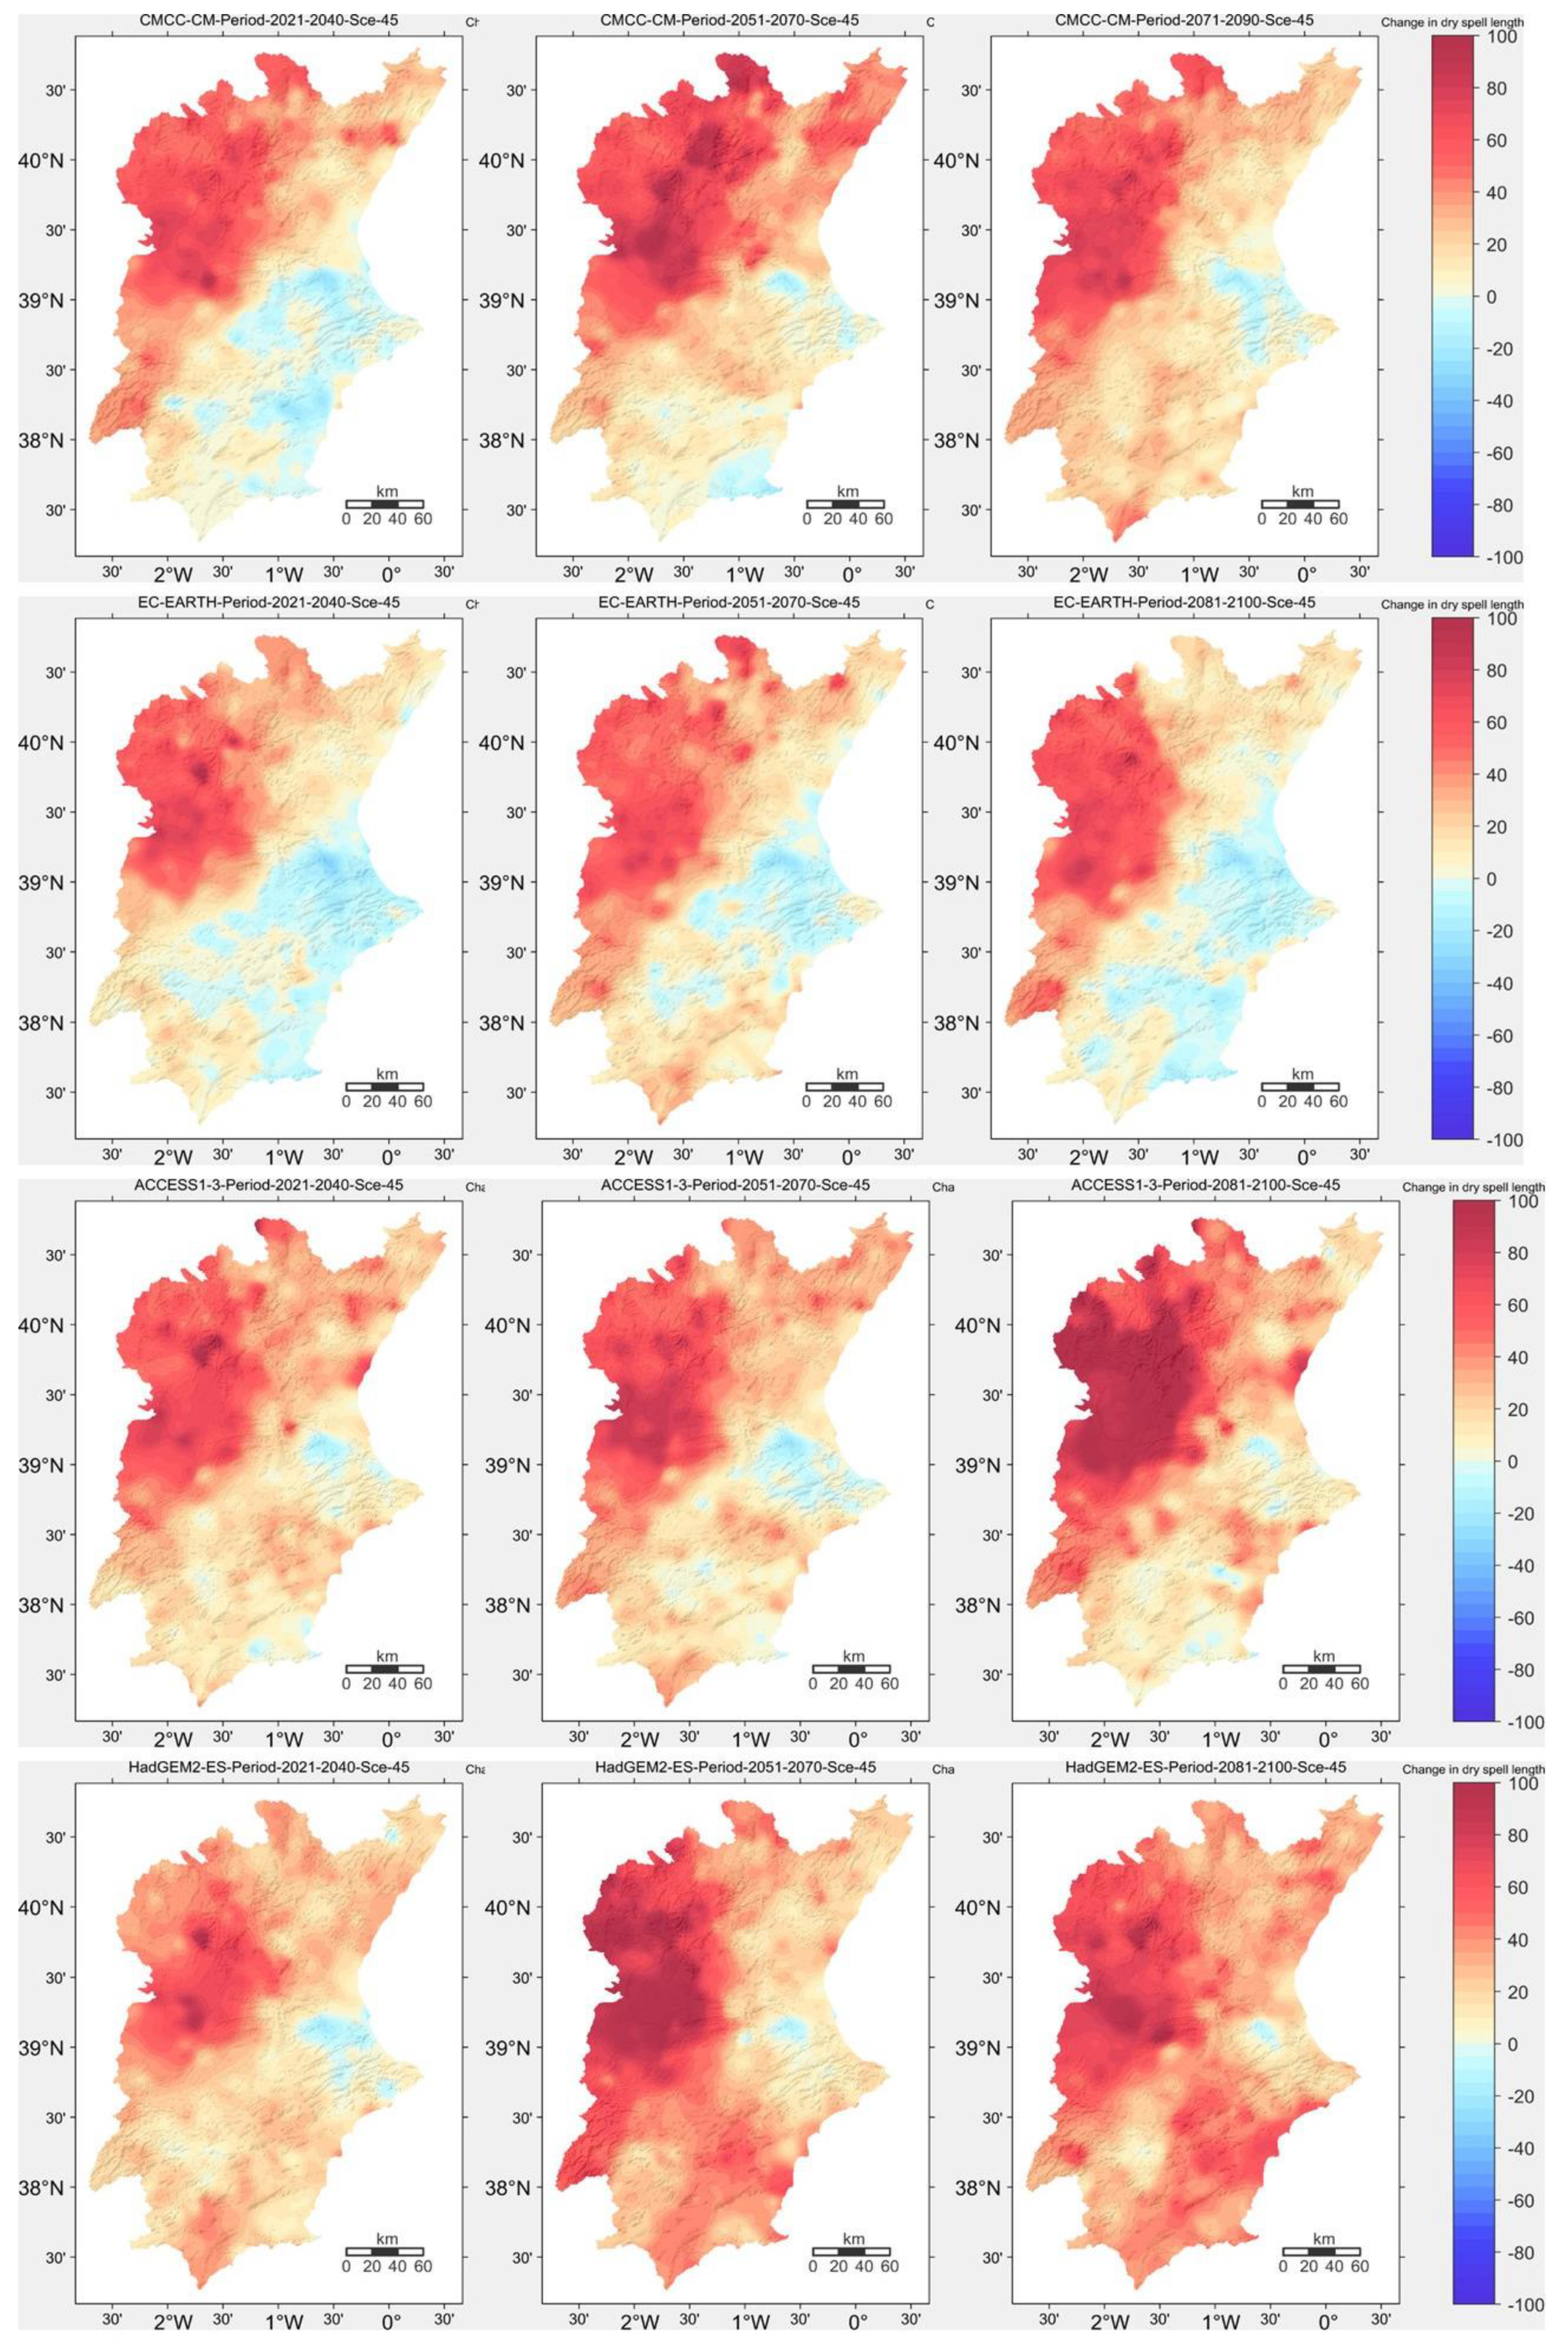
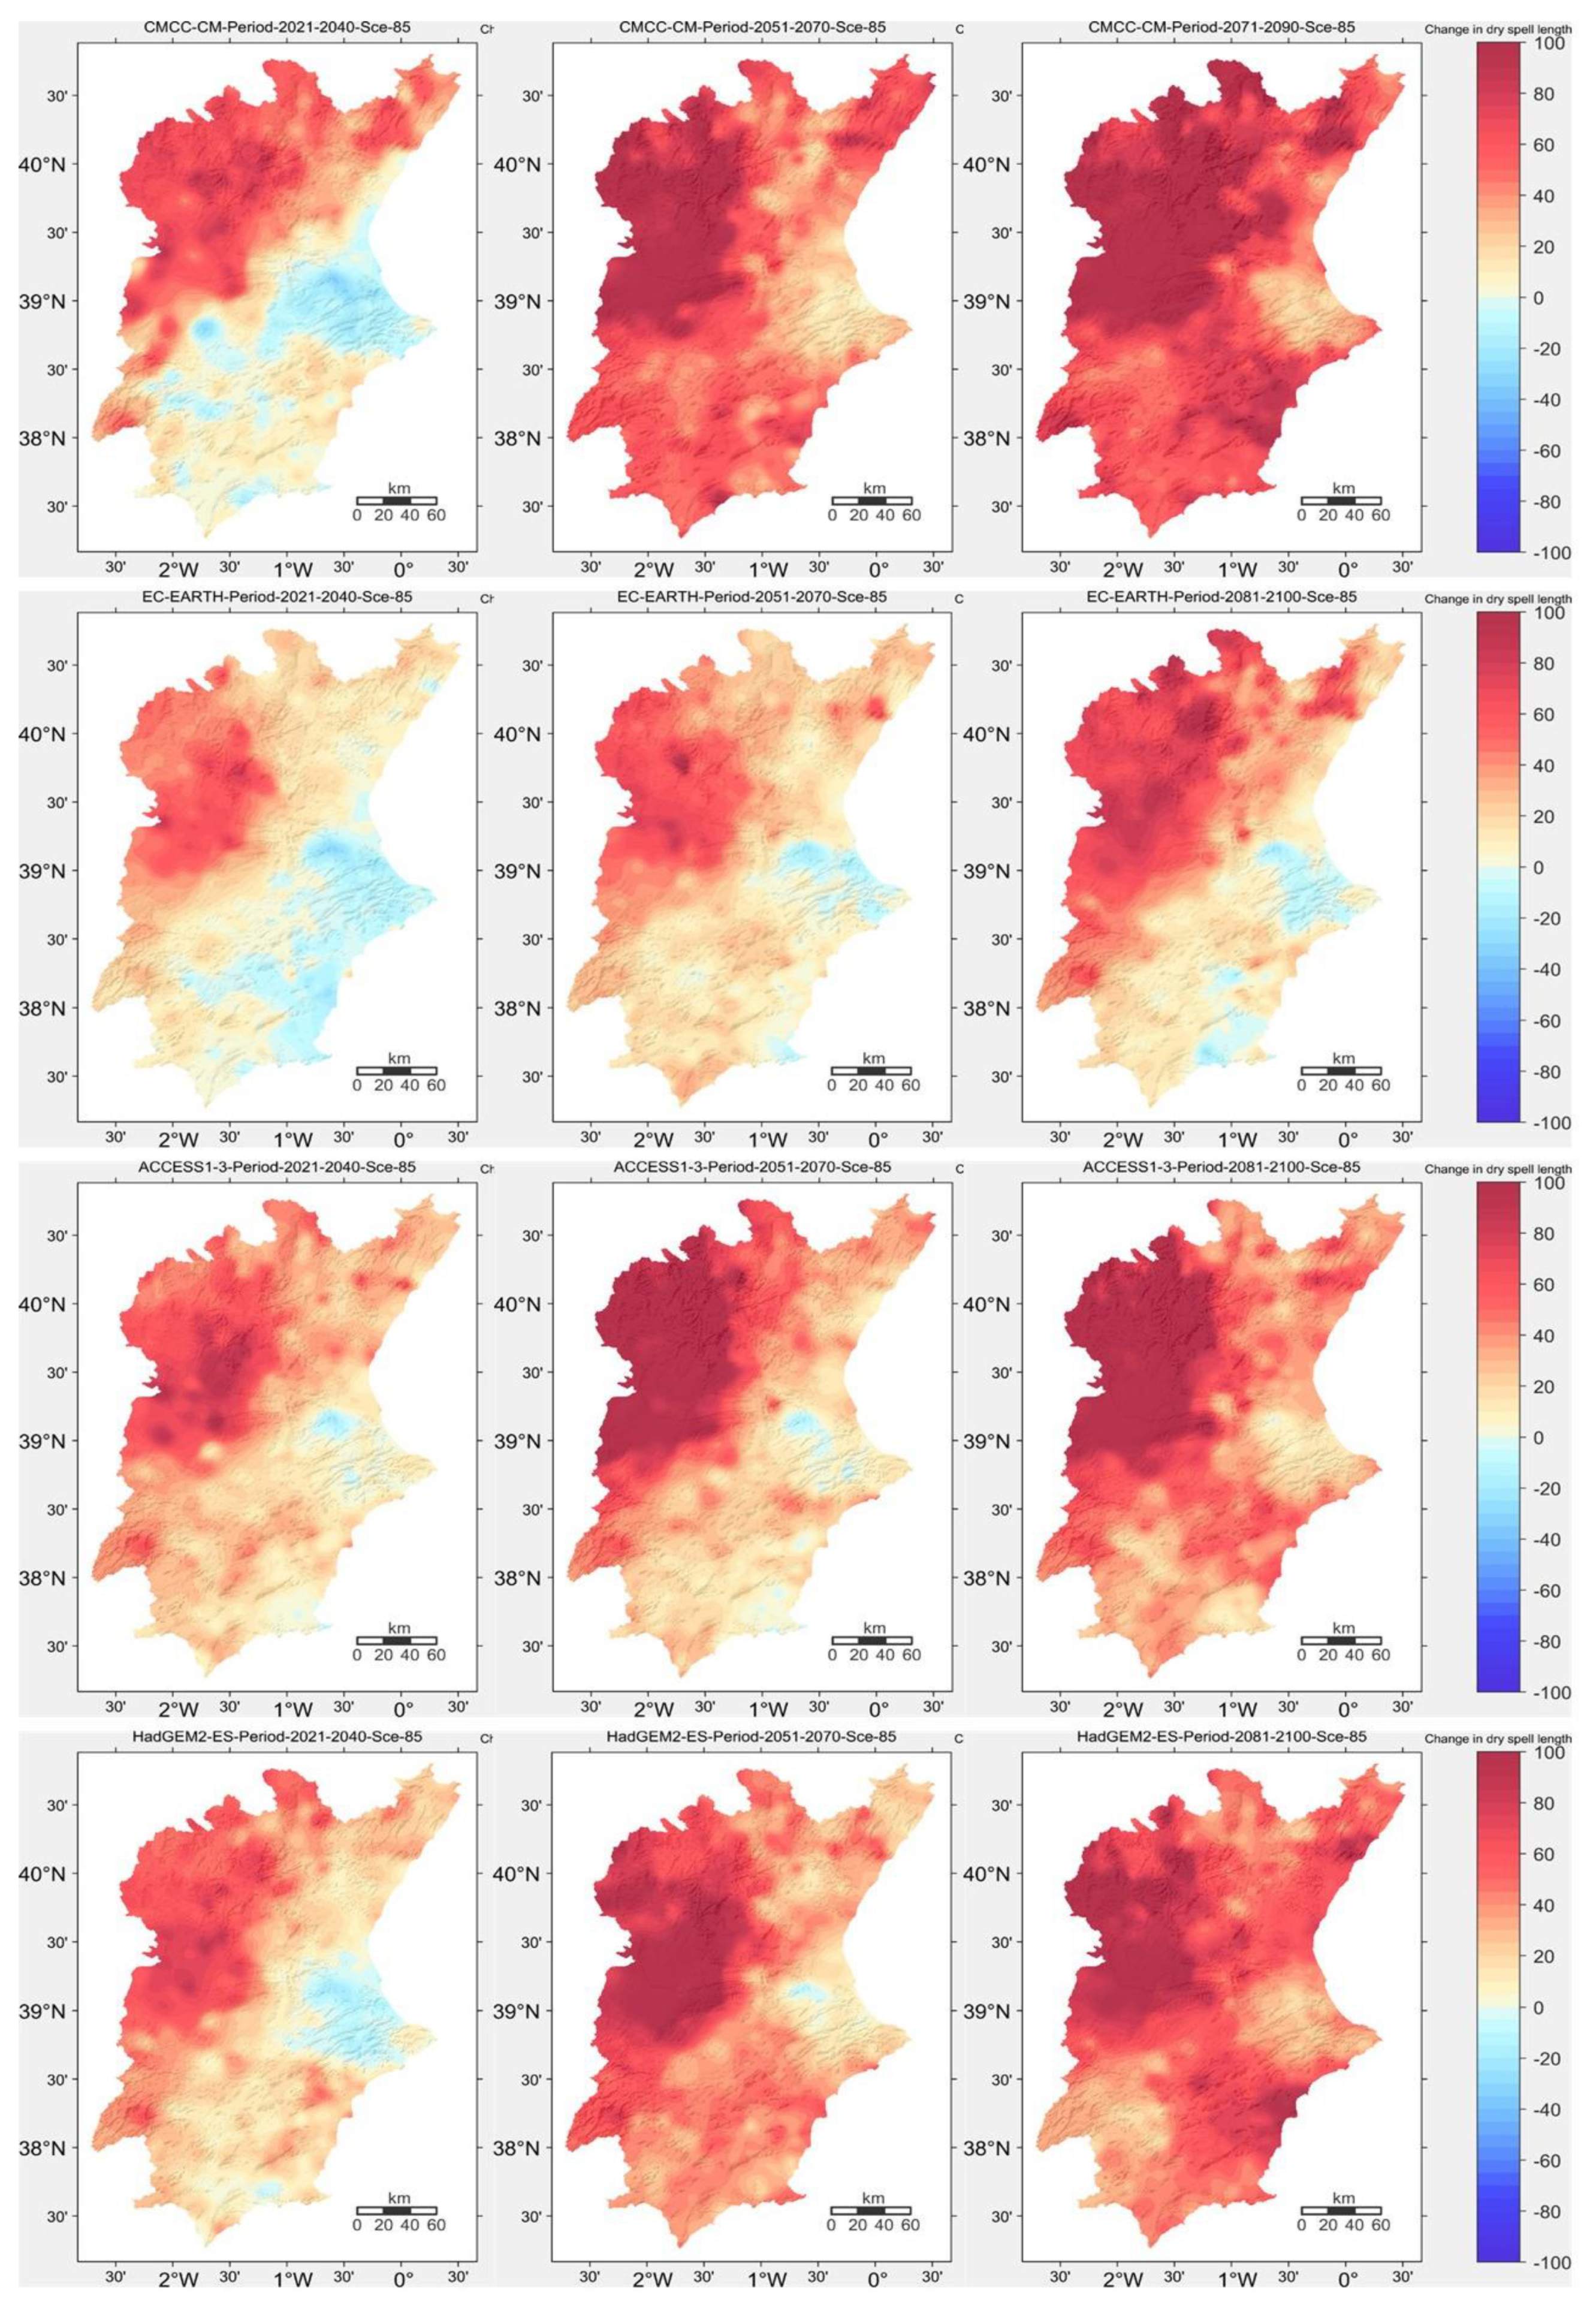
- Change in the annual maximum spell length of consecutive days with no precipitation ≥1 mm.
3.1. Spatial Changes Projected for Annual Rainfall
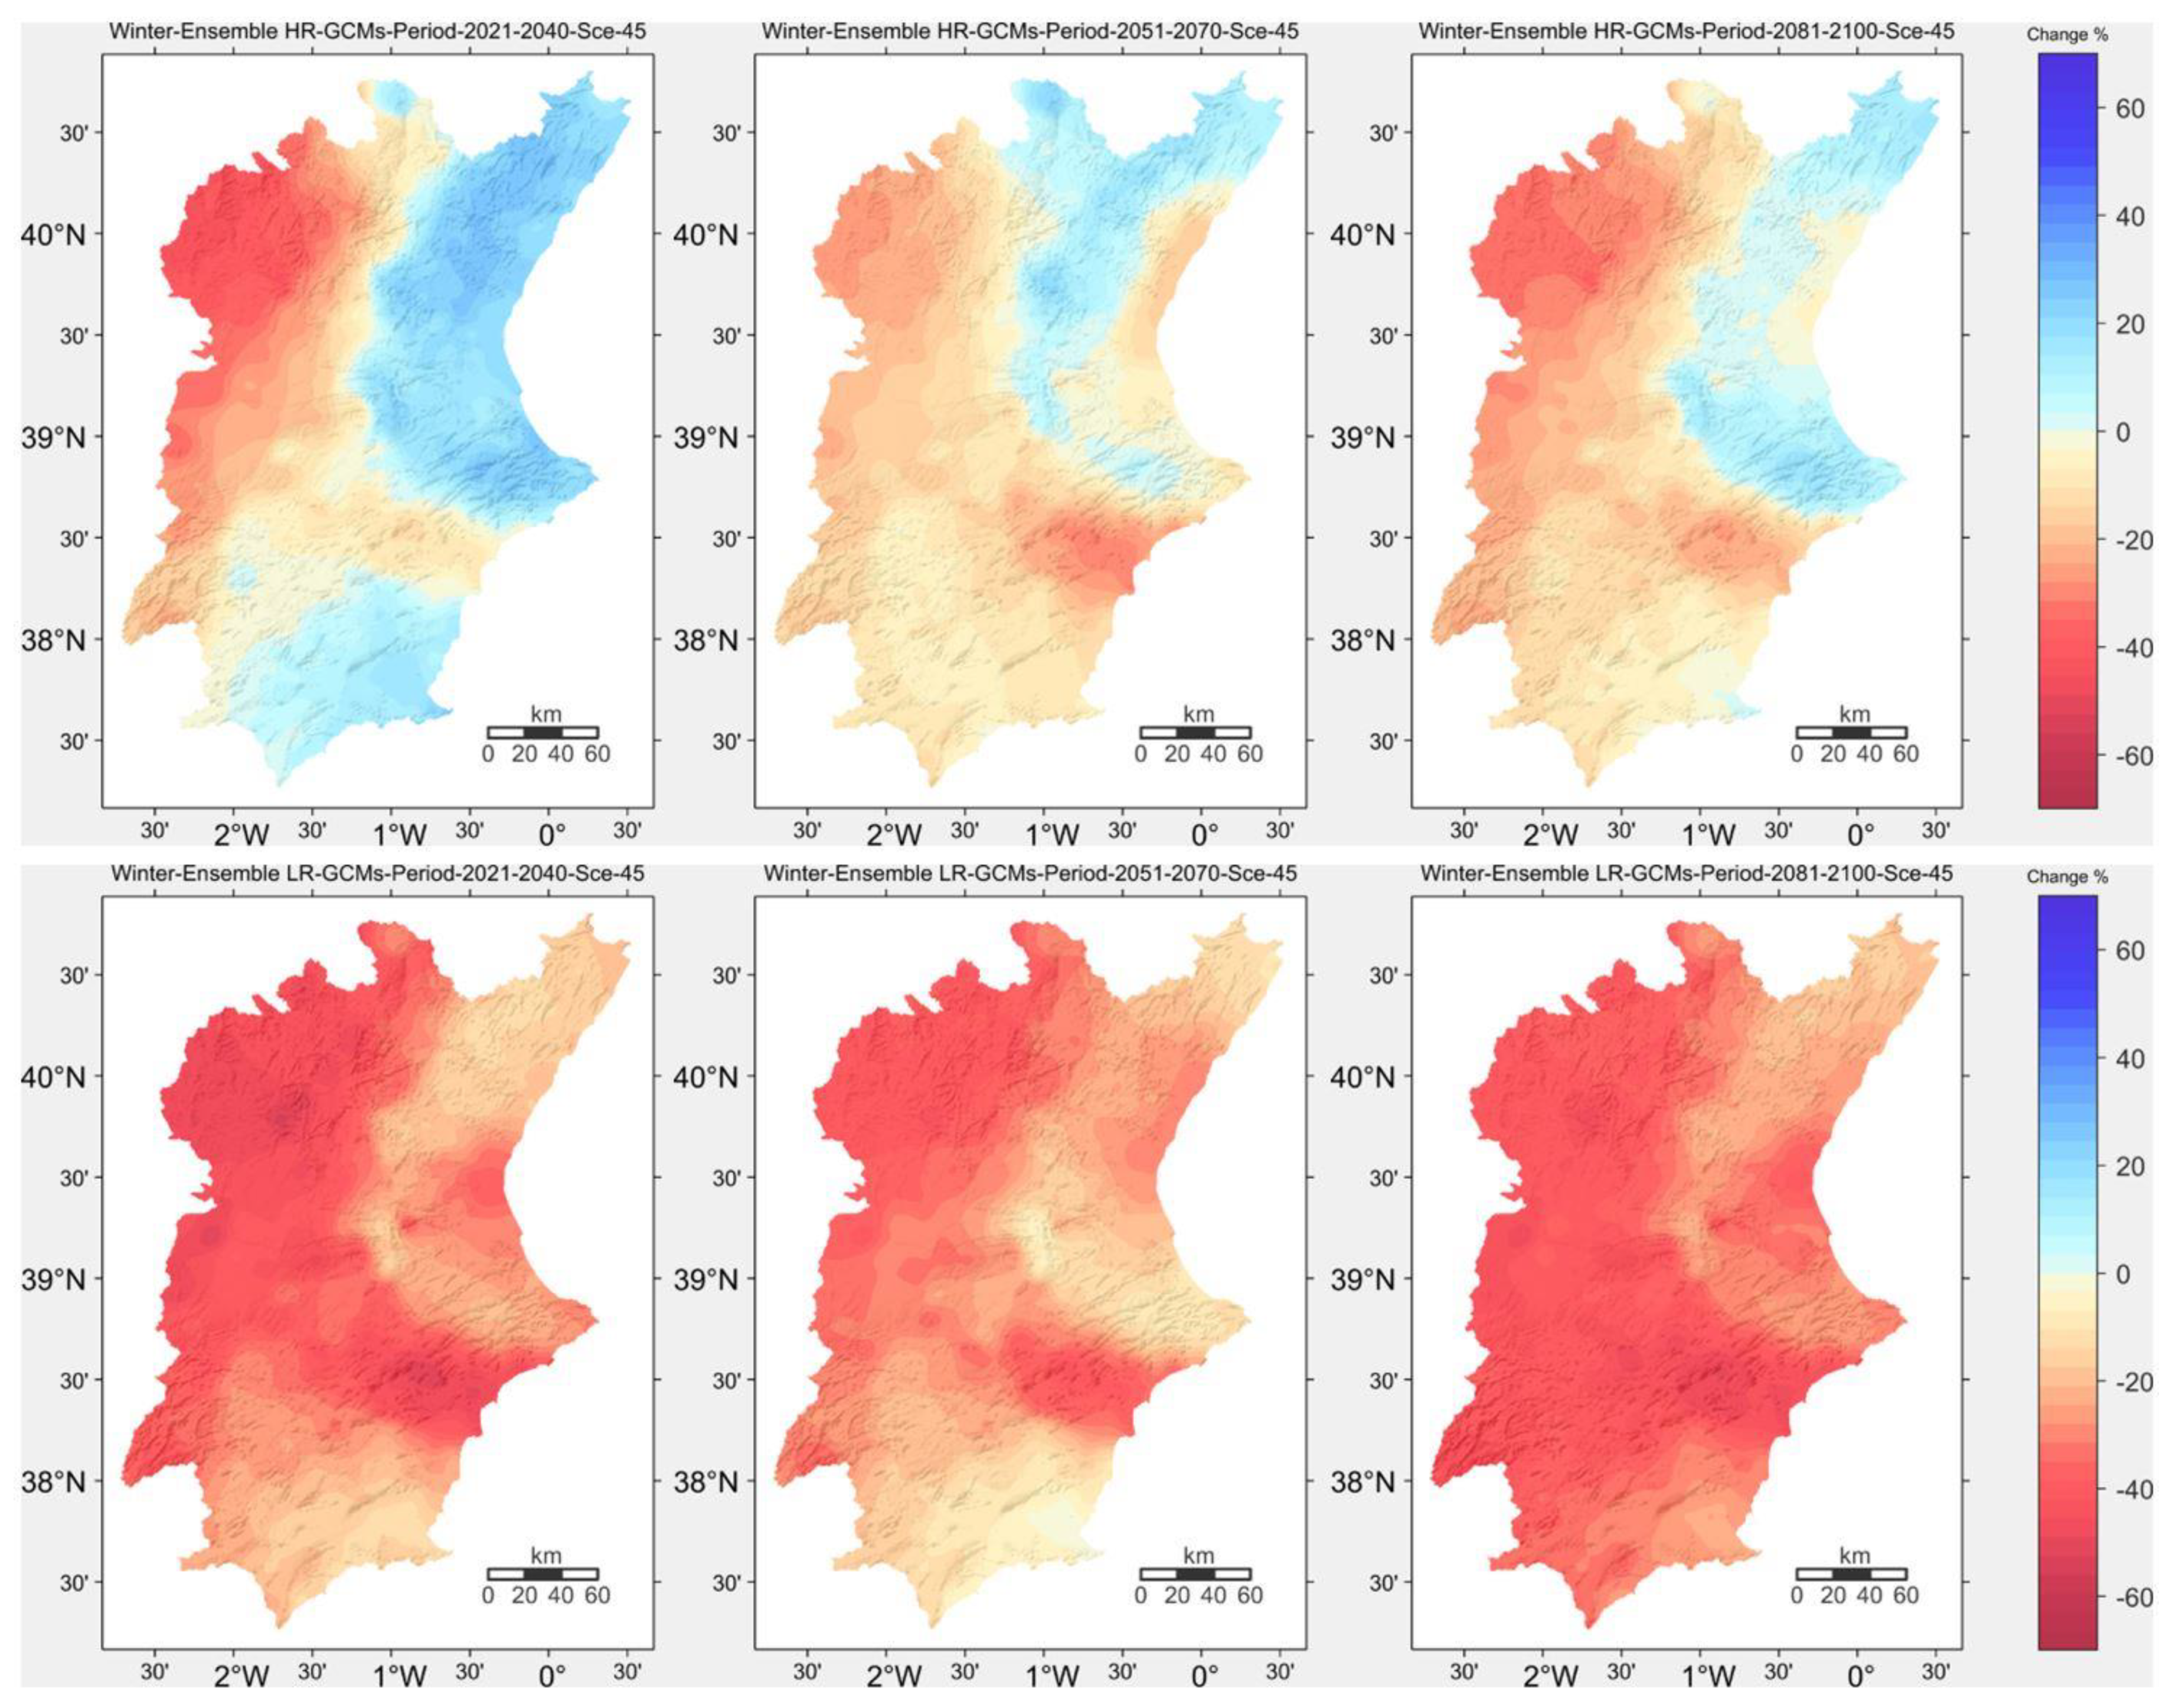
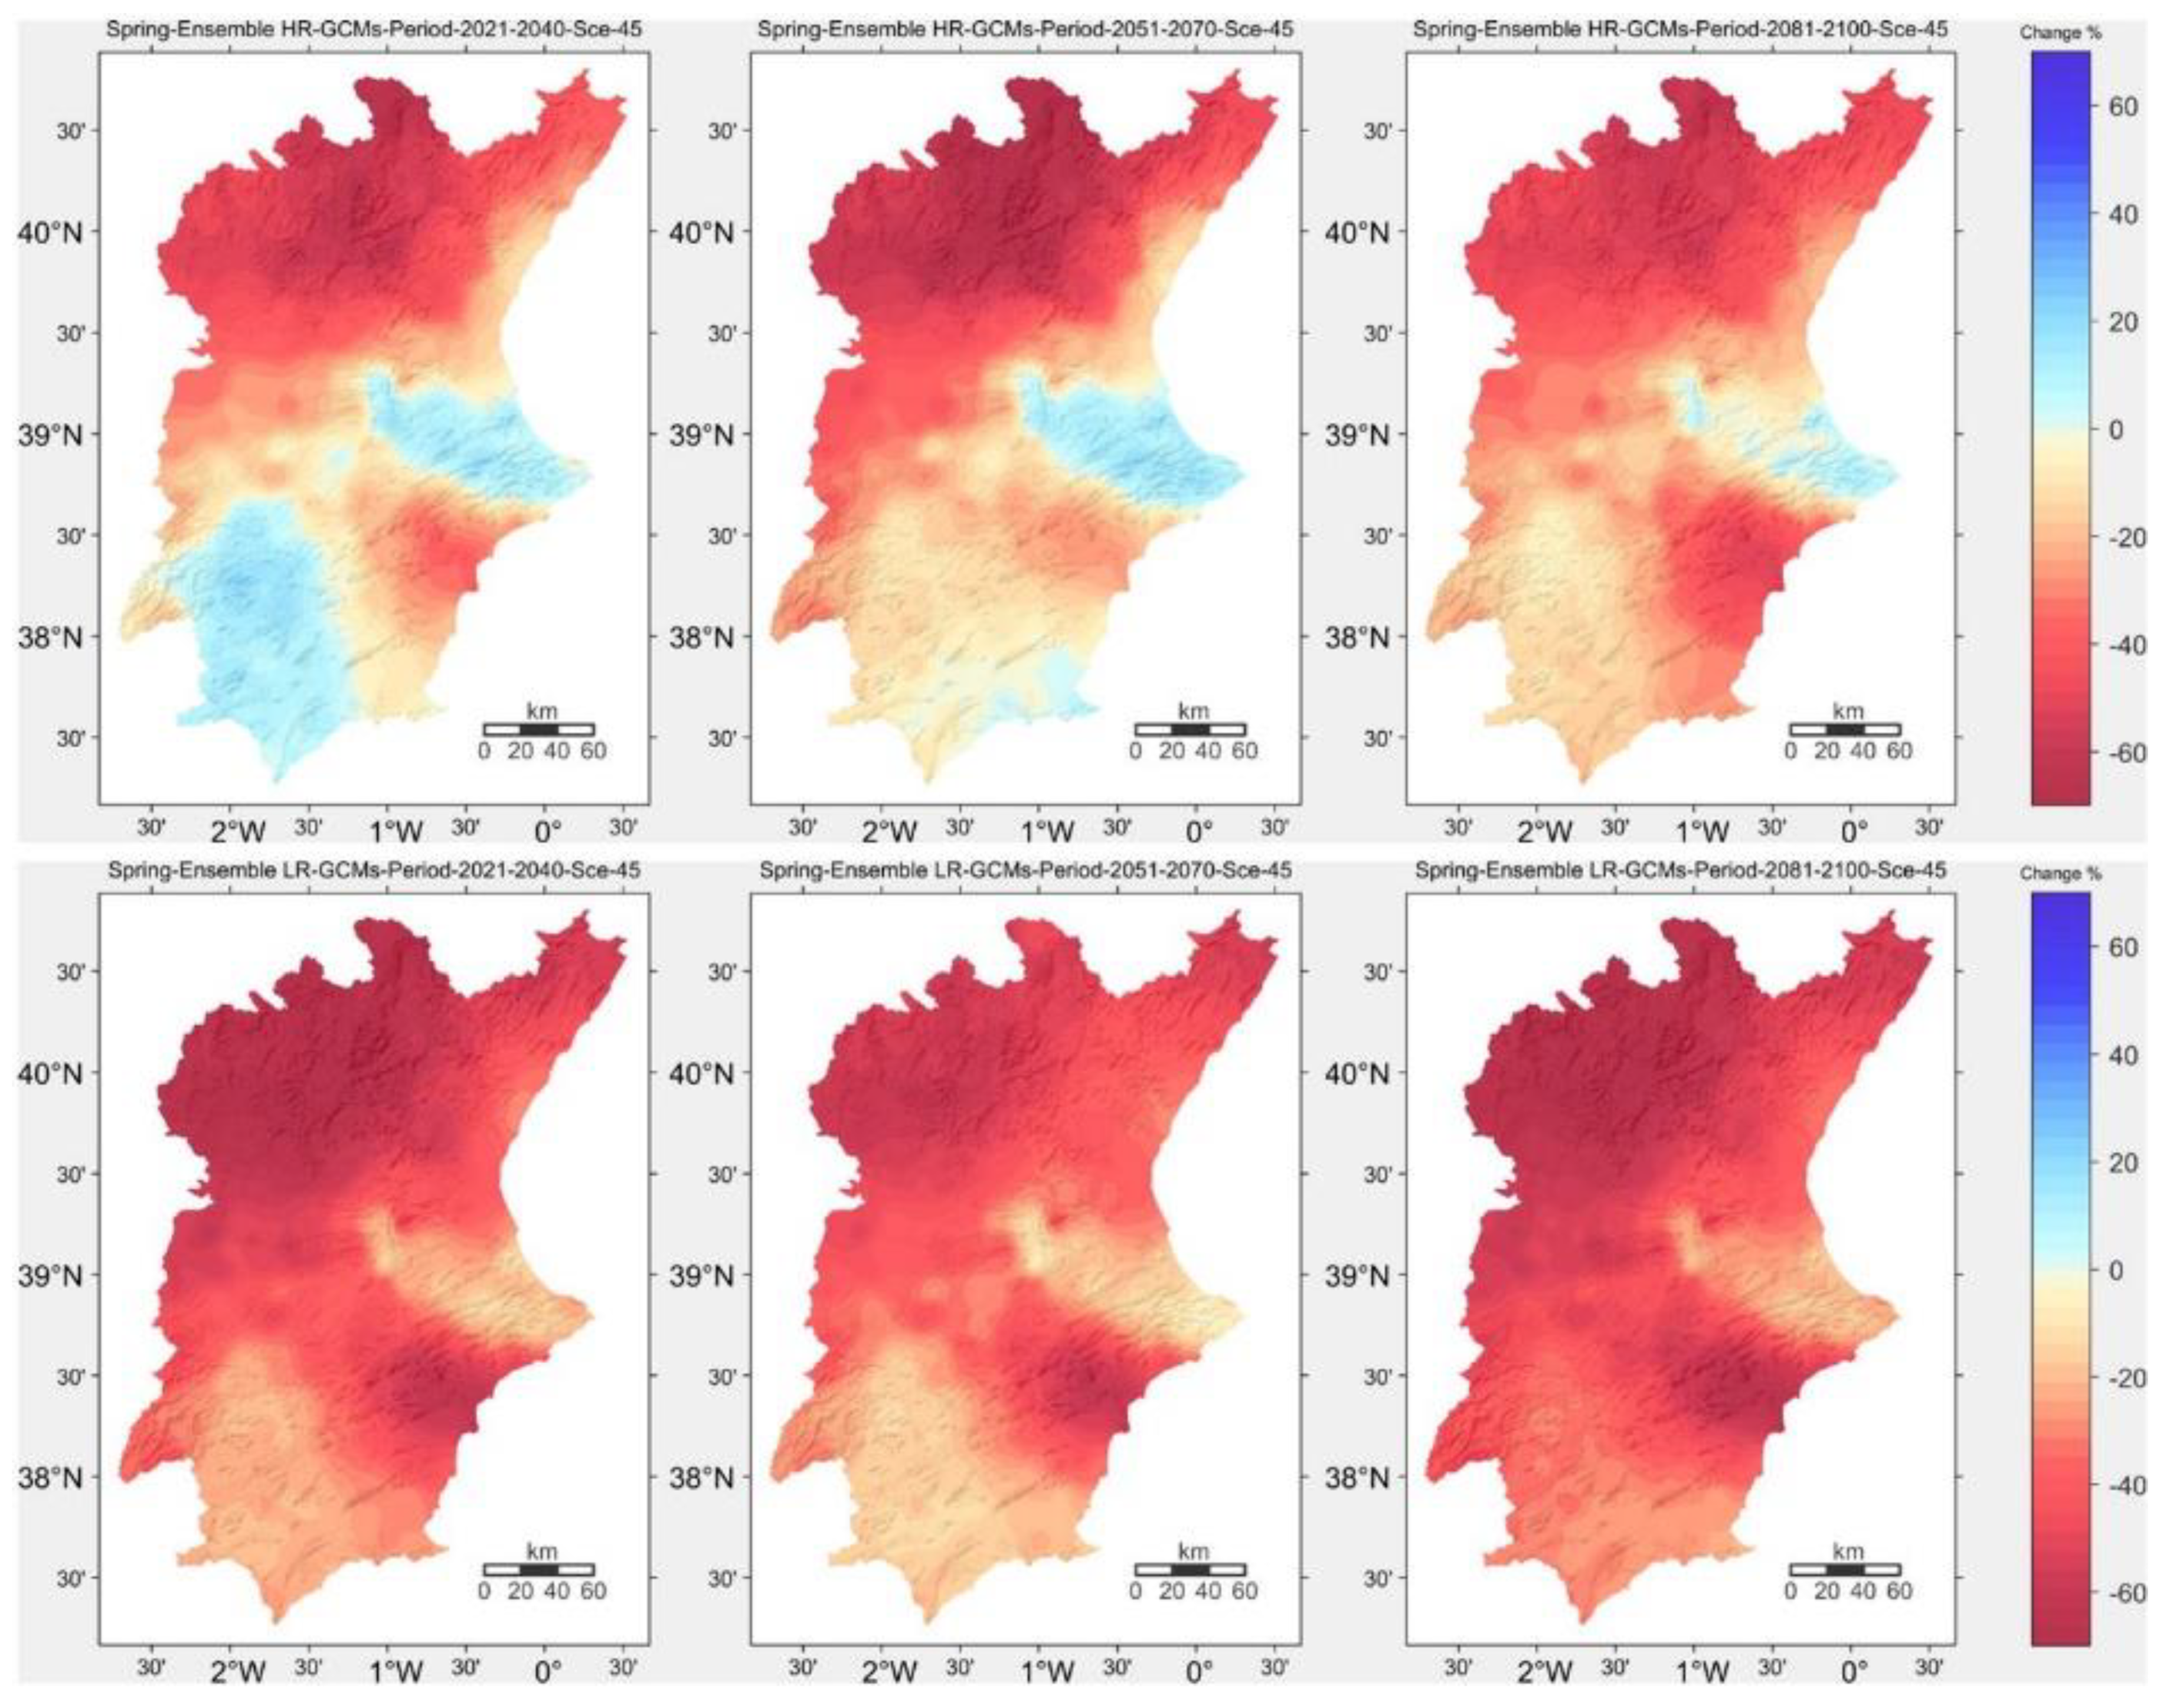
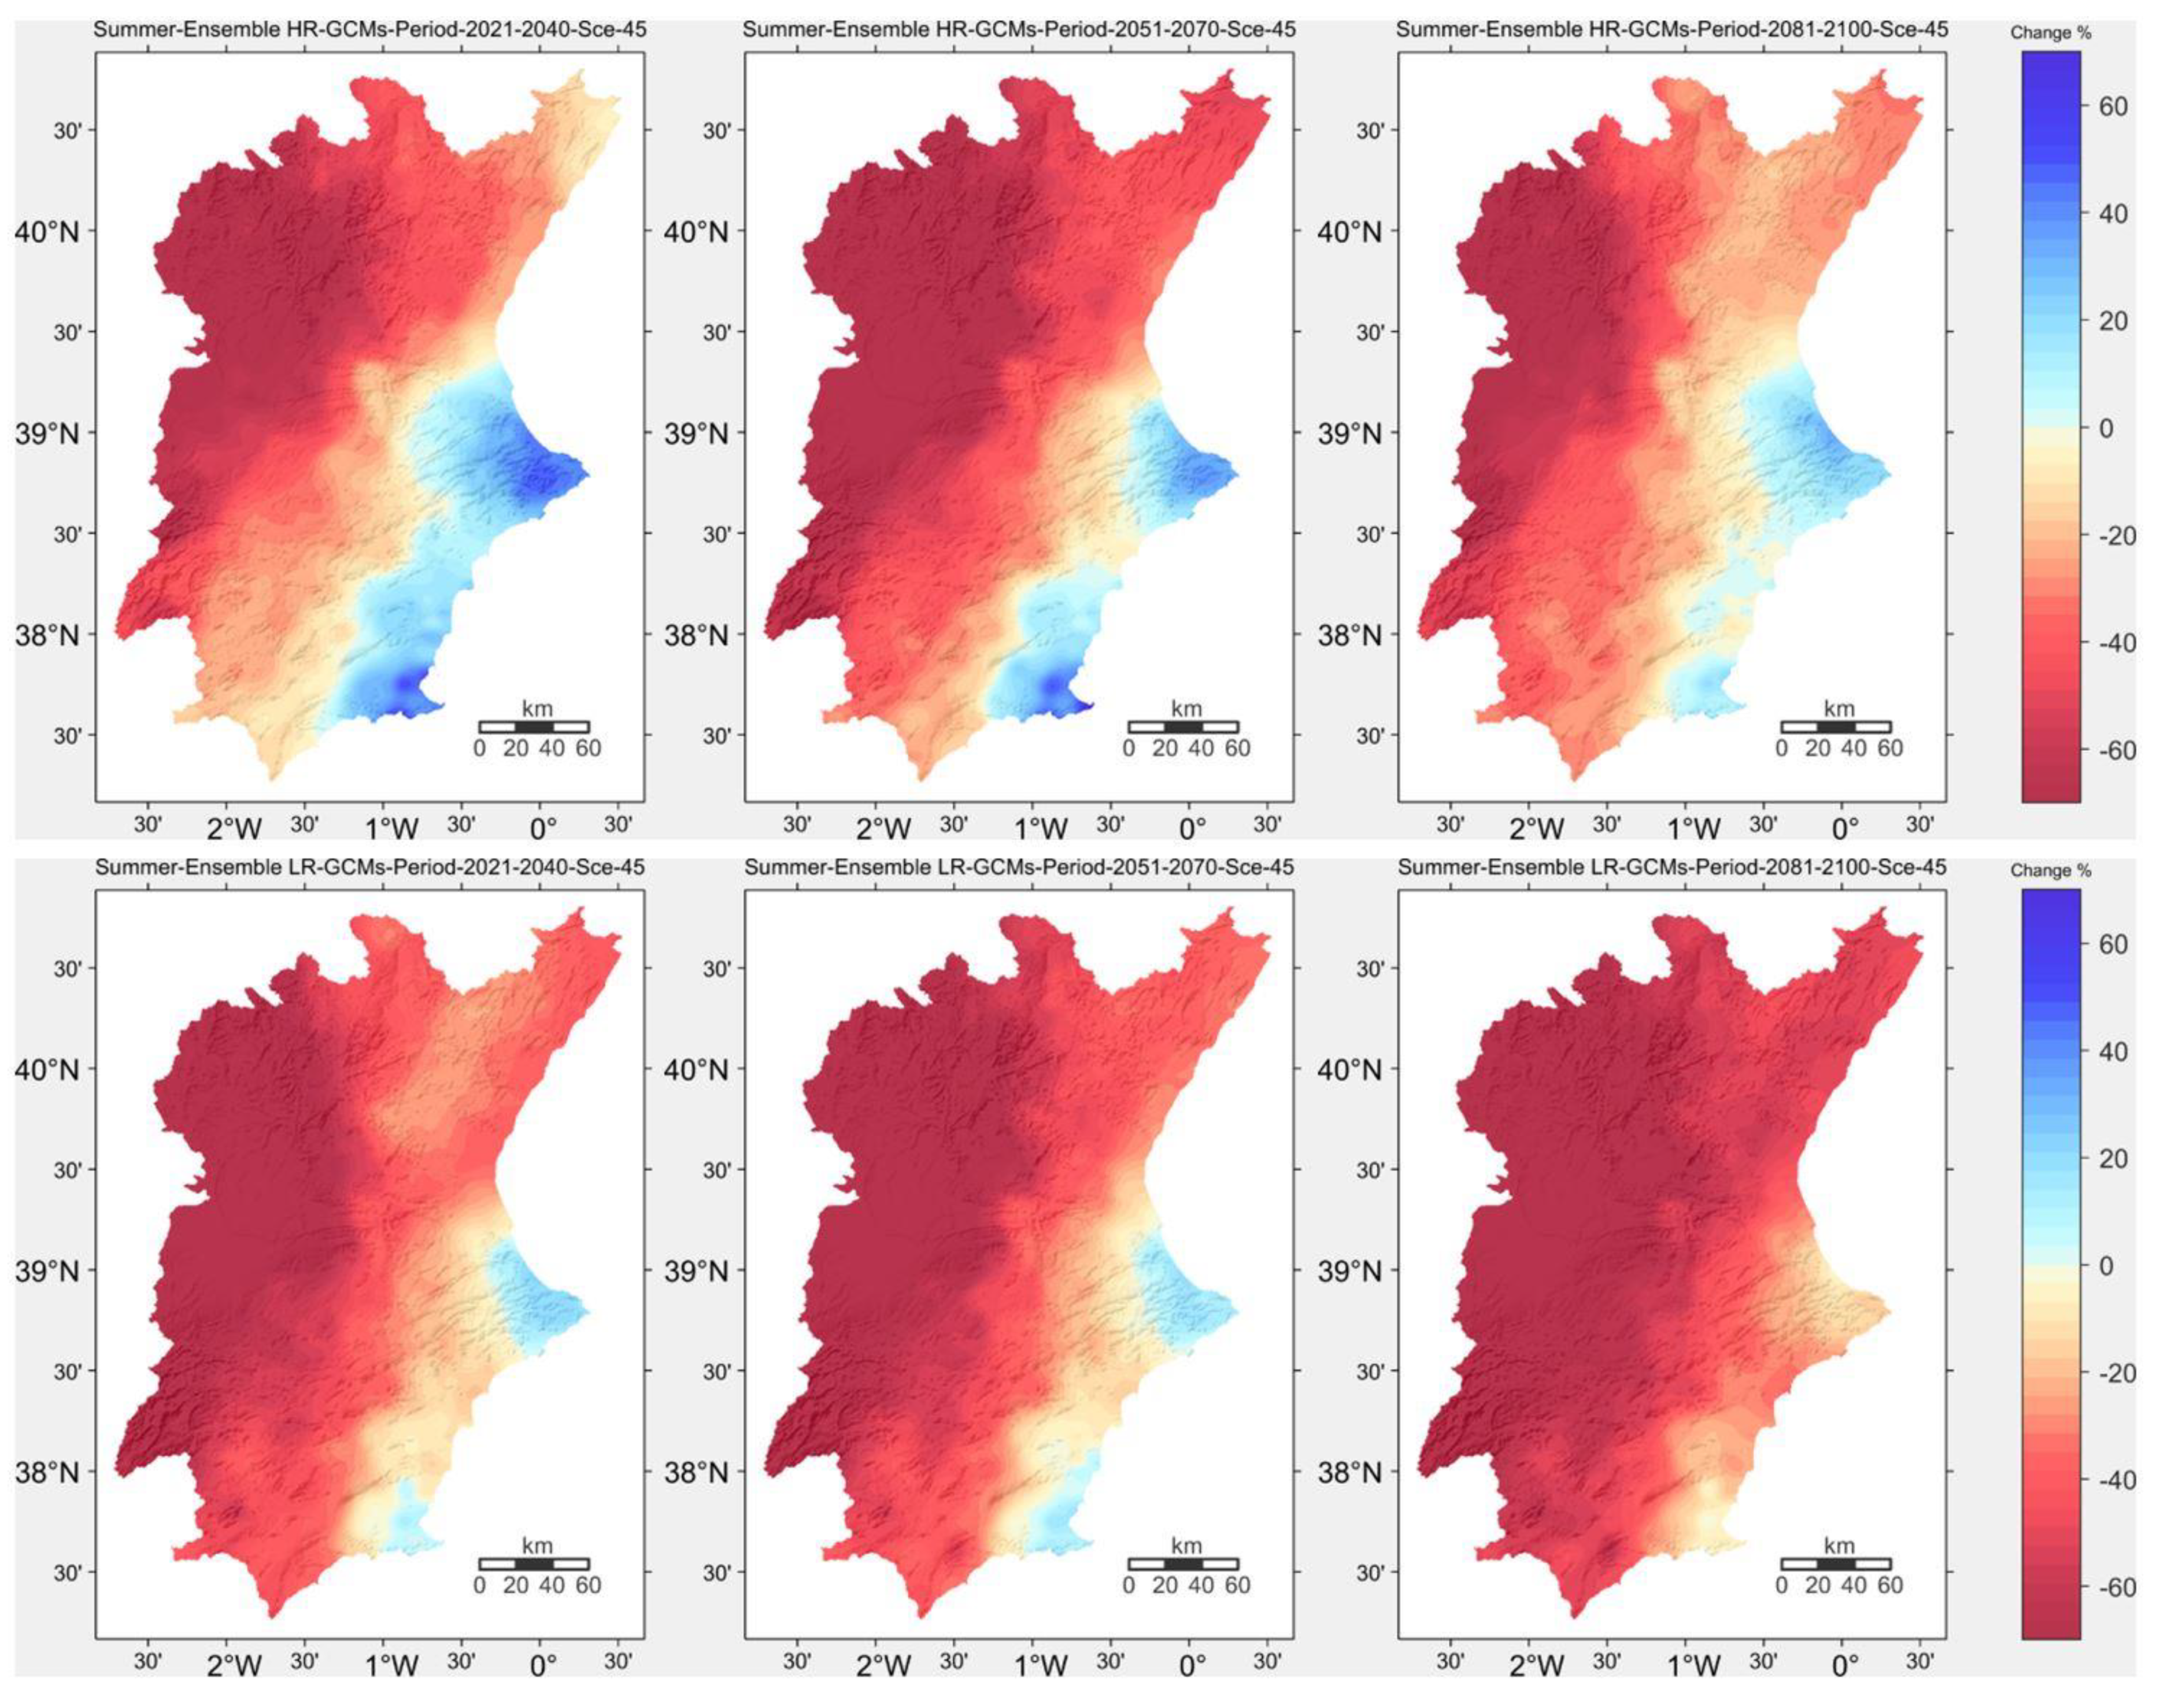
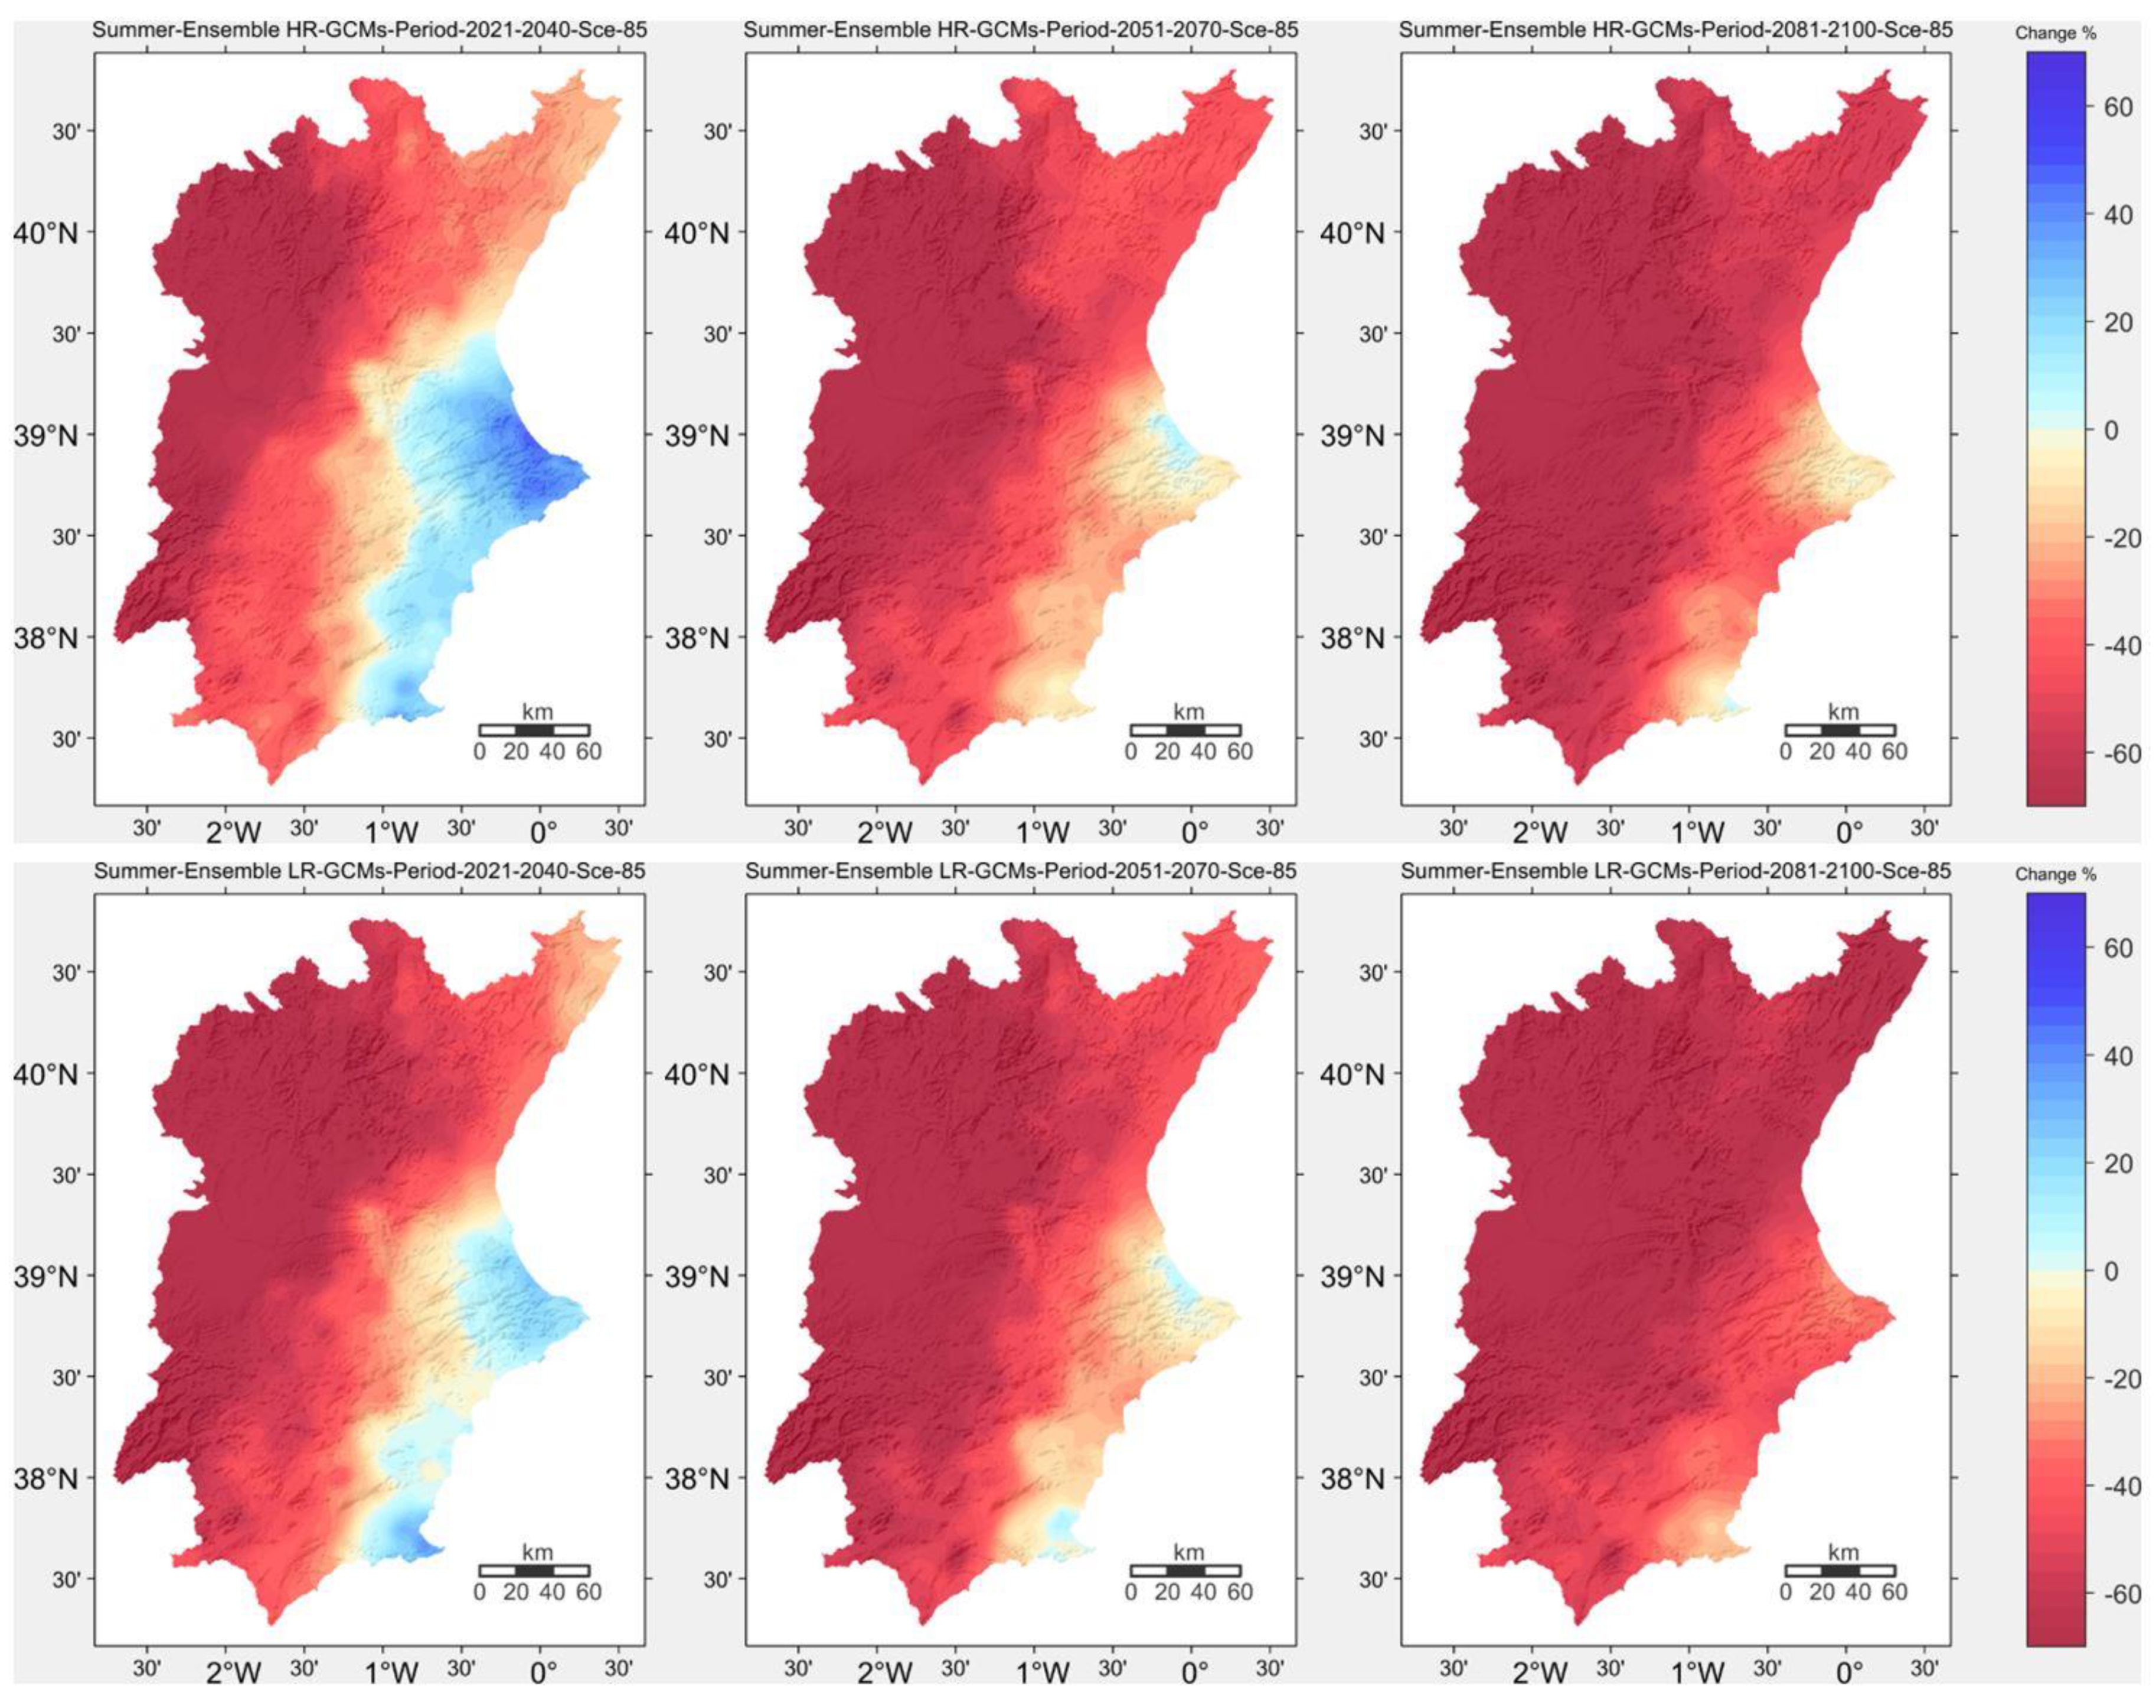
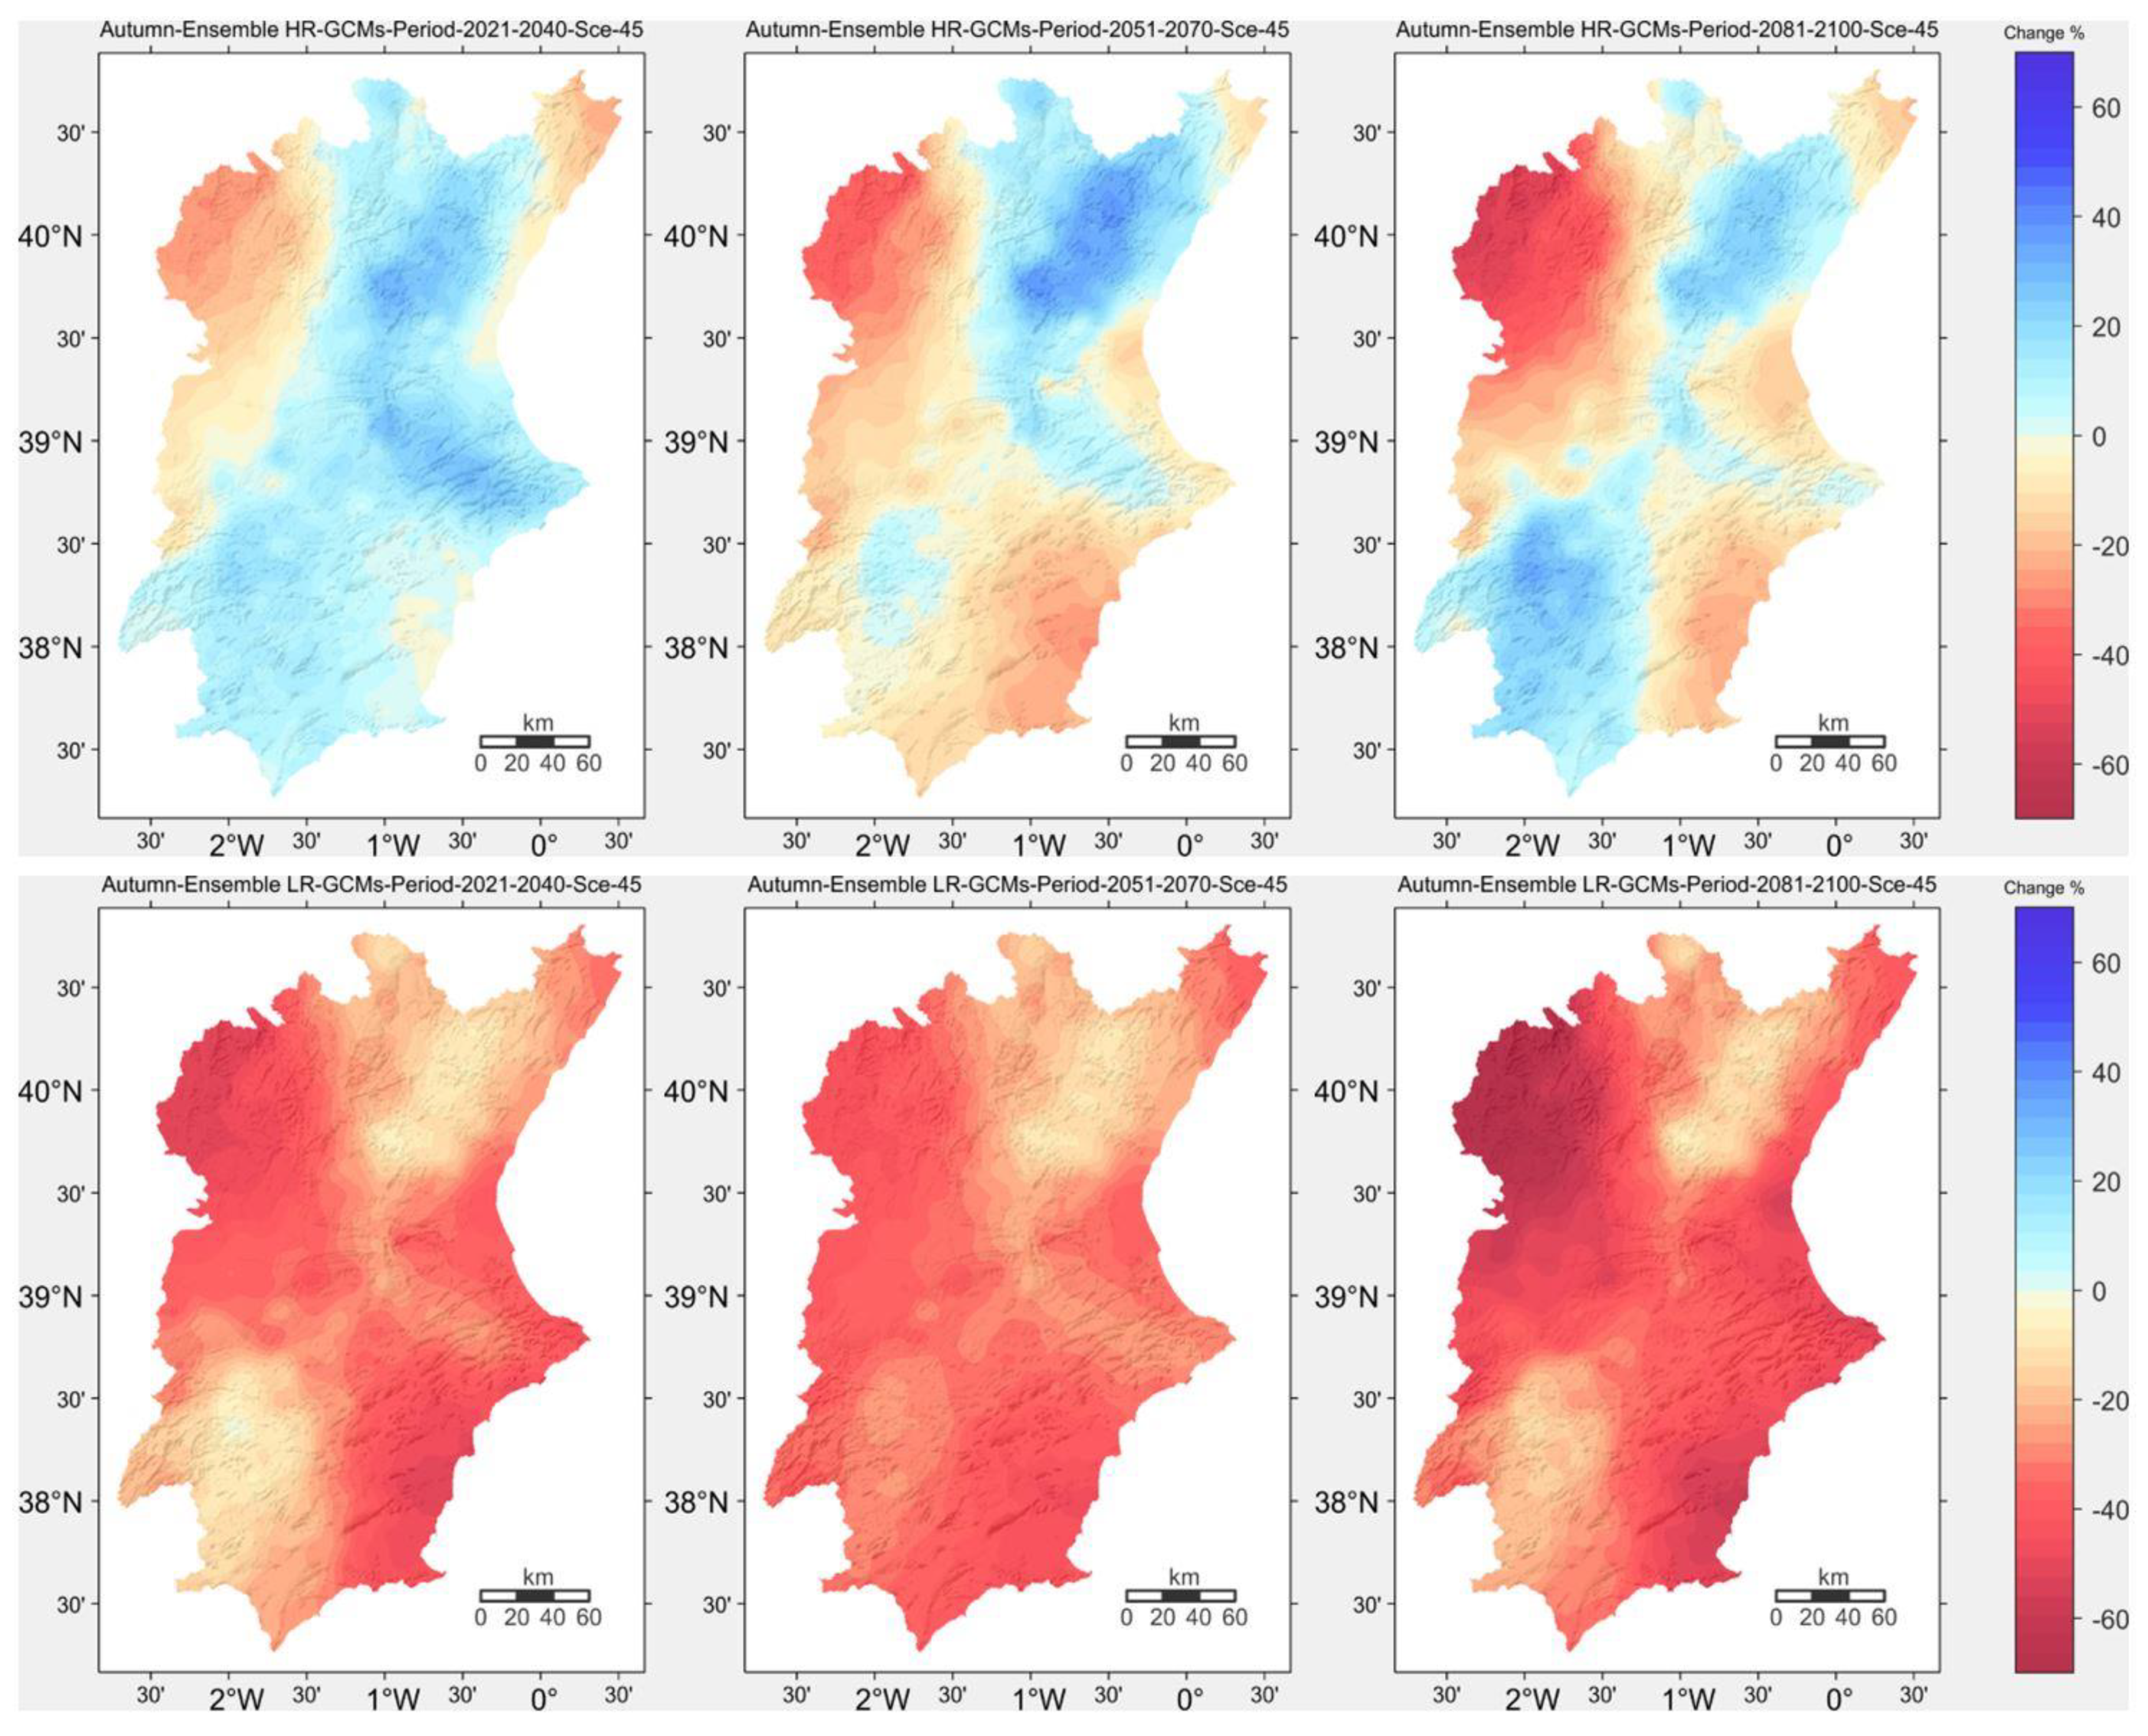
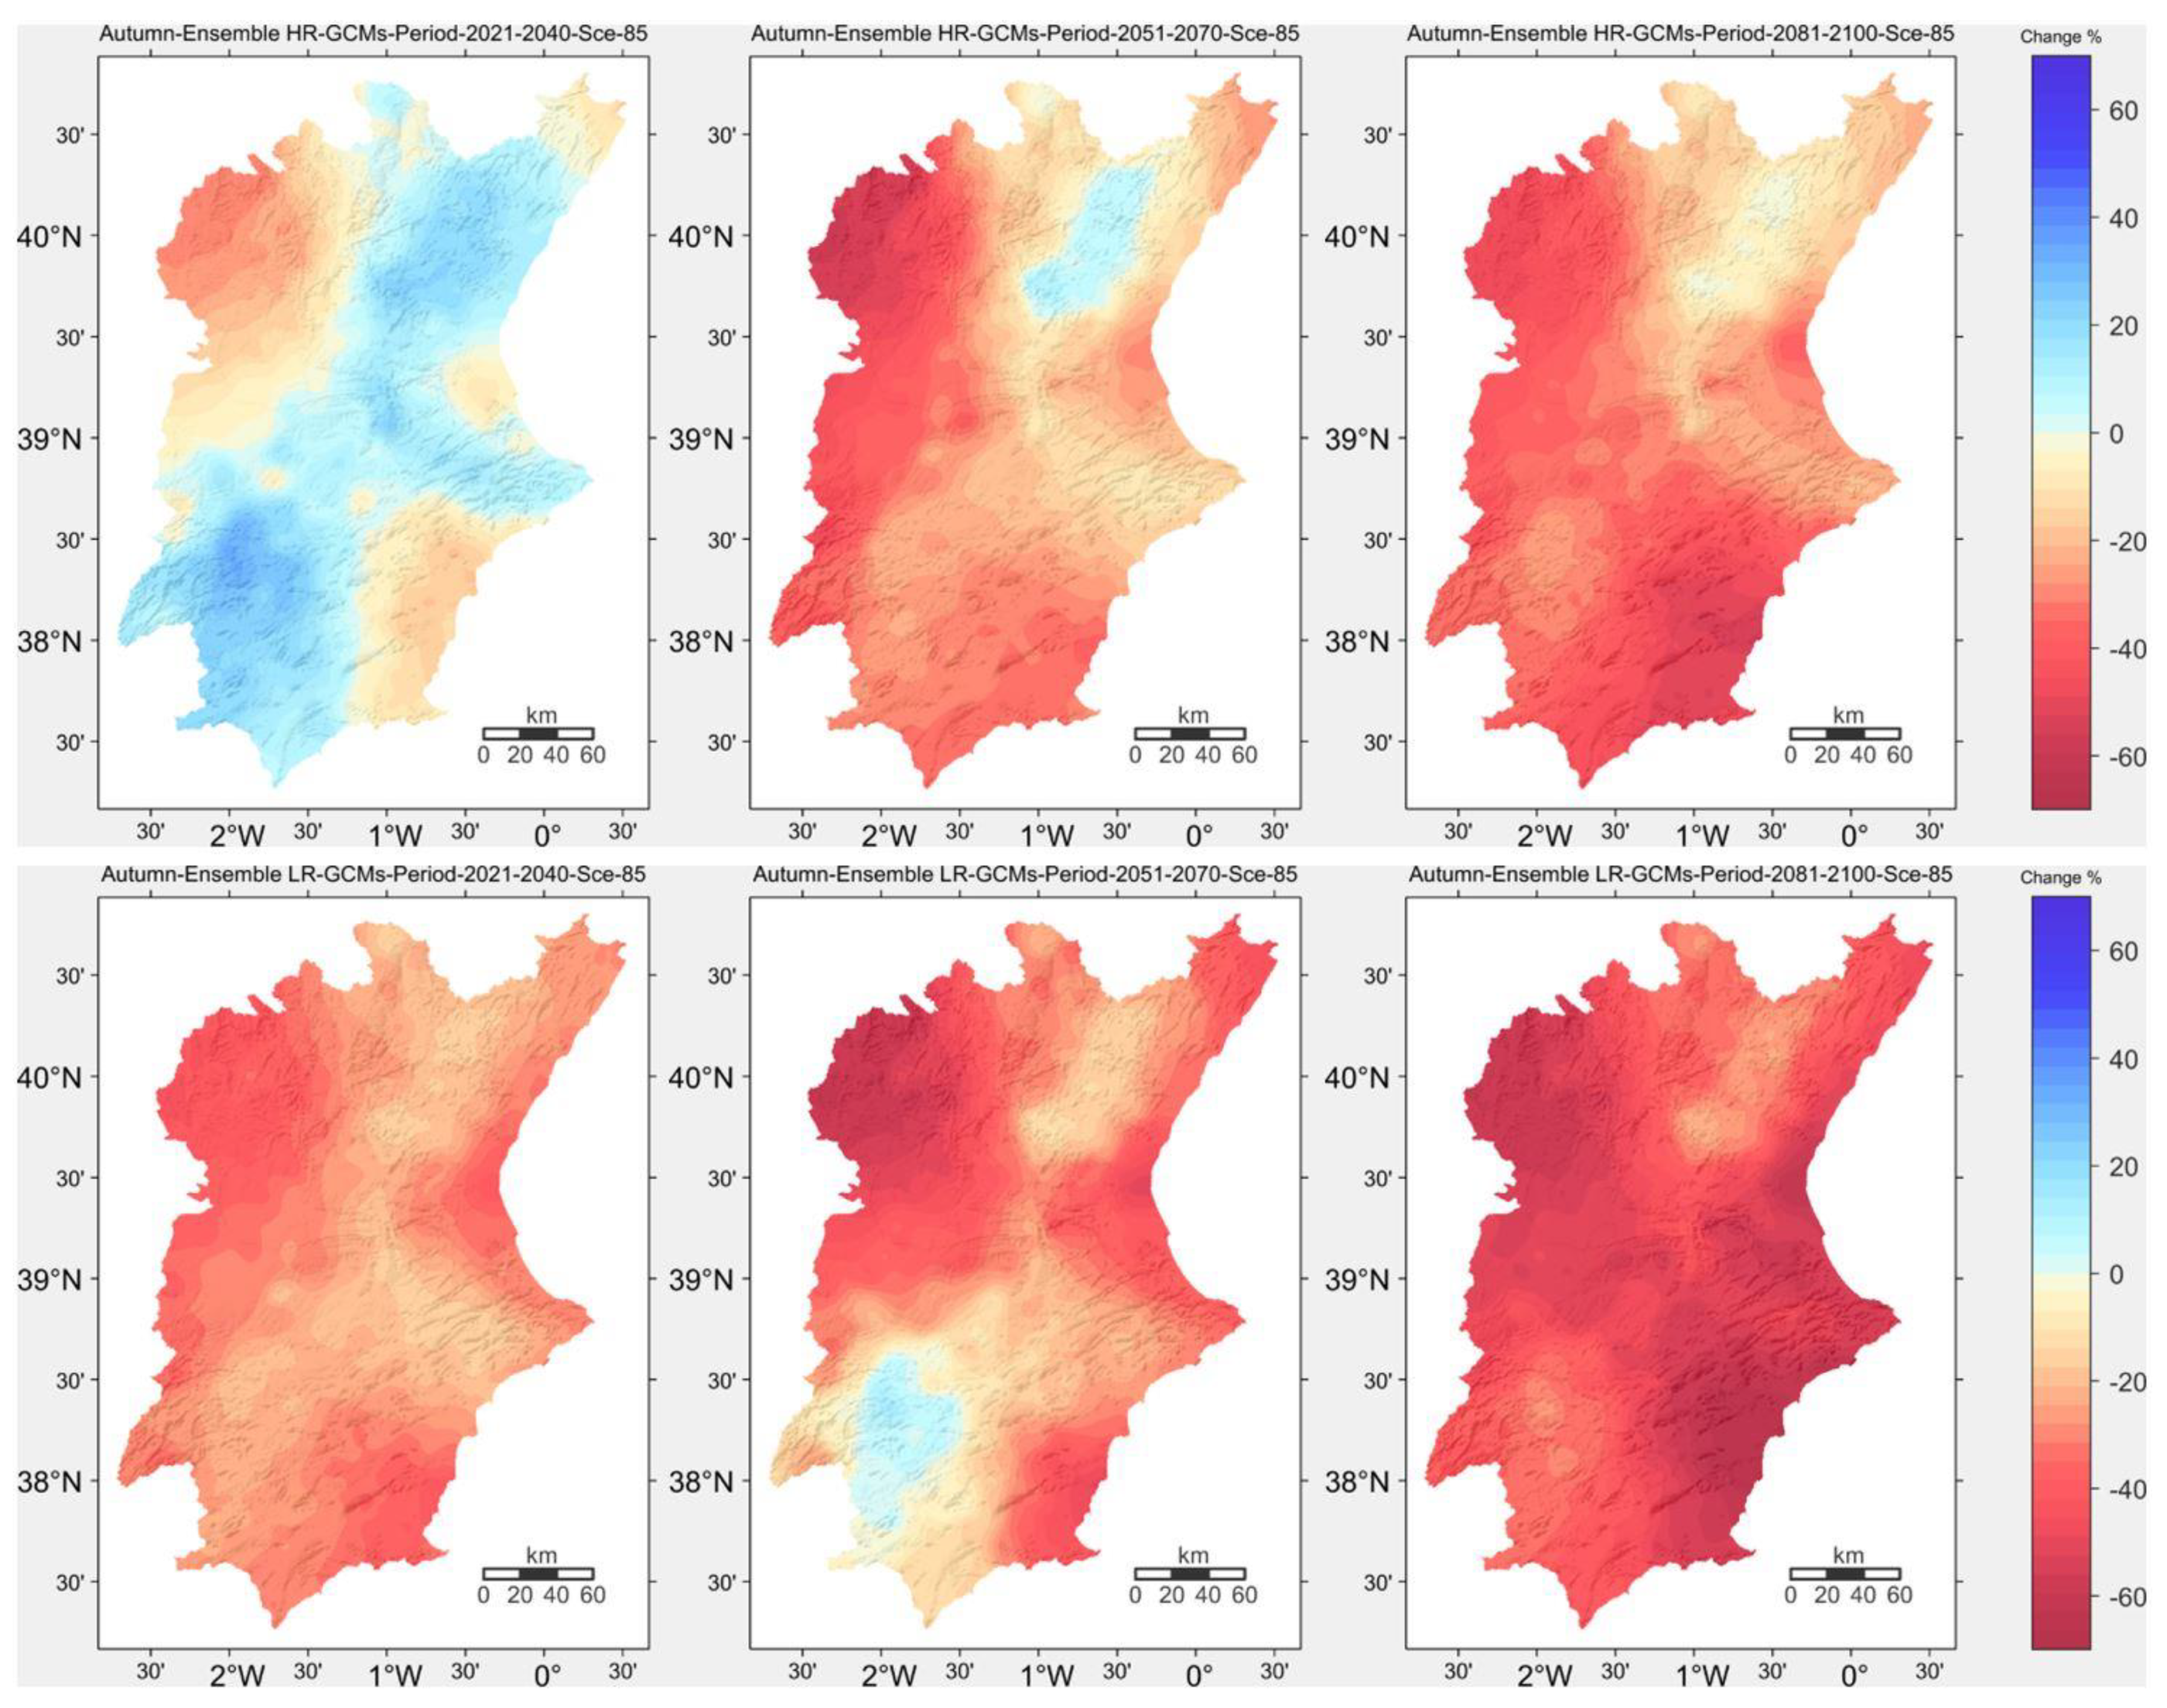
3.2. Spatial Changes Projected for Seasonal Rainfall
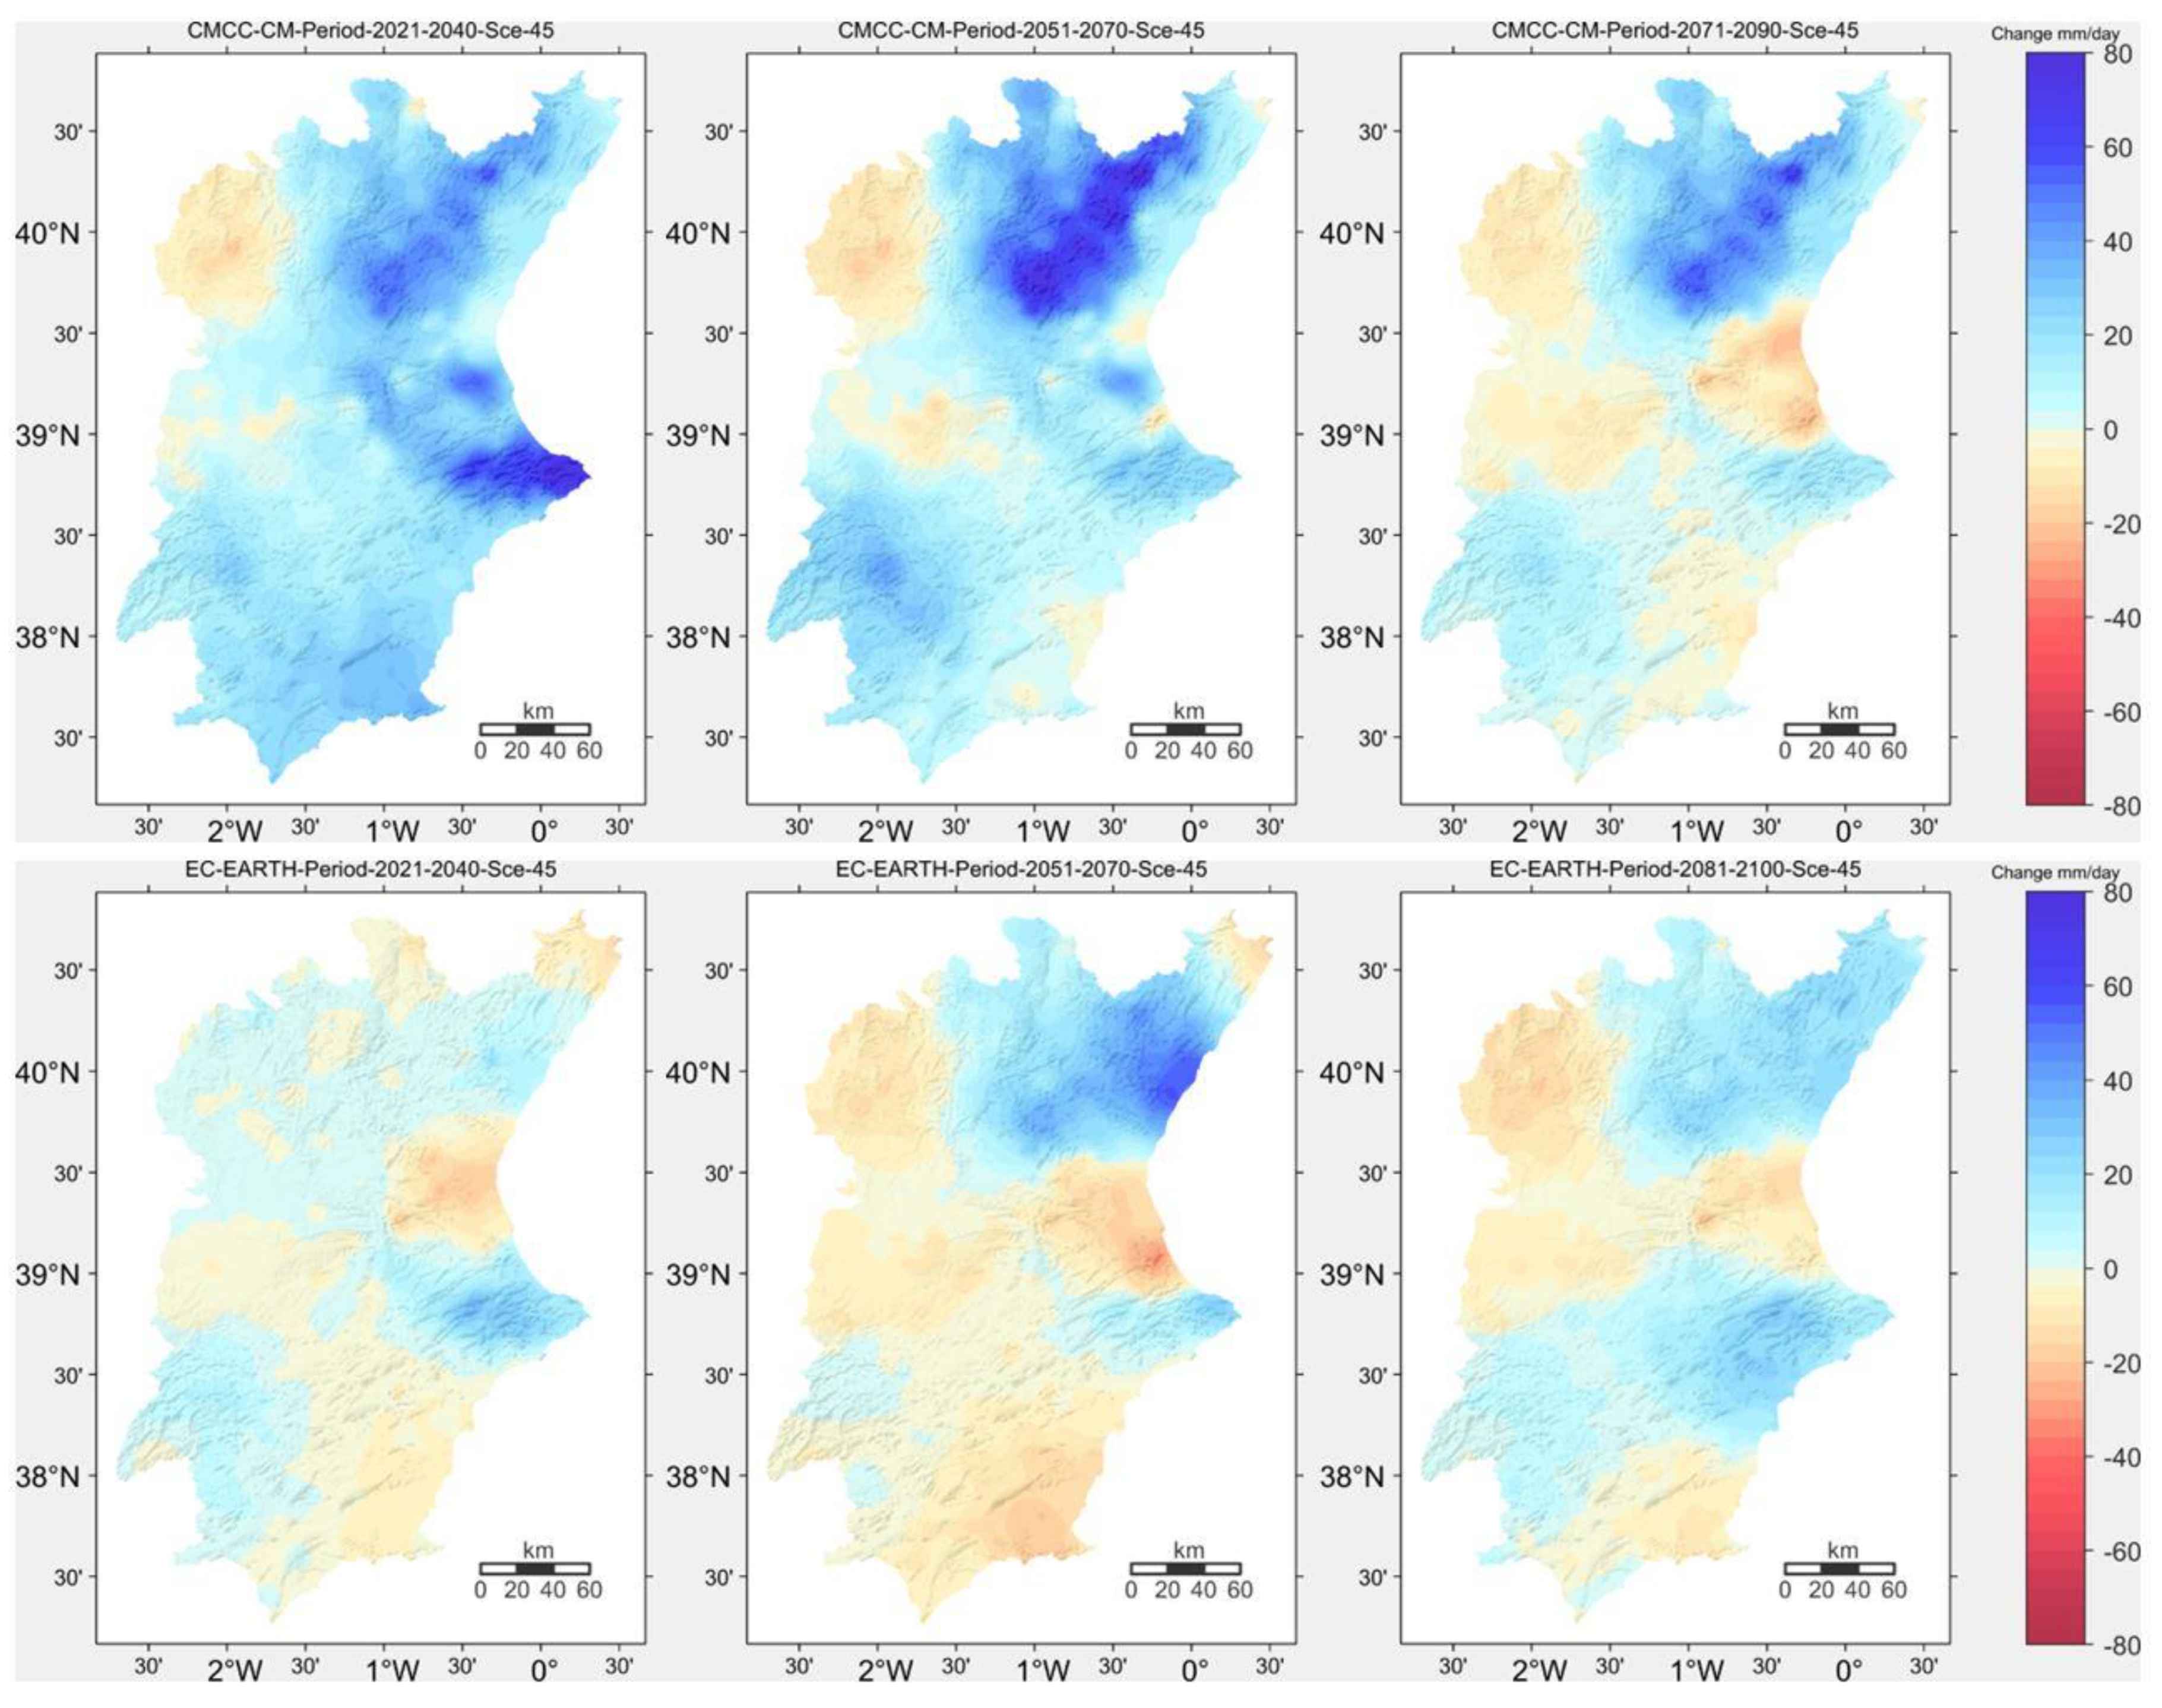
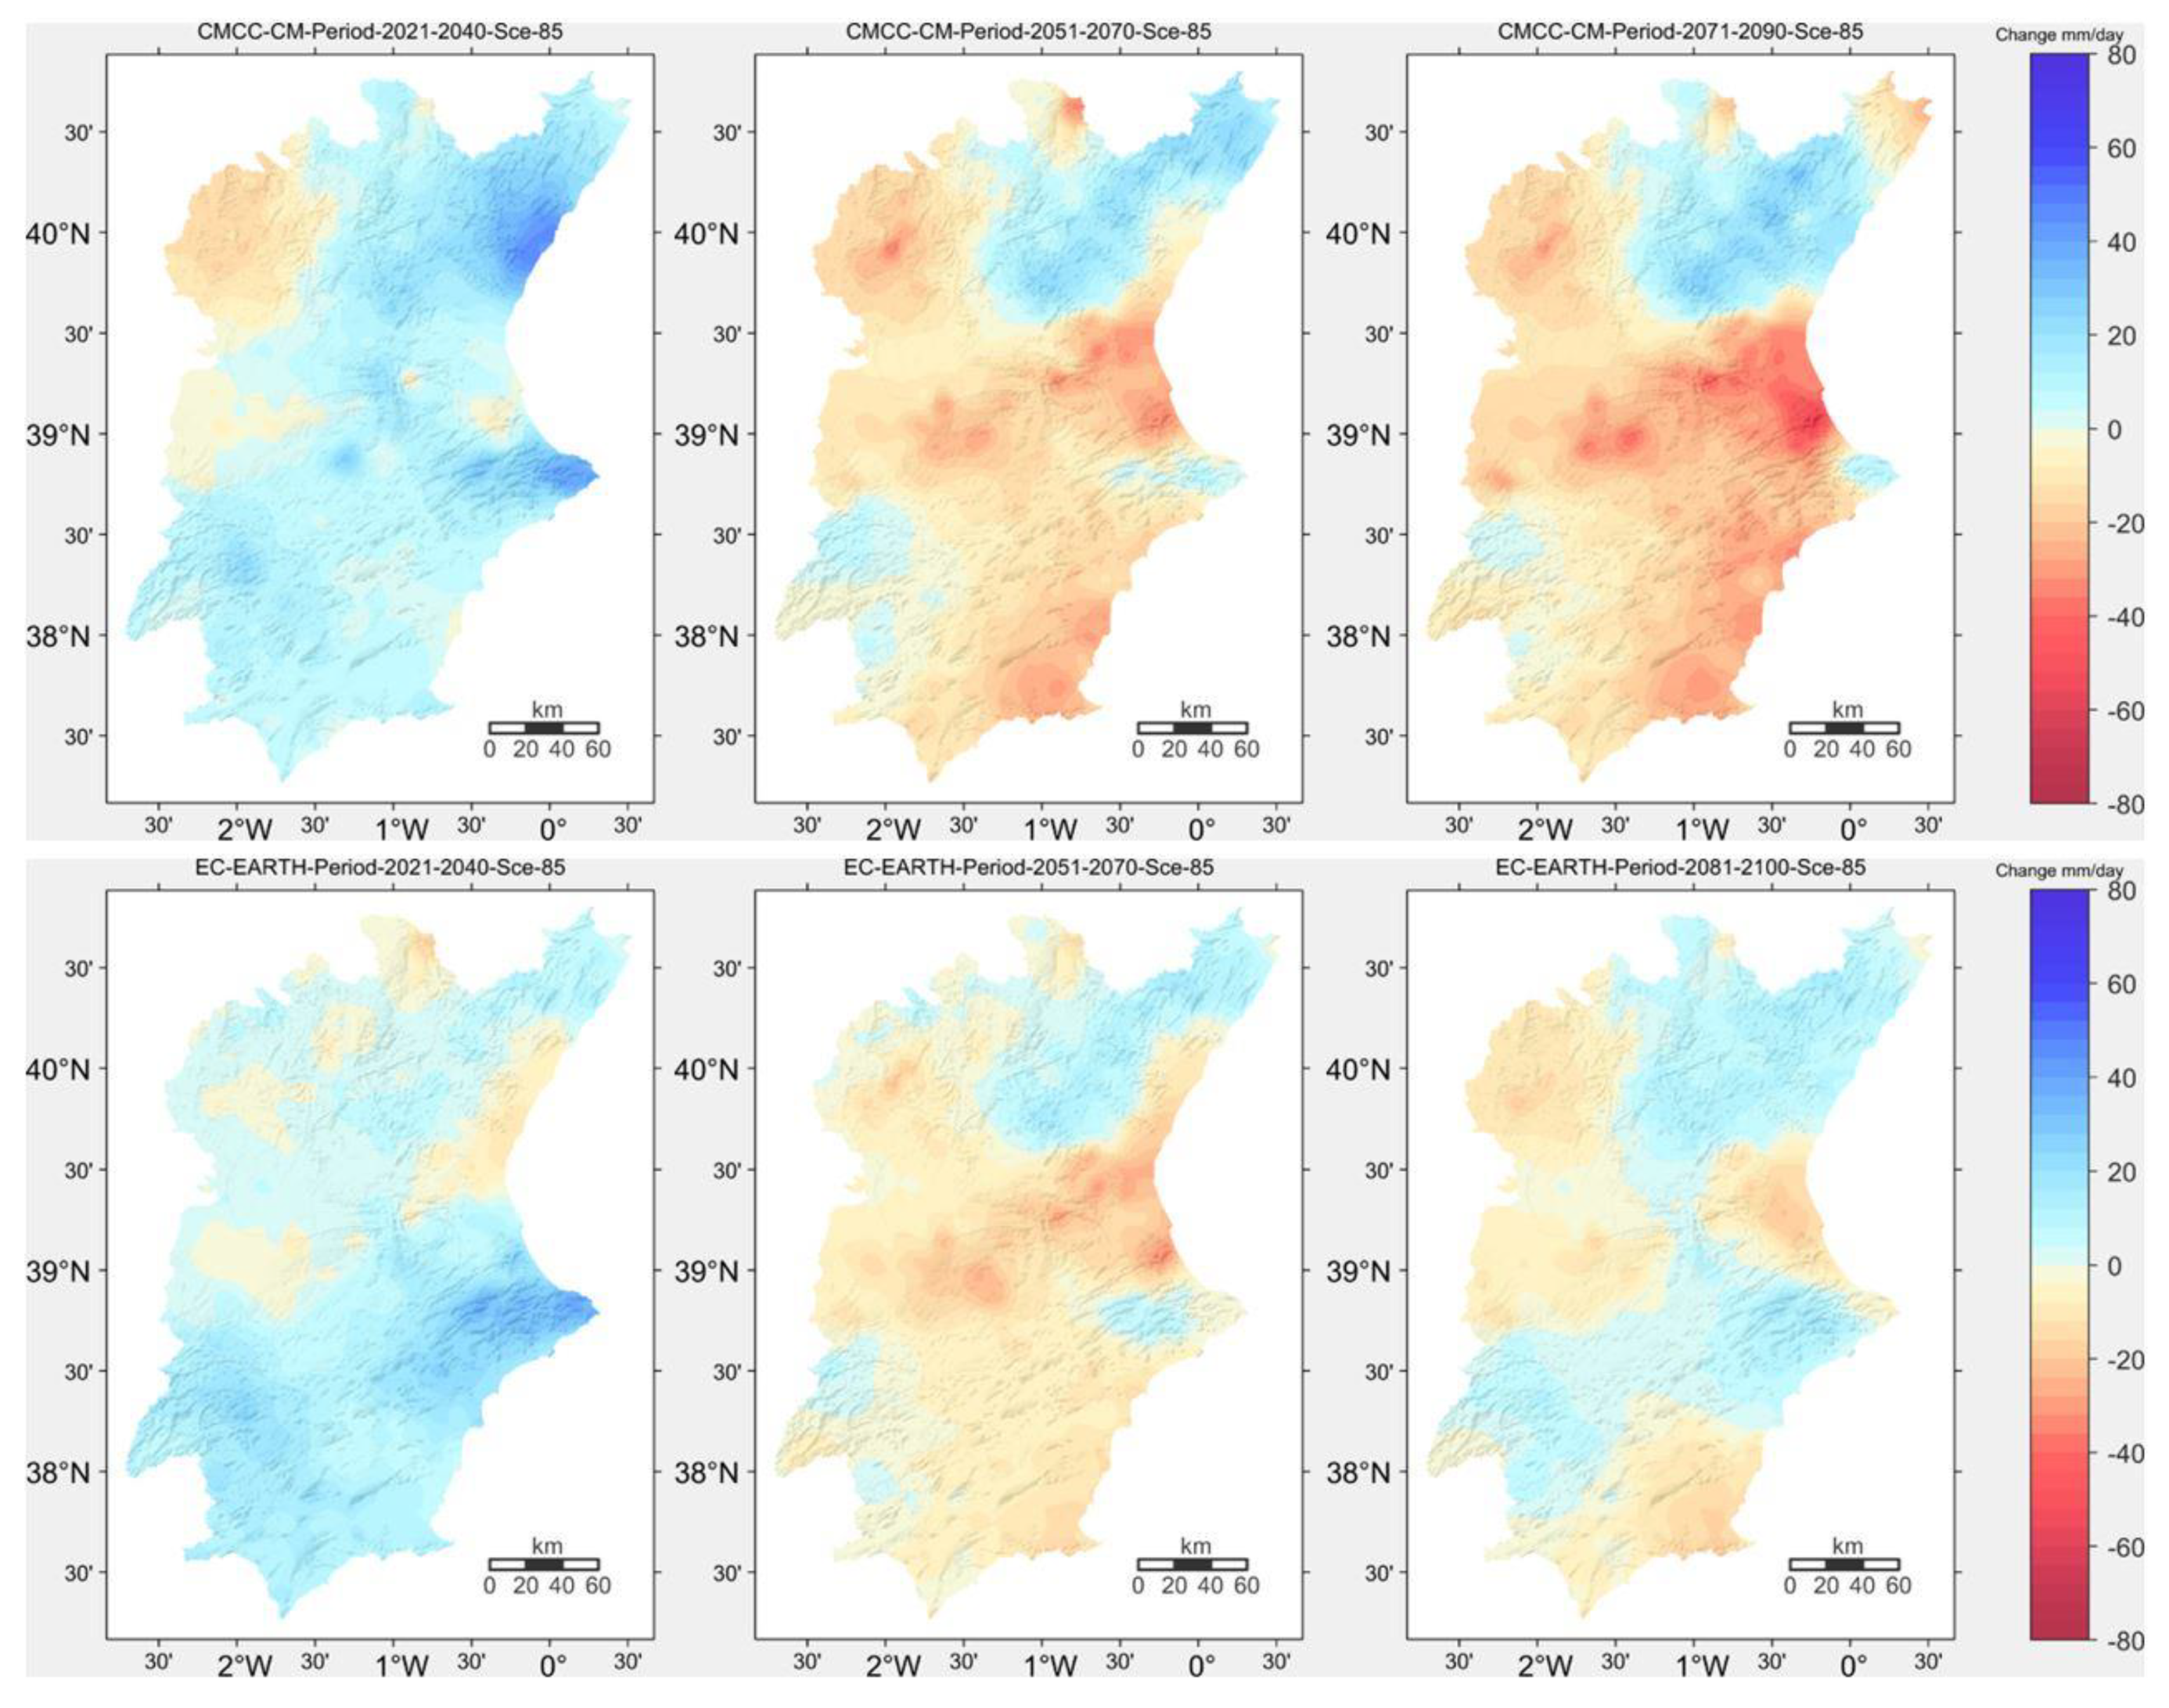
3.3. Spatial Changes Projected for Extreme Rainfall (Pctile ≥ 99.9)
3.4. Spatial Changes Projected for Annual Maximum Dry Spell Length
4. Discussion
5. Conclusions
- −
- A trend towards greater irregularity and pluviometric torrential rain in the short term is foreseen, along with loss of precipitation in the long term. This is coherent with the analysis performed on the increased intensity of precipitations for the Mediterranean littoral overall;
- −
- Clear spatial differences, along with greater pluviometric loss towards inland headwaters where the main rivers supplying the region rise. This loss appears in the short term and is aggravated in the long term. In some littoral areas in the Júcar and Segura River Basins, annual and seasonal precipitations increase (especially in autumn) in relation to the higher frequency of rainfall storms with sea flows, which have already been noted in recent decades;
- −
- In seasonal terms, greater losses in precipitation are projected for spring and summer. However, reduced rainfall in the Júcar headwaters is found even in winter, which will be aggravated throughout this century, and will become a matter of concern for emission scenario RCP8.5;
- −
- Trend towards prolonged drought periods;
- −
- Coherent results with ongoing trends previously noted in the past for the same study area in the work of Miró et al. [38];
- −
- The high-resolution climate modeling results allow graphical and cartographical outputs to be obtained on a detailed scale, which is very useful for land and town planning and for water resource management. This aspect will substantially develop in forthcoming years in line with complying with certain contents in State and Spanish Autonomous Community laws on climate change and with plans to adapt to climate change at a local (municipal) scale.
Author Contributions
Funding
Institutional Review Board Statement
Informed Consent Statement
Data Availability Statement
Conflicts of Interest
References
- Swiss Re. Catástrofes Naturales en Tiempos de Acumulación Económica y Riesgos Climáticos. Informes Sigma 2/2020. Available online: https://www.swissre.com/institute/research/sigma-research/sigma-2020-02.html (accessed on 3 July 2021).
- Giorgi, F. Climate Change Hot-Spots. Geophys. Res. Lett. 2006, 33, L08707. [Google Scholar] [CrossRef]
- Cramer, W.; Guiot, J.; Fader, M.; Garrabou, J.; Gattuso, J.-P.; Iglesias, A.; Lange, M.A.; Lionello, P.; Llasat, M.C.; Paz, S.; et al. Climate change and interconnected risks to sustainable development in the Mediterranean. Nat. Clim. Chang. 2018, 8, 972–980. [Google Scholar] [CrossRef] [Green Version]
- WHO. Deaths Related to Flooding per Million Inhabitants (Cumulative over the Period 1991–2015, with Respect to 2015 Population). Map Format. 2016. Available online: https://www.eea.europa.eu/data-and-maps/figures/people-per-million-population-affected-4 (accessed on 3 July 2021).
- Mediterranean Experts on Climate and Environmental Change (MedECC); Union for the Mediterranean; Plan Bleu (UNEP/MAP Regional Activity Center). Risks Associated to Climate and Environmental Changes in the Mediterranean Region. A Preliminary Assessment by the MedECC Network Science-Policy Interface—2019; UNEP/MAP Regional Activity Center: Marseille, France, 2019. [Google Scholar]
- Held, I.M.; Soden, B.J. Robust responses of the hydrological cycle to global warming. J. Clim. 2006, 19, 5686–5699. [Google Scholar] [CrossRef]
- Frauenfeld, O.W.; Davis, R.E. Northern Hemisphere circumpolar vortex trends and climate change implications. J. Geophys. Res. Atmos. 2003, 108, 4423. [Google Scholar] [CrossRef]
- Trenberth, K.E.; Jones, P.D.; Ambenje, P.; Bojariu, R.; Easterling, D.; Klein Tank, A.; Parker, D.; Rahimzadeh, F.; Renwick, J.A.; Rusticucci, M.; et al. Observations: Surface and Atmospheric Climate Change. 2007. Available online: https://www.ipcc.ch/site/assets/uploads/2018/02/ar4-wg1-chapter3-1.pdf (accessed on 3 July 2021).
- Barcikowska, M.J.; Kapnick, S.; Feser, F. Impact of large-scale circulation changes in the North Atlantic sector on the current and future Mediterranean winter hydroclimate. Clim. Dyn. 2018, 50, 2039–2059. [Google Scholar] [CrossRef]
- Zappa, G. Regional Climate Impacts of Future Changes in the Mid–Latitude Atmospheric Circulation: A Storyline View. Curr. Clim. Chang. Rep. 2019, 5, 358–371. [Google Scholar] [CrossRef] [Green Version]
- Sánchez, E.; Domínguez, M.; Romera, R.; López-Franca, N.; Gaertner, M.A.; Gallardo, C.; Castro, M. Regional modeling of dry spells over the Iberian Peninsula for present climate and climate change conditions. Clim. Chang. 2011, 107, 625–634. [Google Scholar] [CrossRef]
- González-Hidalgo, J.C.; De Luis, M.; Raventós, J.; Sánchez, J.R. Daily rainfall trend in the Valencia region of Spain. Theor. Appl. Climatol. 2003, 75, 117–130. [Google Scholar] [CrossRef]
- De Luis, M.; González-Hidalgo, J.C.; Brunetti, M.; Longares, L.A. Precipitation concentration changes in Spain 1946–2005. Nat. Hazards Earth Syst. Sci. 2011, 11, 1259–1265. [Google Scholar] [CrossRef] [Green Version]
- De Luis, M.; González-Hidalgo, J.C.; Longares, L.A.; Štepánek, P. Seasonal Precipitation trends in the Mediterranean Iberian Peninsula in second half of 20th century. Int. J. Climatol. 2009, 29, 1312–1323. [Google Scholar] [CrossRef]
- De Luis, M.; Brunetti, M.; Gonzalez-Hidalgo, J.C.; Longares, L.A.; Martin-Vide, J. Changes in seasonal precipitation in the Iberian Peninsula during 1946–2005. Glob. Planet. Chang. 2010, 74, 27–33. [Google Scholar] [CrossRef]
- González-Hidalgo, J.C.; López-Bustins, J.A.; Štepánek, P.; Martín-Vide, J.; De Luis, M. Monthly precipitation trends on the Mediterranean fringe of the Iberian Peninsula during the second half of the 20th century (1951–2000). Int. J. Climatol. 2009, 29, 1415–1429. [Google Scholar] [CrossRef]
- López-Moreno, J.I.; Vicente-Serrano, S.M.; Gimeno, L.; Nieto, R. Stability of the seasonal distribution of precipitation in the Mediterranean region: Observations since 1950 and projections for the 21st century. Geophys. Res. Lett. 2009, 36, L10703. [Google Scholar] [CrossRef] [Green Version]
- Bladé, I.; Cacho, I.; Castro-Díez, Y.; Gomis, D.; González-Sampériz, P.; Miguez-Macho, G.; Perez Fiz, F.; Rodríguez-Fonseca, B.; Rodríguez-Puebla, C.; Sánchez, E.; et al. Tendencias Atmosfericas en la Peninsula Iberica durante el Periodo Instrumental en el Contexto de la Variabilidad Natural. In Clima en España: Pasado, Presente y Futuro; Perez, F., Boscoso, R., Eds.; Red Tematica CLIVAR-ESPANA: Madrid, Spain, 2010; pp. 25–42. Available online: http://digital.csic.es/handle/10261/23600?locale=en (accessed on 3 July 2021).
- Del Río, S.; Herrero, L.; Fraile, R.; Penas, A. Spatial distribution of recent rainfall trends in Spain (1961–2006). Int. J. Climatol. 2011, 31, 656–667. [Google Scholar] [CrossRef]
- Serra, C.; Burgueño, A.; Martínez, M.D.; Lana, X. Trends in dry spells across Catalonia (NE Spain) during the second half of the 20th century. Theor. Appl. Climatol. 2006, 85, 165. [Google Scholar] [CrossRef]
- Millán, M.M.; Estrela, M.J.; Miró, J.J. Rainfall Components: Variability and Spatial Distribution in a Mediterranean Area (Valencia Region). J. Clim. 2005, 18, 2682–2705. [Google Scholar] [CrossRef]
- Miró, J.J.; Estrela, M.J.; Pastor, F.; Millán, M. Análisis comparativo de tendencias en la precipitación, por distintos inputs, entre los dominios hidrológicos del Segura y del Júcar (1958–2008). Investig. Geogr. 2009, 49, 129–157. [Google Scholar] [CrossRef] [Green Version]
- Miró, J.J.; Estrela, M.J.; Olcina-Cantos, J. Statistical downscaling and attribution of air temperature change patterns in the Valencia region (1948–2011). Atmos. Res. 2015, 156, 189–212. [Google Scholar] [CrossRef] [Green Version]
- Fovargue, R.E.; Rezapour, S.; Rosendahl, D.; Wootten, A.M.; Sabzi, H.Z.; Moreno, H.A.; Neeson, T.M. Spatial planning for water sustainability projects under climate uncertainty: Balancing human and environmental water needs. Environ. Res. Lett. 2021, 16, 034050. [Google Scholar] [CrossRef]
- Kharel, G.; Kirilenko, A. Comparing CMIP-3 and CMIP-5 climate projections on flooding estimation of Devils Lake of North Dakota, USA. PeerJ 2018, 6, e4711. [Google Scholar] [CrossRef]
- Navarro-Racines, C.E.; Tarapues, J.; Thornton, P.; Jarvis, A.; Ramirez-Villegas, J. High-resolution and bias-corrected CMIP5 projections for climate change impact assessments. Sci. Data 2020, 7, 7. [Google Scholar] [CrossRef] [Green Version]
- Zhao, L.; Oleson, K.; Bou-Zeid, E.; Krayenhoff, E.S.; Bray, A.; Zhu, Q.; Zheng, Z.; Chen, C.; Oppenheimer, M. Global multi-model projections of local urban climates. Nat. Clim. Chang. 2021, 11, 152–157. [Google Scholar] [CrossRef]
- Gebhardt, O.; Meyer, M. EU FP-7 Project “Bottom-up Climate Adaptation Strategies towards a Sustainable Europe—BASE” and Projektgruppe “Campus Inselplatz”. 2020. Available online: https://climate-adapt.eea.europa.eu/metadata/case-studies/mainstreaming-climate-change-adaptation-into-urban-planning-greyfield-land-redevelopment-in-jena-germany/#source (accessed on 3 July 2021).
- Mishra, B.; Emam, A.R.; Masago, Y.; Kumar, P.; Regmi, R.K.; Fukushi, K. Assessment of future flood inundations under climate and land use change scenarios in the Ciliwung River Basin, Jakarta. J. Flood Risk Manag. 2018, 11, S1105–S1115. [Google Scholar] [CrossRef]
- Hassan, I.; Kalin, R.M.; White, C.J.; Aladejana, J.A. Selection of CMIP5 GCM Ensemble for the Projection of Spatio-Temporal Changes in Precipitation and Temperature over the Niger Delta, Nigeria. Water 2020, 12, 385. [Google Scholar] [CrossRef] [Green Version]
- Blenkinsop, S.; Harpham, C.; Burton, A.; Goderniaux, P.; Brouyère, S.; Fowler, H.J. Downscaling transient climate change with a stochastic weather generator for the Geer catchment, Belgium. Clim. Res. 2013, 57, 95–109. [Google Scholar] [CrossRef] [Green Version]
- Burton, A.; Fowler, H.; Blenkinsop, S.; Kilsby, C. Downscaling transient climate change using a Neyman–Scott Rectangular Pulses stochastic rainfall model. J. Hydrol. 2010, 381, 18–32. [Google Scholar] [CrossRef]
- De Luca, D.L.; Petroselli, A.; Galasso, L. A Transient Stochastic Rainfall Generator for Climate Changes Analysis at Hydrological Scales in Central Italy. Atmosphere 2020, 11, 1292. [Google Scholar] [CrossRef]
- Kilsby, C.; Jones, P.; Burton, A.; Ford, A.; Fowler, H.; Harpham, C.; James, P.; Smith, A.; Wilby, R. A daily weather generator for use in climate change studies. Environ. Model. Softw. 2007, 22, 1705–1719. [Google Scholar] [CrossRef]
- Onof, C.; Arnbjerg-Nielsen, K. Quantification of anticipated future changes in high resolution design rainfall for urban areas. Atmos. Res. 2009, 92, 350–363. [Google Scholar] [CrossRef]
- Rodríguez, E.; Gutiérrez, J.R. (coords). Escenarios-PNACC 2017: Nueva Colección de Escenarios de Cambio Climático Regionalizados del Plan Nacional de Adaptacioń al Cambio Climático (PNACC). V 1.0, AEMET. 2018. Available online: http://escenarios.adaptecca.es/doc/pnacc.pdf (accessed on 3 July 2021).
- Miró, J.J.; Caselles, V.; Estrela, M.J. Multiple imputation of rainfall missing data in the Iberian Mediterranean context. Atmos. Res. 2017, 197, 313–330. [Google Scholar] [CrossRef]
- Miró, J.J.; Estrela, M.J.; Caselles, V.; Gómez, I. Spatial and temporal rainfall changes in the Júcar and Segura basins (1955–2016): Fine-scale trends. Int. J. Climatol. 2018, 38, 4699–4722. [Google Scholar] [CrossRef]
- Benestad, R. Downscaling Climate Information. Oxford Research Encyclopedia of Climate Science. 2016. Available online: https://oxfordre.com/climatescience/view/10.1093/acrefore/9780190228620.001.0001/acrefore-9780190228620-e-27 (accessed on 29 June 2021). [CrossRef]
- Fan, X.; Miao, C.; Duan, Q.; Shen, C.; Wu, Y. The Performance of CMIP6 versus CMIP5 in Simulating Temperature Extremes over the Global Land Surface. J. Geophys. Res. Atmos. 2020, 125. [Google Scholar] [CrossRef]
- Khan, M.S.; Coulibaly, P.; Dibike, Y. Uncertainty analysis of statistical downscaling methods. J. Hydrol. 2006, 319, 357–382. [Google Scholar] [CrossRef]
- Samadi, S.; Wilson, C.; Moradkhani, H. Uncertainty analysis of statistical downscaling models using Hadley Centre Coupled Model. Theor. Appl. Clim. 2013, 114, 673–690. [Google Scholar] [CrossRef]
- Semenov, M.; Barrow, E. LARS-WG A Stochastic Weather Generator for Use in Climate Impact Studies. Clim. Chang. 2002, 35, 397–414. [Google Scholar] [CrossRef]
- Wilby, R.; Dawson, C.; Barrow, E. SDSM—A decision support tool for the assessment of regional climate change impacts. Environ. Model. Softw. 2002, 17, 145–157. [Google Scholar] [CrossRef]
- Hashmi, M.Z.; Shamseldin, A.Y.; Melville, B.W. Comparison of SDSM and LARS-WG for simulation and downscaling of extreme precipitation events in a watershed. Stoch. Environ. Res. Risk Assess. 2010, 25, 475–484. [Google Scholar] [CrossRef]
- Duan, K.; Mei, Y. A comparison study of three statistical downscaling methods and their model-averaging ensemble for precipitation downscaling in China. Theor. Appl. Clim. 2014, 116, 707–719. [Google Scholar] [CrossRef]
- Moghanlo, S.; Alavinejad, M.; Oskoei, V.; Saleh, H.N.; Mohammadi, A.A.; Mohammadi, H.; Derakhshan-Nejad, Z. Using artificial neural networks to model the impacts of climate change on dust phenomenon in the Zanjan region, north-west Iran. Urban Clim. 2021, 35, 100750. [Google Scholar] [CrossRef]
- Conte, D.; Gualdi, S.; Lionello, P. Effect of Model Resolution on Intense and Extreme Precipitation in the Mediterranean Region. Atmosphere 2020, 11, 699. [Google Scholar] [CrossRef]
- Brands, S.; Herrera, S.; Fernández, J.; Gutiérrez, J.M. How well do CMIP5 Earth System Models simulate present climate conditions in Europe and Africa? A performance comparison for the downscaling community. Clim. Dyn. 2013, 41, 803–817. [Google Scholar] [CrossRef] [Green Version]
- Perez, J.; Menendez, M.; Mendez, F.; Losada, I.J. Evaluating the performance of CMIP3 and CMIP5 global climate models over the north-east Atlantic region. Clim. Dyn. 2014, 43, 2663–2680. [Google Scholar] [CrossRef]
- McSweeney, C.F.; Jones, R.; Lee, R.; Rowell, D.P. Selecting CMIP5 GCMs for downscaling over multiple regions. Clim. Dyn. 2015, 44, 3237–3260. [Google Scholar] [CrossRef] [Green Version]
- Noël, T.; Loukos, H.; Defrance, D.; Vrac, M.; Levavasseur, G. A high-resolution downscaled CMIP5 projections dataset of essential surface climate variables over the globe coherent with the ERA5 reanalysis for climate change impact assessments. Data Brief. 2021, 35, 106900. [Google Scholar] [CrossRef]
- Hempel, S.; Frieler, K.; Warszawski, L.; Schewe, J.; Piontek, F. A trend-preserving bias correction: The ISI-MIP approach. Earth Syst. Dyn. 2013, 4, 219–236. [Google Scholar] [CrossRef] [Green Version]
- Reale, M.; Lionello, P. Synoptic climatology of winter intense precipitation events along the Mediterranean coasts. Nat. Hazards Earth Syst. Sci. 2013, 13, 1707–1722. [Google Scholar] [CrossRef]
- Pastor, F.; Valiente, J.; Khodayar, S. A Warming Mediterranean: 38 Years of Increasing Sea Surface Temperature. Remote Sens. 2020, 12, 2687. [Google Scholar] [CrossRef]
- Greco, A.; De Luca, D.L.; Avolio, E. Heavy Precipitation Systems in Calabria Region (Southern Italy): High-Resolution Observed Rainfall and Large-Scale Atmospheric Pattern Analysis. Water 2020, 12, 1468. [Google Scholar] [CrossRef]
- Miró, J.J.; Estrela, M.J.; Olcina-Cantos, J. Reconstrucción de la señal térmica local en la Comunidad Valenciana entre 1948 y 2011 a partir de un downscaling estadístico mediante una red neuronal artificial: Detección de patrones locales de cambio. Bol. Asoc. Geogr. Esp. 2016, 70, 113–147. [Google Scholar] [CrossRef] [Green Version]
- Miró, J.J.; Estrela, M.J.; Caselles, V.; Olcina-Cantos, J. Fine-scale estimations of bioclimatic change in the Valencia region, Spain. Atmos. Res. 2016, 180, 150–164. [Google Scholar] [CrossRef] [Green Version]
- Oria Iriarte, P. ¿Está Aumentando la Intensidad de las Precipitaciones Extremas en el Mediterráneo? Calendario Meteorológico. 2021. Available online: https://aemetblog.es/2021/05/02/esta-aumentando-la-frecuencia-o-la-intensidad-de-las-precipitaciones-extremas-en-el-mediterraneo/ (accessed on 3 July 2021).
- CEDEX. Evaluación del Impacto del Cambio Climático en los Recursos Hídricos y Sequías en España; Centro de Estudios Hidrográficos: Madrid, Spain, 2017; 320p, Available online: http://www.cedex.es/NR/rdonlyres/3B08CCC1-C252-4AC0-BAF7-1BC27266534B/145732/2017_07_424150001_Evaluación_cambio_climático_recu.pdf (accessed on 3 July 2021).
- Rubio-Martin, A.; Pulido-Velazquez, M.; Macian-Sorribes, H.; Garcia-Prats, A. System Dynamics Modeling for Supporting Drought-Oriented Management of the Jucar River System, Spain. Water 2020, 12, 1407. [Google Scholar] [CrossRef]


Publisher’s Note: MDPI stays neutral with regard to jurisdictional claims in published maps and institutional affiliations. |
© 2021 by the authors. Licensee MDPI, Basel, Switzerland. This article is an open access article distributed under the terms and conditions of the Creative Commons Attribution (CC BY) license (https://creativecommons.org/licenses/by/4.0/).
Share and Cite
Miró, J.J.; Estrela, M.J.; Olcina-Cantos, J.; Martin-Vide, J. Future Projection of Precipitation Changes in the Júcar and Segura River Basins (Iberian Peninsula) by CMIP5 GCMs Local Downscaling. Atmosphere 2021, 12, 879. https://doi.org/10.3390/atmos12070879
Miró JJ, Estrela MJ, Olcina-Cantos J, Martin-Vide J. Future Projection of Precipitation Changes in the Júcar and Segura River Basins (Iberian Peninsula) by CMIP5 GCMs Local Downscaling. Atmosphere. 2021; 12(7):879. https://doi.org/10.3390/atmos12070879
Chicago/Turabian StyleMiró, Juan Javier, María José Estrela, Jorge Olcina-Cantos, and Javier Martin-Vide. 2021. "Future Projection of Precipitation Changes in the Júcar and Segura River Basins (Iberian Peninsula) by CMIP5 GCMs Local Downscaling" Atmosphere 12, no. 7: 879. https://doi.org/10.3390/atmos12070879
APA StyleMiró, J. J., Estrela, M. J., Olcina-Cantos, J., & Martin-Vide, J. (2021). Future Projection of Precipitation Changes in the Júcar and Segura River Basins (Iberian Peninsula) by CMIP5 GCMs Local Downscaling. Atmosphere, 12(7), 879. https://doi.org/10.3390/atmos12070879