Article

Nitrogen Oxides (NOx) in the Arctic Troposphere at Ny-Ålesund (Svalbard Islands): Effects of Anthropogenic Pollution Sources

1
Institute of Atmospheric Pollution Research, National Research Council of Italy, Strada Provinciale 35d, 9, Montelibretti, 00010 Rome, Italy
2
Institute of Atmospheric Pollution Research, National Research Council of Italy, Via Madonna del Piano 10, Sesto Fiorentino, 50019 Florence, Italy
3
Institute of Polar Sciences, National Research Council of Italy, Strada Provinciale 35d, 9, Montelibretti, 00010 Rome, Italy
4
Department of Biology, Agriculture and Food Sciences, National Research Council of Italy, P.le Aldo Moro 7, 00185 Rome, Italy
*
Author to whom correspondence should be addressed.
Atmosphere 2021, 12(7), 901; https://doi.org/10.3390/atmos12070901
Submission received: 18 June 2021 / Revised: 6 July 2021 / Accepted: 8 July 2021 / Published: 13 July 2021
(This article belongs to the Special Issue Air Pollution in the Polar Regions: Levels, Sources and Trends)

Abstract

:
Atmospheric measurements of nitrogen oxides (NOx = NO + NO2), ozone (O3) and other constituents were carried out during three field campaigns (29 March–30 April 2010, 1–26 April 2011, 18 May–8 October 2015) at Ny-Ålesund. The study focused on the variability of important O3 precursors, such as NOx, in the Arctic troposphere, and on the impact from anthropogenic sources on their measured concentrations: higher NO and NO2 levels were mostly associated with the lowest wind speeds and northern directions, indicating local pollution. Long-range transported sources from Russia and Europe were also identified with an occurrence of high NOx levels. Several ozone depletion events were observed and associated to winds blowing from the north-west direction (Arctic Ocean). Most of these events were connected to the lower NO and NO2 concentrations. Measurements of halogen and low molecular weight carbonyl compounds in 2010 and 2011, respectively, showed variable effects during the ozone depletion events. Other data, such as high time-resolved radon progeny measurements, were used in 2015 to identify source tracking and transport of air masses, local effects and atmospheric stability dynamics that could influence the NOx concentrations at Ny-Ålesund.

1. Introduction

Nitrogen oxides (NOx = NO + NO2) play a critical role in the oxidizing capacity of the troposphere through their impact on the production of radical species (OH, HO2 and RO2) and ozone (O3). The main sources of NOx in the troposphere are fossil fuel combustion, biomass burning, microbial activity in the soil and lightning. A small contribution derives from downward transport from the stratosphere and high-flying aircrafts [1]. The sources of nitrogen oxides in the Arctic regions are different from those of other regions because of the Arctic’s sparse population and its distance from human activities. Anthropogenic pollution in the Arctic originates primarily from Europe and North America or from boreal or agricultural fires. Sources of anthropogenic pollution within the Arctic regions (e.g., vehicle emissions, domestic heating, shipping, oil and gas and petroleum extraction, metal smelting and mineral extracting [2,3]) are also important, but they are poorly quantified. Natural emissions from boreal forest fires, vegetation (tundra and forests), ocean, volcanic eruptions, resuspended dust from volcanic ash sediments and glacial deposits are also important sources of air pollutants [3]. In addition to these, several studies have demonstrated that nitrate ( NO 3 - ) photolysis in the snowpack under sunlight conditions is a local and natural source of NOx [4].
The increased air pollution emissions from local and long-range transport sources can induce large variability in NOx levels and, thus, in the Arctic atmospheric chemistry. However, little is known about these impacts and the resulting possible changes in O3 concentrations, considering that tropospheric O3 is a harmful pollutant and a greenhouse gas affecting the Arctic climate [5]. In addition, the current understanding of the Arctic photochemistry of ozone and nitrogen oxides is also limited by the rare NOx measurements performed in the Arctic [6,7,8,9,10,11,12]. Several methods have been developed to measure NOx, but few have the detection limit (LOD), sensitivity and high sampling frequency required to measure NOx at very low levels (ppt) in polar environments. The most commonly used technology is based on the chemiluminescence detection (CLD), which involves NO oxidation by O3 excess to excited NO2-emitting photons that can be detected [13]. NO2 is converted to NO by using catalytic or photolytic converters, followed by NO chemiluminescence detection [14,15].
In this work, NOx were measured during three non-consecutive campaigns (2010, 2011, 2015) at Ny-Ålesund, Svalbard Islands, using the chemiluminescence technique with two different approaches for NO2 conversion.
The objectives were to gain additional information on concentrations and on the temporal behavior of NOx in the Arctic troposphere, to investigate the sources of NOx in the Arctic focusing on the importance of long-range pollution, which can significantly enhance local NOx concentrations, as well as to understand the relationship between NOx and O3.

2. Materials and Methods

Atmospheric measurements were carried out during three non-consecutive campaigns from 29 March to 30 April 2010 [12], from 1 to 27 April 2011 and from 18 May to 8 October 2015 at the Ny-Ålesund International Arctic Research and Monitoring Facility, Svalbard (78°55′ N, 11°55′ E, 40 m msl).
The first 2010 and 2011 campaigns were performed on a plain and undisturbed snow area near the Gruvebadet Observatory (78°55′ N, 11°56′ E), located at 1 km south-west of Ny-Ålesund, where the laboratory hut was available to accommodate the measuring instruments. NOx (NO + NO2) were measured every 6 min, using a modified commercial two-channel high-sensitivity chemiluminescence detector (Sonoma Technology, Inc., Petaluma, CA, USA), which is described in detail in previous studies [11,12]. Channel 1 and Channel 2 sampled air at 0.3 and 1.5 m above the snow respectively, in order to determine the concentration gradients of the nitrogen species. NO2 was detected after reduction to NO using an UV-LED-based photolytic NO2 converter. Compared to NO reduction on a heated molybdenum surface, the photolytic conversion over a narrow wavelength band provided a more selective and sensible NO2 measurement, with negligible interference of other gases [7,9]. Calibrations were performed every 24 h to determine the sensitivity of the instrument using a National Institute of Standards and Technology (NIST)-certified standard of NO in nitrogen (Scott-Marin, Inc., Riverside, CA, USA). The resulting 3σ detection limit for NO was 4.4 and 3.3 ppt for Channels 1 and 2 respectively, while the 3σ detection limit for NO2 was 9 and 7 ppt for Channels 1 and 2 respectively, in a 1 min average. The measured NOx concentrations deemed valid were used to determine the statistical values reported in this paper and to evaluate the periods affected by anthropogenic sources. The analysis of these events showed that they typically occurred when the wind direction came from the local power plant (from sectors 330–360°, 1–30°, with northerly directions and wind speeds < 1 m/s). To avoid the direct effects from continuous and intermittent local sources and, thus, to determine possible long-range transported pollution, a screening procedure was applied to the NO and NO2 data by a photon counting criterion such as that used previously [9,11,12]. Approximately 82% of the NO and NO2 data during campaigns of 2010 and 2011 were identified as the clean dataset. The data presented here were, thus, divided into two types: all (unscreened) and clean (screened) NOx measurements. Atmospheric turbulence measurements and, consequently, meteorological parameters were also carried out simultaneously by using a sonic anemometer (Mod. USA-T1, Metek, Elmshorn, DE) at about 5 m away from the sampling plain.
During the 2010 campaign, atmospheric measurements of halogen compounds such as gaseous hydrochloric acid (HCl) and bromidic acid (HBr) and their coarse and fine particulate chloride ( Cl - ) and bromide ( Br - ) were also carried out with a 12 h sampling time (10–16 April 2010) and with a 24 h sampling time (17–27 April 2010), by means of an annular denuder/filter pack system [12,16]. After this process, all samples were extracted and analyzed by Ion Chromatography. The 3σ detection limits for HCl, HBr, Cl - and Br - were about 3.1, 0.1, 7 and 0.1 ppt respectively, over a 12 h measurement period [17].
During the 2011 campaign, atmospheric measurements of carbonyl compounds were also carried out from 7 April to 3 May 2011. Carbonyl compounds were collected as their hydrazones by drawing air at 1 L/min through Sep-Pak DNPH/silica cartridges (Waters, Milford, MA, USA). An ozone scrubber was placed upstream of the cartridge to avoid degradation of carbonyl hydrazones. Two samples per day were collected, each comprising a 12 h sampling period (08:00–16:00 and 16:00–00:00 h). After sampling, the samples were extracted with carbonyl-free acetonitrile, eluted through the cartridge and analyzed by the isocratic reverse phase HPLC with UV detection at 365 nm. The carbonyls compounds quantified during the 2011 campaign were formaldehyde (HCHO), acetaldehyde (CH3CHO), propanal (CH3CH2CHO) and acetone (CH3COCH3), with a 3σ detection limit of about 22, 12, 7 and 24 ppt, respectively.
The 2015 campaign was performed at the Gruvebadet Observatory. NOx concentrations were measured every 1 min using an automated commercial chemiluminescence analyzer (Mod. M200EU, Teledyne Instruments, San Diego, CA, USA) with a detection limit of 0.05 ppb. NO2 was converted to NO catalytically, using a heated molybdenum NO2 converter—which is less selective than the photolytic converter and can be subject to interference [15,18]. All gas calibrations and gas test quality control concentrations for the NO/NO2/NOx measurements were obtained every 24 h by dynamic dilution of gas from cylinders whose contents are traceable to NIST standards. As performed for the 2010 and 2011 campaigns, the NOx measurements were used in two ways: all valid data were used to evaluate the local effects, and clean data were used to improve the identification of other anthropogenic sources, such as long-range transport. The filtering was carried out, manually discarding all periods when winds blew from northerly directions associated with wind speeds < 1 m/s. This filtering procedure resulted in the loss of approximately 36% of final NO and NO2 data. These two datasets were further averaged over a one-hour time period as the natural radioactivity measurements.
Natural radioactivity was measured using an automatic stability monitor (PBL mixing monitor, FAI Instruments, Fontenuova, Rome, Italy) with a sampling height of 3 m above the ground. The system comprises an air sampler for the collection of particulate matter on filter membranes and a Geiger–Muller counter for determining the total β activity of radionuclides attached to the particles. The instrument operates on two filters at the same time: while the sampling phase is acting on one filter for 1 hour, another filter is performing the β detection at four different intervals (0–10, 10–20, 30–40, 40–50 min). These instrumental features ensure that the β activity of the particles is continuously determined over an integration time of 1 h and that the β measurement period is long enough to guarantee highly accurate results. Data were analyzed considering the approach proposed in [19], where three different radiogenic components were discriminated: the short-lived radon progeny (214Pbeq), the long-lived radon progeny (212Pbeq) and the very long-lived β component (Cβ). While the first two components describe recently originated air masses with different local lithogenic origin (assuming equilibrium conditions between the different 222Rn and 220Rn progenies), the third component triggers the landing of aged air masses with more than 20 days of life.
In addition, during the 2015 sampling period, the meteorological data were obtained every hour at the Amundsen-Nobile Climate Change Tower (CCT) (78°55′ N, 11°52′ E) [20], which is located 1 km away from Gruvebadet Observatory in the West direction.
During all three campaigns, measurements of O3 were also performed every 1 min using an automatic and commercial UV absorption analyzer (Mod. M400E, Teledyne Instruments, San Diego, CA, USA) with a detection limit < 0.5 ppb.
The analysis of the back trajectories was approached calculating the air mass path with the HYSPLIT model [21]. We considered 5-day trajectories using the GDAS meteorological dataset. Simulations were targeted on the study site at different altitudes (500 and 1000 m a.s.l.) in order to evaluate the circulation without the influence of orography on trajectories [22]. This issue is extremely important considering the complexity of the studied fjord system and the extension of the Svalbard Island compared to the model resolution. Each trajectory was analyzed in terms of residence time in the Svalbard region expressed in hours, up to 350 km away from Ny-Ålesund, and in terms of longitude of origin of the air mass below latitude 66° N.

3. Results and Discussion

The local sources of NOx in Ny-Ålesund are the diesel power station situated north of the Gruvebadet Observatory and the summertime ship traffic from June to August. In addition, the mining settlements of Longyearbyen or Barentsburg, which are located south-east from Ny-Ålesund, might influence this village from regional pollution coinciding with SE wind directions [23,24].

3.1. Identification of Peaks

This work expands upon a previous study of NOx in Ny-Ålesund conducted by [12] in 2010 in two ways: first, all data were reported in the present study to quantify the impact of local pollution sources on NOx measurements. In [12], the clean NO and NO2 data were used to identify only background NOx levels and snowpack emissions, which are the main natural nitrogen sources in the Arctic environment. Second, the clean data presented in the present study are also discussed during the long-range transported pollution episodes and O3 depletion events.
Table 1 shows a statistical overview of all and clean NO and NO2, and O3 concentrations averaged over the whole sampling period, 2010, 2011 and 2015. Detailed information regarding the meteorological conditions can be found in [12,20].
The NO and NO2 concentrations sometimes varied daily because of a change in local emissions or transport pathways. Evaluation of these days using meteorological data and back trajectories showed several episodes of significantly higher NO and NO2 levels mostly associated with lower wind speeds (< 1 m/s), enhancing the accumulation of locally emitted pollution. These local episodes lasted less than one hour, had maximum durations of less than five–six hours depending on meteorological conditions and were identified by an increase in NO and NO2 levels and variability when winds blew from northerly directions, consistent with the influence of the power station on the sampling site.
During the 2010 campaign, the local pollution periods accounted for 18% of all NOx data observed on seven days (1, 8, 10, 12, 13, 21 and 27 April 2010). As one example, on 12 April 2010, the prevalent wind was from N and NE directions and NO and NO2 peaked sharply several times, up to about 14500 and 26000 ppt respectively, confirming that local pollution was the main source of the variability.
Additionally, another pollution event occurred on 24 April 2010, showing similar characteristics of local episodes with increased NO and NO2 concentrations up to 130 and 140 ppt respectively, and with low wind speeds (from 0.4 to 1 m/s), but local winds from S and SE (Figure 1). This event could be due to the influence of regional pollution from coal-fired power plants operating in two mining settlements of Longyearbyen or Barentsburg, located to the SE of Ny-Ålesund [7].
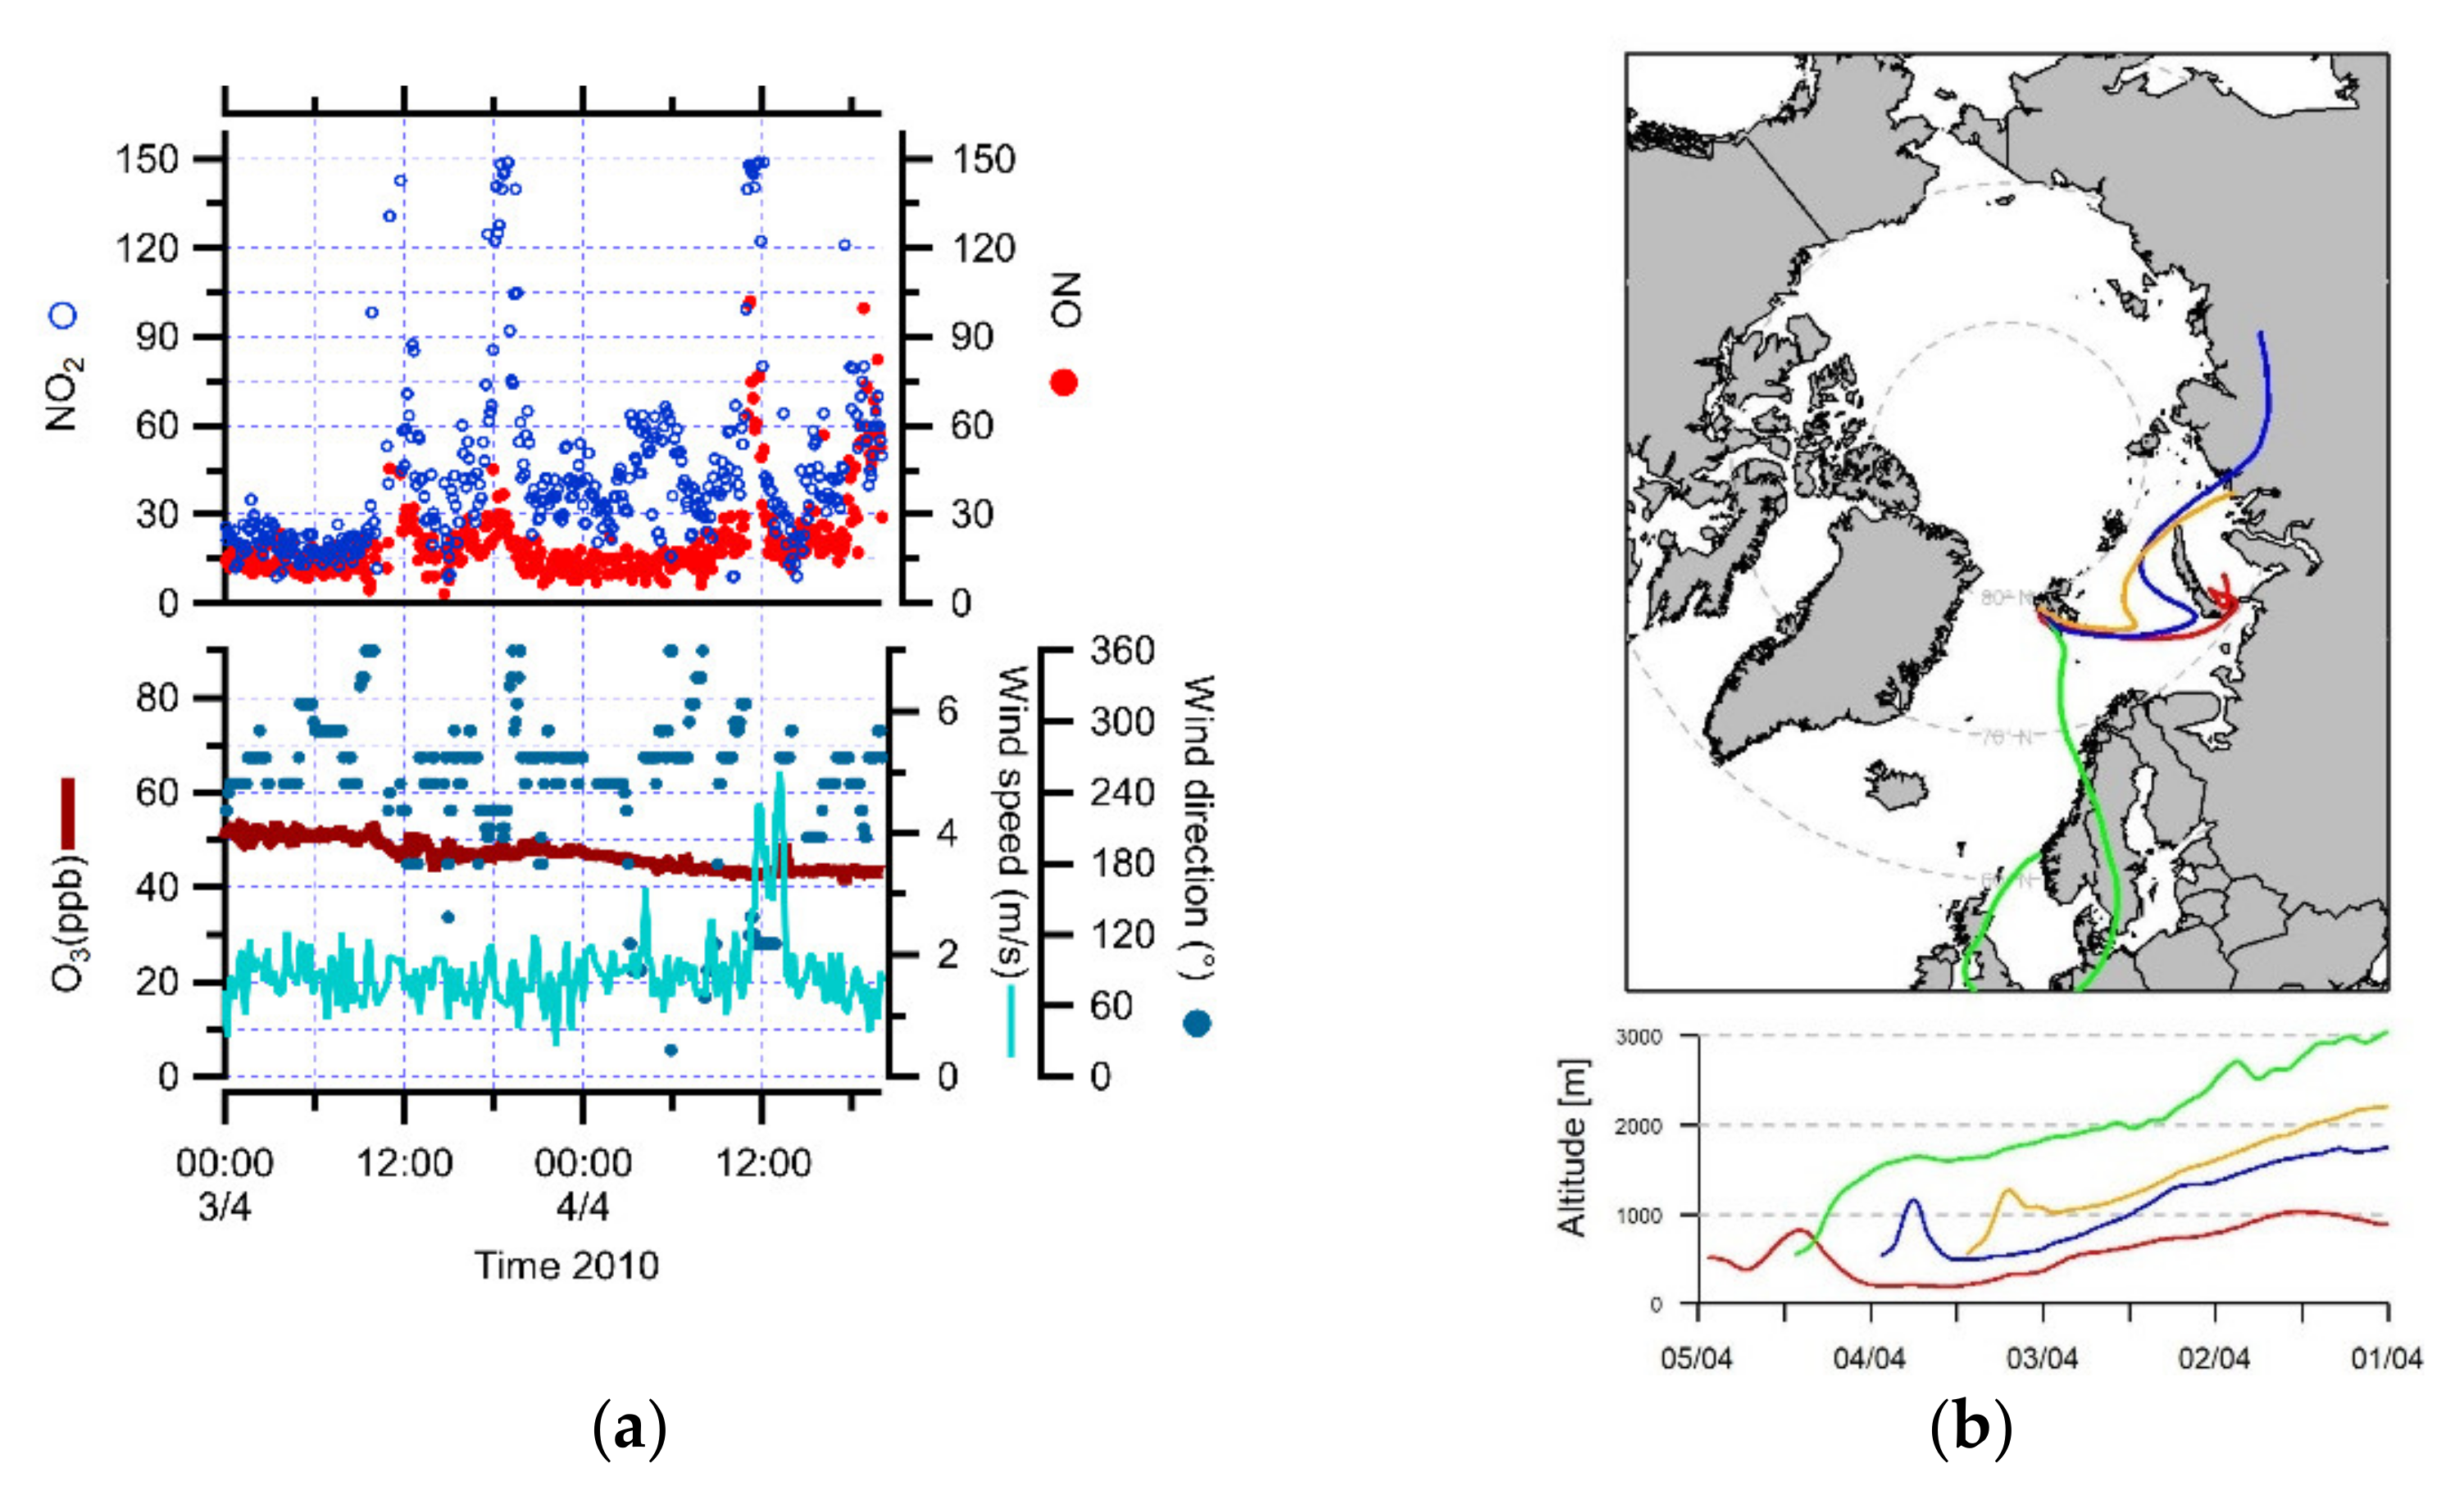
However, there were other periods of increase in NOx concentrations which were related to air mass pathways from Russia (3 April 2010) and Europe (4 April 2010) (Figure 2a,b). During 3 April 2010, the mean NO concentration was 16.9 ppt, with a range of 3.3 to 45.6 ppt, and the mean NO2 concentration was 37.1 ppt, with a range of 6.4 to 149.0 ppt. During the transport event from Europe (4 April 2010), the NO and NO2 concentrations varied between 6.3 and 102.2 ppt, with a mean value of 26.1 ppt, and between 6.9 and 140.6 ppt, with a mean value of 43.4 ppt, respectively. The local wind speeds ranged from 2 to 6 m/s and the wind direction was variable, but mostly from the south. These observations indicated that the long-range anthropogenic pollution sources contained higher NOx concentrations in the European air masses than in the Russian air masses, consistent with other studies [7,8,10].
During the 2011 campaign, the meteorological conditions were similar to those of spring 2010. The air temperature ranged between −19.0 and 6.6 °C, with a mean value of −4.6 °C, showing a well-defined diurnal trend, with maximum values reached between 11:00 and 13:00, and minimum values during nighttime. The UV radiation peaked between 10:00 and 13:00, reaching higher values of about 520 W/m2 on 20 April. The wind speeds showed large variations from low levels below 0.1 m/s to high levels up to about 25 m/s, with a mean value of about 5.8 m/s. During the whole sampling period, the prevalent wind came from E–SE sectors: this air flow came from the Kronebreen and Kongsvegen glaciers with a frequency of about 32%, carrying the highest wind speeds. The second most frequent wind direction was from S–SW sectors: this air flow came from the Broggerbreen glaciers with a frequency of 18%, carrying the lowest wind speeds. These results are consistent with previous studies [20,25].
Statistically significant diurnal cycles of NO and NO2 were observed on four days (12, 14, 22 and 23 April 2011) and appeared symmetric with UV radiation. Maximum concentrations of NO and NO2 were observed between 10:00 and 13:00 and reached minima values during nighttime. These trends suggested the impacts of photolytic sources on ambient NOx levels, such as the photolysis of snow NO 3 - [8,9,11,12].
Instead, on other days, the variability of NO and NO2 concentrations was mainly due to local emissions. During 18% of the time of this campaign, NO and NO2 peaked to the highest encountered concentrations (4, 6, 7, 9, 11, 13, 24, 25 and 26 April 2011). The local winds were low (<1 m/s) and were connected to northerly directions, confirming the influence of the local power station on NOx measurements [7,23].
However, high NO and NO2 concentrations were also connected with an air mass pathway from Europe on one episode, on 15–16 April 2011. During this long-range transport event, NO and NO2 peaked up to about 130 and 230 ppt, respectively. The local wind speeds ranged from 2 to 16 m/s and were mostly associated with the south direction (Figure 3a,b).
During the 2015 sampling period, the monthly mean air temperatures were lower in May (−4.9 °C) and higher in July (4.4 °C), with hourly extremes of −6.3 and 14.9 °C on 19 May, and 14.9 °C on 31 July. The monthly mean wind speeds ranged between 2.0 m/s in May and 4.0 m/s in June, with corresponding high levels up to 15.3 m/s. The prevailing wind direction was from E to SE in May and in September. In addition, the highest wind speeds were also registered from this direction, as related to the local orography of Ny-Ålesund [20,25]. In summer, the E–SE directions became comparable to the S–SW sectors, which were the second most frequently observed wind directions in May and in September.
As mentioned previously, several episodes with highest NOx concentrations were observed during the 2015 campaign, coinciding with northerly directions and with lowest wind speeds, which were consistent with the influence of local pollution sources. These peaks represented 36% of the whole dataset, showing maximum NO and NO2 concentrations of about 94 and 96 ppb (July 2015) respectively, both associated with low wind speeds (0–2 m/s) from N–NW and N–NE directions. These values were the highest encountered during the whole campaign.
Despite the presence of these episodes and the low instrumental sensitivity, the seasonal variations of the mean clean NOx values were observed with slowly increased levels in summer, due to favorable meteorological conditions and coinciding anthropogenic effects. Indeed, monthly mean concentrations of NO and NO2 were 70 and 200 ppt respectively, during July 2015, and reached lower mean levels of 50 and 100 ppt respectively, during May and September 2015.

3.2. The Role of Halogens in Ozone Depletion

The lower NO and NO2 concentrations were reached during the major (O3 concentrations less than 10 ppb) and partial ozone depletion events (O3 concentrations between 10 and 20 ppb) [8,26], which occurred on 21–22 and 26–27 April 2010, respectively. The ozone depletion event is a frequently observed, typical process during the spring season in the Arctic (March–May) and in Antarctica (August–October), when the temperatures are still low [27,28]. It consists in a decrease of O3 concentrations due to the presence of high levels of halogen compounds released from sea-salt particles via photochemical reactions (halogen explosion), although the rapidity of many events can also be ascribed to transport of ozone depleted air masses from over the sea-ice [29,30,31]. The two ozone depletion periods lasted up to one day and were meteorologically similar, with cold and clear air masses coming from northerly regions (Arctic Oceanic air or Greenland) and with north-westerly directions in local winds and lower temperatures at Ny-Ålesund, as discussed in previous studies [8,26,32,33]. During the major ozone depletion event (21–22 April 2010) associated with a minimum O3 value of 4.7 ppb, the minimum concentrations of NO and NO2 were at or below their detection limits (3.3 and 7.0 ppt, respectively), with mean levels of 9.3 and 15.8 ppt respectively, which were about half those during the whole sampling period (clean NO and NO2 data in Table 1). Furthermore, the temperature ranged between −18.0 and −7.7 °C, with a mean value of −12.8 °C, lower than that observed throughout the whole sampling period (−7.6 °C), and local winds were between 1.7 and 3.3 m/s. When the O3 depletion was less complete with minimum concentration of 11.4 ppb (26–27 April 2010), mean NO and NO2 concentrations were higher, averaging 13.5 and 20.7 ppt respectively, even if their minima were always below the instrumental detection limit. The concurrent wind and temperatures were also higher, with values between 2.9 and 6.7 m/s and between −7.9 and −0.5 °C respectively, suggesting that the ozone depletions occurred over a wide range of temperatures [26,34]. The cause of the simultaneously observed low NOx concentrations during the two O3 depletion periods could be the result of NO and NO2 remotion by reaction with halogen compounds (e.g., BrO, ClO, NaBr, NaCl), followed by formation and decomposition of bromine-containing nitrogen reservoirs (BrNO2, BrONO2), and producing the main termination products such as HOBr and HBr. HBr is also produced by favored reactions of bromine atoms with hydroxyl radical (OH) or organic species, such as formaldehyde (HCHO), during the ozone-depletion periods. Chlorine compounds can also play a role for occurrence of the ozone depletion and for inter-halogen reactions, speeding up bromine activation [31,35]. The relative mechanisms have been confirmed and reported in several field and model studies [8,9,36,37,38,39], which are consistent with the observations of this work.
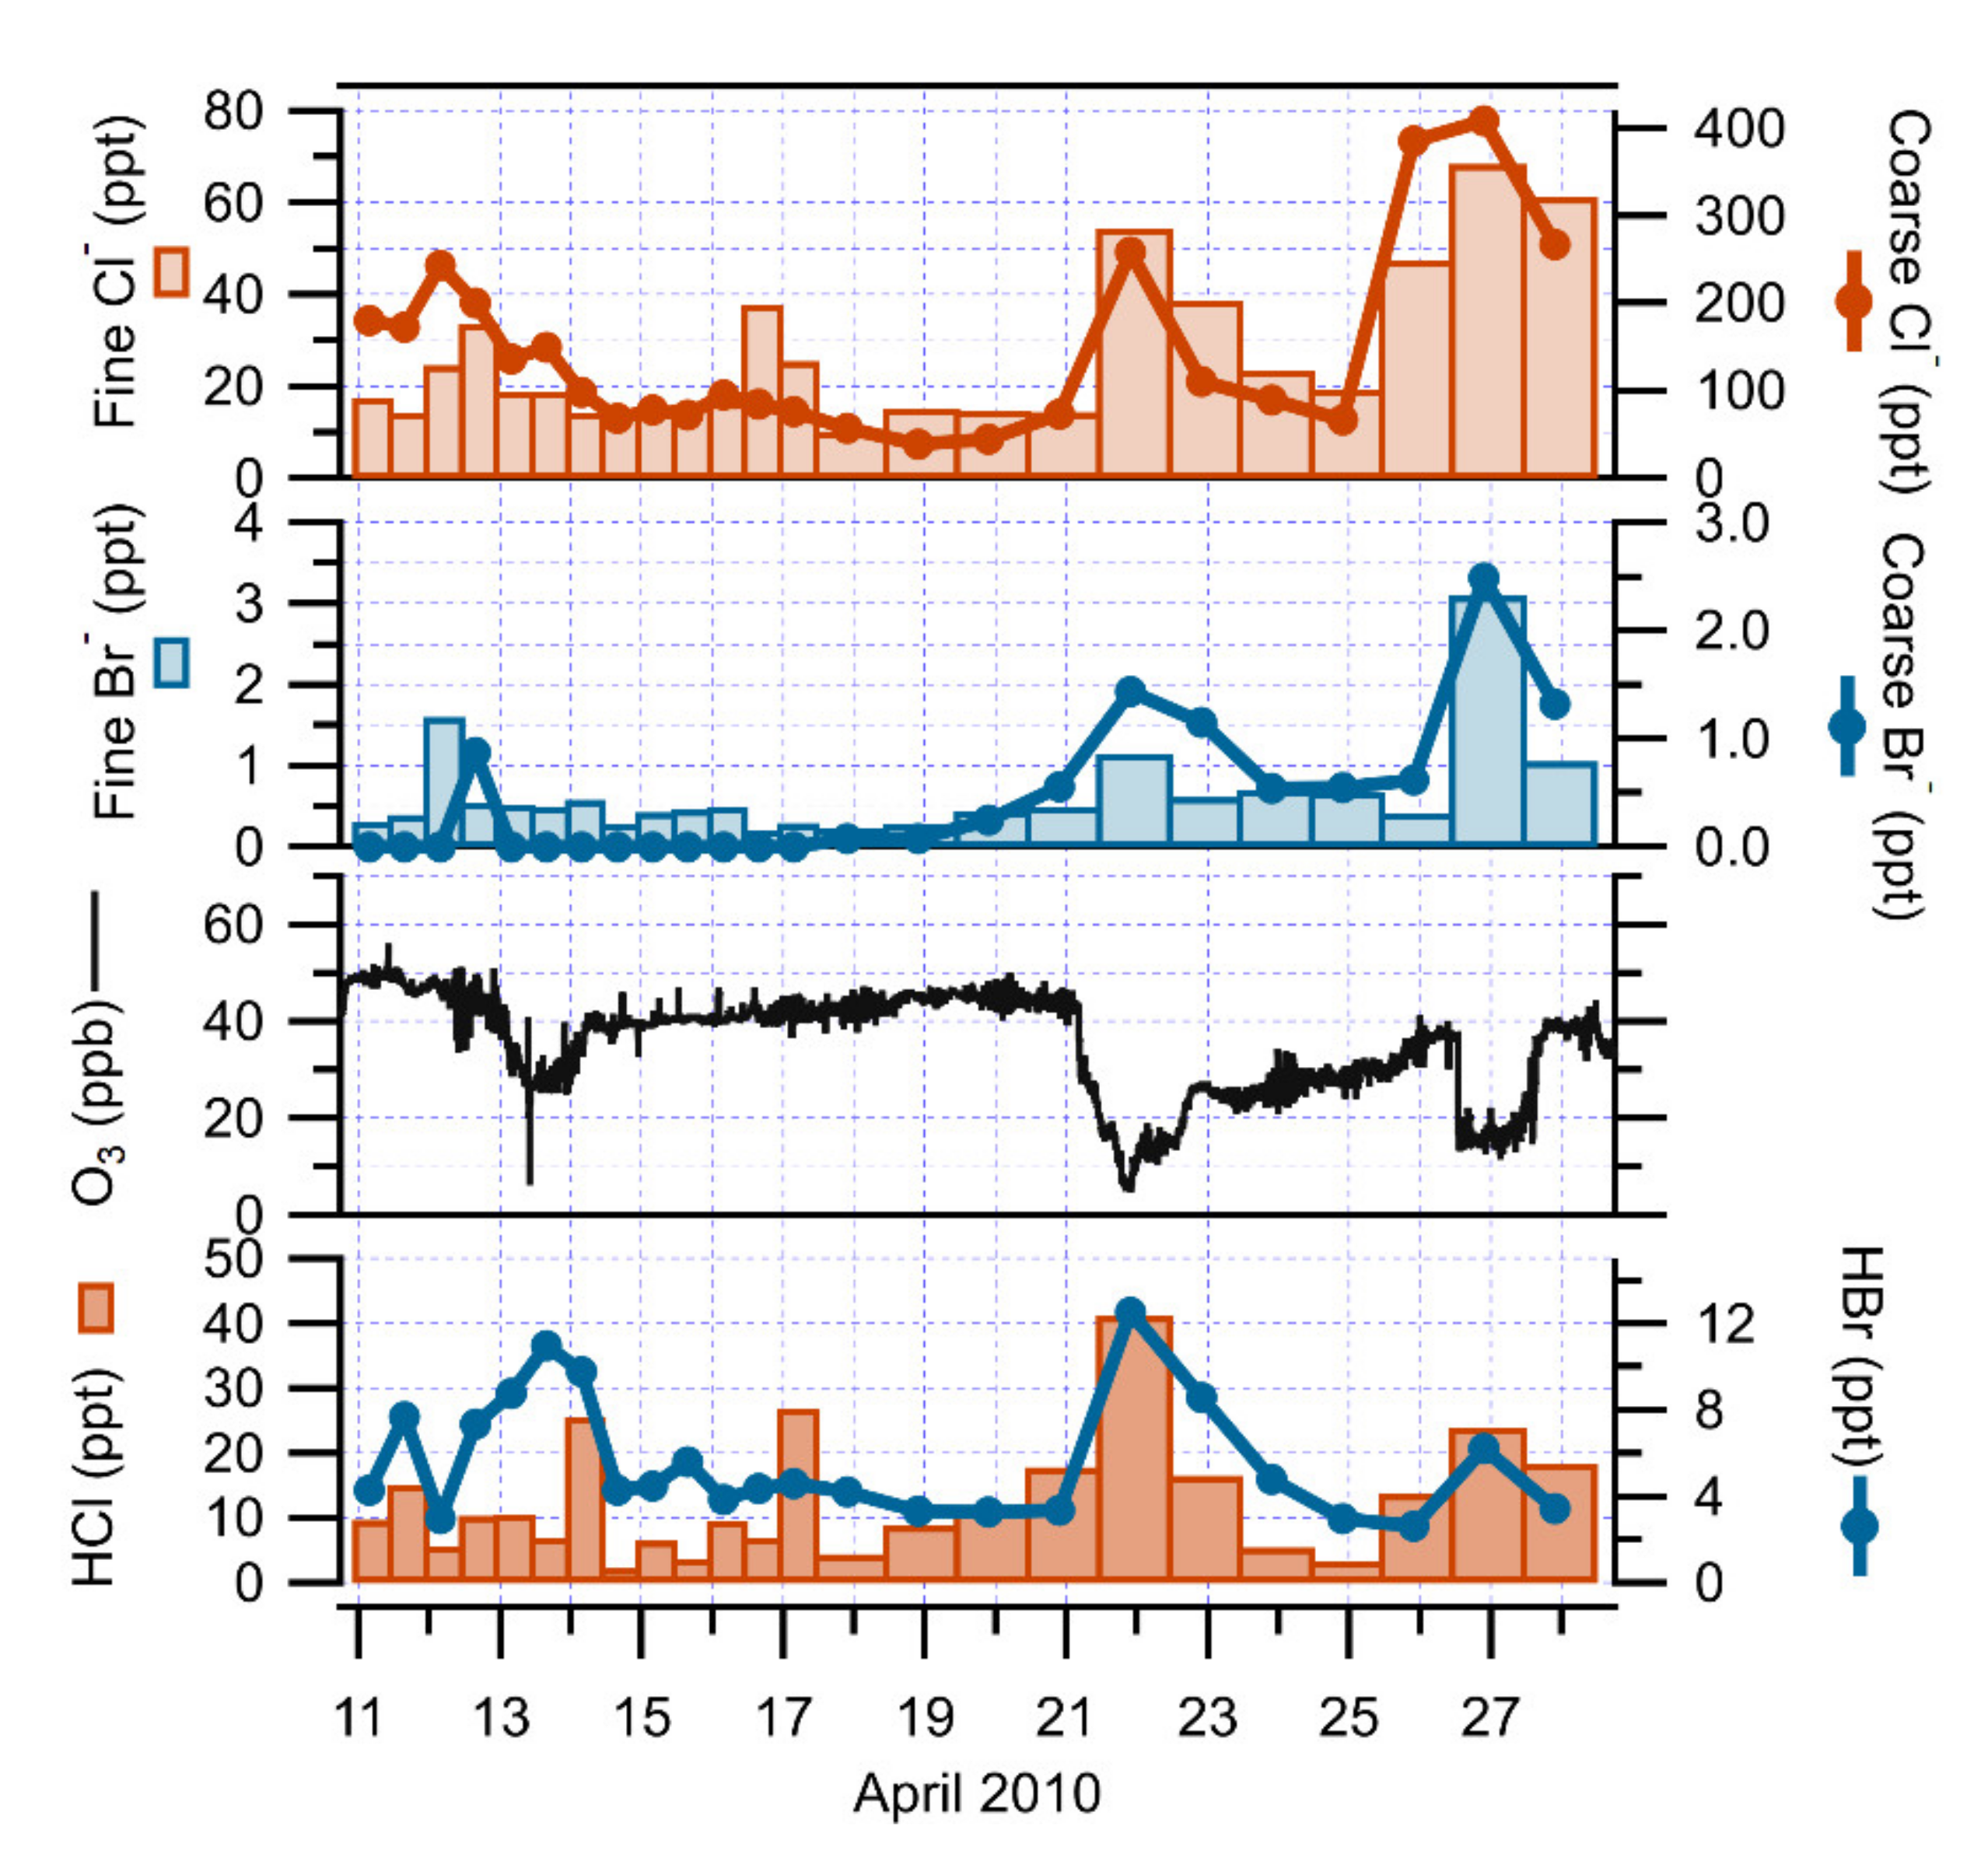
An increasing trend of halogen species collected on an annular denuder and filter pack system was also noted during the O3 depletion events of 2010 at Ny-Ålesund (Table 2). During the 2010 campaign, chlorine species were predominantly distributed in the particulate phase, while bromine species were mostly found in the gaseous phase (Figure 4). However, at the beginning of the campaign, the coarse particulate Br - was almost undetectable, while the mean O3 was around 45 ppb. At the onset of the drop in O3 concentrations, the coarse particulate Br - concentrations gradually increased up to 1.5 and 2.5 ppt on 21 and 26 April 2010. HCl, coarse and fine Cl - , HBr and fine Br - also exhibited similar behaviors, peaking simultaneously during these ozone depletion periods. The O3 concentrations were linearly and negatively correlated with inorganic bromine and chlorine compounds, showing a correlation coefficient (R2) of 0.8 and 0.4 for HBr and particulate Br - , and of 0.6. and 0.3 for HCl and particulate Cl - . Using sodium (Na) as a seawater reference element, and, thus, as a sea-salt tracer with a corresponding Br/Na mass ratio value of 0.006 [40], the mean values of the measured Br/Na mass ratios in particulate matter collected by the denuder/filter pack system were 0.01 and 0.03 during the all sampling and ozone depletion periods. Thus, particulate Br- was shown to be in excess in relation to solely sea-salt inputs by a factor of about 2 and 5. The enrichment of Br relating to Na could be due to ocean or sea-ice processes, suggesting that sea-salt could be the source of halogen compounds responsible for the ozone depletion events [41,42]. Indeed, the measured Cl/Na mass ratios were lower than the sea-salt ratio (1.8), with a mean value of 1.4 and 1.3 during all sampling and ozone-depletion periods. These depletions of Cl - from expected sea-salt chloride could be due to reactions of sea-salt particles with acidic species (acid displacement), such as sulfuric acid (H2SO4) or nitric acid (HNO3) [43,44], as already determined at Ny-Ålesund [45,46]. The observed increase in halogen compounds suggested the presence and involvement of the Br chemistry in the ozone depleted events in Ny-Ålesund, as in previous studies [47,48,49].

3.3. The Role of Carbonyl Compounds in Ozone Depletion

During the 2011 campaign, lower NO and NO2 concentrations were reached during the partial ozone depletion events that occurred on 5–6, 9–10 and 11–12 April 2011. These three periods were meteorologically similar, with cold and clear air masses coming from northerly and westerly regions (Arctic Ocean sector), and were connected to north-westerly directions in local wind and to lower temperatures. During all events associated with minimum O3 values of 12.3 (5–6 April 2011), 11.9 (9–10 April 2011) and 14.6 (11–12 April 2011) ppb, NO and NO2 reached minimum values below or close to the instrumental detection limits. Temperatures were also low, varying from −15.3 to 13.0 °C on 5–6 April, from −11.0 to −9.8 °C on 9–10 April and from −4.5 to −3.7 °C on 11–12 April. The concurrent local wind speeds were between 2 and 11 m/s and mostly from north-west directions. These observations agreed with the results obtained during the 2010 campaign.
As noted earlier, other measurements were made during the 2011 campaign, including a quantification of carbonyl compounds (oxidation products of hydrocarbons), which are important sources and sinks of OHx radicals (OH and HO2), and an important sink for free radicals such as Br atoms, playing a key role in the Arctic ozone depletion [50].
Formaldehyde, acetaldehyde, propanal and acetone concentrations showed strong variability during the field campaign (Table 3). Acetone was much more abundant than formaldehyde, acetaldehyde and propanal. Their observed concentrations were consistent with previous measurements in the Arctic [51,52,53]. Since the lifetime of formaldehyde is short due to photolysis (on the order of hours) [27], its direct emissions from anthropogenic sources are not expected to survive the transport time of several days across the Arctic region, suggesting that local sources of formaldehyde sustained its observed high concentrations. It was found that atmospheric HCHO correlated slightly with UV radiation and temperature, with correlation coefficients (R2) of 0.30 (p < 0.001) and 0.25 (p < 0.001), respectively. These relationships may be an indication of snow surface emissions through photochemical processes that have shown to be a major source in the Arctic [54,55].
The carbonyl compound data during the partial ozone depletion events were rather sparse, because the samples were taken only twice daily, and the sampling times were not coordinated to examine the ozone depletion event. Only five samples for each carbonyl compound were taken during the last two ozone-depletion events (9–10 and 11–12 April 2011) (Figure 5). An evaluation on the behavior of carbonyl compounds during the ozone depletion periods is difficult from this dataset. However, during decreasing O3 conditions, acetaldehyde and propanal concentrations decreased to 72 and 7 ppt respectively, showing significant positive correlations with O3 (R2 = 0.6, p < 0.001, and 0.7, p < 0.001). This suggested the involvement of local Br-driven chemistry, resulting in aldehyde concentration reduction during the ozone depletion events. Contrary to other aldehydes, HCHO was inversely correlated with O3 (R2 = 0.8, p < 0.001), in agreement with previous studies. Formaldehyde concentrations were shown to increase, reaching a high value of 330 ppt. A reason for this behavior has been demonstrated [56,57], indicating that during partial ozone episodes, more chlorine (Cl) than bromine (Br) atoms are available, and enhanced production of HCHO by gas-phase oxidation of methane (CH4) with Cl atoms could be a viable explanation. Concurrent hydrocarbon and halogen data were not available for this field campaign. A negative correlation between acetone and O3 was also observed (R2 = 0.3, p < 0.01) with an increase in acetone concentrations up to about 1 ppb. Enhanced production of acetone from gas-phase oxidation of propane by Cl atoms could be one possible reason [53,58].

3.4. The Role of Atmospheric Stability

The relationship between air chemistry and atmospheric stability was investigated, integrating radon progeny observations and back trajectories in 2015.
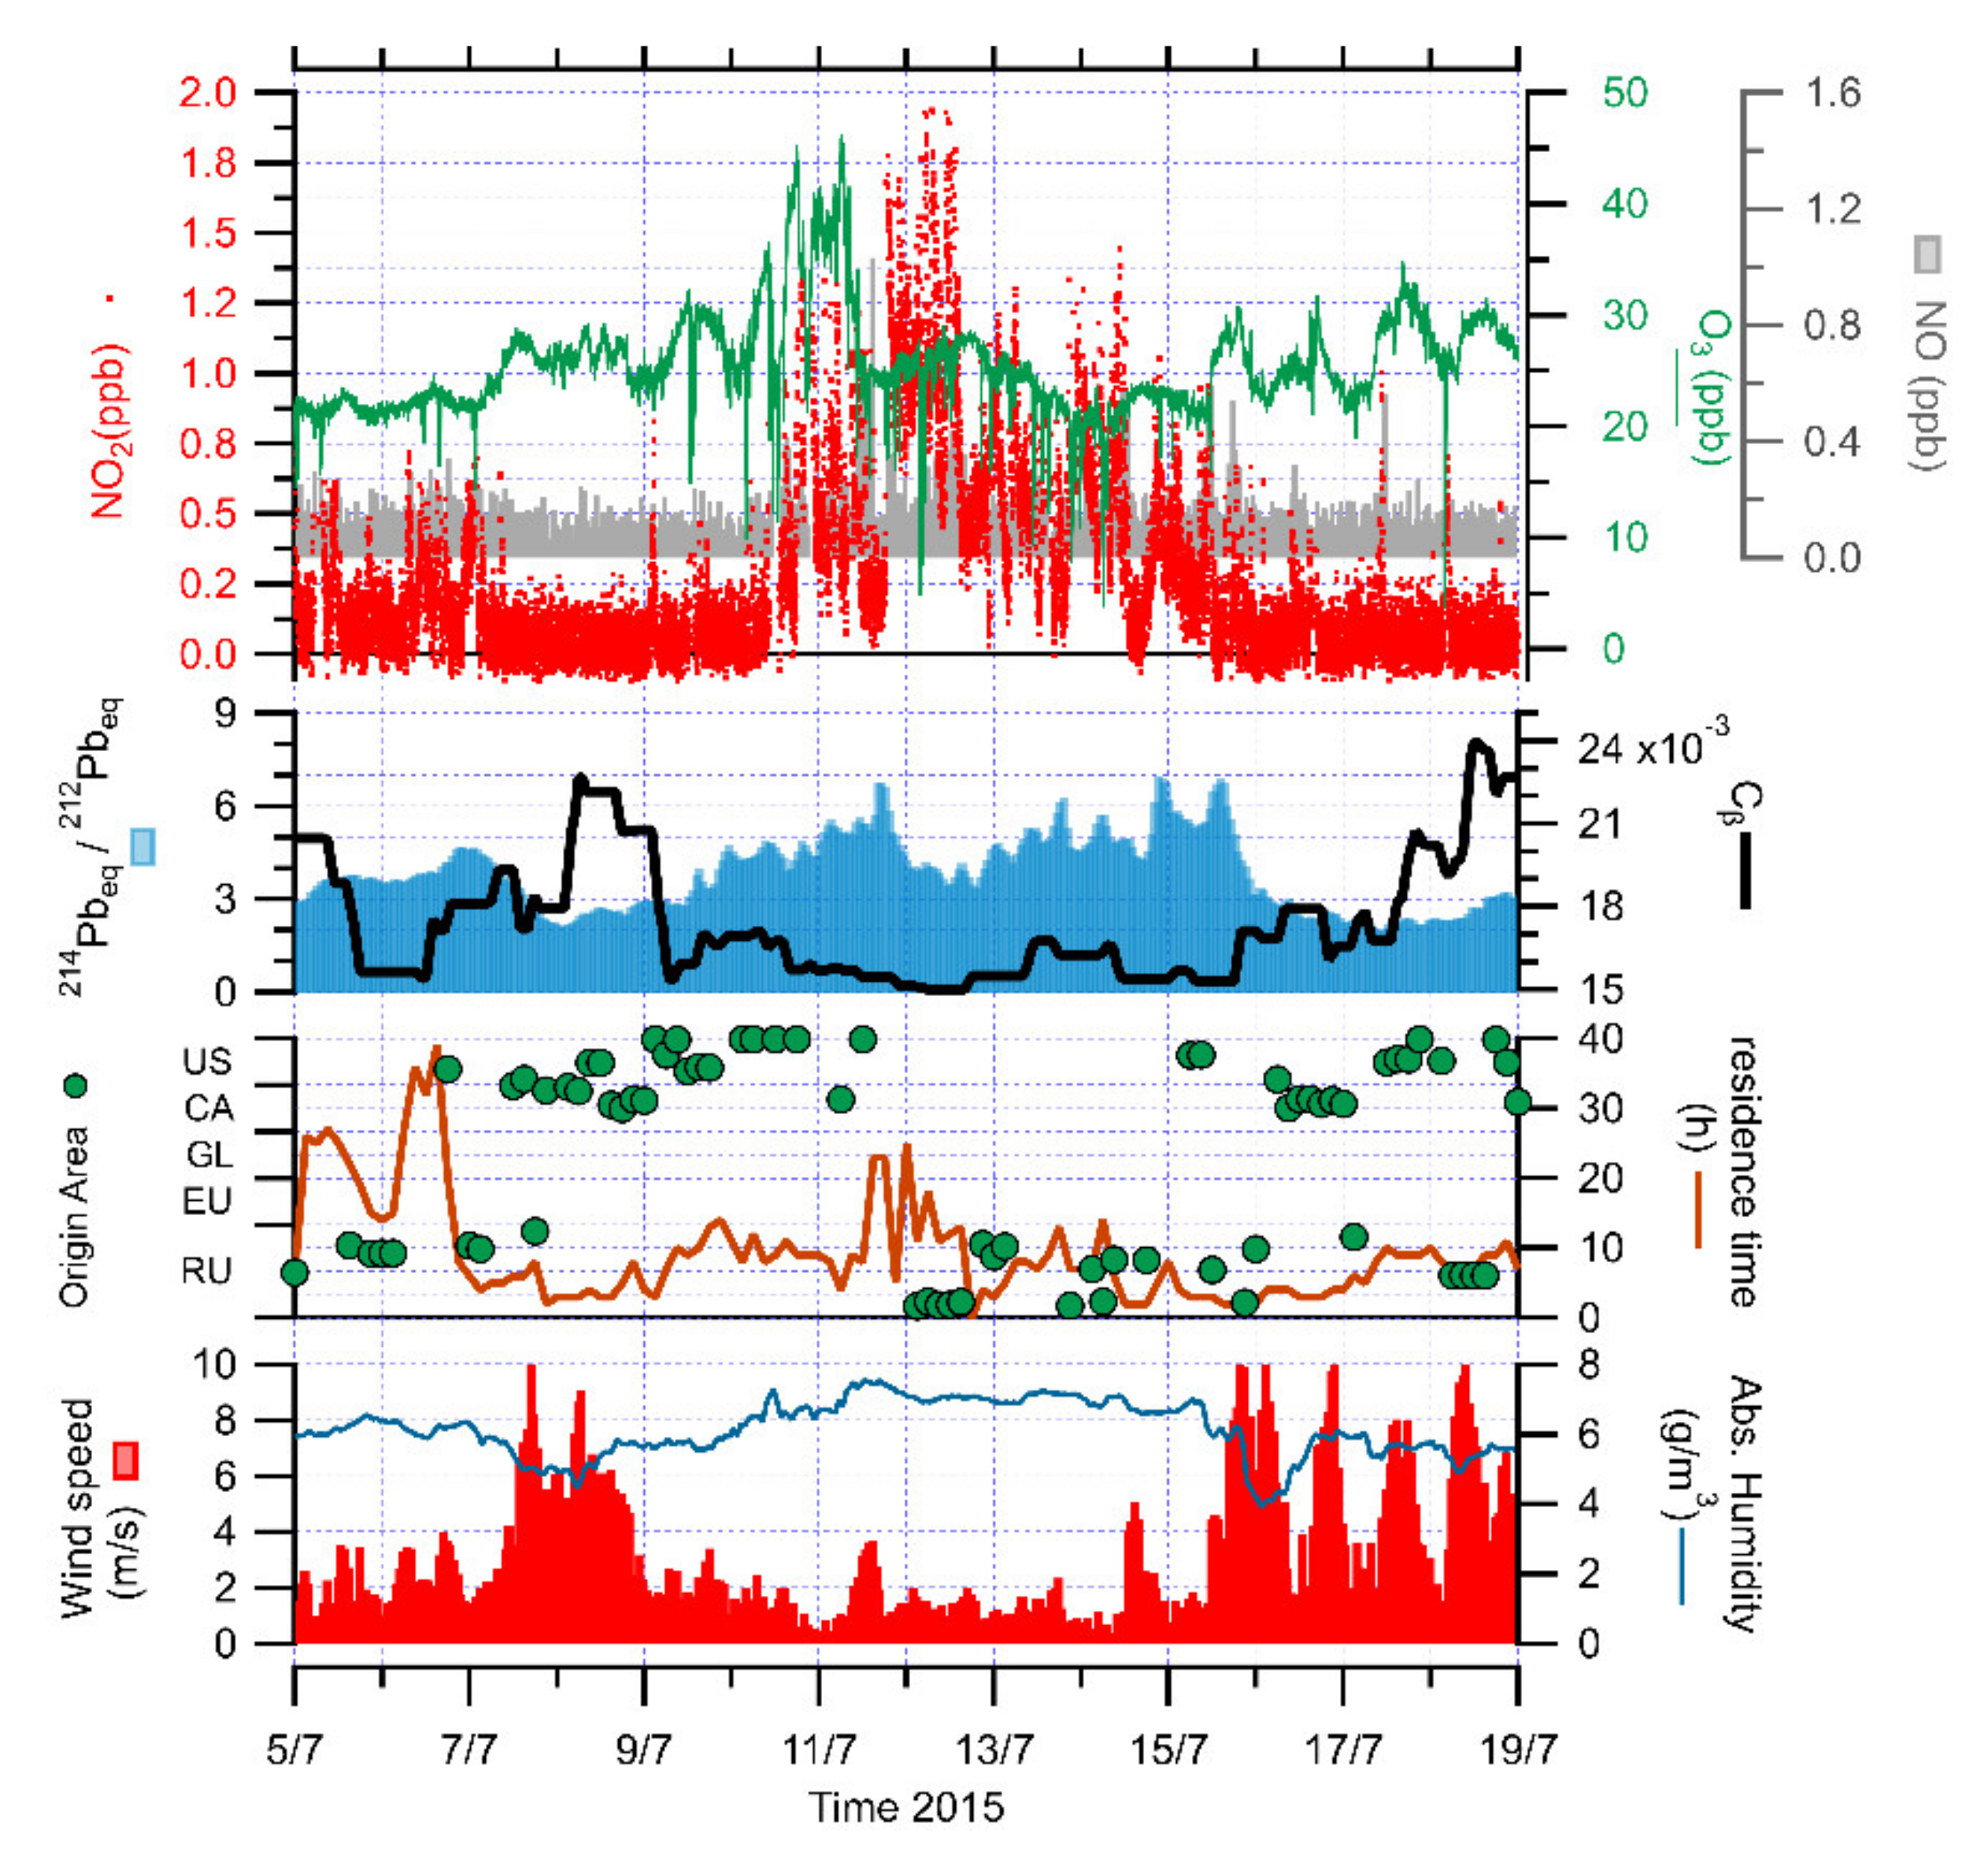
We selected two periods that showed specific relations between the atmospheric chemistry and local meteo-climatology. The first period, between 5 and 19 July 2015, occurred at the end of the melting season, when the snow cover was almost gone [59]. This behavior was confirmed by the increase of soil radon exhalation rate described in [19] and by the increase of the ratio between the short-lived and the long-lived radon progenies. When this ratio increases, the isotopic fingerprint is typical of a short-range terrestrial origin of the air mass or the triggering of a stagnant atmospheric condition. This last condition was particularly significant for atmospheric processes since it was induced by important atmospheric stability, and consequently by low atmospheric mixing. This stability condition started on 9 July and lasted until 15 July, while the wind speed was constantly below 4 m/s. It is particularly important to notice that between 8 and 9 July, the radon-progeny ratio was lower and that the near-constant isotopic component was significantly higher (Figure 6). This behavior implies that in this case, the air mass is enriched in nuclides such as 210Pb progeny and other very-long-lived nuclides that are typical of air masses not-locally originated, and consequently by “old” air masses with at least 20 days of life. The landing of such air masses was characterized by stronger winds, above 6 m/s, reaching Ny-Ålesund from E–SE, and absolute humidity reducing from 7 to below 5 g/m3. These features could describe air masses coming from the Kongsbreen glacier area that could be related to a near-katabatyc behavior. Referring to back-trajectories, this air mass was originated in north-eastern Canada–Alaska, traveling fast from latitudes below 66° N and characterized by a low residence time in the Svalbard area.
Indeed, an intense biomass burning event from North America (Canada, Alaska) was observed over Ny-Ålesund on 9–15 July 2015, leading to high levels of Aerosol Optical Depth (AOD) and Black Carbon [60,61,62,63]. Biomass fires release not only aerosols but also trace gases containing the same ozone precursors emitted from fossil fuel combustion: NOx, CO, CH4 and volatile organic compounds (VOCS) [64,65,66]. Looking at the atmospheric chemistry, NO2 were lower (<0.5 ppb), while the air mass was traveling fast before 9 July and started to rise to 2 ppb on 12 July, and went back to the lowest level of detection after 15 July. The NO showed a similar behavior, with values above the LOD during the stability period. Furthermore, with NOx being a key ozone precursor, the O3 concentrations were sensitive to NOx emissions by biomass burning. The high NOx concentrations of 10–11 July were associated with a clear O3 enhancement up to 45 ppb over background levels (25 ppb) at the beginning of the stability period. Then, O3 concentrations dropped below 30 ppb in the rest of the period. This O3 enhancement during 10–11 July could result from a local increased photochemical production within the biomass burning pollution plume. Additionally, because of its long lifetime, the aged biomass burning plumes promote the O3 production, accumulating further along the transport of biomass burning air masses [65,67]. After 11 July, the development of a thick cloud cover registered from 11 to 14 July [59] could induce the decrease in O3 due to titration of O3 by NO and to the reduction of photolysis of NO2 accumulated further during the stability period.
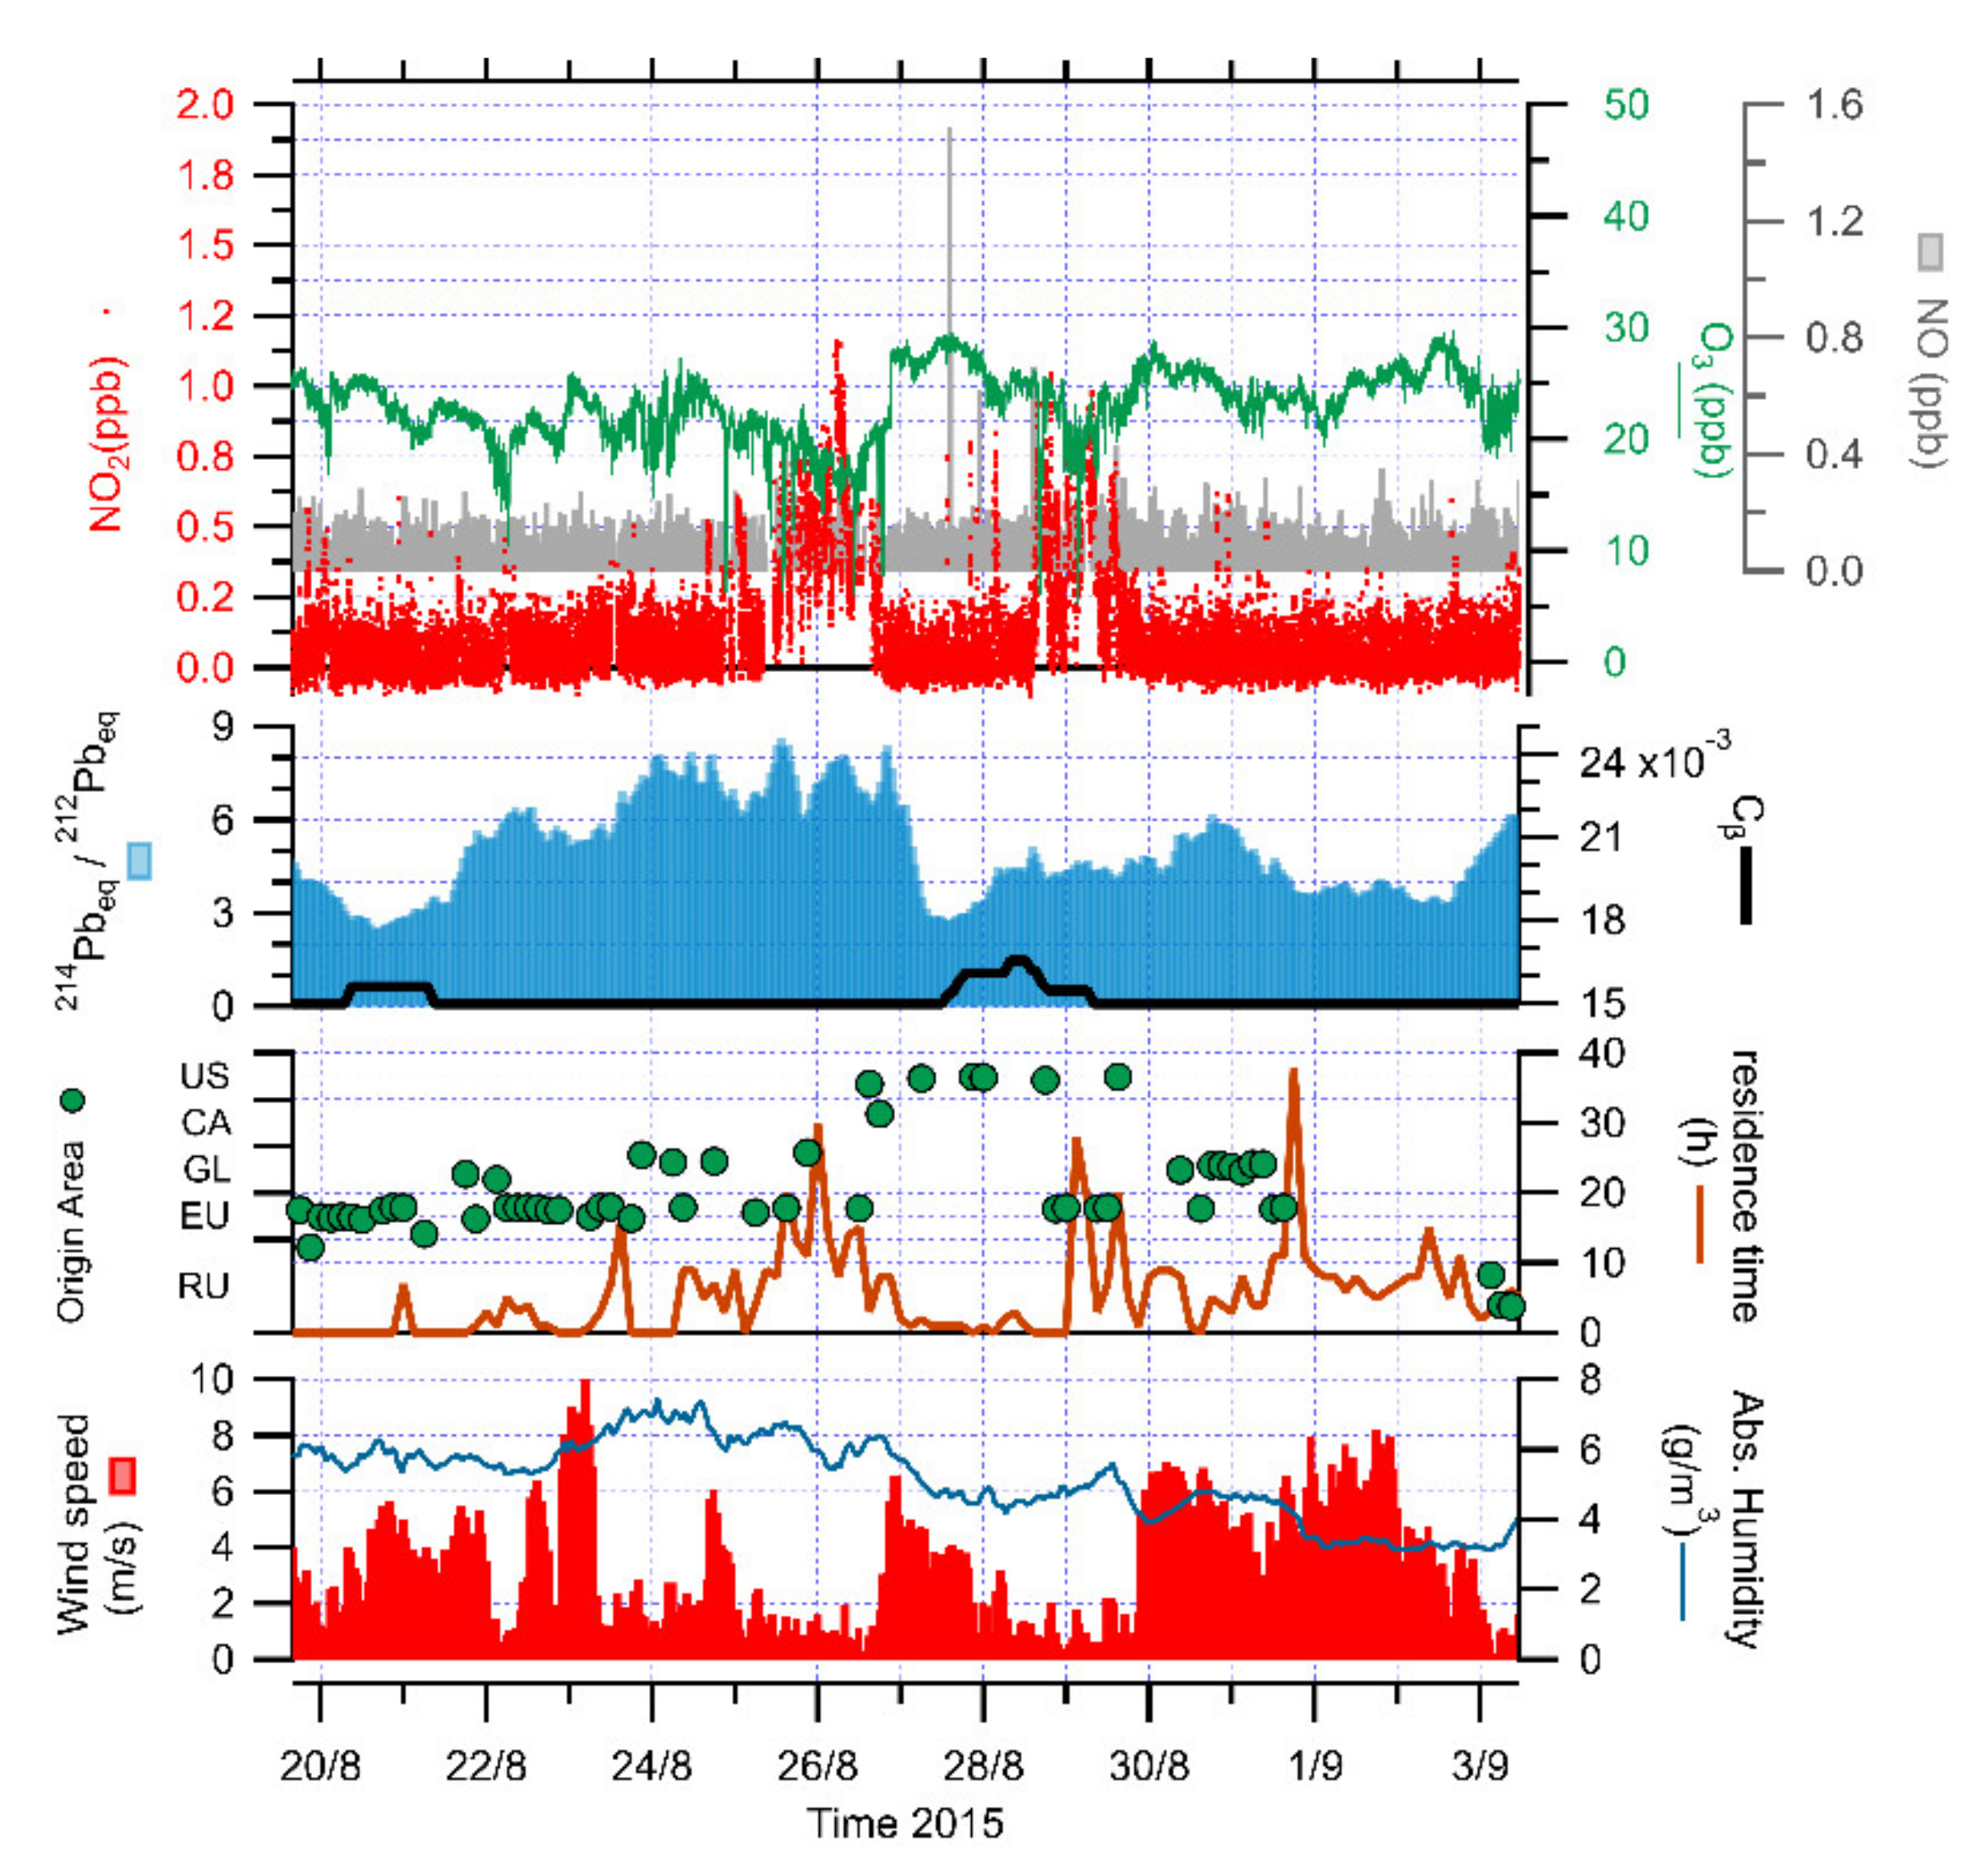
The second period spanned from 23 to 28 August 2015, and the attention was focused on a series of stability conditions (Figure 7), which are not as persistent during the summer season, with a duration of up to 48 h. We can recognize a near-stable condition where the radon progeny ratio is above 6 for 4 days and small fluctuations are produced by sharp variations in terms of wind speed, generally below 3 m/s, but with strong, high-frequency fluctuations. Looking at the stability period, there was no significant constant-progeny signal before the considered timeframe, and no absolute humidity drop has been detected. The meteo-climatic interpretation differed from the previous case study, since no long-range air mass has been identified before the start of the stability condition. Nitrogen oxides were all close to the specific LOD as well as the ozone content, close to 25 ppb. There was a steep rise above 1 ppb in nitrogen dioxides at the end of the considered period, and such increase corresponded to a decrease of the ozone content down to 15 ppb. It is important to detect a 24 h event when the near-constant progeny triggered an aged air mass on 28 August. This air mass was characterized by similar features of the longer event observed in July: high wind speed, lower absolute humidity, low residence time and NE Canada/Alaska origin. Nitrogen dioxides rose close to 1 ppb and ozone dropped below 20 ppb at the same time, highlighting the composition of such air mass, unlike the photochemical reaction produced during a stability period.

4. Conclusions

Measurements of NOx, O3 and other compounds were carried out at Ny-Ålesund in 2010, 2011 and 2015. Changes in local emissions or transport pathways resulted in a large variability in measured species.
During the 2010, 2011 and 2015 campaigns, we found that the air was contaminated for about 18%, 18% and 36% of the time with NOx from local pollution sources, showing the highest values encountered during all three campaigns.
Enhanced NOx values were observed during the long-range of anthropogenic pollution from Russia and Europe in the spring 2010 and 2011 campaigns. The results showed that in both sampling periods, the European air masses contained higher NOx concentrations than the Russian air masses.
During all encountered ozone depletion events, low NOx levels were among the lowest detected, possibly due to NO and NO2 remotion by reaction with halogen compounds. Indeed, during the 2010 campaign, an increasing trend of halogen species, such as HCl, HBr, particulate Cl - and Br - , was observed in correspondence with ozone-depletion periods. The enrichment of Br in relation to Na suggested that sea-salt could be the source of these halogen compounds responsible for the ozone-depletion events in Ny-Ålesund. Furthermore, during the ozone-depletion events of 2011, measured carbonyl compounds, such as acetaldehyde and propanal, decreased due to the possible involvement of local Br-driven chemistry, resulting in aldehyde concentration reduction. Conversely, formaldehyde and acetone were negatively correlated with O3, showing increased concentrations.
During the 2015 campaign, the evaluation of NOx variability and atmospheric stability dynamics was carried out by using high-time-resolved radon progeny measurements and back trajectory analysis. The results showed that this approach supported the determination of the atmospheric stability conditions and the identification of long-range transported air masses, such as the biomass burning events.
This work provided useful data to evaluate and improve our understanding about the composition and possible origin of anthropogenic pollution in the Arctic. The current understanding of the Arctic photochemistry of ozone and nitrogen oxides is limited by a lack of measurements performed on the latter in this region. Our observations revealed the possibility to measure nitrogen oxides at very low levels, gaining additional information on polar air chemistry and providing possible valuable constraints for models, which are the primary tools for developing mitigation policies to limit future pollution impacts on climate and air quality.

Author Contributions

Conceptualization, A.I., R.S. (Roberto Salzano) and A.P.; methodology, A.I., G.E., F.S., M.M., R.S. (Roberto Salzano), R.M., R.S. (Rosamaria Salvatori) and A.P.; software, G.E. and M.M.; validation, A.I., G.E., F.S., R.S. (Roberto Salzano), R.S. (Rosamaria Salvatori) R.M. and A.P.; writing—original draft preparation, A.I., Roberto Salzano and A.P.; writing—review and editing, A.I., R.S. (Roberto Salzano) and A.P.; supervision, A.I., R.S. (Roberto Salzano) and A.P.; project administration, A.I.; funding acquisition, A.I. All authors have read and agreed to the published version of the manuscript.

Funding

This study was funded by the PRIN-MIUR 2007 Project ‘‘Dirigibile Italia: A platform for a multidisciplinary study on climatic changes in the Arctic region and their influence on temperate latitudes’’, PRIN-MIUR 2009 Project “ARCTICA-Arctic research on the Inter-connections between Climate and Atmosphere” and CNR-DSSTTA Project “Arctic: present Climatic Change and past extreme events.

Data Availability Statement

Data are available upon request to the authors.

Acknowledgments

The authors wish to thank the DSSTTA-CNR, the “Stazione Dirigibile Italia” facility team and Mauro Mazzola (CNR-ISP) for the meteorological data provided during the experimental activities. This manuscript was proofread by Lena Rettori (CNR-IIA).

Conflicts of Interest

The authors declare no conflict of interest.

References

  1. Fowler, D.; Coyle, M.; Skiba, U.; Sutton, M.A.; Cape, J.N.; Reis, S.; Sheppard, L.J.; Jenkins, A.; Grizzetti, B.; Galloway, J.N.; et al. The global nitrogen cycle in the twenty-first century. Philos. Trans. R. Soc. B 2013, 368, 20130164. [Google Scholar] [CrossRef]
  2. Law, K.S.; Roiger, A.; Thomas, J.L.; Marelle, L.; Raut, J.-C.; Dalsøren, S.; Fuglestvedt, J.; Tuccella, P.; Weinzierl, B.; Schlager, H. Local Arctic air pollution: Sources and impacts. Ambio 2017, 46, 453–463. [Google Scholar] [CrossRef] [PubMed] [Green Version]
  3. Schmale, J.; Arnold, S.R.; Law, K.S.; Thorp, T.; Anenberg, S.; Simpson, W.R.; Mao, J.; Pratt, K.A. Local Arctic Air Pollution: A Neglected but Serious Problem. Earth’s Future 2018, 6, 1385–1412. [Google Scholar] [CrossRef]
  4. Grannas, A.M.; Jones, A.E.; Dibb, J.; Ammann, M.; Anastasio, C.; Beine, H.J.; Bergin, M.; Bottenheim, J.; Boxe, C.S.; Carver, G.; et al. An overview of snow photochemistry: Evidence, mechanisms and impacts. Atmos. Chem. Phys. 2007, 7, 4329–4373. [Google Scholar] [CrossRef] [Green Version]
  5. Shindell, D.; Faluvegi, G.; Lacis, A.; Hansen, J.; Ruedy, R.; Aguilar, E. Role of tropospheric ozone increases in 20th-century climate change. J. Geophys. Res. 2006, 111. [Google Scholar] [CrossRef] [Green Version]
  6. Honrath, R.E.; Jaffe, D.A. The seasonal cycle of nitrogen oxides in the Arctic troposphere at Barrow, Alaska. J. Geophys. Res. 1992, 97, 20615. [Google Scholar] [CrossRef]
  7. Beine, H.J.; Engardt, M.; Jaffe, D.A.; Hov, Ø.; Holme´n, K.; Stordal, F. Measurements of NOx and aerosol particles at the NY-A lesund Zeppelin mountain station on Svalbard: Influence of regional and local pollution sources. Atmos. Environ. 1996, 30, 1067–1079. [Google Scholar] [CrossRef]
  8. Beine, H.J.; Jaffe, D.A.; Solberg, S.; Holmén, K.; Stordal, F.; Engardt, M.; Schmidbauer, N. NOx during ozone depletion events in the arctic troposphere at Ny-Alesund, Svalbard. Tellus 1997, 49, 556–565. [Google Scholar] [CrossRef] [Green Version]
  9. Beine, H.J.; Honrath, R.E.; Dominé, F.; Simpson, W.; Fuentes, J.D. NOx during background and ozone depletion periods at Alert: Fluxes above the snow surface. J. Geophys. Res. 2002, 107, ACH-7. [Google Scholar] [CrossRef]
  10. Solberg, S.; Krognes, T.; Stordal, F.; Hov, O.; Beine, H.J.; Jaffe, D.A.; Clemitshaw, K.C.; Penkett, S.A. Reactive Nitrogen Compounds at Spitsbergen in the Norwegian Arctic. J. Atmos. Chem. 1997, 28, 209–225. [Google Scholar] [CrossRef]
  11. Amoroso, A.; Domine, F.; Esposito, G.; Morin, S.; Savarino, J.; Nardino, M.; Montagnoli, M.; Bonneville, J.-M.; Clement, J.-C.; Ianniello, A.; et al. Microorganisms in Dry Polar Snow Are Involved in the Exchanges of Reactive Nitrogen Species with the Atmosphere. Environ. Sci. Technol. 2010, 44, 714–719. [Google Scholar] [CrossRef] [PubMed]
  12. Ianniello, A.; Spataro, F.; Salvatori, R.; Valt, M.; Nardino, M.; Björkman, M.P.; Esposito, G.; Montagnoli, M. Air-snow exchange of reactive nitrogen species at Ny-Ålesund, Svalbard (Arctic). Rend. Lincei 2016, 27 (Suppl. 1), 33–45. [Google Scholar] [CrossRef]
  13. Fontijn, A.; Sabadell, A.J.; Ronco, R.J. Homogeneous chemiluminescent measurement of nitric oxide with ozone. Implications for continuous selective monitoring of gaseous air pollutants. Anal. Chem. 1970, 42, 575–579. [Google Scholar] [CrossRef]
  14. Villena, G.; Bejan, I.G.; Kurtenbach, R.; Wiesen, P.; Kleffmann, J. Interferences of commercial NO2 instruments in the urban atmosphere and in a smog chamber. Atmos. Meas. Tech. 2012, 5, 149–159. [Google Scholar] [CrossRef] [Green Version]
  15. Reed, C.; Evans, M.J.; Di Carlo, P.; Lee, J.D.; Carpenter, L.J. Interferences in photolytic NO2 measurements: Explanation for an apparent missing oxidant? Atmos. Chem. Phys. 2016, 16, 4707–4724. [Google Scholar] [CrossRef] [Green Version]
  16. Beine, H.J.; Allegrini, I.; Sparapani, R.; Ianniello, A.; Valentini, F. Three years of springtime trace gas and particle measurements at Ny-Ålesund, Svalbard. Atmos. Environ. 2001, 35, 3645–3658. [Google Scholar] [CrossRef]
  17. Ianniello, A.; Beine, H.J.; Sparapani, R.; Di Bari, F.; Allegrini, I.; Fuentes, J.D. Denuder measurements of gas and aerosol species above Arctic snow surfaces at Alert 2000. Atmos. Environ. 2002, 36, 5299–5309. [Google Scholar] [CrossRef]
  18. Dunlea, E.J.; Herndon, S.C.; Nelson, D.D.; Volkamer, R.M.; Martini, F.S.; Sheehy, P.M.; Zahniser, M.S.; Shorter, J.H.; Wormhoudt, J.C.; Lamb, B.K.; et al. Evaluation of nitrogen dioxide chemiluminescence monitors in a polluted urban environment. Atmos. Chem. Phys. 2007, 7, 2691–2704. [Google Scholar] [CrossRef] [Green Version]
  19. Salzano, R.; Pasini, A.; Ianniello, A.; Mazzola, M.; Traversi, R.; Udisti, R. High time-resolved radon progeny measurements in the Arctic region (Svalbard islands, Norway): Results and potentialities. Atmos. Chem. Phys. 2018, 18, 6959–6969. [Google Scholar] [CrossRef] [Green Version]
  20. Mazzola, M.; Viola, A.P.; Lanconelli, C.; Vitale, V. Atmospheric observations at the Amundsen-Nobile Climate Change Tower in Ny-Ålesund, Svalbard. Rend. Lincei 2016, 27, 7–18. [Google Scholar] [CrossRef]
  21. Stein, A.F.; Draxler, R.R.; Rolph, G.D.; Stunder, B.J.B.; Cohen, M.D.; Ngan, F. NOAA’s HYSPLIT Atmospheric Transport and Dispersion Modeling System. Bull. Am. Meteorol. Soc. 2015, 96, 2059–2077. [Google Scholar] [CrossRef]
  22. Esau, I.; Repina, I. Wind Climate in Kongsfjorden, Svalbard, and Attribution of Leading Wind Driving Mechanisms through Turbulence-Resolving Simulations. Adv. Meteorol. 2012, 2012, 1–16. [Google Scholar] [CrossRef]
  23. Dekhtyareva, A.; Edvardsen, K.; Holmén, K.; Hermansen, O.; Hansson, H.-C.; Longhurst, J.W.S.; Brebbia, C.A.; Barnes, J. Influence of local and regional air pollution on atmospheric measurements in Ny-Ålesund. Int. J. Sustain. Dev. Plan. 2016, 11, 578–587. [Google Scholar] [CrossRef] [Green Version]
  24. Dekhtyareva, A.; Holmén, K.; Maturilli, M.; Hermansen, O.; Graversen, R. Effect of seasonal mesoscale and microscale meteorological conditions in Ny-Ålesund on results of monitoring of long-range transported pollution. Polar Res. 2018, 37, 1508196. [Google Scholar] [CrossRef] [Green Version]
  25. Maturilli, M.; Herber, A.; König-Langlo, G. Climatology and time series of surface meteorology in Ny-Ålesund, Svalbard. Earth Syst. Sci. Data 2013, 5, 155–163. [Google Scholar] [CrossRef] [Green Version]
  26. Koo, J.-H.; Wang, Y.; Kurosu, T.P.; Chance, K.; Rozanov, A.; Richter, A.; Oltmans, S.J.; Thompson, A.M.; Hair, J.W.; Fenn, M.A.; et al. Characteristics of tropospheric ozone depletion events in the Arctic spring: Analysis of the ARCTAS, ARCPAC, and ARCIONS measurements and satellite BrO observations. Atmos. Chem. Phys. 2012, 12, 9909–9922. [Google Scholar] [CrossRef] [Green Version]
  27. Barrie, L.A.; Bottenheim, J.W.; Schnell, R.; Crutzen, P.J.; Rasmussen, R.A. Ozone destruction and photochemical reactions at polar sunrise in the lower Arctic atmosphere. Nature 1988, 334, 138–141. [Google Scholar] [CrossRef]
  28. Tarasick, D.; Bottenheim, J.W. Surface ozone depletion episodes in the Arctic and Antarctic from historical ozonesonde records. Atmos. Chem. Phys. 2002, 2, 197–205. [Google Scholar] [CrossRef] [Green Version]
  29. Strong, C.; Fuentes, J.; Davis, R.; Bottenheim, J. Thermodynamic attributes of Arctic boundary layer ozone depletion. Atmos. Environ. 2002, 36, 2641–2652. [Google Scholar] [CrossRef]
  30. Morin, S.; Hönninger, G.; Staebler, R.M.; Bottenheim, J.W. A high time resolution study of boundary layer ozone chemistry and dynamics over the Arctic Ocean near Alert, Nunavut. Geophys. Res. Lett. 2005, 32, 08809. [Google Scholar] [CrossRef]
  31. Simpson, W.; von Glasow, R.; Riedel, K.; Anderson, P.; Ariya, P.; Bottenheim, J.; Burrows, J.P.; Carpenter, L.J.; Friess, U.; Goodsite, M.; et al. Halogens and their role in polar boundary-layer ozone depletion. Atmos. Chem. Phys. 2007, 7, 4375–4418. [Google Scholar] [CrossRef] [Green Version]
  32. Solberg, S.; Schmidbauer, N.; Semb, A.; Stordal, F. Boundary-layer ozone depletion as seen in the Norwegian Arctic in spring. J. Atmos. Chem. 1996, 23, 301–332. [Google Scholar] [CrossRef]
  33. Eneroth, K.; Holmén, K.; Berg, T.; Schmidbauer, N.; Solberg, S. Springtime depletion of tropospheric ozone, gaseous elemental mercury and non-methane hydrocarbons in the European Arctic, and its relation to atmospheric transport. Atmos. Environ. 2007, 41, 8511–8526. [Google Scholar] [CrossRef]
  34. Bottenheim, J.W.; Netcheva, S.; Morin, S.; Nghiem, S.V. Ozone in the boundary layer air over the Arctic Ocean: Measurements during the TARA transpolar drift 2006–2008. Atmos. Chem. Phys. 2009, 9, 4545–4557. [Google Scholar] [CrossRef] [Green Version]
  35. Thompson, C.R.; Shepson, P.B.; Liao, J.; Huey, L.G.; Apel, E.C.; Cantrell, C.A.; Flocke, F.; Orlando, J.; Fried, A.; Hall, S.R.; et al. Interactions of bromine, chlorine, and iodine photochemistry during ozone depletions in Barrow, Alaska. Atmos. Chem. Phys. 2015, 15, 9651–9679. [Google Scholar] [CrossRef] [Green Version]
  36. Evans, M.J.; Jacob, D.J.; Atlas, E.; Cantrell, C.A.; Eisele, F.; Flocke, F.; Fried, A.; Mauldin, R.L.; Ridley, B.A.; Wert, B.; et al. Coupled evolution of BrOx-ClOx-HOx-NOxchemistry during bromine-catalyzed ozone depletion events in the arctic boundary layer. J. Geophys. Res. 2003, 108, 8368. [Google Scholar] [CrossRef]
  37. Tas, E.; Peleg, M.; Pedersen, D.U.; Matveev, V.; Pour Biazar, A.; Luria, M. Measurement-based modeling of bromine chemistry in the boundary layer: 1. Bromine chemistry at the Dead Sea. Atmos. Chem. Phys. 2006, 6, 5589–5604. [Google Scholar] [CrossRef] [Green Version]
  38. Tas, E.; Peleg, M.; Pedersen, D.U.; Matveev, V.; Biazar, A.P.; Luria, M. Measurement-based modeling of bromine chemistry in the Dead Sea boundary layer–Part 2: The influence of NO2 on bromine chemistry at mid-latitude areas. Atmos. Chem. Phys. 2008, 8, 4811–4821. [Google Scholar] [CrossRef] [Green Version]
  39. Herrmann, M.; Sihler, H.; Frieß, U.; Wagner, T.; Platt, U.; Gutheil, E. Time-dependent 3D simulations of tropospheric ozone depletion events in the Arctic spring using the Weather Research and Forecasting model coupled with Chemistry (WRF-Chem). Atmos. Chem. Phys. 2021, 21, 7611–7638. [Google Scholar] [CrossRef]
  40. Wilson, T.R.S. Salinity and the Major Elements of Sea Water. In Chemical Oceanography, 2nd ed.; Riley, J.P., Skirrow, G., Eds.; Academic Press: London, UK, 1975; Volume 1, pp. 365–413. [Google Scholar]
  41. Vogt, R.; Crutzen, P.J.; Sander, R. A mechanism for halogen release from sea-salt aerosol in the remote marine boundary layer. Nature 1996, 383, 327–330. [Google Scholar] [CrossRef]
  42. Langendörfer, U.; Lehrer, E.; Wagenbach, D.; Platt, U. Observation of Filterable Bromine Variabilities During Arctic Tropospheric Ozone Depletion Events in High (1 h) Time Resolution. J. Atmos. Chem. 1999, 34, 39–54. [Google Scholar] [CrossRef]
  43. Sander, R.; Keene, W.C.; Pszenny, A.A.P.; Arimoto, R.; Ayers, G.P.; Baboukas, E.; Cainey, J.M.; Crutzen, P.J.; Duce, R.A.; Hönninger, G.; et al. Inorganic bromine in the marine boundary layer: A critical review. Atmos. Chem. Phys. 2003, 3, 1301–1336. [Google Scholar] [CrossRef] [Green Version]
  44. Krnavek, L.; Simpson, W.; Carlson, D.; Domine, F.; Douglas, T.A.; Sturm, M. The chemical composition of surface snow in the Arctic: Examining marine, terrestrial, and atmospheric influences. Atmos. Environ. 2012, 50, 349–359. [Google Scholar] [CrossRef]
  45. Lehrer, E.; Wagenbach, D.; Platt, U. Aerosol chemical composition during tropospheric ozone depletion at Ny Alesund/Svalbard. Tellus 1997, 49, 486–495. [Google Scholar] [CrossRef]
  46. Karl, M.; Leck, C.; Rad, F.M.; Bäcklund, A.; Lopez-Aparicio, S.; Heintzenberg, J. New insights in sources of the sub-micrometre aerosol at Mt. Zeppelin observatory (Spitsbergen) in the year 2015. Tellus B Chem. Phys. Meteorol. 2019, 71, 1–29. [Google Scholar] [CrossRef] [Green Version]
  47. Tuckermann, M.; Ackermann, R.; Gölz, C.; Lorenzen-Schmidt, H.; Senne, T.; Stutz, J.; Trost, B.; Unold, W.; Platt, U. DOAS-observation of halogen radical-catalysed arctic boundary layer ozone destruction during the ARCTOC-campaigns 1995 and 1996 in Ny-Ålesund, Spitsbergen. Tellus B Chem. Phys. Meteorol. 1997, 49, 533–555. [Google Scholar] [CrossRef] [Green Version]
  48. Martinez, M.; Arnold, T.; Perner, D. The role of bromine and chlorine chemistry for arctic ozone depletion events in Ny-Ålesund and comparison with model calculations. Ann. Geophys. 1999, 17, 941–956. [Google Scholar] [CrossRef]
  49. Legrand, M.; Yang, X.; Preunkert, S.; Theys, N. Year-round records of sea salt, gaseous, and particulate inorganic bromine in the atmospheric boundary layer at coastal (Dumont d’Urville) and central (Concordia) East Antarctic sites. J. Geophys. Res. Atmos. 2016, 121, 997–1023. [Google Scholar] [CrossRef] [Green Version]
  50. Mellouki, A.; Wallington, T.J.; Chen, J. Atmospheric Chemistry of Oxygenated Volatile Organic Compounds: Impacts on Air Quality and Climate. Chem. Rev. 2015, 115, 3984–4014. [Google Scholar] [CrossRef]
  51. De Serves, C. Gas phase formaldehyde and peroxide measurements in the Arctic atmosphere. J. Geophys. Res. Space Phys. 1994, 99, 25391–25398. [Google Scholar] [CrossRef]
  52. Notholt, J.; Toon, G.; Stordal, F.; Solberg, S.; Schmidbauer, N.; Becker, E.; Meier, A.; Sen, B. Seasonal variations of atmospheric trace gases in the high Arctic at 79 N. J. Geophys. Res. 1997, 102, 12855–12861. [Google Scholar] [CrossRef]
  53. Hornbrook, R.S.; Hills, A.J.; Riemer, D.D.; Abdelhamid, A.; Flocke, F.M.; Hall, S.R.; Huey, L.G.; Knapp, D.J.; Liao, J.; Mauldin, R.L.; et al. Arctic springtime observations of volatile organic compounds during the OASIS-2009 campaign. J. Geophys. Res. Atmos. 2016, 121, 9789–9813. [Google Scholar] [CrossRef]
  54. Sumner, A.L.; Shepson, P.B. Snowpack production of formaldehyde and its effect on the Arctic troposphere. Nature 1999, 398, 230–233. [Google Scholar] [CrossRef]
  55. Sumner, A.; Shepson, P.; Grannas, A.; Bottenheim, J.; Anlauf, K.; Worthy, D.; Schroeder, W.; Steffen, A.; Dominé, F.; Perrier, S.; et al. Atmospheric chemistry of formaldehyde in the Arctic troposphere at Polar Sunrise, and the influence of the snowpack. Atmos. Environ. 2002, 36, 2553–2562. [Google Scholar] [CrossRef]
  56. Rudolph, J.; Fu, B.R.; Anlauf, K.; Bottenheim, J.; Thompson, A. Halogen atom concentrations in the Arctic Troposphere derived from hydrocarbon measurements: Impact on the budget of formaldehyde. Geophys. Res. Lett. 1999, 26, 2941–2944. [Google Scholar] [CrossRef] [Green Version]
  57. Riedel, K.; Allan, W.; Weller, R.; Schrems, O. Discrepancies between formaldehyde measurements and methane oxidation model predictions in the Antarctic troposphere: An assessment of other possible formaldehyde sources. J. Geophys. Res. 2005, 110, 15308. [Google Scholar] [CrossRef] [Green Version]
  58. Guimbaud, C.; Grannas, A.; Shepson, P.B.; Fuentes, J.D.; Boudries, H.; Bottenheim, J.W.; Dominé, F.; Houdier, S.; Perrier, S.; Biesenthal, T.B.; et al. Snowpack processing of acetaldehyde and acetone in the Arctic atmospheric boundary layer. Atmos. Environ. 2002, 36, 2743–2752. [Google Scholar] [CrossRef]
  59. Salzano, R.; Lanconelli, C.; Esposito, G.; Giusto, M.; Montagnoli, M.; Salvatori, R. On the Seasonality of the Snow Optical Behaviour at Ny Ålesund (Svalbard Islands, Norway). Geosciences 2021, 11, 112. [Google Scholar] [CrossRef]
  60. Markowicz, K.; Pakszys, P.; Ritter, C.; Zielinski, T.; Udisti, R.; Cappelletti, D.; Mazzola, M.; Shiobara, M.; Xian, P.; Zawadzka, O.; et al. Impact of North American intense fires on aerosol optical properties measured over the European Arctic in July 2015. J. Geophys. Res. Atmos. 2016, 121, 487. [Google Scholar] [CrossRef] [Green Version]
  61. Ritter, C.; Burgos, M.A.; Böckmann, C.; Mateos, D.; Lisok, J.; Markowicz, K.; Moroni, B.; Cappelletti, D.; Udisti, R.; Maturilli, M.; et al. Microphysical properties and radiative impact of an intense biomass burning aerosol event measured over Ny-Ålesund, Spitsbergen in July 2015. Tellus B Chem. Phys. Meteorol. 2018, 70, 1–23. [Google Scholar] [CrossRef]
  62. Moroni, B.; Cappelletti, D.; Crocchianti, S.; Becagli, S.; Caiazzo, L.; Traversi, R.; Udisti, R.; Mazzola, M.; Markowicz, K.; Ritter, C.; et al. Morphochemical characteristics and mixing state of long range transported wildfire particles at Ny-Ålesund (Svalbard Islands). Atmos. Environ. 2017, 156, 135–145. [Google Scholar] [CrossRef]
  63. Moroni, B.; Ritter, C.; Crocchianti, S.; Markowicz, K.; Mazzola, M.; Becagli, S.; Traversi, R.; Krejci, R.; Tunved, P.; Cappelletti, D. Individual Particle Characteristics, Optical Properties and Evolution of an Extreme Long-Range Transported Biomass Burning Event in the European Arctic (Ny-Ålesund, Svalbard Islands). J. Geophys. Res. Atmos. 2020, 125, e2019JD031535. [Google Scholar] [CrossRef]
  64. Crutzen, P.J.; Heidt, L.E.; Krasnec, J.P.; Pollock, W.H.; Seiler, W. Biomass burning as a source of atmospheric gases CO, H2, N2O, NO, CH3Cl and COS. Nature 1979, 282, 253–256. [Google Scholar] [CrossRef]
  65. Arnold, S.R.; Emmons, L.K.; Monks, S.A.; Law, K.; Ridley, D.A.; Turquety, S.; Tilmes, S.; Thomas, J.L.; Bouarar, I.; Flemming, J.; et al. Biomass burning influence on high-latitude tropospheric ozone and reactive nitrogen in summer 2008: A multi-model analysis based on POLMIP simulations. Atmos. Chem. Phys. 2015, 15, 6047–6068. [Google Scholar] [CrossRef] [Green Version]
  66. Kramer, L.J.; Helmig, D.; Burkhart, J.F.; Stohl, A.; Oltmans, S.; Honrath, R.E. Seasonal variability of atmospheric nitrogen oxides and non-methane hydrocarbons at the GEOSummit station, Greenland. Atmos. Chem. Phys. 2015, 15, 6827–6849. [Google Scholar] [CrossRef] [Green Version]
  67. Parrington, M.; Palmer, P.I.; Lewis, A.; Lee, J.D.; Rickard, A.R.; Di Carlo, P.; Taylor, J.W.; Hopkins, J.R.; Punjabi, S.; Oram, D.E.; et al. Ozone photochemistry in boreal biomass burning plumes. Atmos. Chem. Phys. 2013, 13, 7321–7341. [Google Scholar] [CrossRef] [Green Version]
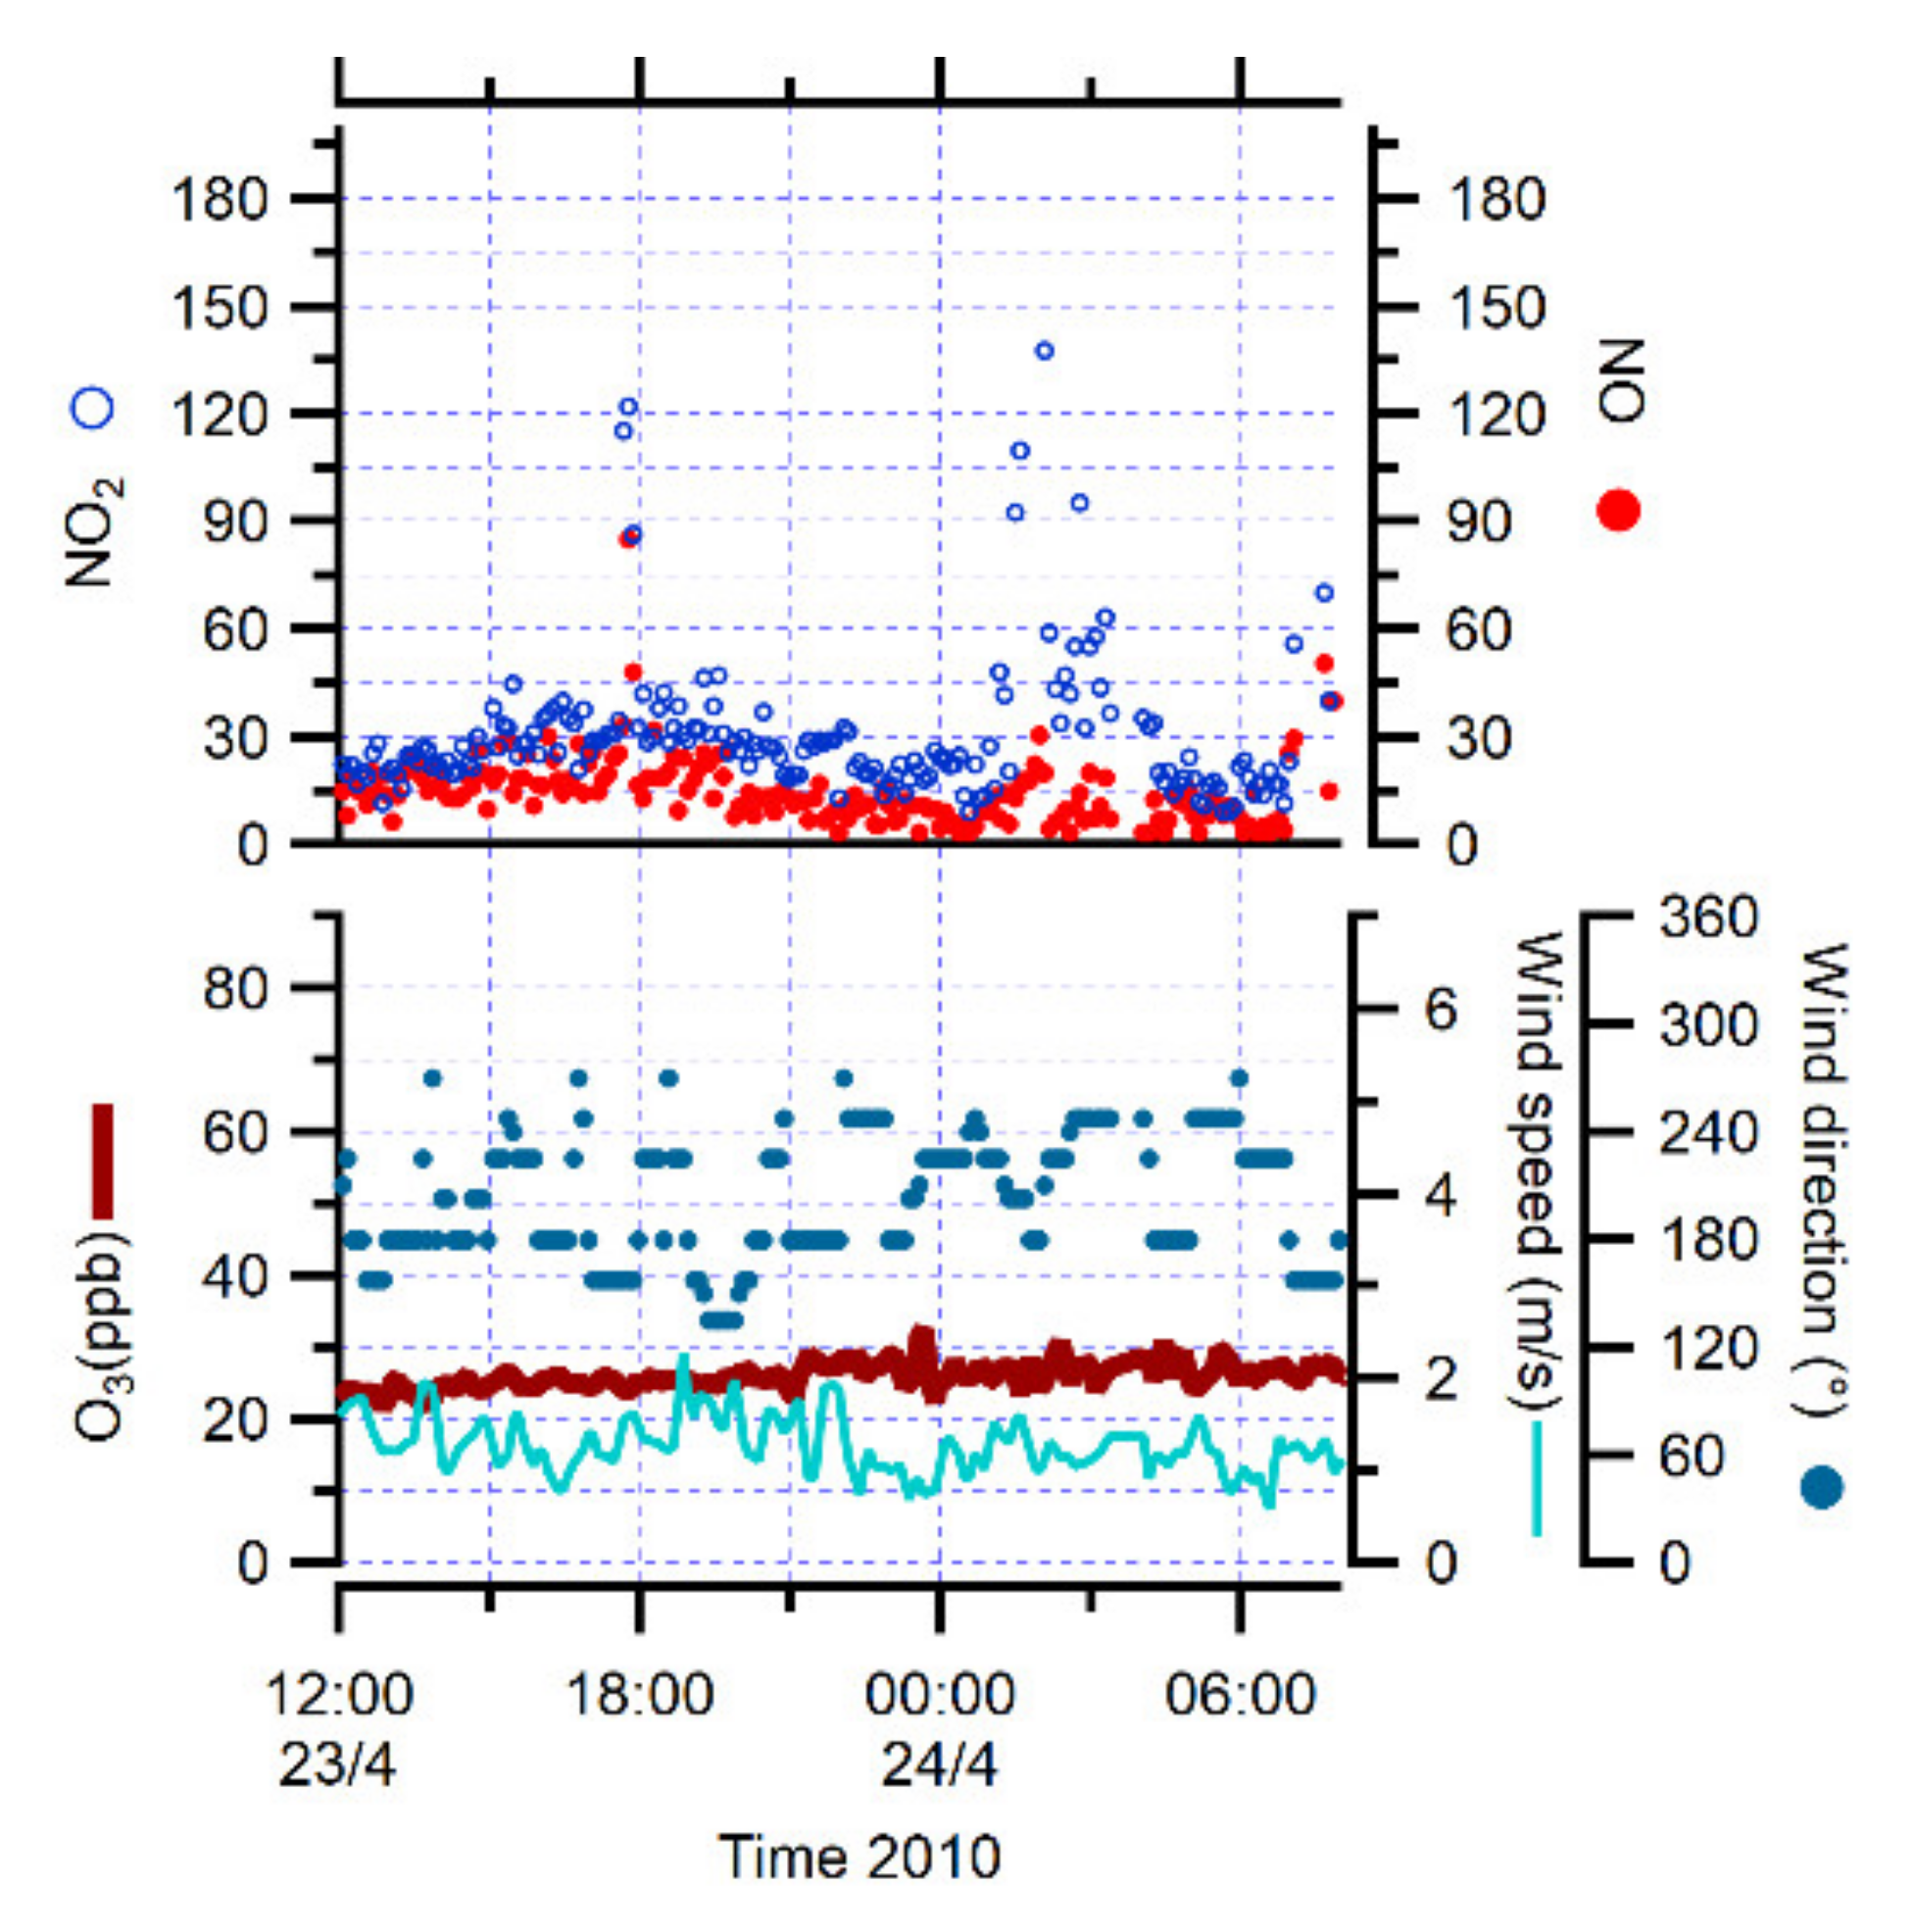
Figure 1. NO, NO2, O3 concentrations, wind speed and direction during the regional pollution episode on 24 April 2010.
Atmosphere 12 00901 g001
Figure 2. (a) NO, NO2, O3 concentrations, wind speed and direction during the transport events from Russia (3 April 2010) and Europe (4 April 2010). (b) 5-day back trajectories for 3 and 4 April 2010 at 23:00 UTC, calculated every 12 h above Ny-Ålesund.
Atmosphere 12 00901 g002
Figure 3. (a) NO, NO2, O3 concentrations, wind speed and direction during the transport event from Europe (15–16 April 2011). (b) 5-day back trajectories for 17 April 2011 at 00:00 UTC, calculated every 12 h above Ny-Ålesund.
Atmosphere 12 00901 g003
Figure 4. Time series of fine and coarse particulate Cl - , fine and coarse particulate Br - , HCl and HBr concentrations together with O3 concentrations from 10 to 27 April 2010 at Ny-Ålesund.
Atmosphere 12 00901 g004
Figure 5. Time series of carbonyl compounds together with O3 concentrations from 7 to 17 April 2011 at Ny-Ålesund.
Atmosphere 12 00901 g005
Figure 6. Time series of NO, NO2 and O3 concentrations, together with isotopic composition of radon progeny (short-lived progeny/long-lived progeny ratio, 214Pbeq/212Pbeq, and very-long-lived component, Cβ), origin (US—NW United States; CA—Canada; GL—Greenland; EU—NW Europe; RU—Russian Federation) and residence time of air masses, wind speed and the absolute humidity during the biomass burning event in July 2015 at Ny-Ålesund.
Atmosphere 12 00901 g006
Figure 7. Time series of NO, NO2 and O3 concentrations, together with isotopic composition of radon progeny (short-lived progeny/long-lived progeny ratio, 214Pbeq/212Pbeq, and very-long-lived component, Cβ), origin (US—NW United States; CA—Canada; GL—Greenland; EU—NW Europe; RU—Russian Federation) and residence time of air masses, wind speed and absolute humidity during a sequence of stability conditions in August 2015 at Ny-Ålesund.
Atmosphere 12 00901 g007
Table 1. Statistics for NO, NO2 and O3 concentrations during the Arctic campaigns of 2010, 2011 and 2015. During the 2010 campaign the clean NO and NO2 data come from [12].
All NOClean NOAll NO2Clean NO2O3
2010pptpptPptpptppb
No. of cases730660157306601519673
Minimum3.33.37.07.04.7
Maximum14,501149.525,927149.869.7
Median12.612.226.024.742.1
Mean33.515.2109.928.639.0
Standard Dev349.812.1769.519.310.1
2011pptpptpptpptppb
No. of cases580447915804479115,230
Minimum3.33.37.07.011.5
Maximum13,887287.678,000365.261.6
Median11.211.232.833.743.1
Mean35.016.3227.548.939.4
Standard Dev276.123.61783.851.610.7
2015pptpptpptpptppb
No. of cases205614131749205614131749181308
Minimum<d. l. 1<d. l. 1<d. l. 1<d. l. 11.1
Maximum94200150095600390050.9
Median505010010024.9
Mean1006030020025.6
Standard Dev7001009002005.8
1 below detection limit.
Table 2. Statistics for halogen compound concentrations during the Arctic campaign of 2010.
HClHBr Cl coarse Cl fine Br coarse Br fine
All periodspptpptpptpptpptppt
No. of cases242424242424
Minimum<d. l. 12.638.710.4<d. l. 10.2
Maximum41.212.5408.268.52.53.1
Median10.14.496.918.90.10.5
Mean12.85.6144.026.60.40.7
Standard Dev9.32.8102.716.50.60.6
O3-depletion periodpptpptpptpptpptppt
No. of cases555555
Minimum16.63.5110.538.81.20.6
Maximum41.212.5408.268.52.53.1
Median21.27.4262.957.91.41.1
Mean25.17.7261.155.81.61.5
Standard Dev11.23.8121.612.70.61.1
1 below detection limit.
Table 3. Statistics for carbonyl compound concentrations during the Arctic campaign of 2011.
HCHOCH3CHOCH3CH2CHOCH3COCH3
All periodspptpptpptppt
No. of cases56543156
Minimum22.812.5<d. l. 12.5
Maximum805.4496.945.61039.0
Median229.2185.521.2333.0
Mean266.3197.624.0370.1
Standard Dev150.1118.510.5198.4
Ozone-depletion periodpptpptpptppt
No. of cases5555
Minimum88.282.28.0303.6
Maximum328.9251.134.81039.0
Median182.6156.712.2463.5
Mean206.1162.618.6534.1
Standard Dev92.859.812.0260.8
1 below detection limit.
Publisher’s Note: MDPI stays neutral with regard to jurisdictional claims in published maps and institutional affiliations.