Article

A Comparison of the Characteristics of Drought during the Late 20th and Early 21st Centuries over Eastern Europe, Western Russia and Central North America

1
Atmospheric Science Program and Missouri Climate Center, School of Natural Resources, University of Missouri, Columbia, MO 65211, USA
2
Institute of Geography, Russian Academy of Sciences, 119017 Moscow, Russia
3
Department of Military Training, Odessa State Environmental University, 65016 Odessa, Ukraine
4
Department of Geography and Geoecology, Belgorod State University, 308015 Belgorod, Russia
*
Author to whom correspondence should be addressed.
Atmosphere 2021, 12(8), 1033; https://doi.org/10.3390/atmos12081033
Submission received: 6 July 2021 / Revised: 9 August 2021 / Accepted: 10 August 2021 / Published: 12 August 2021

Abstract

:
The character of the atmospheric general circulation during summer-season droughts over Eastern Europe/Western Russia and North America during the late twentieth and early twenty first century is examined here. A criterion to examine atmospheric drought events that encompassed the summer season (an important part of the growing season) was used to determine which years were driest, using precipitation, evaporation, and areal coverage. The relationship between drought and the character of the atmosphere, using the Dzerzeevsky weather and climatic classification scheme, atmospheric blocking, teleconnections, and information entropy, was used to study the atmospheric dynamics. The National Centers for Environmental Prediction (NCEP) re-analyses dataset archived at the National Center for Atmospheric Research (NCAR) in Boulder, CO, USA, is used to examine the synoptic character and calculate the dynamic quantities for these dry events. The results demonstrate that extreme droughts over North America are associated with a long warm and dry period of weather and the development of a moderate ridge over the Central USA driven by surface processes. These were more common in the late 20th century. Extreme droughts over Eastern Europe and Western Russia are driven by the occurrence of prolonged blocking episodes, as well as surface processes, and have become more common during the 21st century.

1. Introduction

Drought is a complicated and interdisciplinary problem that has been the subject of many studies in recent years, especially in connection with climate change (e.g., References [1,2] and the references therein). These events impact more people globally than any other natural hazard [2]. Drought can also be classified as meteorological, agricultural, hydrological, and socioeconomic drought, and these definitions can be found in meteorological climate textbooks (e.g., References [3,4]). In general, meteorological drought will onset soonest, followed by agricultural and then hydrologic (e.g., Reference [5]). Socioeconomic drought defines the impact of the other drought types on the supply and demand of economic goods [4].
Formally, drought-type recognition requires the analysis of atmospheric dynamics and hydrological indicators characterizing the atmospheric and soil moisture (e.g., Palmer Drought Indices [6]). However, the use of standardized drought indices (e.g., Standardized Precipitation Index—SPI [7]; Standardized Precipitation Evapotranspiration Index—SPEI [8]) is recommended—the former by WMO for operational use [9]. This allows the drought classification by considering the temporal scales of observed precipitation deficits and the impact on usable water sources. Thus, precipitation deficits for one-to-two months generally defines the onset of atmospheric or meteorological drought. Continued deficits spanning three-to-six months leads to a deficit of soil moisture content, which corresponds to agricultural drought.
In the USA, drought is monitored collaboratively by the National Drought Mitigation Center at the University of Nebraska–Lincoln and the United States Department of Agriculture [10]. They produce a map showing the severity of drought which is used by stakeholders. In the Russian Federation, for example, drought is monitored through the All-Russian Research Institute of Agricultural Meteorology within Roshydromet [11]. Their automated system assesses drought weekly from May through September, using a blend surface data and satellite imagery (Normalized Difference Vegetation Index—NDVI).
In Ukraine, information about droughts is represented by the Ukrainian Hydrometeorological Center [12], namely the Department of Agrometeorology, which provides information to agricultural decision and policymakers about the occurrence, development, and intensity of drought by regions. Satellite monitoring of droughts is being carried out experimentally by the Ukrainian National Space Facilities Control and Test Center [13], which provides public information about spatiotemporal distribution of the vegetation indices (e.g., NDVI) through their geoinformation portal.
In Europe, drought is monitored by the European Drought Observatory (EDO; see Reference [14]), which is maintained by the Joint Research Centre—EU Science Hub [15]. The EDO provides public drought-relevant information, such as maps of indicators derived from different data sources (e.g., precipitation measurements, satellite measurements, and modeled soil moisture content), as well as different tools for displaying and analyzing the information and drought reports.
Studying drought is difficult, since it occurs on timescales associated with the general circulation (sub-seasonal timescales or greater), but the spatial scale can vary from as small as the lower part of the meso-scale up to the planetary-scale. Even temporally, the drought period may not overlap with calendar months, but drought can have an impact on important phenological times in agriculture [16,17]. During different stages of development, the plant water demand depends on prevailing weather conditions, defined by using meteorological parameters (e.g., temperature, precipitation, and wind). For prolonged meteorological drought, anomalies in characteristics, such as potential evapotranspiration, soil water, or groundwater and reservoir levels, are observed [18]. For example, Reference [16] demonstrated that the important part of the growing season (reproductive stage) for corn and soybean in the Central USA is July and August, respectively, even though the entire growing season can impact growth and yield. Then Reference [17] shows the impact of dry periods on winter and spring wheat in the Missouri River Basin. Additionally, the large-scale economic, agricultural, and societal impact of drought typically determines what years tend to be remembered as “drought years” in the mind of public opinion.
Drought has such a large impact on agriculture and the economy [16,17,18,19,20] and even human mortality [20]. All populations are vulnerable to a certain extent, and different societies are more resilient to the stress of drought. Many studies (e.g., References [21,22]) have developed methodologies for assessing the relative vulnerability of populations to drought. For example, Reference [21] measures exposure multidimensionally in the USA by including drought frequency, population, and freshwater ecosystems affected. Others, such as Reference [22], used socioeconomic indicators, such as available natural resources, economic capacity, human resources, and infrastructure and technology, to compare drought vulnerability across Africa.
Many studies examine the meteorological factors contributing to drought. Over North America, studies such as References [23,24] (and the references therein) attributed the drought of 1980 to an accentuated and persistent upper air (500 hPa) ridge over the center of the USA, and strong troughs off the Pacific and Atlantic coasts, respectively. This drought was preceded by cooler sea surface temperature (SST) anomalies over the Central Tropical Pacific for about two seasons previous to the onset of drought, and the 500 hPa flow pattern had already been established by spring. This drought is memorable for the impact on agriculture and the economy of the USA (e.g., References [23,24]).
Later, Reference [25] supported the view of References [23,24] regarding the spring (precursor) 500 hPa pattern and identified an unusual Pacific North American (PNA) teleconnection pattern associated with a shorter wavelength while studying a late spring blocking event over North America. Studies such as References [26,27] (and the references therein) associated certain Pacific Ocean Basin SST anomalies with upper air patterns over North America, and these could be correlated with temperature and precipitation anomalies for much of the middle of the USA and in particular, the State of Missouri. The work of References [28,29,30,31] extended that of Reference [26] and found that prominent SST patterns varied in association with interannual (e.g., El Niño and Southern Oscillation—ENSO) and interdecadal variability (e.g., Pacific Decadal Oscillation—PDO).
Additionally, many others have examined drought and the variability across the USA or North America [32,33,34,35,36,37,38]. Certain ENSO-related SST anomalies correlated with warm and dry temperature anomalies for the Upper Midwest, Central USA, and the Gulf Coast [34,35,36]. Winter dryness is associated with weak El Niño events, while La Niña summers are associated with summer dryness [28,29,38] in Missouri, but Reference [30] demonstrated that the ENSO impact on precipitation is different for the Upper Midwest versus the Lower Mississippi Valley. In the west, Reference [38] found long-lived drought is linked to La Niña, and these droughts can extend into the Central USA. Moreover, Reference [29] associated cooler and wetter summers during 1971–2002, with more blocking and blocking days versus drier and warmer summers.
However, References [32,33] demonstrated that streamflow in the Upper Midwest and Gulf of Mexico regions revealed wet (dry) conditions during El Niño (La Niña) during the mid- to late-20th century. Then Reference [35] found than in general, the Southeast USA is dry during El Niño years throughout the 20th century. Initially, these results seem contradictory, but Reference [37] found that streamflow, as an indicator, has a long memory. Lastly, Henson et al. [31] (and the references therein) studied the relationship between interannual and interdecadal variability of Pacific Region SSTs, growing season conditions, and corn and soybean yields in Missouri. They found that yields were generally less during the transition toward La Niña years, as these were associated with warmer and drier summers.
Within Europe and Asia, a series of dry years has been observed within the last 15 years (e.g., Reference [39]), and several of these have influenced Eastern Europe and Russia (e.g., Reference [40]). Ionita et al. [39] demonstrated that past “megadrought epochs” over Central Europe were decadal in nature. They also determined these could be linked to solar activity, the Atlantic Multidecadal Oscillation, and atmospheric circulation epochs, including those that are associated with atmospheric blocking. Additionally, they demonstrated that the current spate of Eurasian drought at the start of the 21st century is similar to multidecadal droughts in the past and within the range of past variability. The work of Reference [41] found that the trend in drought and drought severity over the globe is steady since the mid-20th century, and Reference [42] found a similar result for Central and Eastern Europe. The latter study did find some local trends within the broader region.
In the southern part of the East European plain, Cherenkova et al. [43] demonstrated the average yield for winter wheat, spring wheat, and spring barley in the westerly phase of the Quasi-Biennial Oscillation (QBO) exceeded the same yield for the eastward QBO. They attributed the difference to different rainfall patterns and drought frequency over this region for opposing phases of the QBO. In a follow-up article, Reference [44] found an increase in the frequency of dangerous atmospheric droughts during the 1995–2014 period when compared to 1963–1994. They found this was due to an increase in the frequency and intensity of blocking anticyclones in the Atlantic–European region during spring and summer for the period 1963–2016, especially around 30° E longitude.
The 2010 drought in Eastern Europe and Russia has been attributed to summer season blocking episodes (e.g., References [45,46] and the references therein), and these studies examined the dynamic interaction between the synoptic-scale and large-scale in supporting these blocking events [45]. The latter [46] associated five well-known dry and wet years with ENSO variability across the region. They linked the transition of ENSO with dry summers. Then Reference [47] (which Reference [44] supports) linked a warmer drier climate of Southwestern Russia with the increase in certain weather types, including blocking.
The association of Northern Hemisphere (NH) weather types with dry and wet periods was championed by the work of N.K. Kononova (e.g., References [48,49,50,51,52]). These NH weather types, termed elemental circulation mechanisms (ECMs), were first proposed by Reference [53]. This work identified 13 different NH flow types and 41 subtypes based on the amplitude, location, and number of waves on the polar front jet stream [54]. These could be grouped into four general NH flow types, namely two zonal and two meridional types. The studies of References [48,49,50] used these four NH flow types in their studies of NH flow regime climatologies and dynamics.
Further, References [48,49,50,51,52] would associate an epoch of relatively zonal flow during the early to mid-20th century with the dry years over North America and parts of Russia during the 1930s. Then References [54,55] relate global and regional temperature changes, respectively, to changes in the dominant type of NH ECM. The relationship between the ECM and NH teleconnection activity, as well as the theoretical work of Lorenz and others, was discussed in more detail in Reference [55]. Briefly, the authors [55] argued that these ECM may be subjectively classified quasi-steady states within NH flow regimes. These are similar to teleconnections which are generally local phenomena except for the Arctic Oscillation (AO). They also demonstrate that long-term epochs of relatively zonal or meridional ECM occurrences correspond to epochs of lower or higher AO. Moreover, teleconnections such as the PNA are associated with long period Rossby Wave trains (e.g., Reference [56]). Additionally, Reference [54] demonstrated that the concept of information entropy could be applied to the relative occurrence of zonal versus meridional flow types.
This classification is also convenient for the definition of synoptic processes influencing the occurrence of regional weather hazards often related to drought, such as a dry hot wind, called “Sukhovey” in Ukraine and Russia [57]. This dry hot wind is widespread throughout steppe areas of Eastern Europe during the warm season of the year. They may accompany drought seasons or may occur during other years, but they are always associated with the periphery of anticyclones. Droughts in this region usually occur under large-scale anticyclones or ridges [58].
The goal of this study is to examine the occurrence of summer season meteorological and agricultural drought and the atmospheric circulation and dynamics from 1970 to 2020 over agriculturally sensitive regions of North America (NA) and Eastern Europe and Western Russia (EE/WR). The work of Reference [46] selected only five years from the latter region based on the precipitation anomalies only. Moreover, drought has been more frequent during the previous decade in both regions providing motivation for study. Here, we develop an objective criterion for summer-season drought based on precipitation and potential evaporation anomalies, as well as the amount of area impacted by using composite re-analyses that are comparable to time-series indexes in identifying drought. The occurrence of summer-season drought is here related to longer-term atmospheric variability; we also relate these droughts to the frequency and strength of atmospheric blocking and the relative occurrence of zonal versus meridional ECMs during summer. We also examine whether drought in each region is commonly associated with precursors and differentiate between the atmospheric circulation character of extreme drought summers versus moderate drought summers.

2. Data and Methods

2.1. Data

The NH 500 hPa height (m), precipitation rate (mm day−1) (P), and potential evaporation (W m−2) (E) data were retrieved from the National Centers for Environmental Prediction (NCEP)/National Center for Atmospheric Research (NCAR) re-analyses [59], available through the NOAA Earth System Research Laboratory (ESRL) website. These data are available at time intervals from 6 h to monthly and on a 2.5° latitude by 2.5° longitude grid from 1948 to 2020. The potential evaporation data were converted to mm day−1 by dividing E by the latent heat of vaporization (L = 2.5 × 10⁶ J kg−1) and the density of water (1000 kg m−3). The study period was 1970–2020.
The observed atmospheric blocking information was obtained from the blocking archive housed in the University of Missouri Weather Analysis and Visualization (WAV) laboratory by the Global Climate Change Group (GCC) [60]. Briefly, a generic definition for atmospheric blocking is that these events are persistent quasi-stationary anticyclones or ridges in the mid-latitude jet stream [61]. The blocking information used was duration (days) and intensity (BI) and is available from 1968 to 2021. Blocking events within the EE/WR were examined consistent with References [46,47] (20°–60° E) and during the spring and summer seasons. Over the NA region, blocking is relatively rare over the continental region (e.g., References [25,62]), and extreme weather over NA, especially the central region, has traditionally been associated with blocking over the Eastern North Pacific Region (e.g., References [25,62,63]). Here we define the Eastern Pacific as 180°–100° W, consistent with Reference [62] and other studies. The teleconnection indexes, specifically the AO, the North Atlantic Oscillation (NAO), and PNA, were downloaded from the Climate Prediction Center website [64].
These teleconnections were chosen, since these are commonly associated with weather and climate in the study regions, which are defined below. Moreover, the AO does show correspondence with zonal versus meridional ECM groups (e.g., Reference [55]). The daily classifications of the ECM, as well as their monthly and annual statistics since 1899, are available for download via the Russian Academy of Sciences, Institute of Geography website, “Fluctuations in the Atmospheric Circulation of the Northern Hemisphere in the 20th and Early 21st Century” [65].
The definition for ENSO used in this study is described in Reference [62] and the references therein, and a brief description is given here. The Japanese Meteorological Agency (JMA) ENSO index is available via the Center for Ocean and Atmospheric Prediction Studies (COAPS) from 1868 to present [66]. The JMA classifies ENSO phases by using SST within the bounded region of 4° S to 4° N, 150° W to 90° W and defines the start of an ENSO year as 1 October, and its conclusion on 30 September of the following year. This index is used in many other published works (see Reference [62] and the references therein), and a list of years is provided below (Table 1). This index is useful since it acknowledges the longevity of ENSO events, but it may produce different classification for years versus other definitions. For example, Reference [67] found that, while the JMA index is more sensitive to La Niña events than other definitions, it is less sensitive than other indices to El Niño events.

2.2. Methods

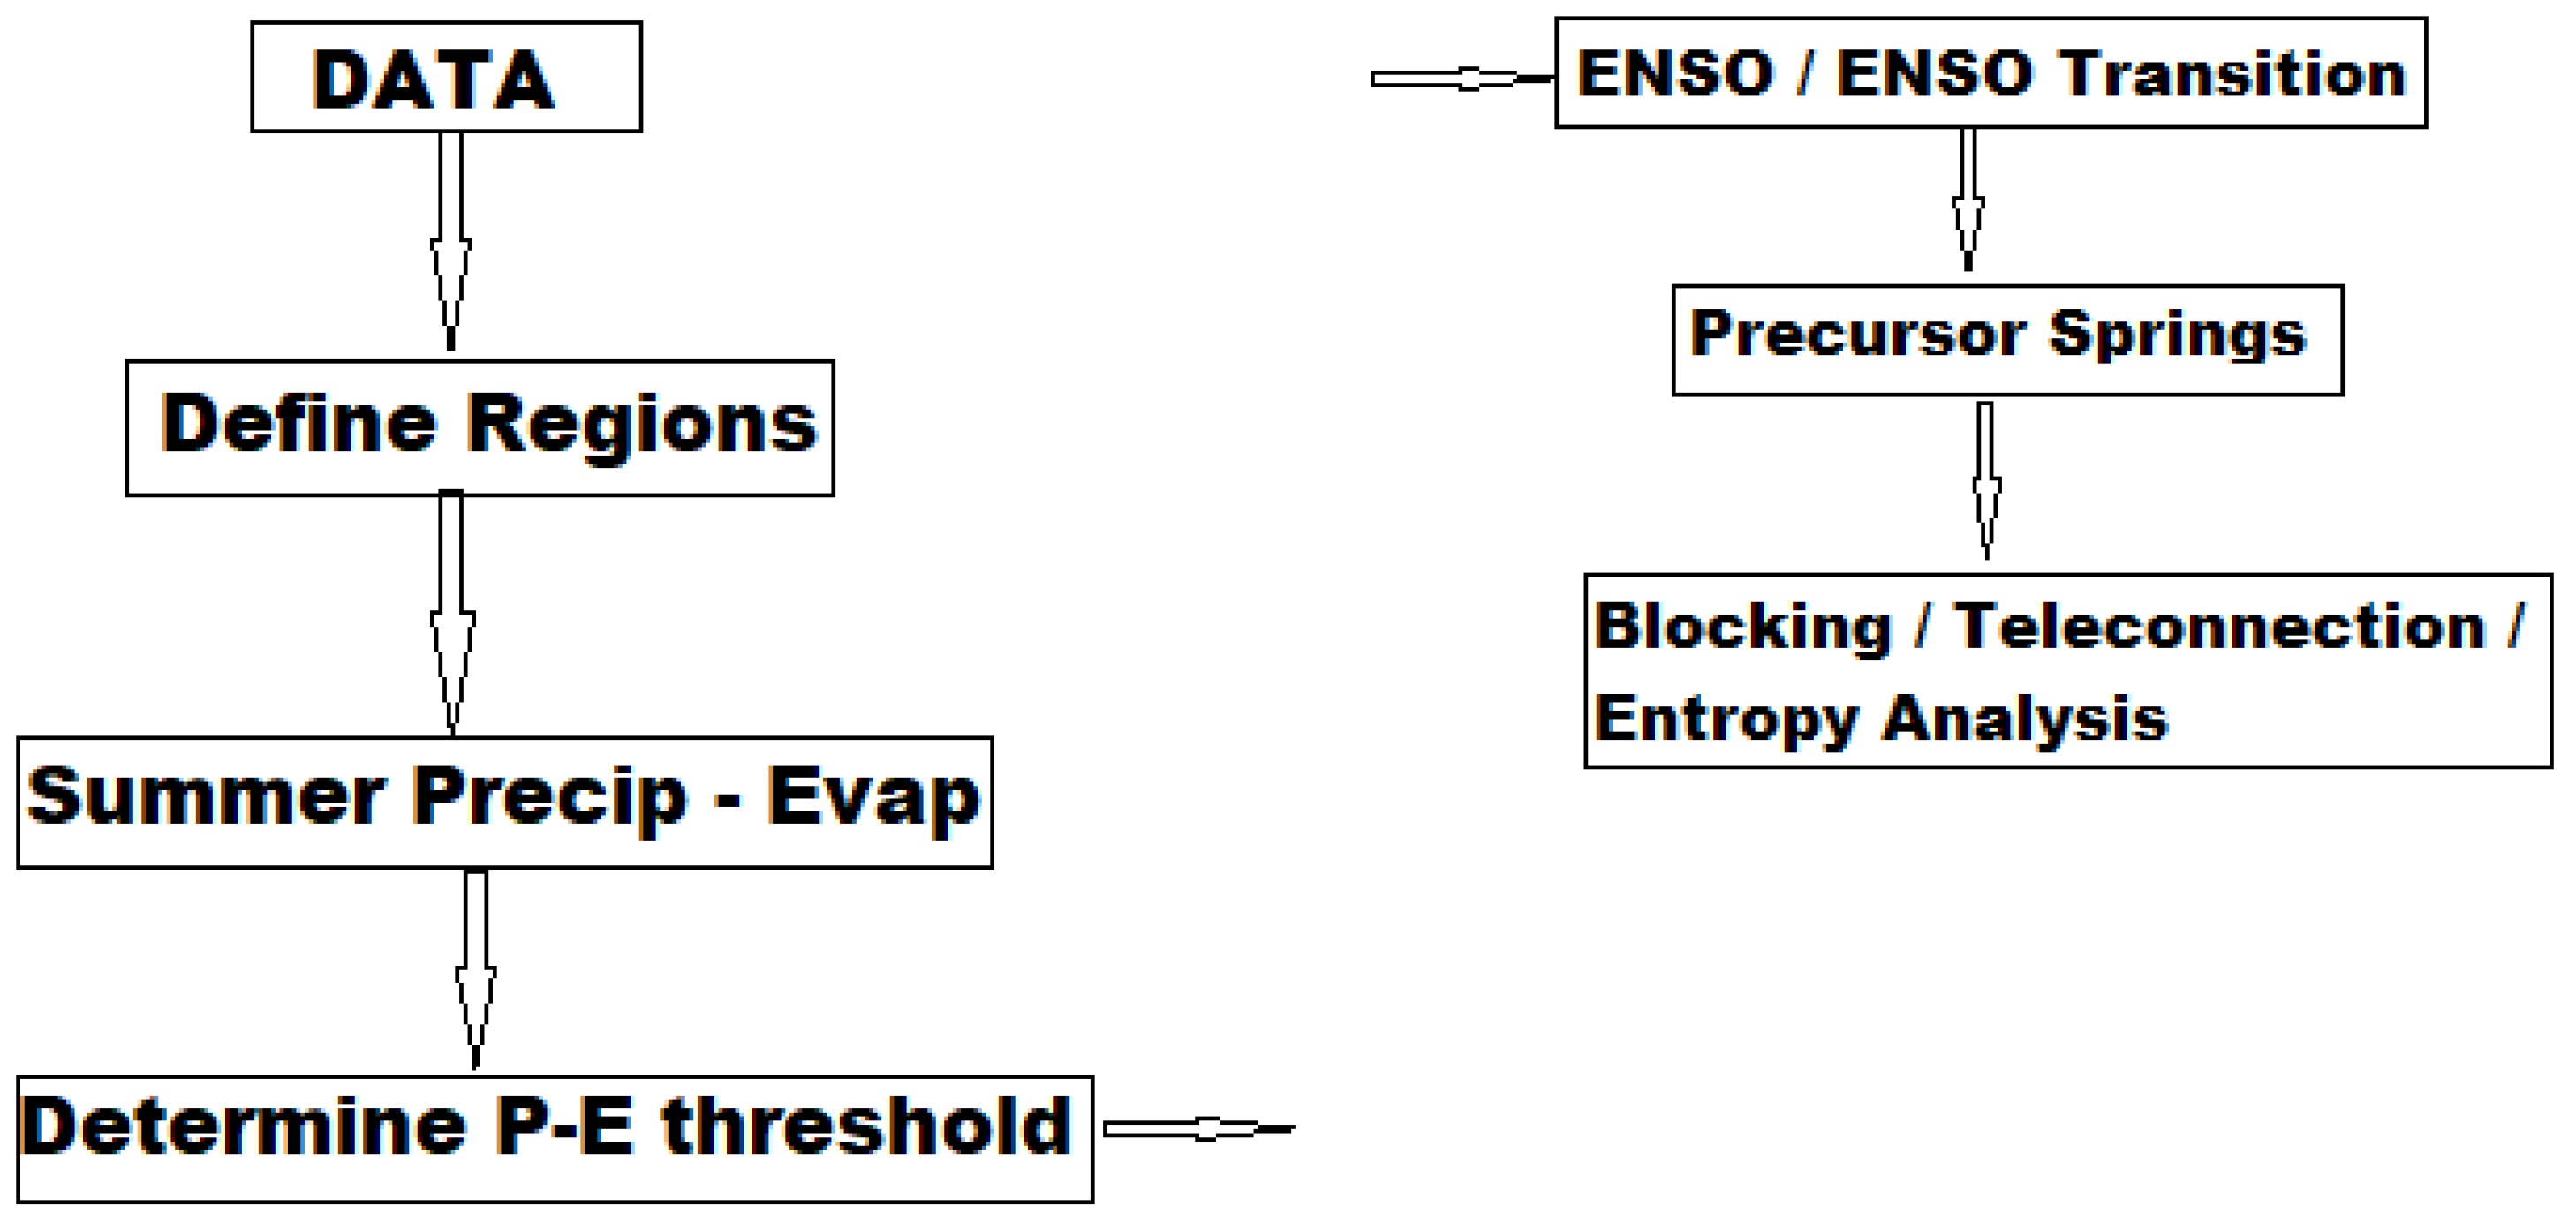
This study examines meteorological drought and the accompanying atmospheric circulation within agriculturally sensitive regions of North America (NA) and Eurasia, specifically Eastern Europe and Western Russia (EE/WR). However, given the definition of agricultural drought and the variables used here [18], the results can be extended to this type of drought. These regions were bounded by the boxes outlined below (Figure 1) and following the flowchart in Figure 2. Over NA, this box is bounded by 30° N and 50° N, and 100° W and 80° W, including much of the corn, wheat, soybean belts in NA (e.g., References [17,31]). Over EE/WR, this box is bounded by 40° N and 60° N, and 20° E and 50° E, including the major wheat growing regions of Eastern Europe, Ukraine, and Western Russia. Soybeans, corn, sugar beet, and sunflower are also primary crops of Southwestern Russia. In Ukraine, for example, winter wheat, spring barley, and corn are the main grain crops. Sunflowers and sugar beets are also major crops. Winter wheat and spring barley accounts for about 90–95% percent of the total area for relevant crops and grows throughout Ukraine. Corn is the third most important feed grain, planted in areas located predominantly in Eastern and Southern Ukraine [68]. In the neighboring countries of Eastern Europe, the same grain crops (wheat and barley) are grown, taking into account latitudinal differences in agroclimatic conditions comparing to Ukraine.
Additionally, these areas are large enough to identify a regional circulation signal as it relates to atmospheric teleconnection activity. However, as demonstrated by References [28,29,30] and others, the regions may be large enough to produce different ENSO signals in the temperature and precipitation regimes for different parts of the region. The total area of the NA study region is 3.786 × 10⁶ km2 and the EE/WR study region is 4.765 × 10⁶ km2, which means the latter region is approximately 25% larger.
A description and the history of ECM developed by Reference [53] can be found in References [48,49,50,51,52,53,54]. The original work of Reference [53] included four circulation groups which are displayed in Table 2 (adapted from Reference [54]—their Table 1). As described above, the ECM comprises 13 main circulation types separated into 41 subtypes identified subjectively based on surface maps originally. Then Reference [69] used 500 hPa maps when these became routinely available by the late 1940s. Many of these references (e.g., References [54,55]) show maps of the NH as examples of these flow regime types. The subtypes are identified based on the amplitude of the NH mid-latitude flow daily and then categorized these based on the timing (warm or cold season), the geographical location, and number of ridge–trough couplets in the jet stream. In relation to the onset of extreme hydrometeorological phenomena, such as droughts or floods, the type of ECM identified make it possible to examine the geographical distribution of key synoptic and large-scale atmospheric features including blocking (e.g., Reference [70]).
The study of meteorological drought in EE/WR by Reference [46] defined drought based on the precipitation amounts in the Moscow and Belgorod region alone during the summer season and based on five years which were known to be dry and impact regional agriculture. In providing an objective criterion accounting for precipitation and evaporation, the following definition is used: (1) the largest difference between the maximum precipitation anomaly (mm day−1) and the potential evaporation anomaly (mm day−1—near the location of the former) within the study region; and (2) the areal coverage of the negative precipitation anomaly. Using precipitation- and evaporation-based indexes (e.g., the Palmer Drought Severity Index—PDSI) for meteorological drought is common (e.g., References [34,35,36,37,38]). These indexes are generally derived as long-term time series, whereas here we developed seasonal composite spatial maps of precipitation and potential evaporation.
The study regions defined above were large enough to have some portion of the region be drier than normal during approximately 80% of the entire study period. In providing for a large enough sample of summer seasons, but avoid making most summer seasons drought summers, the criterion for drought was refined (Table 3 and Table 4). If criterion one was greater than −9 mm day−1, the year was labelled as an extreme drought season. If criterion one was less than −9 mm day−1 and the areal extent was larger than 1.893 × 10⁶ km2 (50% of the NA region and 40% of the EE/WR), that year was considered a moderate drought year. Using this criterion (−9 mm day−1 and the area) includes nearly all years recognized by the respective societies and studies cited in section one as impactful drought years. The extreme drought sample size was ten and eight years for the NA and EE/WR study regions, respectively. The respective moderate drought sample size was 12 and eight years. Additionally, using a threshold to define drought has been used by other studies (e.g., References [35,36,71]).
The work of Reference [54] used the concept of Shannon or information entropy to discuss the relative frequency in the occurrence of zonal versus meridional flows. In Table 2, Type 1 and Type 2 flows were considered zonal NH flow regimes, while Type 3 and 4 are meridional NH flow regimes. The formula used for information entropy was as follows:
H ( x ) = i = 1 n p ( x i ) log b p ( x i )
where b is the base logarithm and p(x) is the probability of a certain outcome. Entropy is described as a measure of predictability, structure, or organization within a system [72] (and references therein). Moreover, Reference [54] discusses information entropy in more detail. Briefly, an unbiased coin should result in H(x) = 1.00. As described in Reference [54] and using the NH flow types of Reference [53], the information entropy for the NH observed flow would be 0.99 if all 41 of the NH flow types in Reference [53] were equally likely (Type 1 and Type 2 account for 18 of the 41 subtypes or 44%). The observed information entropy from 1899 to the present was 0.90, and the years since the late 20th century and early 21st century were 0.76 and 0.57, respectively. These were significant departures from the overall sample [54]. All of these values for information entropy are for calendar years from 1899 to the present. Thus, here we examine spring and summer season values of information entropy, work which was not done in Reference [54].

3. Results

In this section, the occurrence of summer-season drought over the study regions shown in Figure 1 and Table 3, Table 4 and Table 5 are examined. A comparison to Reference [46] and previous work is performed where relevant. Many of the summer seasons over the period 1970–2020 that were regarded as very dry and impactful by other studies (see Introduction) to agriculture are identified by the criterion used here. Six summers were drought summers in both regions simultaneously (Table 3 and Table 4).

3.1. Interannual and Interdecadal Variability

The forecasting of drought one year in advance across the Missouri River Basin and the USA in general based in decadal scale variability was calculated to be $80M and $1.1B by References [73,74], respectively. Thus, interannual and interdecadal variability in the large-scale flow patterns and their relationship to local temperature and precipitation is important for generating long-range forecasts. A cursory examination of the NA study region summer droughts demonstrated that 13 of the 22 years identified occurred during the decade of the 1970 and 2010s (Table 3). A similar result can be seen for the EE/WR region as 8 of 16 summer-season droughts occurred during these same decades. The extreme summer droughts occurred most often during the 1970s for NA and the 2010s for EE/WR. In the latter region, these can be related teleconnections, such as the AMO (e.g., Reference [39]), PDO (e.g., Reference [37]), or interdecadal variability of blocking (e.g., References [62,75]). In the NA region, the earlier decade overlaps with the changeover of the PDO from negative (1949–1976) to the positive (1977–1998) phase. For the later decade it is not clear that the PDO has changed from the current negative phase yet. This suggests a PDO signal which is consistent with References [2,31], who found the negative PDO years were drier in this region. However, Reference [75] finds a 20-year cycle in NA continental drought. Moreover, References [37,76] found a PDO signal, but Reference [76] related this to the positive PDO for drought over the USA. Additionally, a cursory examination of the decadal epochs of the AO and NAO (see Reference [64]) demonstrates that dry summer season are associated generally with certain values of these indexes.
When examining the ENSO related variability over NA (Table 3) from 1970 to 2020, a complex pattern emerges. Four of the ten extreme summer droughts were associated with LN years. If moderate drought years are included, seven of 11 LN (22% of all study years) occurred during the study period. On the other hand, five of the moderate summer drought years were EN years (14 total years or 27%). Thus, it is apparent that the distribution of extreme summer drought years is skewed toward LN years, while moderate summer droughts are skewed toward EN years.
However, when testing these distributions by using a simple Chi-square goodness of fit test (e.g., Reference [77]) only the result for extreme summer drought distribution is different from that of the total sample, but not at standard levels of statistical significance. This may be due to the small sample size and low number of bins. Across the study region, Reference [29] shows that EN years are dry, while for LN years this depends on the phase of the PDO (drier during the negative PDO). These results found here would be consistent as the extreme drought summers occur during LN and NEU years, as in Reference [38], but also during the negative PDO. The moderate dry summers occurring over more than 50% of the region is consistent with Reference [29], as well. The connection of dry years to LN years is supported by References [38,76].
Further, examining the ENSO transition summers indicates that five of the extreme summer-season droughts involved a transition in the positive direction (Table 3), defined as toward EN since EN are associated with positive SST anomalies. Six of the moderate summer drought years as associated with negative transitions. There was a total of 15 positive and 14 negative transitions during the 51-year period of study.
Within the EE/WR region (Table 4), there is only a slight tilt toward EN years for extreme summer-season drought, while the opposite was true for moderate summer drought years. Spatially, for the extreme summer droughts, the precipitation deficit was larger in the northern part of the study region, while the opposite was generally true for moderate summer droughts (not shown; e.g., Reference [46]). There were no EN years associated with moderate drought summers. The Chi-square test was applied here and for this region, the moderate drought summer distribution was not the same as the total distribution but not at standard levels of significance. There was no preference found for positive versus negative summer ENSO transitions overall across the study region. These results are similar to those of Reference [46], which found no real preference for transitions in the positive or negative direction in the Moscow region. They also found a preference for the transition toward EN years for the Belgorod Region.
Interestingly, when considering the bioclimatic potential by using indexes (e.g., hydrothermal coefficient or bioclimatic potential) that combine both surface temperature and precipitation during the growing season for the time period 1988–2014, Reference [78] found that in the Belgorod and Missouri USA region, these indexes were lower (associated with drought) for both EN and LN years and higher for NEU years. Their results were significant at p = 0.01 for LH growing seasons in Belgorod and EN years for Missouri in the USA.
Table 5 shows the wet years for both study regions. There are no statistical preferences for EN versus LN years or ENSO phase transitions. In Table 3, Table 4 and Table 5, a majority of the summer drought years in both regions were preceded by a dry spring. However, for the extreme summer droughts over EE/WR, only half of these were preceded by a dry spring. Thus, the results of Reference [46], which concluded that summer droughts were not necessarily preceded by a dry spring in the EE/WR region, may have been biased by the fact that their small sample of years were mainly in the extreme category here. The majority of the wet years were not preceded by wet springs in either region.

3.2. Synoptic–Dynamic Analysis

In References [52,54], the annual frequency of zonal versus meridional ECM or 500 hPa NH flow regimes were examined to define long-term circulation epochs. Both of these studies related the occurrence of these epochs with global annual temperature, blocking, and hazardous weather. Neither of these references examined the seasonal frequency of zonal and meridional flow epochs and this can be examined here as it relates to summer-season drought in our study regions. As argued in Reference [54], if each of the ECM defined originally by Reference [53] were equally likely, then the frequency of occurrence for zonal to meridional ECM would be 0.46 to 0.54. However, in Reference [54] the frequency of occurrences from 1899 to 2019 was 0.31 to 0.69, yielding a value of 0.90 for the information entropy.
From 1970 to 2020, the frequency of occurrence for zonal to meridional flows was 0.20 to 0.80 and the value of the information entropy was 0.73 which is similar to the 1899–2019 distribution [54] at p = 0.1 when using the Kolmogorov–Smirnov or Chi-Square goodness of fit test. However, the 1970–2020 values are similar to those of 1957–2019 (see Reference [54]). If the frequency of zonal and meridional flow types is examined over the course of a year [65], it is apparent that zonal flows occur more often during the summer season and less so during the cold season. The frequency of occurrence for zonal flows to meridional flows during spring and summer were 0.18 to 0.82 and 0.25 to 0.75, respectively. The information entropy was 0.68 and 0.82, respectively, but the difference is not statistically significant.
In the previous section, it was established that the majority of summer-season droughts (about 70%) in both regions followed after drier spring seasons. An examination of the relative occurrence of blocking, teleconnections, and zonal versus meridional NH flow regimes for spring and summer is shown in Figure 3, Figure 4 and Figure 5.

3.2.1. Preceding Spring Seasons

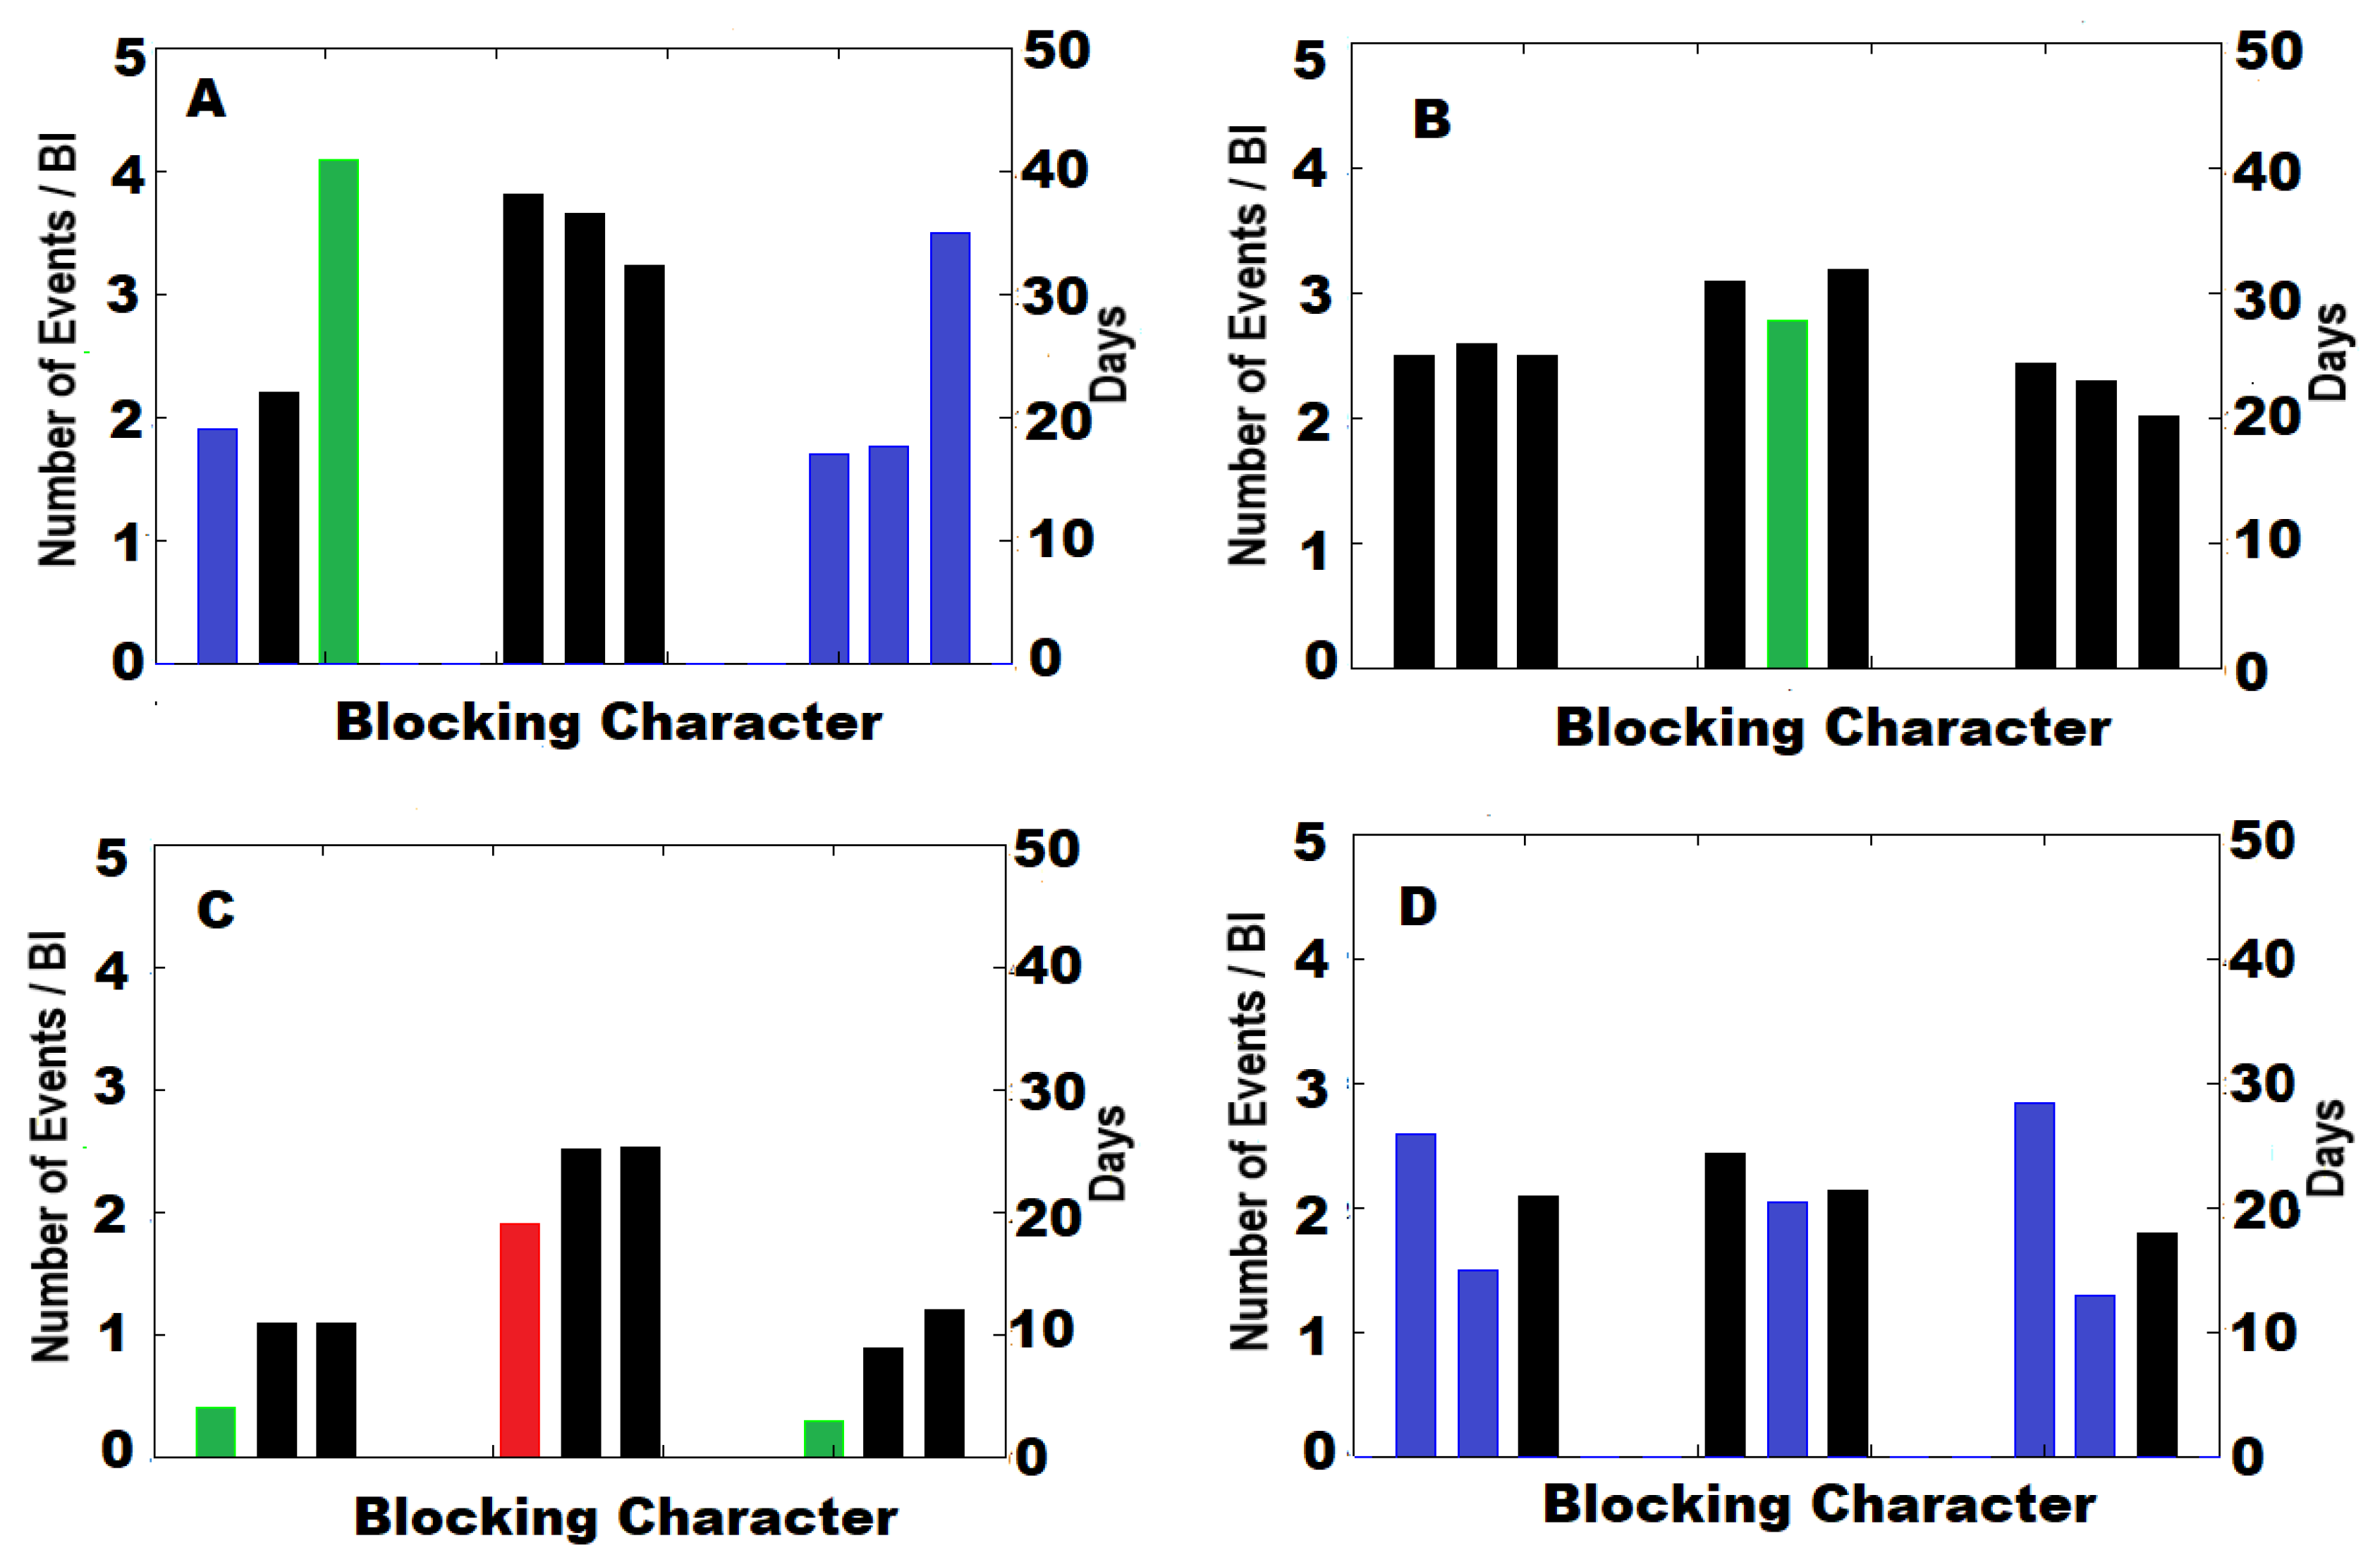
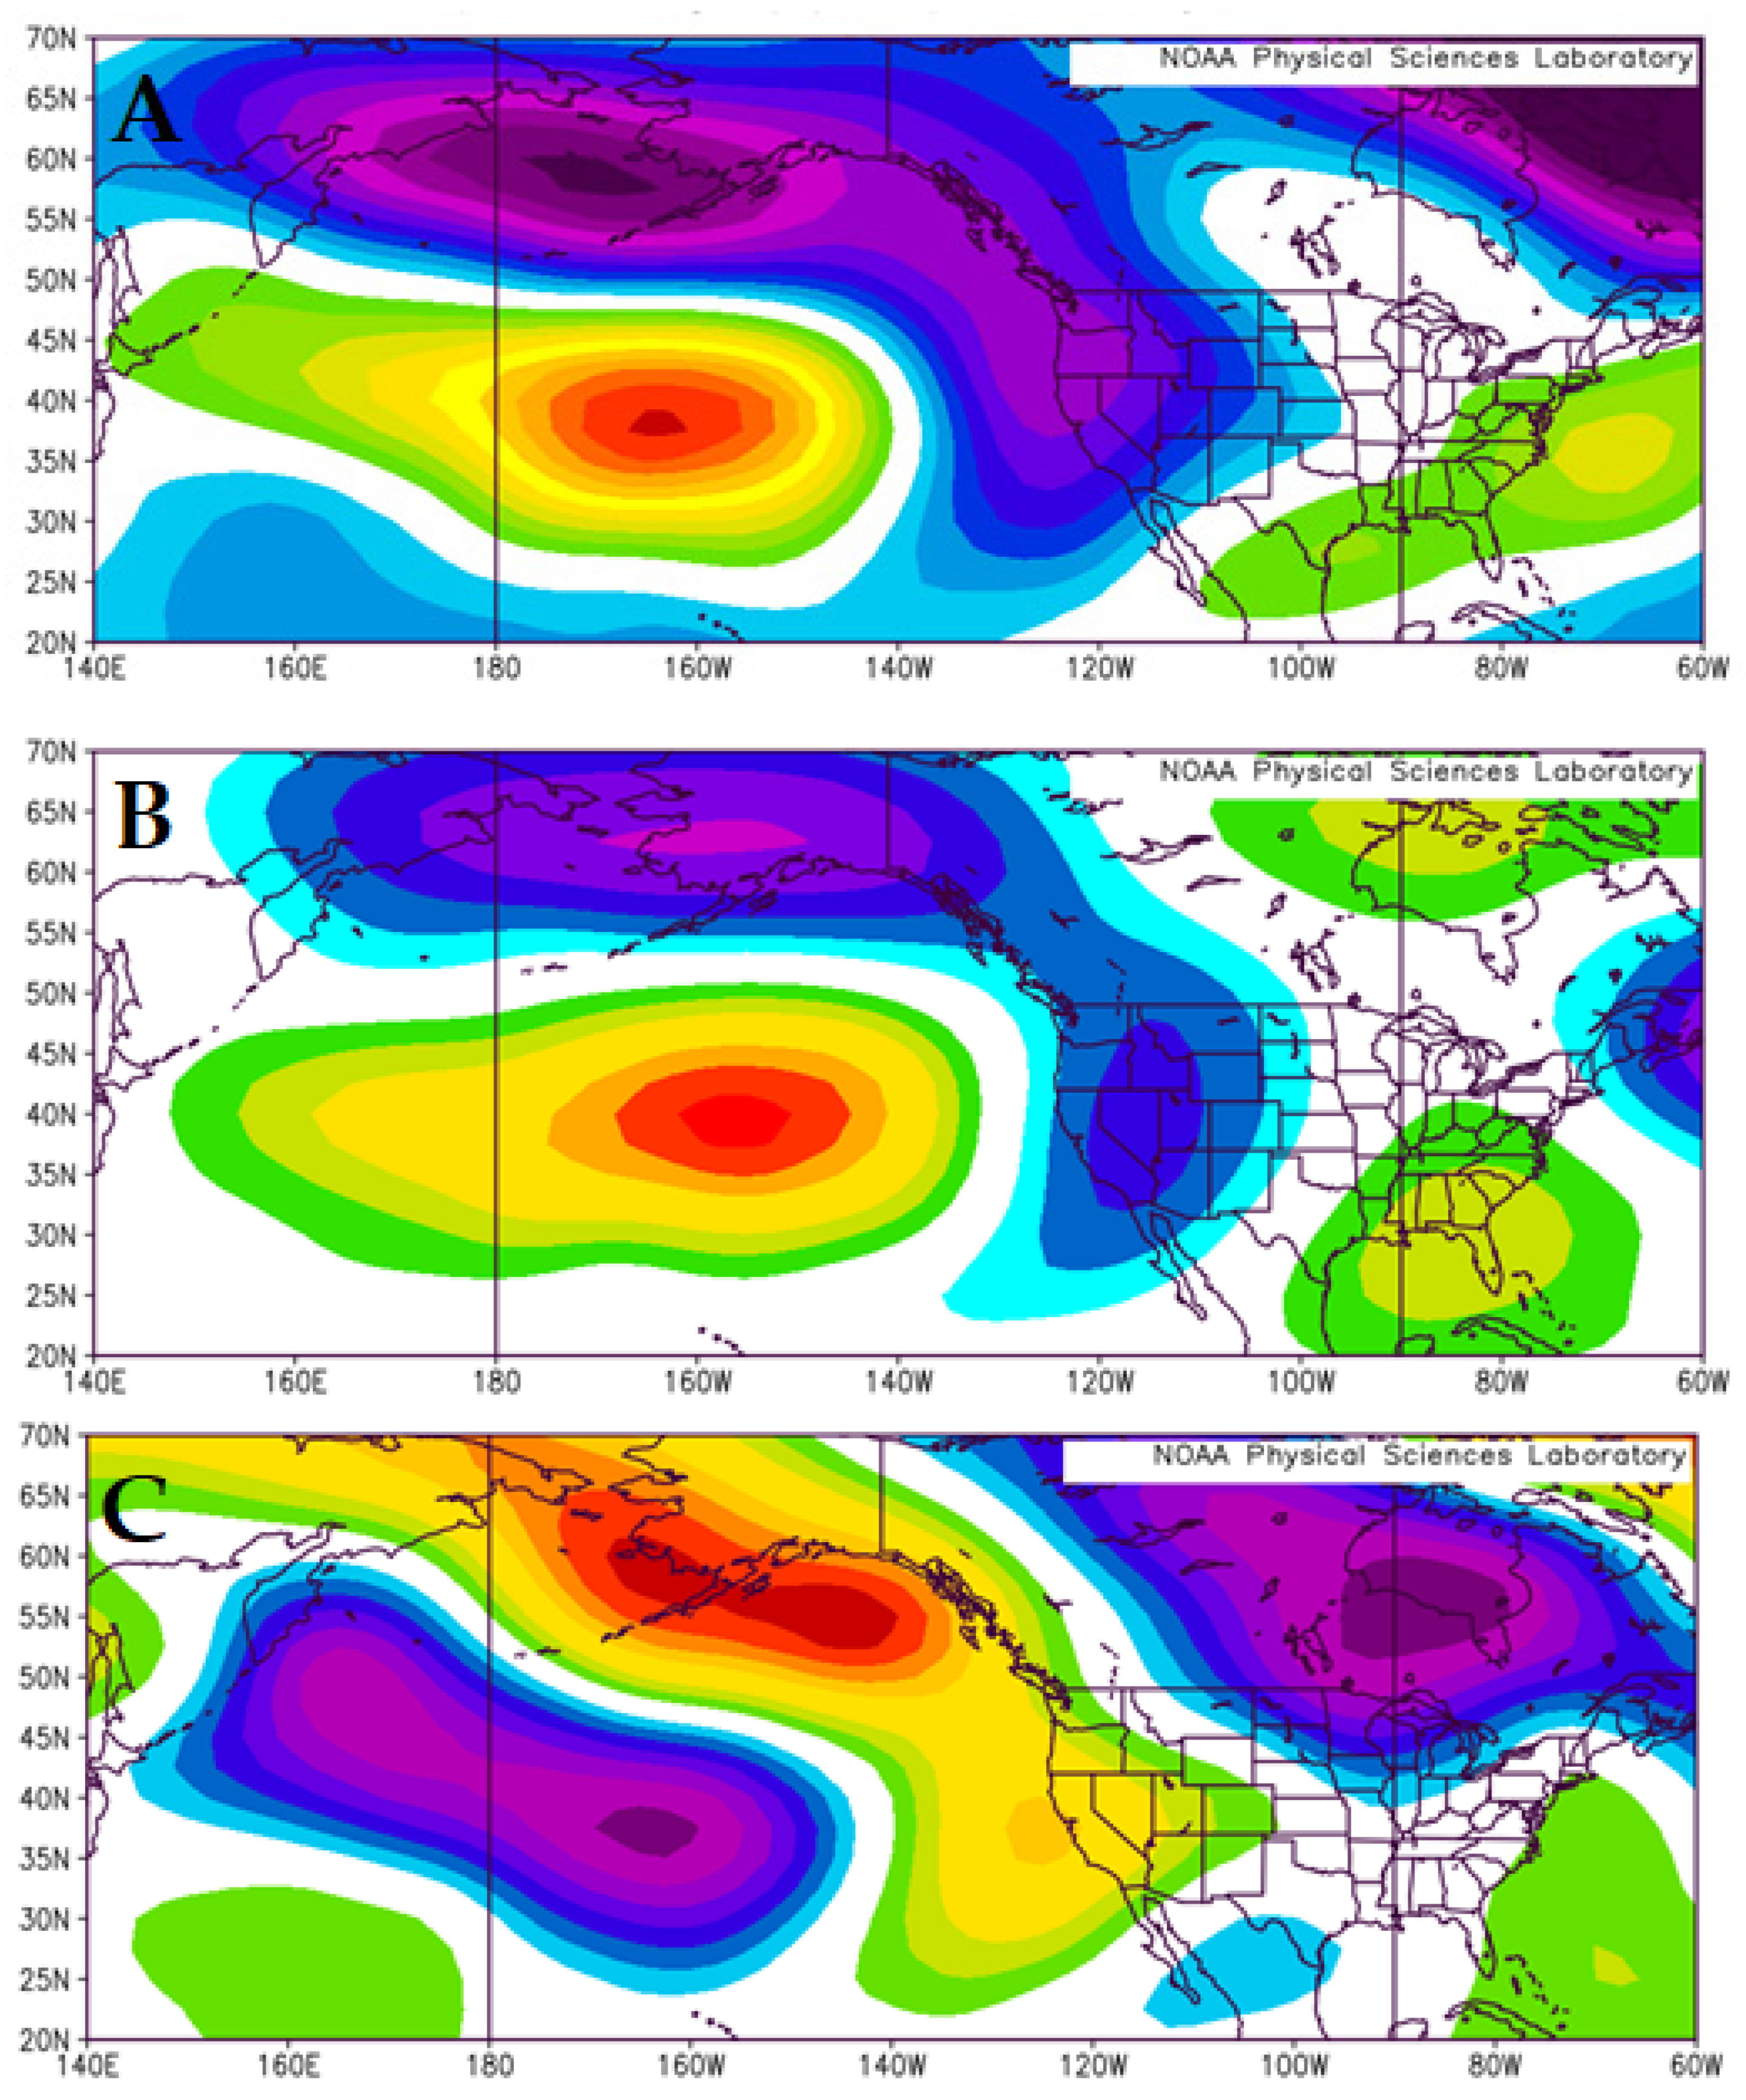
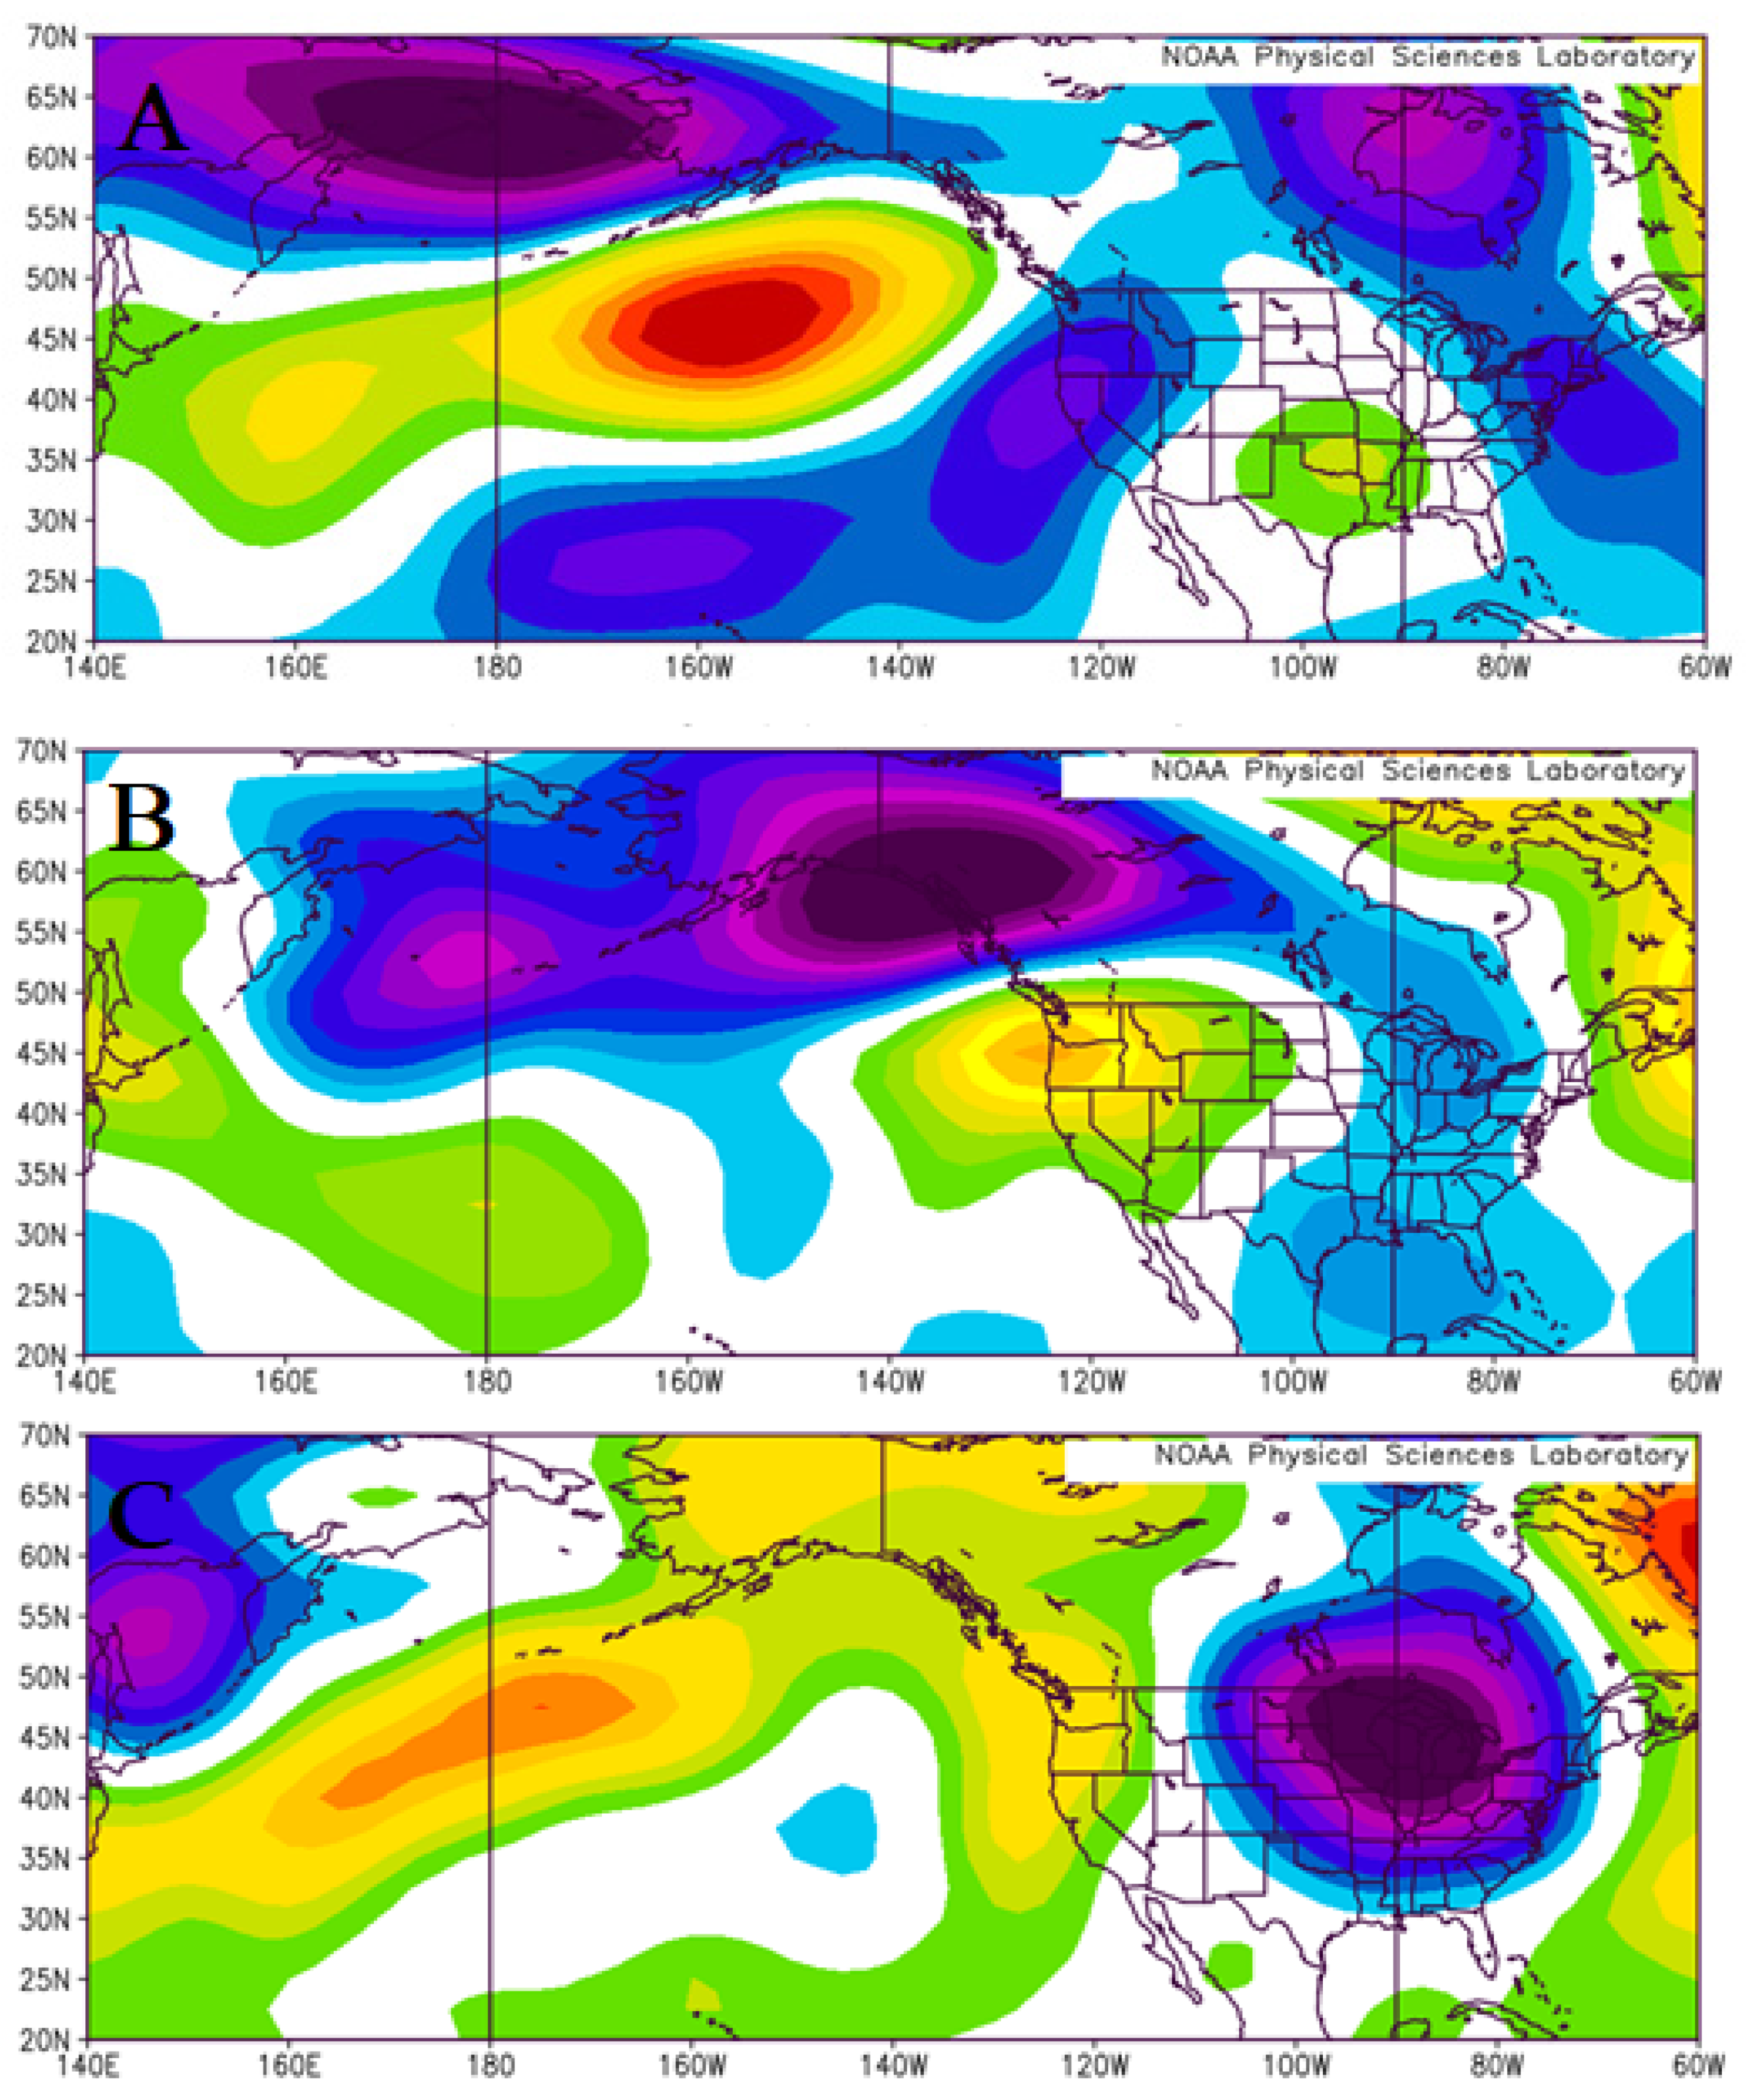
During the preceding spring seasons (Figure 5A,B), the occurrence of zonal versus meridional NH flows or ECM for extreme and moderate drought years, as well as wet years, was similar to those of spring seasons, overall, from 1970 to 2020. However, regionally, there are some strong differences in the flow field (Figure 6) between springs preceding summer drought or wet summers. In Figure 6A,B, the Pacific Region flow was clearly more zonal with an anomalously strong Aleutian Low present. This explains fewer Pacific Region blocking events (Figure 3A) and the negative PNA Index within NA region for drought springs (Figure 4A). However, for the springs preceding wet summers, the PNA Index is positive (Figure 4A) and there was significantly more blocking (Figure 3A). This is reflected in the strong positive 500 hPa height anomaly over the East Pacific (Figure 6C).
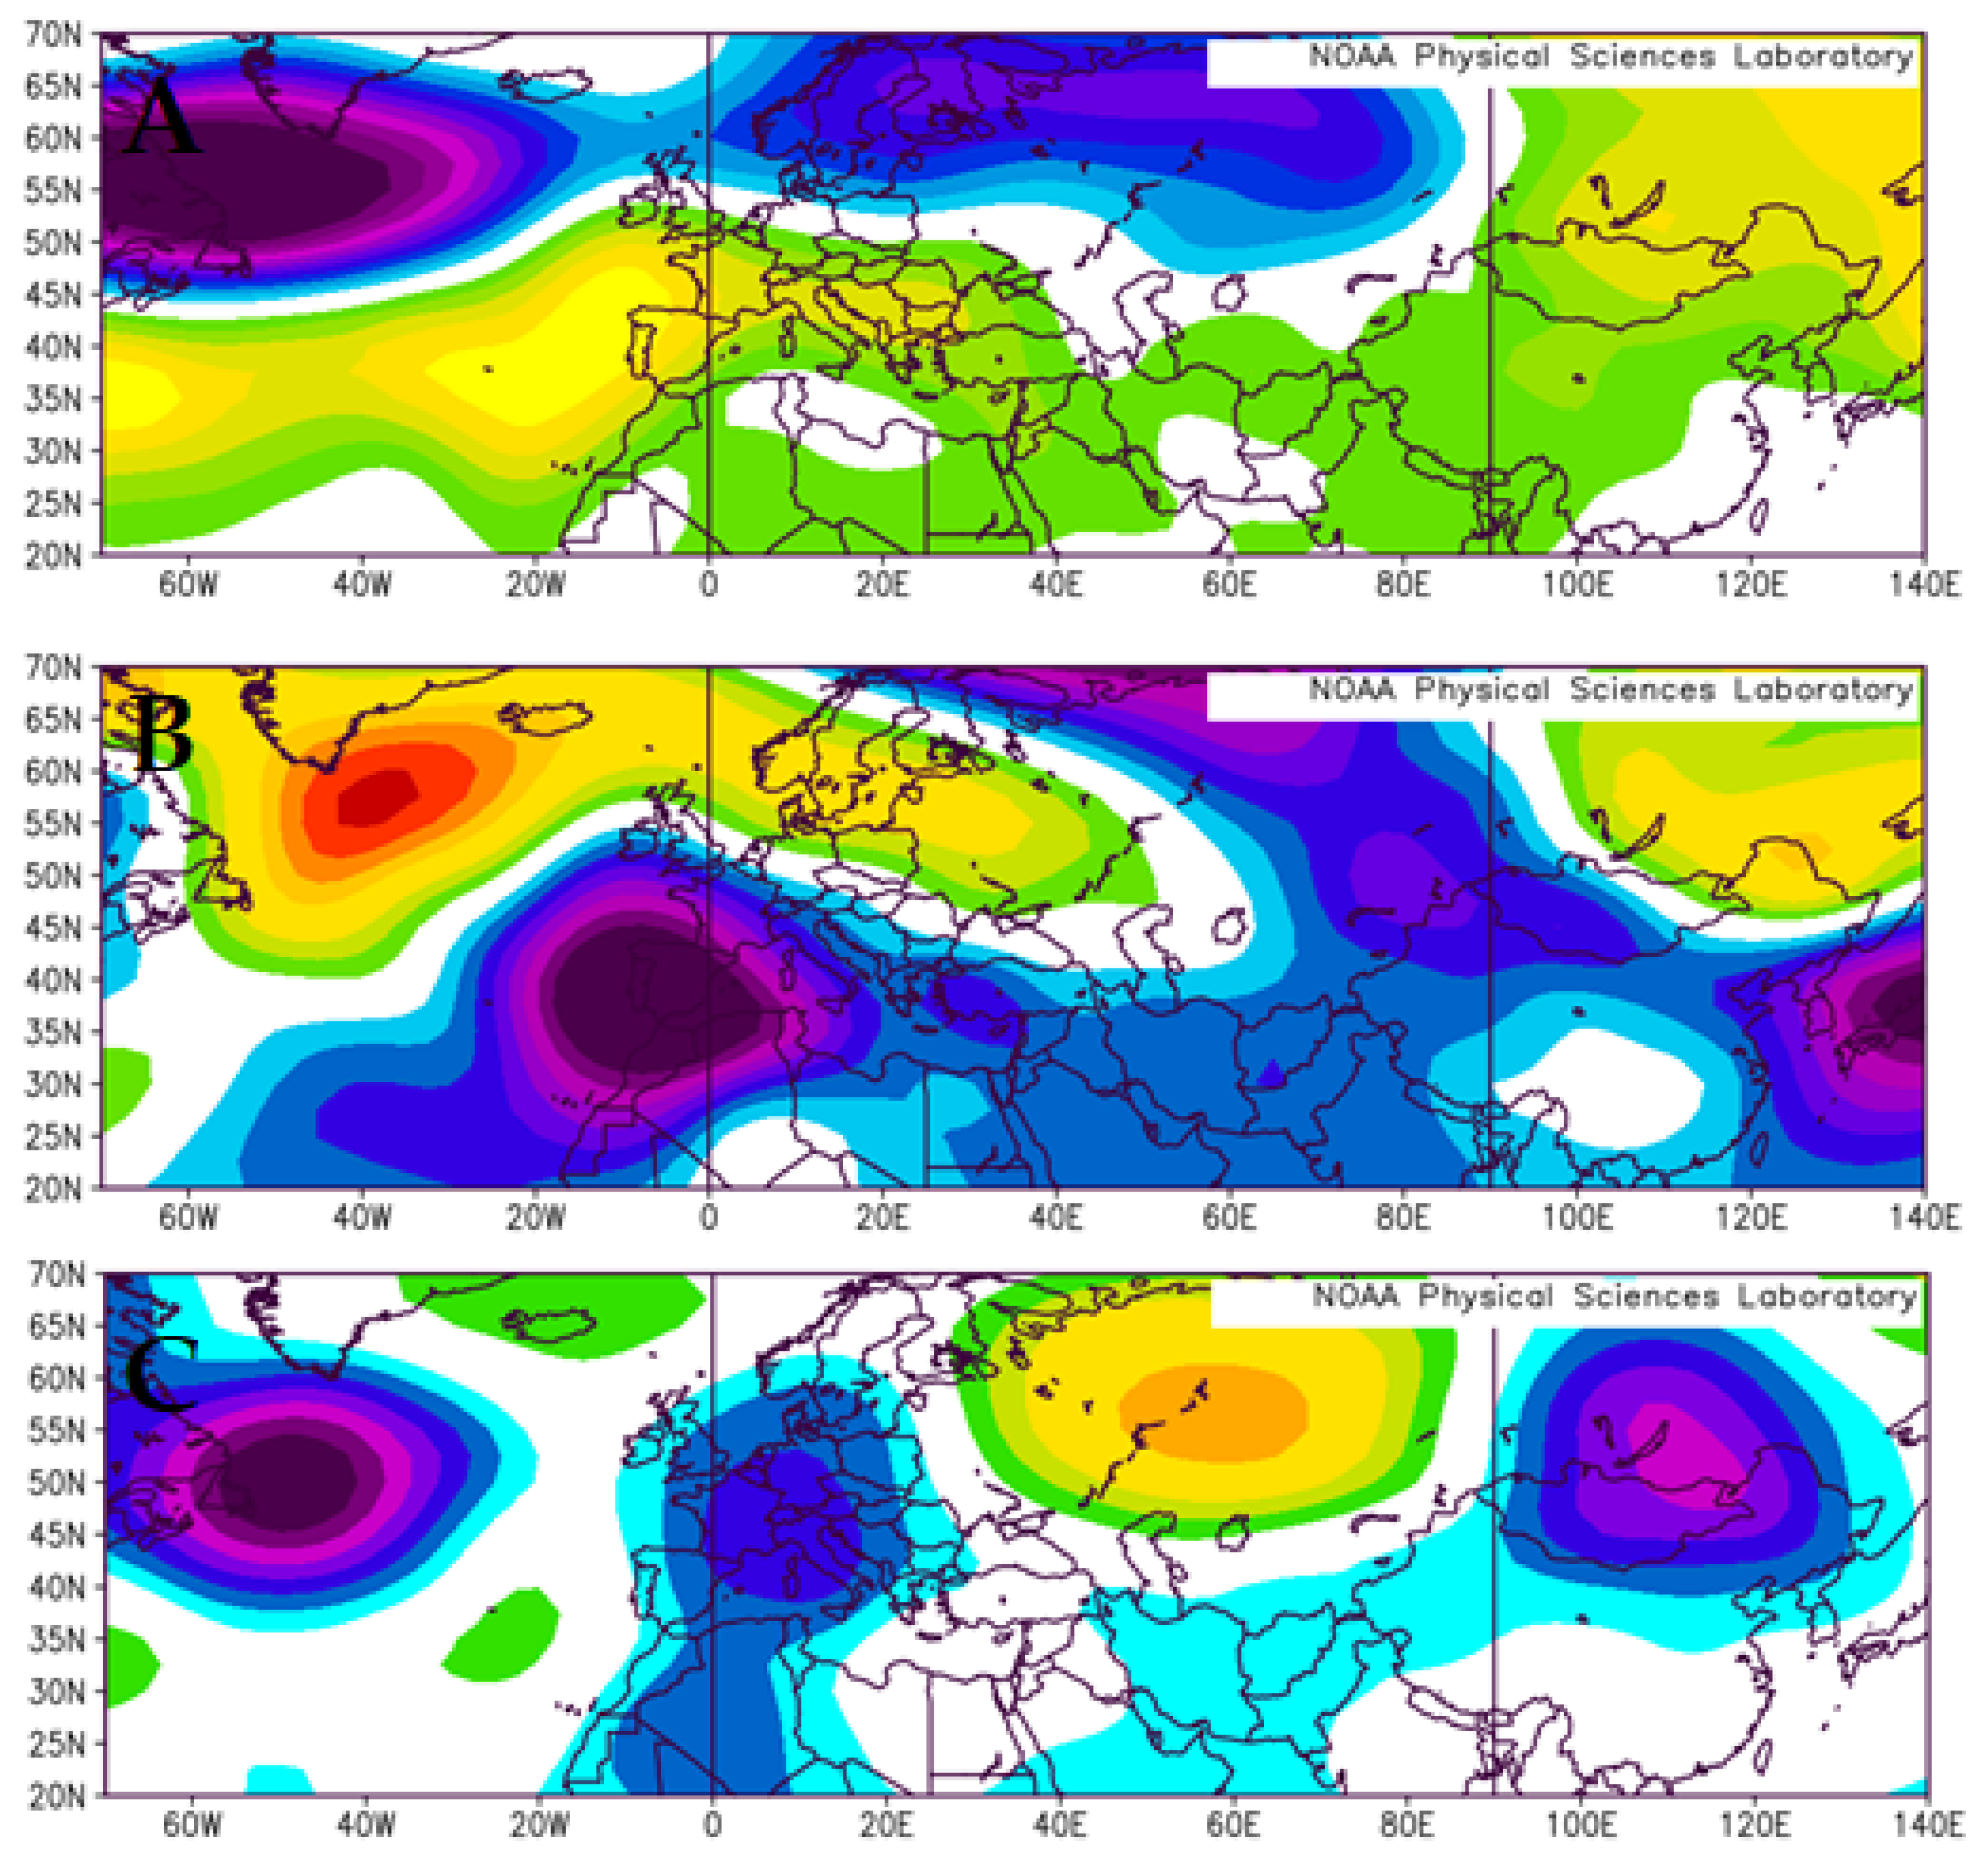
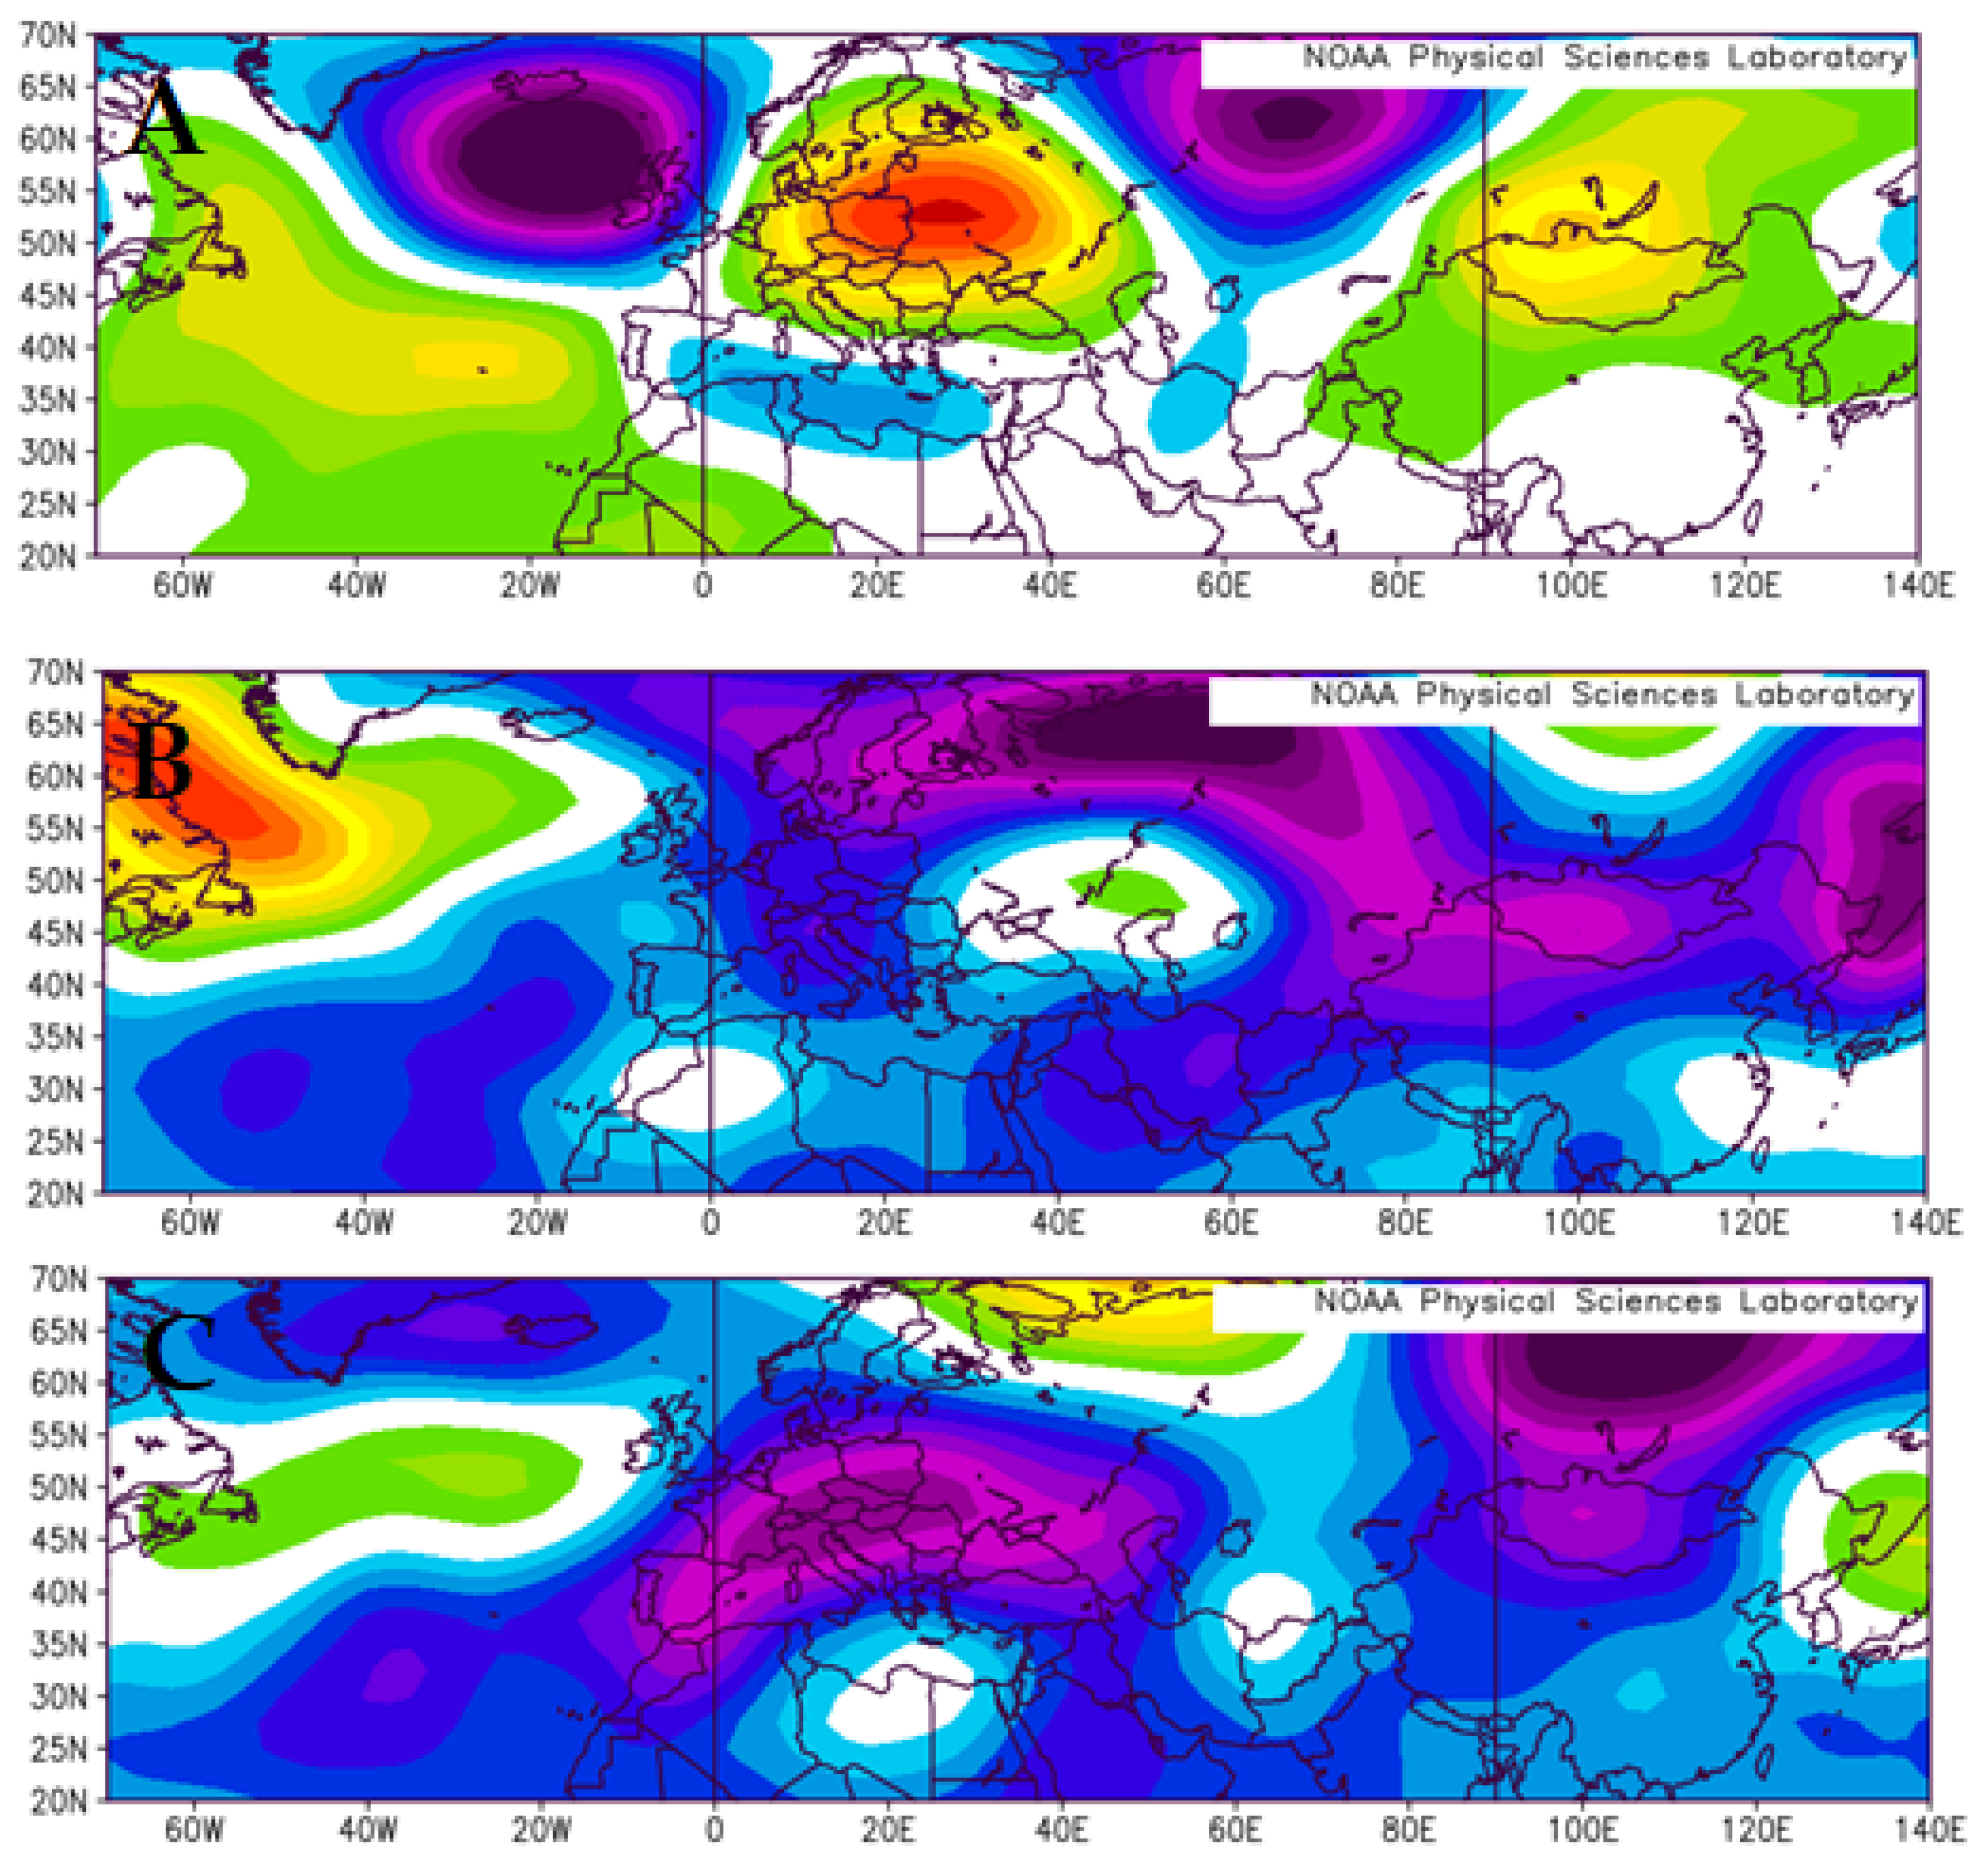
Only during the spring preceding the extreme summer drought for the EE/WR study region was the NH flow more meridional relative to other spring seasons during the study period at a statistically significant level (p = 0.05) (Figure 5B). This is reflected in a strongly positive NAO (and AO) in Figure 4B, but also in Figure 7A. Lebedeva et al. [55] demonstrated the long-term correspondence between the NAO and AO, as these teleconnections were highly correlated. The correlations between the AO and NAO are similarly high here for spring and summer seasons and for each subsample in Figure 4 (p = 0.01). There is also a negative correlation between the AO and PNA at p = 0.05, but only in extreme and moderate dry springs and summers. For wet seasons, the PNA and AO do not correlate.
Within the EE/WR, the NAO is weakly negative for springs preceding moderate drought summers (Figure 4B and Figure 7B). However, a negative (EU1—see Reference [56]) Eurasian (EU) teleconnection pattern emerges (e.g., References [79,80]) which is somewhat clear in Figure 7A also. A negative EU is characterized by a positive 500 hPa height anomaly near 20° E and 145° E and a trough near 75° E. Thus, the reversal of the NAO in spring may be an indicator of an extreme dry summer versus a moderately dry summer in the presence of a weakly negative EU. However, for spring seasons preceding wet summers, there is little signal in the NAO but a very distinctly positive EU (EU2—see Reference [56]) pattern (Figure 7C). Finally, there was no preference toward more or fewer blocking events in any of the spring seasons (Figure 3B); however, weaker blocking in the study region during the spring seasons preceding moderate drought summers and negative NAO phase is consistent with Reference [62].

3.2.2. Dry Summer Seasons

During the summer season (Figure 5C,D), the occurrence of more zonal NH flow regimes during both extreme and moderate drought and wet seasons was consistent with summer seasons overall. During all drought summers for the NA region, the flow was clearly even more zonal, and this result was significant at p = 0.01 (Figure 5C). While extreme drought summers were accompanied by larger maximum dry precipitation anomalies than moderate drought summers (−3.9 mm day−1 versus −2.8 mm day−1) as anticipated, the absolute value of the maximum 500 hPa height anomalies were of similar strength (18.2 m versus 22.5 m). As the flow was more zonal the maximum 500 hPa height anomalies were not always positive height anomalies within the NA study region. This can be seen in Figure 8A,B.
In Figure 8A, the extreme dry years featured a positive 500 hPa height anomaly within the study region and the continuation of negative PNA values from the spring season (Figure 4A). This is accompanied by significantly fewer (p = 0.05) and weaker (p = 0.01) blocking events in association with an anomalously strong Aleutian Low (Figure 3A). Additionally, note the troughs off each coast of North America which validates the results of References [23,24,25]. For moderate drought years (Figure 8B), the pattern changes to a positive PNA pattern (Figure 4B). The positive height anomaly is now over the Western NA region which strengthens the climatological ridge located there (not shown). A negative height anomaly is located over the Eastern USA (and study region). This configuration places the study region in the convergent region between a 500 hPa trough and ridge with high pressure at the surface. In fact, for extreme drought summers eight of ten were positive height anomalies while only six of 12 moderate drought years were similar. In both cases (Figure 8A,B), the dominant PNA pattern has a shorter wavelength for dry summers as posited by Reference [25]. Finally, there is a strong trough over the eastern 2/3 of USA for wet summers (Figure 8C). These results here support more strongly the results of Reference [29], which differentiated between wet and dry summers over the Midwest USA.
In the EE/WR study region (Figure 5D), the extreme dry years were more meridional over the entire NH, but more zonal during moderate drought and wet years (p = 0.01). Like the NA region, the maximum dry precipitation anomalies are larger during the extreme drought summers than during moderate drought summers (−3.1 versus −2.4 mm day−1). However, the maximum 500 hPa height anomalies for both drought groups (53.3 versus 26.0 m) were larger overall than over the NA region. This is consistent with the higher relative occurrence of meridional flow types (Figure 5C,D). Almost all of the dry years (13 of 16) were associated with positive 500 hPa height anomalies within the study region.
Several studies (e.g., References [47,49,55,58,78]) demonstrated that the EE/WR region has been associated with an increase in the occurrence of more meridional ECM or NH flow regimes, especially during the summer (Figure 5D). The study region has also been associated with an increase in atmospheric blocking (e.g., References [44,45,46,47,55,57,58]) and studies of drought associated with the extreme summer-season drought of 2010 over this region associated extreme dry summers with atmospheric blocking.
However, during the summer season (Figure 3D), extreme droughts were associated with more blocking events and days, and this is significant at p = 0.10, while moderate droughts were associated with fewer blocking events, blocking days, and weaker events, all significant at p = 0.10. These results are consistent with Section 3.1 and the occurrence of blocking versus ENSO in the Atlantic Region [62].
Furthermore, during extreme drought summers over the EE/WR region, the negative EU pattern of the spring season continued (Figure 9A versus Figure 7A) but is stronger, such that the largest positive 500 hPa height anomaly is located over the study region. In fact, the strongly negative EU pattern during extreme dry summer seasons is reminiscent of the quasi-stationary sub-seasonal and seasonal Rossby Wave trains that accompany the NH flow in the PNA region and other parts of the globe (e.g., References [56,81,82,83,84,85]). During wet summer seasons (Figure 9C), the EU pattern is positive. Moderate drought years are associated with a negative NAO, similar to that of the spring season, but the EU pattern becomes less organized.
Lastly, the discussion above implies that atmospheric dynamics are the primary drivers of summer-season drought in both study regions. In order to determine strength of the contributions of surface processes to these droughts, we examine the potential evaporation (E). For the NA region, the average P–E (Table 3) was −10.9 mm day−1 for extreme dry summers and the average maximum precipitation anomaly was −3.9 mm day−1. Thus, the maximum potential evaporation anomaly was 7 mm day−1. For, moderate drought years the P–E anomaly was −6.5 mm day−1, and the maximum potential evaporation was 3.7 mm day−1. Thus, the extreme dry summer potential evaporation was larger in both an absolute sense and relative to the total P–E anomaly. Given the analysis here, this suggests that the extreme drought years were driven strongly by surface processes, as well. The same analysis for the EE/WR region produces mean P–E values of −9.9 and −6.4 mm day−1 for extreme and moderate dry summers, respectively. Using the precipitation anomalies cited in Section 3.2.2 suggests a similar result (maximum potential evaporation of 6.4 and 4 mm day−1, respectively), that extreme dry years are driven to a greater extent by surface process. This is in spite of the fact that 50% of these summers were not preceded by a dry spring.

4. Summary and Conclusions

Drought is a difficult topic to study, as it is typically challenging to define precisely the timescales and space scales for this phenomenon. It is also an important topic because of the impact on agricultural and economic activity. Here summer-season drought was examined for the agriculturally important regions of the Central USA and Eastern Europe and Western Russia during the late 20th and early 21st centuries. Here summer-season drought was defined by the seasonal mean composite precipitation minus potential evaporation anomalies. This criterion was developed to separate extreme dry summers from those of moderately dry summers and then compared to wet summers. The criterion was successful in identifying major drought summers that time-series indexes have identified as impactful droughts. This study produced the following results.
Summer-season drought within the agriculturally sensitive regions of NA and EE/WR occurred more often during the 1970s and the 2010s, with minima during the 1990s and 2000s (NA) and 1980s (EE/WR).
Summer seasons defined as extreme drought were accompanied by larger maximum precipitation deficits and greater maximum potential evaporation. The extreme-drought years were accompanied also by potential evaporation values that were a greater percentage of the maximum precipitation minus evaporation total.
In the NA region, extreme dry summers occurred more often during LN years, while moderate drought occurred more often during EN years. The opposite was found within the EE/WR region. The only result supported by statistical testing was the distribution of extreme summer drought in the NA region, but this result was weak.
Examining the synoptic–dynamic character of the NA drought summers demonstrated that these occurred in association with the more frequent occurrence of zonal NH flow regimes or ECMs (significant at p = 0.01). Extreme dry summers were separated from moderate dry summers by significantly fewer and weaker blocking events (p = 0.05 and stronger) and a negative PNA regime. For extreme dry summers, the positive 500 hPa anomaly was located above the study region rather than to the west as for moderate drought summers.
The synoptic–dynamic character of extreme drought within the EE/WR region showed a very strong negative EU teleconnection pattern similar to quasi-stationary long period Rossby Wave Trains found in other regions of the world. These summers were accompanied by significantly more blocking, although not necessarily stronger blocking events, as well as relatively more meridional NH flow regimes or ECMs. For moderate drought years, there was significantly weaker and less blocking, as well as a significantly more zonal NH flow.
In both regions, extreme dry summers were a continuation of the atmospheric flow regimes from the spring season, whereas, for moderate dry summers, the spring season flow regime was different from that of the summer season. In addition, for both regions, wet summer seasons displayed synoptic–dynamic characteristics that were either opposite in terms of the teleconnections, blocking character, or associated with more meridional (NA) or zonal (EE/WR) ECMs.
In summary, this study demonstrated the utility of the criterion used and the results provide recognizable and distinct atmospheric circulation patterns that could be used to identify possible drought summers. Thus, these results would have use for seasonal and sub-seasonal forecasting application.

Author Contributions

Conceptualization, N.K.K. and A.R.L.; methodology, all co-authors; software, A.R.L.; validation, all co-authors; formal analysis, all co-authors; investigation, all co-authors; resources, all co-authors; data curation, N.K.K. and A.R.L.; writing—original draft preparation, A.R.L.; writing—review and editing, A.R.L., I.G.S., and M.G.L.; visualization, all co-authors; supervision, not applicable; project administration, not applicable; funding acquisition, not applicable. All authors have read and agreed to the published version of the manuscript.

Funding

This research received no external funding.

Institutional Review Board Statement

Not applicable.

Informed Consent Statement

Not applicable.

Data Availability Statement

The analyzed data can be found on the computers within the Global Climate Change Laboratory at the University of Missouri. Other information, such as the archive for the ECM or blocking, can be found in the reference section.

Acknowledgments

The authors acknowledge, with deep gratitude, the contribution of the two anonymous reviewers whose time and effort in providing comments has improved this paper substantially.

Conflicts of Interest

The authors declare no conflict of interest.

References

  1. Intergovernmental Panel on Climate Change (IPCC). Climate Change 2013: The Physical Scientific Basis. 2013. Available online: http://www.ipcc.ch (accessed on 8 June 2021).
  2. Wilhite, D.A. Drought: A Global Assessment; Routledge: London, UK, 2000; 752p. [Google Scholar]
  3. Ahrens, C.D.; Henson, R. Meteorology Today: An Introduction to Weather, Climate, and the Environment, 11th ed.; Cengage Learning: Boston, MA, USA, 2000. [Google Scholar]
  4. American Meteorological Society (AMS). Drought. 2013. Available online: https://www2.ametsoc.org/ams/index.cfm/about-ams/ams-statements/statements-of-the-ams-in-force/drought/ (accessed on 28 July 2021).
  5. Cherenkova, Y.A. Quantitative evaluation of atmospheric drought in federal districts of the European Russia. Proc. Russ. Acad. Sciences. Geogr. Ser. 2013, 6, 76–85. (In Russian) [Google Scholar]
  6. Heim, R.R., Jr. A review of Twentieth-Century drought indices used in the United States. Bull. Am. Meteorol. Soc. 2002, 83, 1149–1165. [Google Scholar] [CrossRef] [Green Version]
  7. McKee, T.B.; Doesken, N.J.; Kleist, J. The Relationship of Drought Frequency and Duration to Time Scales. In Proceedings of the 8th Conference on Applied Climatology, Anaheim, CA, USA, 17–23 January 1993; American Meteorological Society: Boston, MA, USA. Available online: https://www.droughtmanagement.info/literature/AMS_Relationship_Drought_Frequency_Duration_Time_Scales_1993.pdf (accessed on 11 August 2021).
  8. Vicente-Serrano, S.M.; Begueria, S.; Lopez-Moreno, J.I. A multi-scalar drought index sensitive to global warming: The Standardized Precipitation Evapotranspiration Index. J. Clim. 2010, 23, 1696–1718. [Google Scholar] [CrossRef] [Green Version]
  9. World Meteorological Organization. Standardized Precipitation Index User Guide (WMO-No.1090); World Meteorological Organization: Geneva, Switzerland, 2012; Available online: http://www.droughtmanagement.info/literature/WMO_standardized_precipitation_index_user_guide_en_2012.pdf (accessed on 20 June 2021).
  10. National Drought Mitigation Center. 2021. Available online: https://www.drought.unl.edu/ (accessed on 3 June 2021).
  11. Kleshchenko, A.D.; Dolgii-Trach, V.A. The development strategy of agrometeorological monitoring. Russ. Meteorol. Hydrol. 2011, 36, 492. [Google Scholar] [CrossRef]
  12. Ukrainian Hydrometeorological Center. 2021. Available online: https://meteo.gov.ua (accessed on 5 July 2021).
  13. Ukrainian National Space Facilities Control and Test Center. 2021. Available online: https://spacecenter.gov.ua (accessed on 5 July 2021).
  14. European Drought Observatory (EDO). 2021. Available online: https://edo.jrc.ec.europa.eu/edov2/php/index.php?id=1000. (accessed on 5 July 2021).
  15. The Joint Research Centre—EU Science Hub. 2021. Available online: https://ec.europa.eu/jrc/en (accessed on 5 July 2021).
  16. Hu, Q.; Buyanovsky, G. Climate effects on corn yield in Missouri. J. Appl. Meteorol. 2003, 42, 1626–1635. [Google Scholar] [CrossRef]
  17. Mehta, V.M.; Mendoza, K.; Daggupati, P.; Srinivasan, R.; Rosenberg, N.J.; Deb, D. High resolution simulations of decadal climate variability impacts on water yield in the Missouri River Basin with the Soil and Water Assessment Tool (SWAT). J. Hydrometeorol. 2016, 17, 2455–2476. [Google Scholar] [CrossRef]
  18. Mannocchi, F.; Todisco, F.; Vergini, L. Agricultural drought: Indices, definition and analysis. In The Basis of Civilization—Water Science? Proceedings of the UNESCO/IAHS/IWIIA Symposium, Rome, Italy, December 2003; IAHS Publication 286; IAHS: Wallingford, UK, 2004; pp. 246–254. Available online: http://hydrologie.org/redbooks/a286/iahs_286_0246.pdf (accessed on 30 July 2021).
  19. Ding, Y.; Hayes, M.J.; Widhalm, M. Measuring economic impacts of drought: A review and discussion. Disaster Prev. Manag. Int. J. 2011, 20, 434–446. [Google Scholar] [CrossRef] [Green Version]
  20. Atlas of Mortality and Economic Losses from Weather and Climate Extremes 1970–2012. Available online: https://public.wmo.int/en/resources/library/atlas-mortality-and-economic-losses-weather-and-climate-extremes-1970-2012 (accessed on 28 July 2021).
  21. Engström, J.; Jafarzadegan, K.; Moradkhani, H. Drought vulnerability in the United States: An integrated assessment. Water 2020, 12, 2033. [Google Scholar] [CrossRef]
  22. Naumann, G.; Barbosa, P.; Garrote, L.; Iglesias, A.; Vogt, J. Exploring drought vulnerability in Africa: An indicator based analysis to be used in early warning systems. Hydrol. Earth Syst. Sci. 2014, 18, 1591. [Google Scholar] [CrossRef] [Green Version]
  23. Namias, J. Anatomy of great plains protracted heat waves (especially the 1980 US. summer drought). Mon. Weather Rev. 1982, 110, 824–838. [Google Scholar] [CrossRef] [Green Version]
  24. Namias, J. Some causes of the United States drought. J. Clim. Appl. Meteorol. 1983, 22, 30–39. [Google Scholar] [CrossRef]
  25. Lupo, A.R.; Bosart, L.F. An analysis of a relatively rare case of continental blocking. Q. J. R. Meteorol. Soc. 1999, 125, 107–138. [Google Scholar] [CrossRef]
  26. Kung, E.C.; Chern, J.-G. Prevailing anomaly patterns of the Global Sea Surface temperatures and tropospheric responses. Atmósfera 1995, 8, 99–114. [Google Scholar]
  27. Gershanov, A.; Barnett, T.P. Interdecadal modulation of ENSO teleconnections. Bull. Am. Meteorol. Soc. 1998, 79, 2715–2725. [Google Scholar] [CrossRef] [Green Version]
  28. Lupo, A.R.; Kelsey, E.P.; Weitlich, D.K.; Mokhov, I.I.; Akyuz, F.A.; Guinan, P.E.; Woolard, J.E. Interannual and interdecadal variability in the predominant Pacific Region SST anomaly patterns and their impact on a local climate. Atmosfera 2007, 20, 171–196. [Google Scholar]
  29. Lupo, A.R.; Kelsey, E.P.; Weitlich, D.K.; Davis, N.A.; Market, P.S. Using the monthly classification of global SSTs and 500 hPa height anomalies to predict temperature and precipitation regimes one to two seasons in advance for the mid-Mississippi region. Natl. Weather Dig. 2008, 32, 11–33. [Google Scholar]
  30. Birk, K.; Lupo, A.R.; Guinan, P.E.; Barbieri, C.E. The interannual variability of midwestern temperatures and precipitation as related to the ENSO and PDO. Atmofera 2010, 23, 95–128. [Google Scholar]
  31. Henson, C.B.; Lupo, A.R.; Market, P.S.; Guinan, P.E. ENSO and PDO-related climate climate variability impacts on Midwestern United States crop yields. Int. J. Biometeorol. 2017, 61, 857–867. [Google Scholar] [CrossRef]
  32. Kahya, E.; Dracup, J.A. US streamflow patterns in relation to the El Niño/Southern Oscillation. Water Resour. Res. 1993, 29, 2491–2503. [Google Scholar] [CrossRef]
  33. Dracup, J.A.; Kahya, E. The relationships between US streamflow and La Niña events. Water Resour. Res. 1994, 30, 2133–2141. [Google Scholar] [CrossRef]
  34. Ting, M.; Wang, H. Summertime U.S. Precipitation Variability and Its Relation to Pacific Sea Surface Temperature. J. Clim. 1997, 10, 1853–1873. [Google Scholar] [CrossRef]
  35. Mo, K.C.; Schemm, J.E. Relationships between ENSO and drought over the southeastern United States. Geophys. Res. Lett. 2008, 35, L15701. [Google Scholar] [CrossRef]
  36. Mo, K.C.; Schemm, J.E. Drought and persistent wet spells over the United States and Mexico. J. Clim. 2008, 21, 980–994. [Google Scholar] [CrossRef]
  37. Rajagopalan, B.; Cook, E.; Lall, U.; Ray, B.K. Spatiotemporal Variability of ENSO and SST Teleconnections to Summer Drought over the United States during the Twentieth Century. J. Clim. 2000, 13, 4244–4255. [Google Scholar] [CrossRef]
  38. Cook, E.R.; Seager, R.; Cane, M.A.; Stahle, D.W. North American drought: Reconstructions, causes, and consequences. Earth Sci. Rev. 2007, 81, 93–134. [Google Scholar] [CrossRef]
  39. Ionita, M.; Dima, M.; Nagavciuc, V.; Scholz, P.; Lohmann, G. Past megadroughts in central Europe were longer, more severe, and less warm that modern droughts. Nat. Commun. Earth Environ. 2021, 2, 61. [Google Scholar] [CrossRef]
  40. Zolotokrylin, A.N. Droughts and desertification in subboreal landscapes of Russia. Izv. Russ. Acad. Sci. Geogr. 2013, 5c, 64–73. [Google Scholar]
  41. Spinoni, J.; Barbosa, P.; Bucchignani, E.; Cassano, J.; Cavazos, T.; Christensen, J.H.; Christensen, O.B.; Coppola, E.; Evans, J.; Geyer, B.; et al. Future global meteorological drought hot spots: A study based on CORDEX data. J. Clim. 2020, 33, 3635–3661. [Google Scholar] [CrossRef]
  42. Jaagus, J.; Aasa, A.; Aniskevich, S.; Boincean, B.; Bojariu, R.; Briede, A.; Danilovich, I.; Castro, F.D.; Dumitrescu, A.; Labuda, M.; et al. Long-term changes in drought indices in eastern and central Europe. J. Clim. 2021, 34. [Google Scholar] [CrossRef]
  43. Cherenkova, E.; Semenova, I.; Bardin, M.; Zolotokrylin, A.N. Drought and grain crop yields over the East European Plain under influence of quasibiennial oscillation of global atmospheric processes. Int. J. Atmos. Sci. 2015, 2015, 932474. [Google Scholar] [CrossRef] [Green Version]
  44. Cherenkova, E.A. Dangerous atmospheric droughts in the European part of Russia under the conditions of summer warming. Fundam. Appl. Climatol. 2017, 2, 130–143. (In Russian) [Google Scholar] [CrossRef]
  45. Lupo, A.R.; Mokhov, I.I.; Akperov, A.G.; Chernokulsky, A.V.; Hussain, A. A dynamic analysis of the role of the planetary and synoptic scale in the summer of 2010 blocking episodes over the European part of Russia. Adv. Meteorol. 2012, 2012, 584257. [Google Scholar] [CrossRef] [Green Version]
  46. Lupo, A.R.; Mokhov, I.I.; Chendev, Y.G.; Lebedeva, M.G.; Akperov, M.; Hubbart, J.A. Studying summer season drought in western Russia. Adv. Meteorol. 2014, 2014, 942027. [Google Scholar] [CrossRef] [Green Version]
  47. Lebedeva, M.G.; Krymckaya, O.V.; Lupo, A.R.; Chendev, Y.G.; Petin, A.N.; Solovyov, A. Trends in summer season climate for Eastern Europe and Southern Russia in the early 21st century. Adv. Meteorol. 2016, 2016, 5035086. [Google Scholar] [CrossRef] [Green Version]
  48. Kononova, N.K. The Classification of Northern Hemisphere Circulation Mechanisms According to B.L. Dzerdzeevskii; Izdatel’stvo “Voyentekhinizdat”: Moscow, Russia, 2009. [Google Scholar]
  49. Kononova, N.K. Circulation of the atmosphere in the European sector of the northern hemisphere in the 21st century and fluctuations in air temperature in the Crimea. Geopolit. Ecogeodyn. Reg. 2014, 10, 633–639. [Google Scholar]
  50. Kononova, N.K. Circulating epochs in the sectors of the northern hemisphere from 1899–2014. Geopolit. Ecogeodyn. Reg. 2015, 11, 56–66. [Google Scholar]
  51. Kononova, N.K. Fluctuations in the global atmospheric circulation in the 20th–21st centuries. Complex Syst. 2016, 4, 22–37. [Google Scholar]
  52. Kononova, N.K.; Lupo, A.R. 2019: Investigation of the variability of circulation regimes and dangerous weather phenomena in Russia in the 21st century. IOP Conf. Ser. Earth Environ. Sci. 2020, 606, 012023. [Google Scholar] [CrossRef]
  53. Dzerdzeevskii, B.L.; Kurganskaya, V.M.; Vitviskaya, Z.M. The Classification of Circulation Mechanisms in the Northern Hemisphere and the Characteristics of Synoptic Seasons. In Synoptic Meteorology; Gidrometizdat: Leningrad, Russia, 1946. [Google Scholar]
  54. Kononova, N.K.; Lupo, A.R. Changes in the Dynamics of the Northern Hemisphere Atmospheric Circulation and the Relationship to Surface Temperature in the 20th and 21st Centuries. Atmosphere 2020, 11, 255. [Google Scholar] [CrossRef] [Green Version]
  55. Lebedeva, M.G.; Lupo, A.R.; Chendev, Y.G.; Krymskaya, O.V.; Solovyev, A.B. Changes in the atmospheric circulation conditions and regional climatic characteristics in two remote regions since the mid-20th century. Atmosphere 2019, 10, 11. [Google Scholar] [CrossRef] [Green Version]
  56. Barnston, A.G.; Livesey, R.E. Classification, seasonality and persistence of low-frequency atmospheric circulation patterns. Mon. Weather Rev. 1987, 115, 1083–1126. [Google Scholar] [CrossRef]
  57. Slizhe, M.; Semenova, I.; Pianova, I.; El Hadri, Y. Dynamics of macrocirculation processes accompanying by the dry winds in Ukraine in the present climatic period. Hrvat. Meteorološki Časopis 2018, 53, 17–29. Available online: https://hrcak.srce.hr/231265 (accessed on 30 July 2021).
  58. Semenova, I.; Slizhe, M. Synoptic conditions of droughts and dry winds in the Black Sea Steppe Province under recent decades. Front. Earth Sci. 2020, 8, 69. [Google Scholar] [CrossRef]
  59. Kalnay, E.; Kanamitsu, M.; Kistler, R.; Collins, W.; Deaven, D.; Gandin, L.; Iredell, M.; Saha, S.; White, G.; Woollen, J.; et al. The NCEP/NCAR 40-year reanalysis project. Bull. Am. Meteorol. Soc. 1996, 77, 437–471. [Google Scholar] [CrossRef] [Green Version]
  60. University of Missouri Blocking Archive. 2021. Available online: http://weather.missouri.edu/gcc/ (accessed on 17 June 2021).
  61. Lupo, A.R. Atmospheric Blocking Events: A Review. Ann. N. Y. Acad. Sci. 2020. [Google Scholar] [CrossRef]
  62. Lupo, A.R.; Jensen, A.D.; Mokhov, I.I.; Timazhev, A.V.; Eichler, T.; Efe, B. Changes in global blocking character during the most recent decades. Atmosphere 2019, 10, 92. [Google Scholar] [CrossRef] [Green Version]
  63. Nunes, M.J.; Lupo, A.R.; Lebedeva, M.G.; Chendev, Y.G.; Solovyov, A.B. The occurrence of extreme monthly temperatures and precipitation in two global regions. Pap. Appl. Geogr. 2017, 3, 143–156. [Google Scholar] [CrossRef] [Green Version]
  64. National Oceanic and Atmospheric Administration (NOAA) Climate Prediction Center (CPC) Teleconnections. Available online: https://www.cpc.ncep.noaa.gov/products/precip/CWlink/daily_ao_index/month_ao_index.shtml (accessed on 9 June 2021).
  65. Kononova, N.K. Fluctuations in the Atmospheric Circulation of the Northern Hemisphere in the 20th and Early 21st Century. Available online: https://atmospheric-circulation.ru/ (accessed on 17 June 2021).
  66. Center for Ocean and Atmosphere Prediction Studies. Available online: http://www.coaps.fsu.edu (accessed on 10 June 2021).
  67. Hanley, D.E.; Bourassa, M.A.; O’Brien, J.J.; Smith, S.R.; Spade, E.R. A Quantitative Evaluation of ENSO Indices. J. Clim. 2003, 16, 1249–1258. [Google Scholar] [CrossRef]
  68. Ukraine: Agricultural Overview. World Data Center for Geoinformatics and Sustainable Development—WDC Ukraine. 2021. Available online: http://wdc.org.ua/en/node/29 (accessed on 2 July 2021).
  69. Dzerdzeevskii, B.L. Circulation Mechanisms in the Atmosphere of the Northern Hemisphere in the Twentieth Century. In Materials of Meteorological Research; Institute of Geography of the USSR Academy of Sciences and the Interagency Geophysical, Committee under the Presidium of the USSR Academy of Sciences: Moscow, Russia, 1968; p. 240. [Google Scholar]
  70. Kononova, N.K. Meteorological extremums in Siberia in 2019 and their connection with circulation of the atmosphere. Environ. Dyn. Glob. Clim. Chang. 2019, 10, 110–119. [Google Scholar] [CrossRef]
  71. Svoboda, M.D.; LeComte, D.; Hayes, M.; Heim, R.; Gleason, K.; Angel, J.; Rippey, B.; Tinker, R.; Palecki, M.; Stooksbury, D.; et al. The drought monitor. Bull. Am. Meteorol. Soc. 2002, 83, 1181–1190. [Google Scholar] [CrossRef] [Green Version]
  72. Jensen, A.D.; Lupo, A.R.; Mokhov, I.I.; Akperov, M.G.; Reynolds, D.D. Integrated regional enstrophy and block intensity as a measure of Kolmogorov Entropy. Atmosphere 2017, 8, 237. [Google Scholar] [CrossRef] [Green Version]
  73. Fernandez, M.A.; Huang, P.; McCarl, B.; Mehta, V.M. Value of decadal climate variability information for agriculture in the Missouri River Basin. Clim. Chang. 2016, 139, 517–533. [Google Scholar] [CrossRef]
  74. Rhodes, L.A.; McCarl, B.A. The value of ocean decadal climate variability information to United States agriculture. Atmosphere 2020, 11, 318. [Google Scholar] [CrossRef] [Green Version]
  75. Stambaugh, M.C.; Guyette, R.P.; McMurry, E.R.; Cook, E.R.; Meko, D.M.; Lupo, A.R. Drought duration and frequency in the U.S. Corn Belt during the last millennium (AD 992–2004). Agric. For. Meteorol. 2011, 151, 154–162. [Google Scholar] [CrossRef]
  76. Cook, B.I.; Smerdon, J.E.; Seagar, R.; Cook, E.R. Pan-Continental Droughts in North America over the Last Millennium. J. Clim. 2014, 27, 383–397. [Google Scholar] [CrossRef] [Green Version]
  77. Wilks, D.S. Statistical Methods in the Atmospheric Sciences, 2nd ed.; International Geophys Series Number 91; Academic Press: Cambridge, MA, USA, 2006; p. 627. [Google Scholar]
  78. Lebedeva, M.G.; Lupo, A.R.; Henson, C.B.; Solovyov, A.B.; Chendev, Y.G.; Market, P.S. A Comparison of Bioclimatic potential of Two Global Regions during the Late 20th Century and Early 21st Century. Int. J. Biometeorol. 2017, 62, 609–620. [Google Scholar] [CrossRef]
  79. Wallace, J.M.; Gutzler, D.S. Teleconnections in the geopotential height field during the Northern Hemisphere winter. Mon. Weather Rev. 1981, 109, 784–812. [Google Scholar] [CrossRef]
  80. Wang, N.; Zhang, Y. Evolution of Eurasian teleconnection pattern and its relationship to climate anomalies in China. Clim. Dyn. 2015, 44, 1017–1028. [Google Scholar] [CrossRef] [Green Version]
  81. Renwick, J.A.; Revell, M.J. Blocking over the South Pacific and Rossby wave propagation. Mon. Weather Rev. 1999, 127, 2233–2247. [Google Scholar] [CrossRef]
  82. Jiang, X.; Lau, N.-C. Intraseasonal teleconnection between North American and Western North Pacific monsoons with 20-day time scale. J. Clim. 2008, 21, 2664–2679. [Google Scholar] [CrossRef] [Green Version]
  83. Wang, Y.; Lupo, A.R. An extratropical air-sea interaction over the North Pacific in association with a preceding El Niño episode in early summer. Mon. Weather Rev. 2009, 137, 3771–3785. [Google Scholar] [CrossRef]
  84. Zhao, P.; Cao, Z.; Chen, J. A summer teleconnection pattern over the extratropical Northern Hemisphere and associated mechanisms. Clim. Dyn. 2010, 35, 523–534. [Google Scholar] [CrossRef] [Green Version]
  85. Wang, Y.; Lupo, A.R.; Qin, J. A response in the ENSO cycle to an extratropical forcing mechanism during the El Niño to La Niña transition. Tellus Ser. A Dyn. Meteorol. Oceanogr. 2013, 65, 22431. [Google Scholar] [CrossRef]
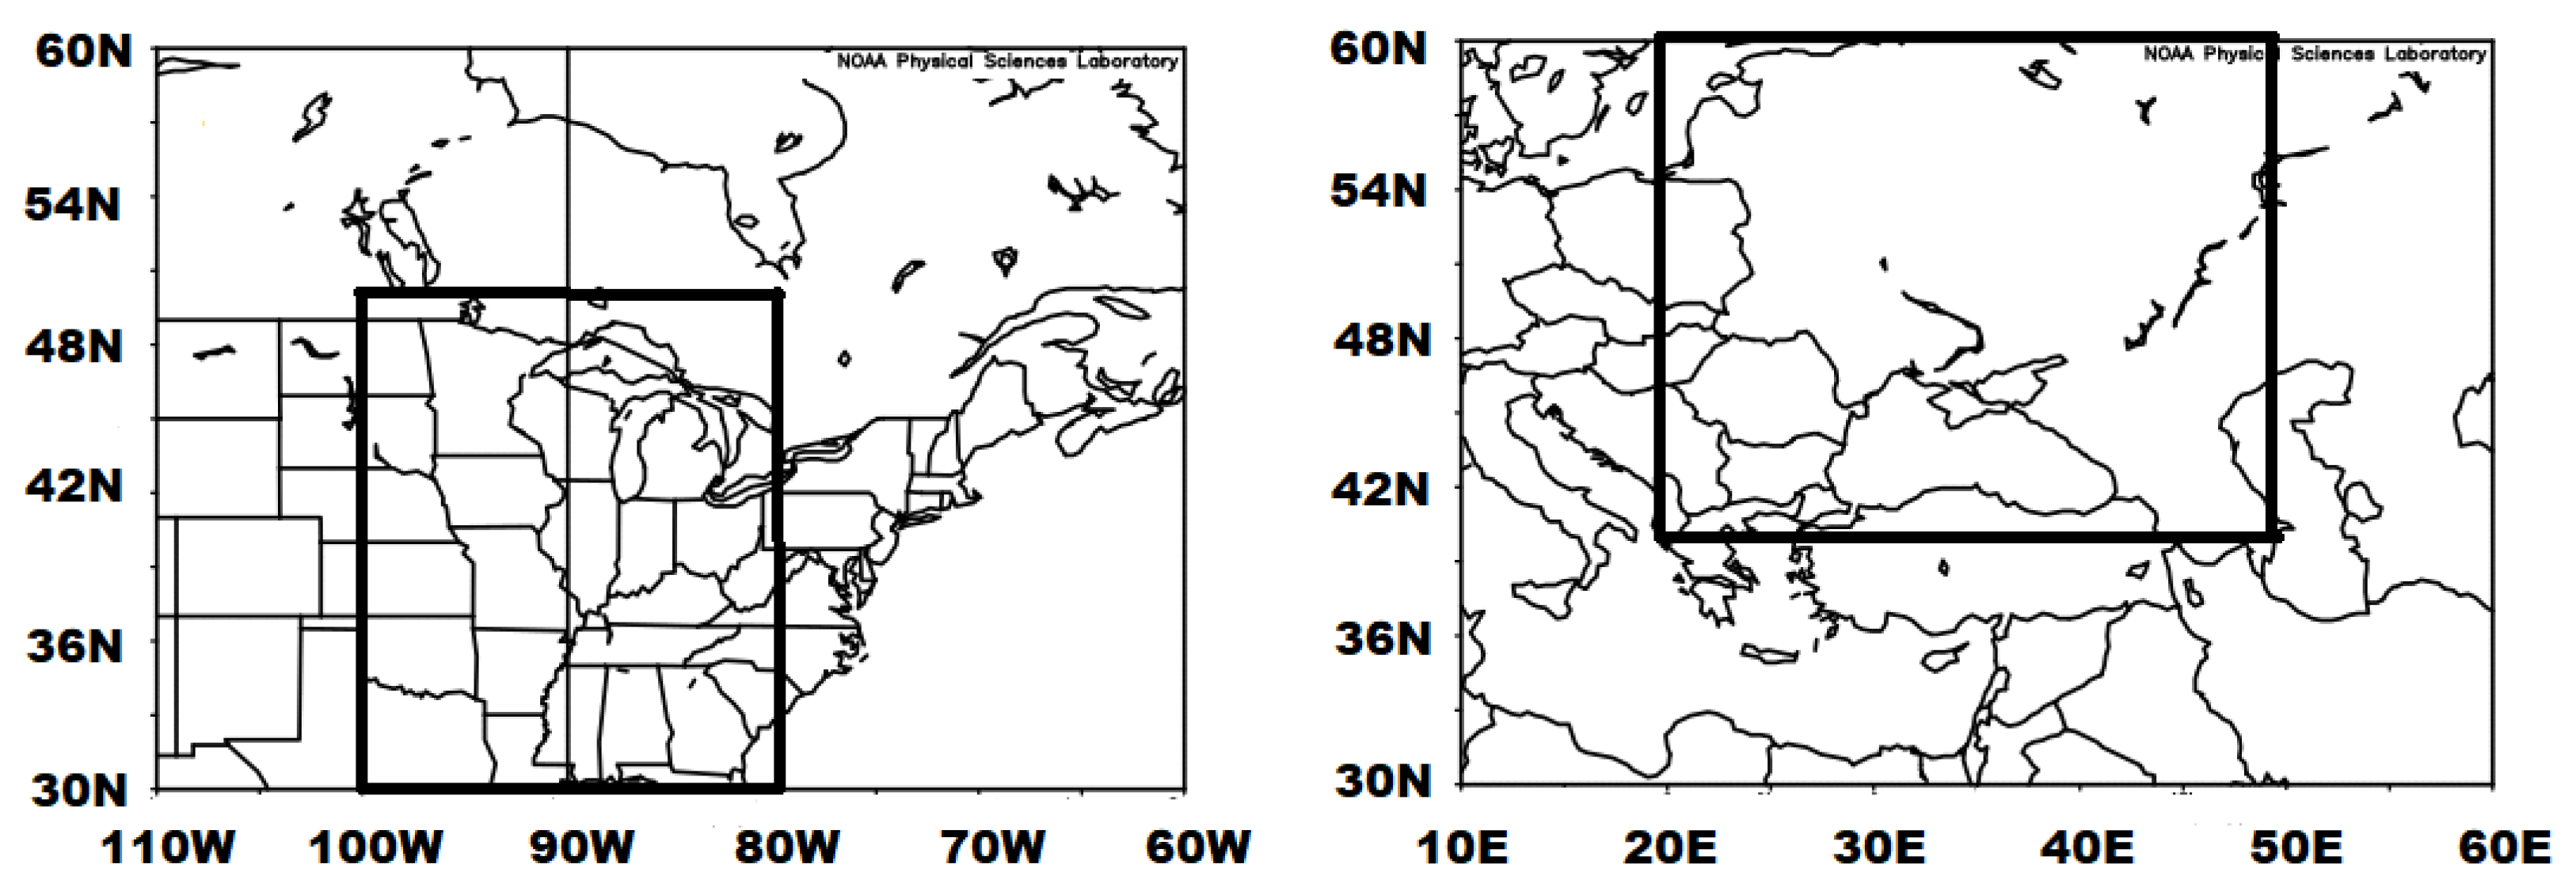
Figure 1. The study regions used here, NA (left) and EE/WR (right).
Atmosphere 12 01033 g001
Figure 2. Flowchart presentation of the study performed following the format of Reference [32].
Atmosphere 12 01033 g002
Figure 3. The character of blocking events for (A) NA spring, (B) EE/WR spring, (C) NA summer, and (D) EE/WR summer. The left-hand ordinate is mean block occurrence (number—leftmost bars) and mean block intensity (BI—middle bars), and the right-hand ordinate is mean blocking days (rightmost bars). Blue, green, and red bars stand for statistical significance at p = 0.1, 0.05, and 0.01, respectively. For each set of bars, the display represents extreme drought, moderate drought, and wet years from left to right.
Atmosphere 12 01033 g003
Figure 4. The major teleconnection indexes for (A) NA spring, (B) EE/WR Spring, (C) NA Summer, and (D) EE/WR summer, where the left, middle, and right group of bars are the AO, NAO, and PNA indexes, respectively. The ordinate is the value of the index.
Atmosphere 12 01033 g004
Figure 5. The fraction of the observed ECM (ordinate) that are zonal and meridional (left bars) and the information entropy (H(x)—ordinate) (right bars) for (A) NA spring, (B) EE/WR Spring, (C) NA Summer, and (D) EE/WR summer. For the left-hand bars, the black and orange colors represent the fraction of observed zonal versus meridional ECM.
Atmosphere 12 01033 g005
Figure 6. The 500 hPa height anomalies (m) in the NA region during the spring season (March–May) preceding (A) extreme drought (Table 3), (B) moderate drought (Table 3), and (C) wet summer seasons (Table 5). The warm (cold) colors are positive (negative) height anomalies. The contour interval is (A,C) 2.5 m and (B) 5 m.
Atmosphere 12 01033 g006
Figure 7. As in Figure 6, except for the EE/WR spring seasons in Table 4 and Table 5. The contour interval in (A,B) is 2.5 m, and in (C), it is 5 m.
Atmosphere 12 01033 g007
Figure 8. As in Figure 6, except for the NA summer seasons. The contour interval is (A) 2.5 m and (B,C) 1.5 m.
Atmosphere 12 01033 g008
Figure 9. As in Figure 7, except for the EE/WR summer seasons. The contour interval is (A,C) 2.5 m and (B) 1.5 m.
Atmosphere 12 01033 g009
Table 1. List of ENSO years used here. The years below are taken from References [62,66].
El Niño (EN)Neutral (NEU)La Niña (LN)
196919681967
19721977–19811970–1971
19761983–19851973–1975
19821989–19901988
1986–19871992–19961998–1999
19912000–20012007
19972003–20052010
200220082017
20062011–20132020
20092016
2014–20152019
2018
Table 2. Adapted from Reference [54] Table 1, global atmospheric circulation groups of Reference [53].
Circulation GroupECMs IncludedAtmospheric Pressure at the North/South PoleNumber of Amplified Waves
Zonal (Type 1)1–2High0
Zonal Breaking (Type 2)3–7High1
Amplified Ridging (Type 3)8–12High2–4
Equatorward Troughs (Type 4)13Low3 or 4
Table 3. The occurrence of extreme and moderate North American (NA) drought. Columns one two and three show the maximum precipitation minus evaporation anomaly (mm day−1), the percent of the study region covered by −1 mm day−1 or greater P–E, and the product of the column two and three/rank, respectively. Columns four, five, and six show the ENSO phase, as well as the type of ENSO transition taking place during the summer, and whether the preceding spring showed drought conditions, respectively.
YearPre-Evaporation Anomaly% Area CoveredCol 2 × 3/RankENSO PhaseTransitionPrecursor
Extreme
1972−14.560−8.7/2LNLN to ENYes
1976−9.090−8.1/3LNLN to ENYes
1978−9.070−6.3/6NEUNEU to NEUYes
1980−14.075−10.5/1NEUNEU to NEUYes
1982−10.025−2.5/21NEUNEU to ENNo
1990−11.040−4.4/9NEUNEU to NEUYes
1998−9.040−3.6/14ENEN to LNYes
2000−10.075−7.5/4LNLN to NEUYes
2011−13.530−4.1/12LNLN to NEUYes
2012−9.030−2.7/20NEUNEU to NEUYes
Moderate
1970−7.075−5.3/7ENEN to LNYes
1973−7.060−4.2/10ENEN to LNNo
1974−8.085−6.8/5LNLN to LNYes
1975−5.050−2.5/22LNLN to LNNo
1977−7.055−3.9/13ENEN to NEUYes
1985−5.060−3.0/18NEUNEU to NEUYes
1988−7.050−3.5/15ENEN to LNYes
1999−6.070−4.2/11LNLN to LNYes
2006−5.060−3.0/19NEUNEU to ENYes
2015−7.050−3.5/16ENEN to ENNo
2017−5.560−3.3/17NEUNEU to LNNo
2020−8.060−4.8/8NEUNEU to LNNo
Table 4. As in Table 3, except for Eastern Europe/Western Russia (EE/WR). Column 4 was multiplied by 0.8 to normalize the study area to the area from Table 3.
YearPre-Evaporation Anomaly% Area CoveredCol 2 × 3/RankENSO PhaseTransitionPrecursor
Extreme
1972−9.030−2.2/12LNLN to ENNo
1992−10.070−5.6/4ENEN to NEUYes
1994−10.080−6.4/3NEUNEU to NEUYes
2002−10.070−5.6/5NEUNEU to ENYes
2008−9.035−2.0/14LNLN to NEUNo
2010−11.550−4.6/6ENEN to LNNo
2015−10.580−6.7/1ENEN to ENNo
2017−10.080−6.4/2NEUNEU to LNYes
Moderate
1971−5.540−1.8/16LNLN to LNYes
1975−5.540−1.8/15LNLN to LNYes
1979−5.050−2.2/13NEUNEU to NEUYes
1993−7.040−2.2/11NEUNEU to NEUYes
1996−5.075−3.0/8NEUNEU to NEUYes
2000−8.040−2.6/9LNLN to NEUNo
2009−7.040−2.2/14NEUNEU to ENYes
2020−8.065−4.2/7NEUNEU to LNYes
Table 5. As in Table 3, except for NA and EE/WR wet years.
YearENSO PhaseTransitionPrecursor
NA
1979NEUNEU to NEUNo
1992ENEN to NEUNo
1996NEUNEU to NEUNo
1997NEUNEU to ENNo
2003NEUNEU to NEUNo
2004NEUNEU to NEUYes
2008LNLN to NEUYes
2010ENEN to LNYes
EE/WR
1973ENEN to LNNo
1974LNLN to LNNo
1977ENEN to NEUNo
1978NEUNEU to NEUNo
1985NEUNEU to NEUNo
1988ENEN to LNNo
1989LNLN to NEUNo
1995NEUNEU to NEUYes
Publisher’s Note: MDPI stays neutral with regard to jurisdictional claims in published maps and institutional affiliations.