Article

Long Term Monitoring and Connection between Topography and Cloud Cover Distribution in Serbia

1
Faculty of Geography, University of Belgrade, Studentski Trg 3/III, 11000 Beograd, Serbia
2
Department of Geography, Tourism and Territorial Planning, University of Oradea, 410087 Oradea, Romania
3
Department of Geography, Faculty of Sciences and Mathematics, University of Niš, Višegradska 33, 18000 Niš, Serbia
4
Department of Human Geography and Regional Studies, V. N. Karazin Kharkiv National University, Svobody Sq. 4, 61022 Kharkiv, Ukraine
5
Academy of Vocational Studies, Belgrade-High School of Tourism, School of Vocational Studies, Zorana Djindjica Bulevard 152a, 11000 Belgrade, Serbia
6
Department of Geography, Faculty of Philosophy, University of East Sarajevo, Vuka Karadzića 30, 71126 Istočno Sarajevo, Bosnia and Herzegovina
7
Faculty of Arts Department of Geography, University of Maribor, Koroška Cesta 160, 2000 Maribor, Slovenia
8
Faculty of Sciences and Mathematics, Department of Geography, University of Pristina in Kosovska Mitrovica, 38220 Kosovska Mitrovica, Serbia
9
Faculty of Natural Sciences and Mathematics, Institute of Geography, University of Cyril and Methodius, Arhimedova 3, 1000 Skopje, North Macedonia
10
Department of Geography, Tourism and Hotel Management, Faculty of Sciences, University of Novi Sad, Trg Dositeja Obradovića 3, 21000 Novi Sad, Serbia
*
Author to whom correspondence should be addressed.
Atmosphere 2021, 12(8), 964; https://doi.org/10.3390/atmos12080964
Submission received: 27 June 2021 / Revised: 22 July 2021 / Accepted: 25 July 2021 / Published: 27 July 2021
(This article belongs to the Section Atmospheric Techniques, Instruments, and Modeling)

Abstract

:
The use of weather satellite recordings has been growing rapidly over the last three decades. Determining the patterns between meteorological and topographical features is an important scientific job. Cloud cover analysis and properties can be of the utmost significance for potential cloud seeding. Here, the analysis of the cloud properties was conducted by means of Moderate Resolution Imaging Spectroradiometer (MODIS) satellite recordings. The resolution of used data was 1 km2 within the period of 30 years (1989–2019). This research showed moderate changing of cloudiness in the territory of Serbia with a high cloudiness in February, followed by cloudiness in January and November. For the past three decades, May has been the month with the highest cloudiness. The regions in the east and south-west, and particularly in the west, have a high absolute cloudiness, which is connected with the high elevation of the country. By means of long term monitoring, the whole territory of Serbia was analyzed for the first time, in terms of cloudiness. Apart from the statistical and numerical results obtained, this research showed a connection between relief and clouds, especially in the winter season. Linear regression MK (Mann-Kendall test) has proven this theory right, connecting high elevation sides with high absolute cloudiness through the year.

1. Introduction

Precipitation, temperature, insolation, radiation, wind, and climate factors depend on the topography of the Earth surface. Almost all weather events depend on stochastic processes and reflect in the landscape as well. A very important characteristic of the relief is the percentage of vegetation. The parameters that influence the climate and weather conditions are not the same when there is pronounced vegetation and when there is no vegetation. The difference between the daily maximum and minimum temperature was measured throughout 2003, and it was higher in deciduous beech forests in comparison with coniferous ones. South oriented slopes with the incline over 20° had bigger differences in maximum temperatures, whereas north oriented slopes with a slope over 10° had bigger differences in minimum temperatures [1]. The precipitation potential cannot be completely predicted without the data of the topography of the area. To know the properties of relief is of great importance for the forecasting of weather [2,3]. Soil moisture variability (SMV) is primarily induced by the combined effects of non-uniform precipitation, incoming solar radiation, and soil and vegetation properties. The two different landform morphologies represent landscapes dominated by either diffusive erosion or fluvial erosion processes. Soil moisture controlling factors are connected with cloudiness, precipitation, solar radiation, and with the soil properties [4]. After 18 years of investigation of semi-arid regions, it has been possible to find precise patterns between relief and precipitation. An investigation into the influence of climate seasonality on the normalized difference vegetation index (NDVI) values of PFS and EFS at 60 different catchments with aspect-controlled vegetation considered areas located across all continents except Antarctica. The results obtained in this analysis showed a connection between wet winter and relief properties. At high slopes, there was not a large amount of precipitation and vice versa [5].
Cloud cover and precipitation are prime examples of important environmental factors that are of significance for humans and nature. Without clouds and precipitation, life on the Earth would be impossible [6]. Cloud cover is not only important for the amount of precipitation, but also for the geographical distribution of plants and animals. The shadows of clouds have importance in the protection of direct solar radiation and in the survival of the species on the ground [7]. According to analyses of the cloud cover from the past, humid tropical regions have a large number of cloudy days, which is directly related to a high relative humidity. In Amazonia, between 1984 and 1997, the Landsat satellite recordings showed a high concentration of clouds in the north part of the basin.
The General Cloud Atlas contains the description of the frequency and occurrence of each cloud and the co-occurrence of the different types. The atlas describes the land areas of the Earth and the average total cloud cover and the amounts of each cloud type, along with their geographical, seasonal, and inter-annual variations. Despite being in analogue form, the atlas is one of the most important documents for cloud selection, as well as the for the possibility of the use of water from them [8]. One of the first attempts at collecting images of clouds was by means of Landsat 2 satellite recordings. The relation of cloud distribution in the United Kingdom showed that U-shaped frequency distributions are located in the lowland areas of central, southern, and south-east England. J-shaped curves were situated in northern and western Great Britain. In eastern Scotland, V-shaped curves were recorded [9].
A pearl cloud was recorded at 50°S of geographical latitude in Argentina (Patagonia). The cloud was far away from Antarctica, its usual place of origin. In this research, it was concluded that clouds migrated to geographical locations that are untypical for them [10].
Cloudiness is closely related to insolation, temperature, and precipitation. In Montenegro, during the period of 1961–2017, data on cloudiness were obtained from 18 meteorological stations in order to determine the seasonal trend of cloudiness variability for 2020 [11]. The frequency of cloud detection found in the troposphere was extracted from NOAA (National Oceanic and Atmospheric Administration) and High-Resolution Infrared Radiometer Sounder (HIRS) polar-orbiting satellite data from 1979 to 2001. High clouds showed a statistically significant increase in the Tropics and the North Hemisphere. The cloud cover in percentage showed an increase in the Southern Hemisphere in that period. This analysis was in contrast with the International Satellite Cloud Climatology Project (ISCCP), which showed a decrease in all types of clouds during the period of observation [12]. Clouds are very important for regulating global energy balance, weather, and climate. They migrate from region to region and change their shapes [13,14].
The interest in studying climate change in the territory of Serbia has been on the rise for the past two decades [15,16,17]. All previous research was partial, focusing on smaller territories. Their importance is indisputable, because of their methodology and meteorological data that are available for analysis. The research on recent climate change includes aridity trends as well, such as DeMartonne and Pinna combinative indices. The subject of this research was the sequences of two climatological cycles, each of them covering a period of thirty years [18,19].
Clouds in the Amazon basin have significant importance, especially in the 21st century. Recently, three periods of drought already occurred in Amazonia (2005, 2010, and 2015) that produced regional changes in the seasonal patterns. With the silver iodide (AgI), the effects of randomized clouds seeding will increase. An analysis of a three-dimensional scan with C-band radar data and with tracking software showed increased areas of rain volumes of the cell. The final step in this study was showing the ratios of seed (S) to no seed (NS) rainfalls in half-hour intervals. These ratios were the largest for the mean cumulative rainfalls at 2.0 to 2.5 h after qualification of the experimental units [20]. In the last decades, there have been a lot of conspiracies about cloud seeding. Some groups of scientists believe that this process can have an influence on weather changes. Fifty years ago, there was a debate in the United States on whether cloud seeding is good or not. When cloud seeding started in the United States, the measurements showed increased precipitation in mountains of the western United States [21]. On the other hand, the main problem with cloud seeding is the mixed droplets that may be polluted. Urban and industrial air pollution has recently been documented and quaintified. In the last 53 years in Northern Israel, air pollution and the enhancement of glaciogenic cloud seeding has been recorded. Because of these results, it was suggested that operational cloud seeding stop in this region. Now, only clear droplets are used in seeding [22].
In the complex climatological system and radiation budget of the Earth, cloud cover plays a very important role in all spatial scales. In the period between 1981–2014, with the help of software for automated weather type classification and atmospheric circulation, types of clouds were selected. Two major spatial changes in cloud cover over Europe were identified, in connection with atmospheric circulation, associated with the latitudinal shift towards the north of the westerly circulation. The Azores’ high pressure influenced cloud cover in the western part of Europe. The changes in cloud cover distribution and atmospheric circulation over the continent are higher in Eastern and Central Europe than before [23]. A significant part of the variability of weather in the territory of Serbia can be explained by changes in lower atmospheric circulation and by properties of relief. The strongest effect on weather and cloudiness is produced by the influence of the North Atlantic Oscillation [24,25,26,27].
This research showed the advantages and disadvantages of cloud seeding, which must be supported with digital and very precise numerical methods in the future. Most authors who were dealing with the meteorological phenomena connected precipitation with the basic meteorological phenomena, namely mean temperatures, and maximum and minimum temperatures. Because of the insufficient length of the sequences of data, it is very difficult to obtain data on the speed and frequency of winds, insolation, and cloudiness. The relation of relief, i.e., hypsometry, is a good replacement for the lack of data or adequate and precise measurements [28,29]. There has been little research on the connection between cloudiness and topography. Therefore, all research dealing with this or with similar topics is of the utmost significance for geoscience and meteorology, more precisely climatology [30,31].
The main purpose of the methodology presented in this paper is to provide the first insight related to long term monitoring of the connection between cloud cover and topography in the Republic of Serbia, as well as its detailed geospatial analysis for a full 30-year cycle on annual and seasonal basis. The manuscript is organized as follows: Materials and Methods, Results and Discussion, and Conclusion.

2. Materials and Methods

Serbia is a country in the Balkan Peninsula and belongs to South-East Europe, with the area of 88,361 km2. The capital is Belgrade and large cities are Niš, Novi Sad, and Priština. Serbia is divided into four geotectonic units, namely the Pannonian Basin, the Dinarides, Serbian-macedonian massif, the Carpatho-balkanides. The morphology of the terrain is heterogeneous, with the lowest point of 17 m near the Danube river and the highest point of 2656 m on Mountain Djeravica (see Figure 1). The study area covers the whole territory of Serbia with the geographical coordinates 41°53′ N–46°11′ N; 18°49′ E–23° E). According to the last census in 2011, Serbia has 7,234,000 citizens.

2.1. Data

In this research, we used MODIS (MOD09) adapted satellite recordings. These satellite recordings were adapted and cropped in shape format, covering the whole territory of Serbia [32,33,34,35,36]. The data on cloud frequencies had a resolution of 500 m. The most efficient method for estimating cloud cover is based on multispectral time series and surface reflectance. The single MODLAND cannot indicate everyday cloudiness, but in combination with multi-set images, it is possible to detect the average cloudiness in a single day. The probabilities of clouds and their analysis are connected with pixel and sub-pixel classifications [37,38,39]. Reanalysis of climate and meteorological data is of big importance today. Reanalysis of China Meteorological Administration Reanalysis data (CRA) and Fifth-generation Reanalysis (ERA5) are used for determining the monthly cloudiness and inter-annual climate variability of cloud cover influenced by the El Niño-Southern Oscillation (ENSO). The analyses showed that ERA5 gives monthly mean cloud cover closely to the MODIS observation over land, but its value over the ocean is ~10% smaller than that of MODIS. CRA underestimates the global cloud cover by ~20%, especially over subtropical zones. A reanalysis of cloud cover is useful for determining whether there is or there is not an effect of climate change on the clouds [40]. The meteorological data from the ERA40 database are presented in a very high resolution. The data used from this database are successful at determining the weekly, monthly, and yearly cloudiness [41]. The sub-pixel and pixel analysis gave excellent results for estimating the satellite images in raster format [42]. The newest satellite images downloaded from this satellite could be better analyzed by using the Liu and Liu method, which uses a multi-year time series [43]. A very similar method was used for the purpose of this research, the only difference being in the overlapping layers and their different resolutions [44]. Other data used in this research were meteorological data on cloudiness in the last thirty years [45]. The data were meant to calibrate and check the synoptic data (cloudiness), which were downloaded from satellite recordings. For studying the relief characteristics, we used the satellite recordings downloaded from the Landsat 8 (https://www.usgs.gov/core-science-systems, accessed on 4 April 2021). The data downloaded from the Landsat 8 were of a 30 m resolution [46,47,48]. These data were later analyzed and processed within GIS open source software Quantum GIS 3.10. (QGIS) and the System for Automated Geoscientific Analyses (SAGA). More precise analyses were conducted with the help of the platform Google Earth Engine (https://earthengine.google.com/, accessed on 1 May 2021). This platform is appropriate for remote sensing analyses of a high resolution, as well as for the analysis of relief [49,50]. Following the precision of various satellite missions, for the purpose of this research, we have used not only the MODIS satellite program, but the data from other important geostationary satellites. From these satellites, we also obtained the data on the mean annual cloudiness. Advanced Himawari Imager (AHI) onboard the Himawari-8 geostationary satellite supported from machine learning-based (ML-based) cloud detection algorithms gave satisfying results. The error of cloudy pixel detection varied between ∼3% and ∼5% [51,52]. Atmospheric circulation and atmospheric transmissivity (τ) are critical factors in climatology, which affect the surface energy balance and are measured at a limited number of meteorological stations worldwide. These factors are connected with precipitation, temperature, latitude, aridity index, cloud cover, etc. The measurement of these factors in particular has recently shown strong connectivity with cloud cover and the aridity index. This factor (index) varies according to the latitude, being 0.88 or (r2) in an equatorial climate, thus relatively higher than in the warm temperate belt (r2 = 0.74), whereas in arid regions it is lower (r2 = 0.46). Thanks to the estimation of this factor it is possible to find other climate elements at a global scale [53].

2.2. GIS and Remote Sensing Analysis

Geographical Information Systems together with remote sensing tools present very powerful methods in the analysis of meteorological data [54,55]. Geospatial analysis with the support of numerical methods gives a full possibility for calculating the clouds’ properties. Using special methods within the software, all calculations were made. The advanced methods and algorithms used in this research are zonal statistics, interpolation, kriging, and the Quartic (biweight) algorithm. The last algorithm has 99.4% accuracy. This function can be expressed in the following form (see Equation (1)).
K u = 15 16 1 u 2 2 u 1
K u is the kernel function and 15 16 1 u 2 2 u 1 is the probability density function.
This function has enough accuracy to analyze cloud cover from the grid. The satellite recording data were downloaded from the official web page of MODIS (Moderate Resolution Imaging Spectroradiometer; https://modis.gsfc.nasa.gov/gallery/, accessed on 2 April 2021). To measure the areas with cloud cover, we used processes of vectorization and digitization. The ordinary kriging and semi-kriging methods were used in the calculations because they include autocorrelation or the statistical relationship among the measured points. All data were presented in a raster format. The main meteorological data are presented in grid with an average resolution of 500 m2. The first are the maps that present the average cloud cover through the months. The second are the maps that present the average seasonal cloud cover. The third are the maps that present the absolute cloud cover. All of the maps presented the cloud cover in a percentage. Low cloudiness has values between 0% and 25%. Medium cloudiness has values between 25% and 50%. High cloudiness has values between 50% and 75%. Very high cloudiness has values between 75% and 100%. Excluding the average cloudiness that was downloaded from the satellite, the seasonal and absolute cloudiness were derived using special algorithms such as zonal statistics and kernel. With the use of the kernel density distribution, the resolution was much higher and was around 50 m. In this way, the maps covered 50 m2 of the sky and were useful for precise and significant calculations. In order to obtain the results of the cloud cover distribution, pixel and swapping pixel analysis were used. Relative cloudiness for a thirty year’ period was derived from the combination of cloud layers each month within the period between 1989–2019. For each month, the daily average cloudiness on the territory of the country was used. The border of the territory was cropped by means of QGIS. For each month, the day with the highest cloudiness was used too. The raster data were vectorized and transformed into precise cells with geographic coordinates. In order to perform a precise GIS analysis, highly sophisticated types of software were used that had the possibility of performing a complete numerical analysis of relief. There are many models that can display both qualitative and quantitative values of the relief. A special algorithm that may be successfully used in numerical analysis is the hybrid support vector regression (SVR) supported by machine learning methods (MLM). For the purpose of determining the characteristics of relief and cloudiness as a meteorological phenomenon more precisely, it is necessary to implement certain statistical algorithms within the GIS system [56]. Apart from the standard kernel analysis, which is suitable for determining the points of distribution, specific GIS methodologies and algorithms were used in this research. The basic algorithms used for a better analysis of the distribution and frequency of clouds were the interpolation method and inverse distance weight (IDW) method. The interpolation method was used for the overlap and the analysis of the dotted grid in different resolutions. The specific interpolation methods that we used were triangulated irregular network (TIN) or Delaunay triangulation. The spatial algorithm is one of the advanced ones, which conducts a spatial analysis of dots [57,58,59]. It gives excellent results when combined with other spatial algorithms. All of the methods of interpolation were used with the help of open source software Quantum Geographical Information System (QGIS 3.12) and System for Automated Geoscientific Analysis (SAGA).
The most advanced GIS method and algorithm used for the analysis of the relief is first and foremost the slope analysis, which is supposed to show all of the absolute and relative angles of slope. Then is the aspect analysis, which shows the azimuths of slope. Hillshade analysis is important for showing the shadows of the analyzed relief [60,61,62,63,64]. Comparing the natural shadows of relief with those created by clouds is of utmost importance. The Z factor was supposed to show the average elevation of the relief in Serbia, as well as the way it is distributed in terms of longitude and latitude. To determine the overlap of data referring to cloud distribution and the characteristics of relief, two special analyses were used. The first one is proximity (Raster Distance) and the other one is zonal statistics [65,66,67,68].

2.3. Statistical Analysis of Mann–Kendall Test

The connection of relief and cloudiness was analyzed with help of GIS methods, as well as with the help of geostatical analysis. This statistical Mann−Kendall test was used to analyze trends in long-term data [19,69]. The Mann–Kendall test is presented and explained in the equations (see Equations (2)–(8)). The total sum can be written as Sgn ( Δ x ) . If the data x i are serially independent and drawn from the same distribution, then the numbers of adjacent data pairs for which Sgn ( Δ x ) is positive and negative would be approximately equal.
S = n 1 i = 1 Sgn x i + 1 x i
Then,
Sgn ( Δ x ) = + 1 , Δ x > 0 0 , Δ x = 0 1 , Δ x < 0
In the Gaussian distribution, if we have a null hypothesis, there is no trend in sequence. The variance of this distribution depends on whether all the x s are distinct, or if there are some repeated values. If there are no ties, the variance of the sampling distribution of S may be present (see Equation (4)):
V a r ( S ) = n ( n 1 ) ( 2 n + 5 ) 18
(4) The variance can be written as follows (see Equation (5)),
V a r ( S ) = n ( n 1 ) ( 2 n + 5 ) j j = 1 t j ( t j 1 ) ( 2 t j + 5 ) 18
where J represents the number of repeated values and t j is the number of repeated values in the jth group. The statistic value of S can be rewritten as Z, which represents the normal distribution (see Equation (6)).
Z = S 1 ( V a r ( S ) 0 ; if ; S = 0 ; if ; S > 0 S + 1 ( V a r ( S ) ; if ; S < 0
In this test, two hypotheses were tested: the zero hypothesis H 0 shows the inexistence of a trend in a time series, and the alternative hypothesis ( H a ) shows the existence of a statistically significant trend in the time series for the chosen level of significance ( α ). The value of p determines the accuracy of the hypothesis. If the value of p is lower than the chosen level of significance α (it is common that α = 0.05 or 5% rare 0.01 or 1%), hypothesis H o should be rejected and hypothesis H a should be accepted [62,63]. The purpose of this test is to test the data on cloudiness in (%) for the period (1989–2019) in five regions in Serbia, namely the Province of Vojvodina, Central Serbia, Western Serbia, Eastern Serbia, and the Province of Kosovo. The absolute cloudiness per month in the regions of central Serbia and the Province of Vojvodina is mostly <8 days.

Geostatistical Analysis

To verify the trend, it is necessary to include its statistical results. The first is presented by the zonality of the relief, which is determined according to the absolute elevation. It is divided into the following belts: 100–300 m, 300–600 m, 600–900 m, 900–1200 m, 1200–1500 m, 1500–1800, 1800–2100, 2100–2400, and >2400 m. The cloudiness per day follows the classes: <8, 8–12, 12–16, 20–24, and >24. These classes refer to the maximum number of cloudy days within a month. The classes of cloudiness are also given according to the elevation, thus taking into account the cloudiness on contour lines in three regions in Serbia, where it occurred intensely within the last thirty years (1989–2019; see Figure 2).

3. Results and Discussion

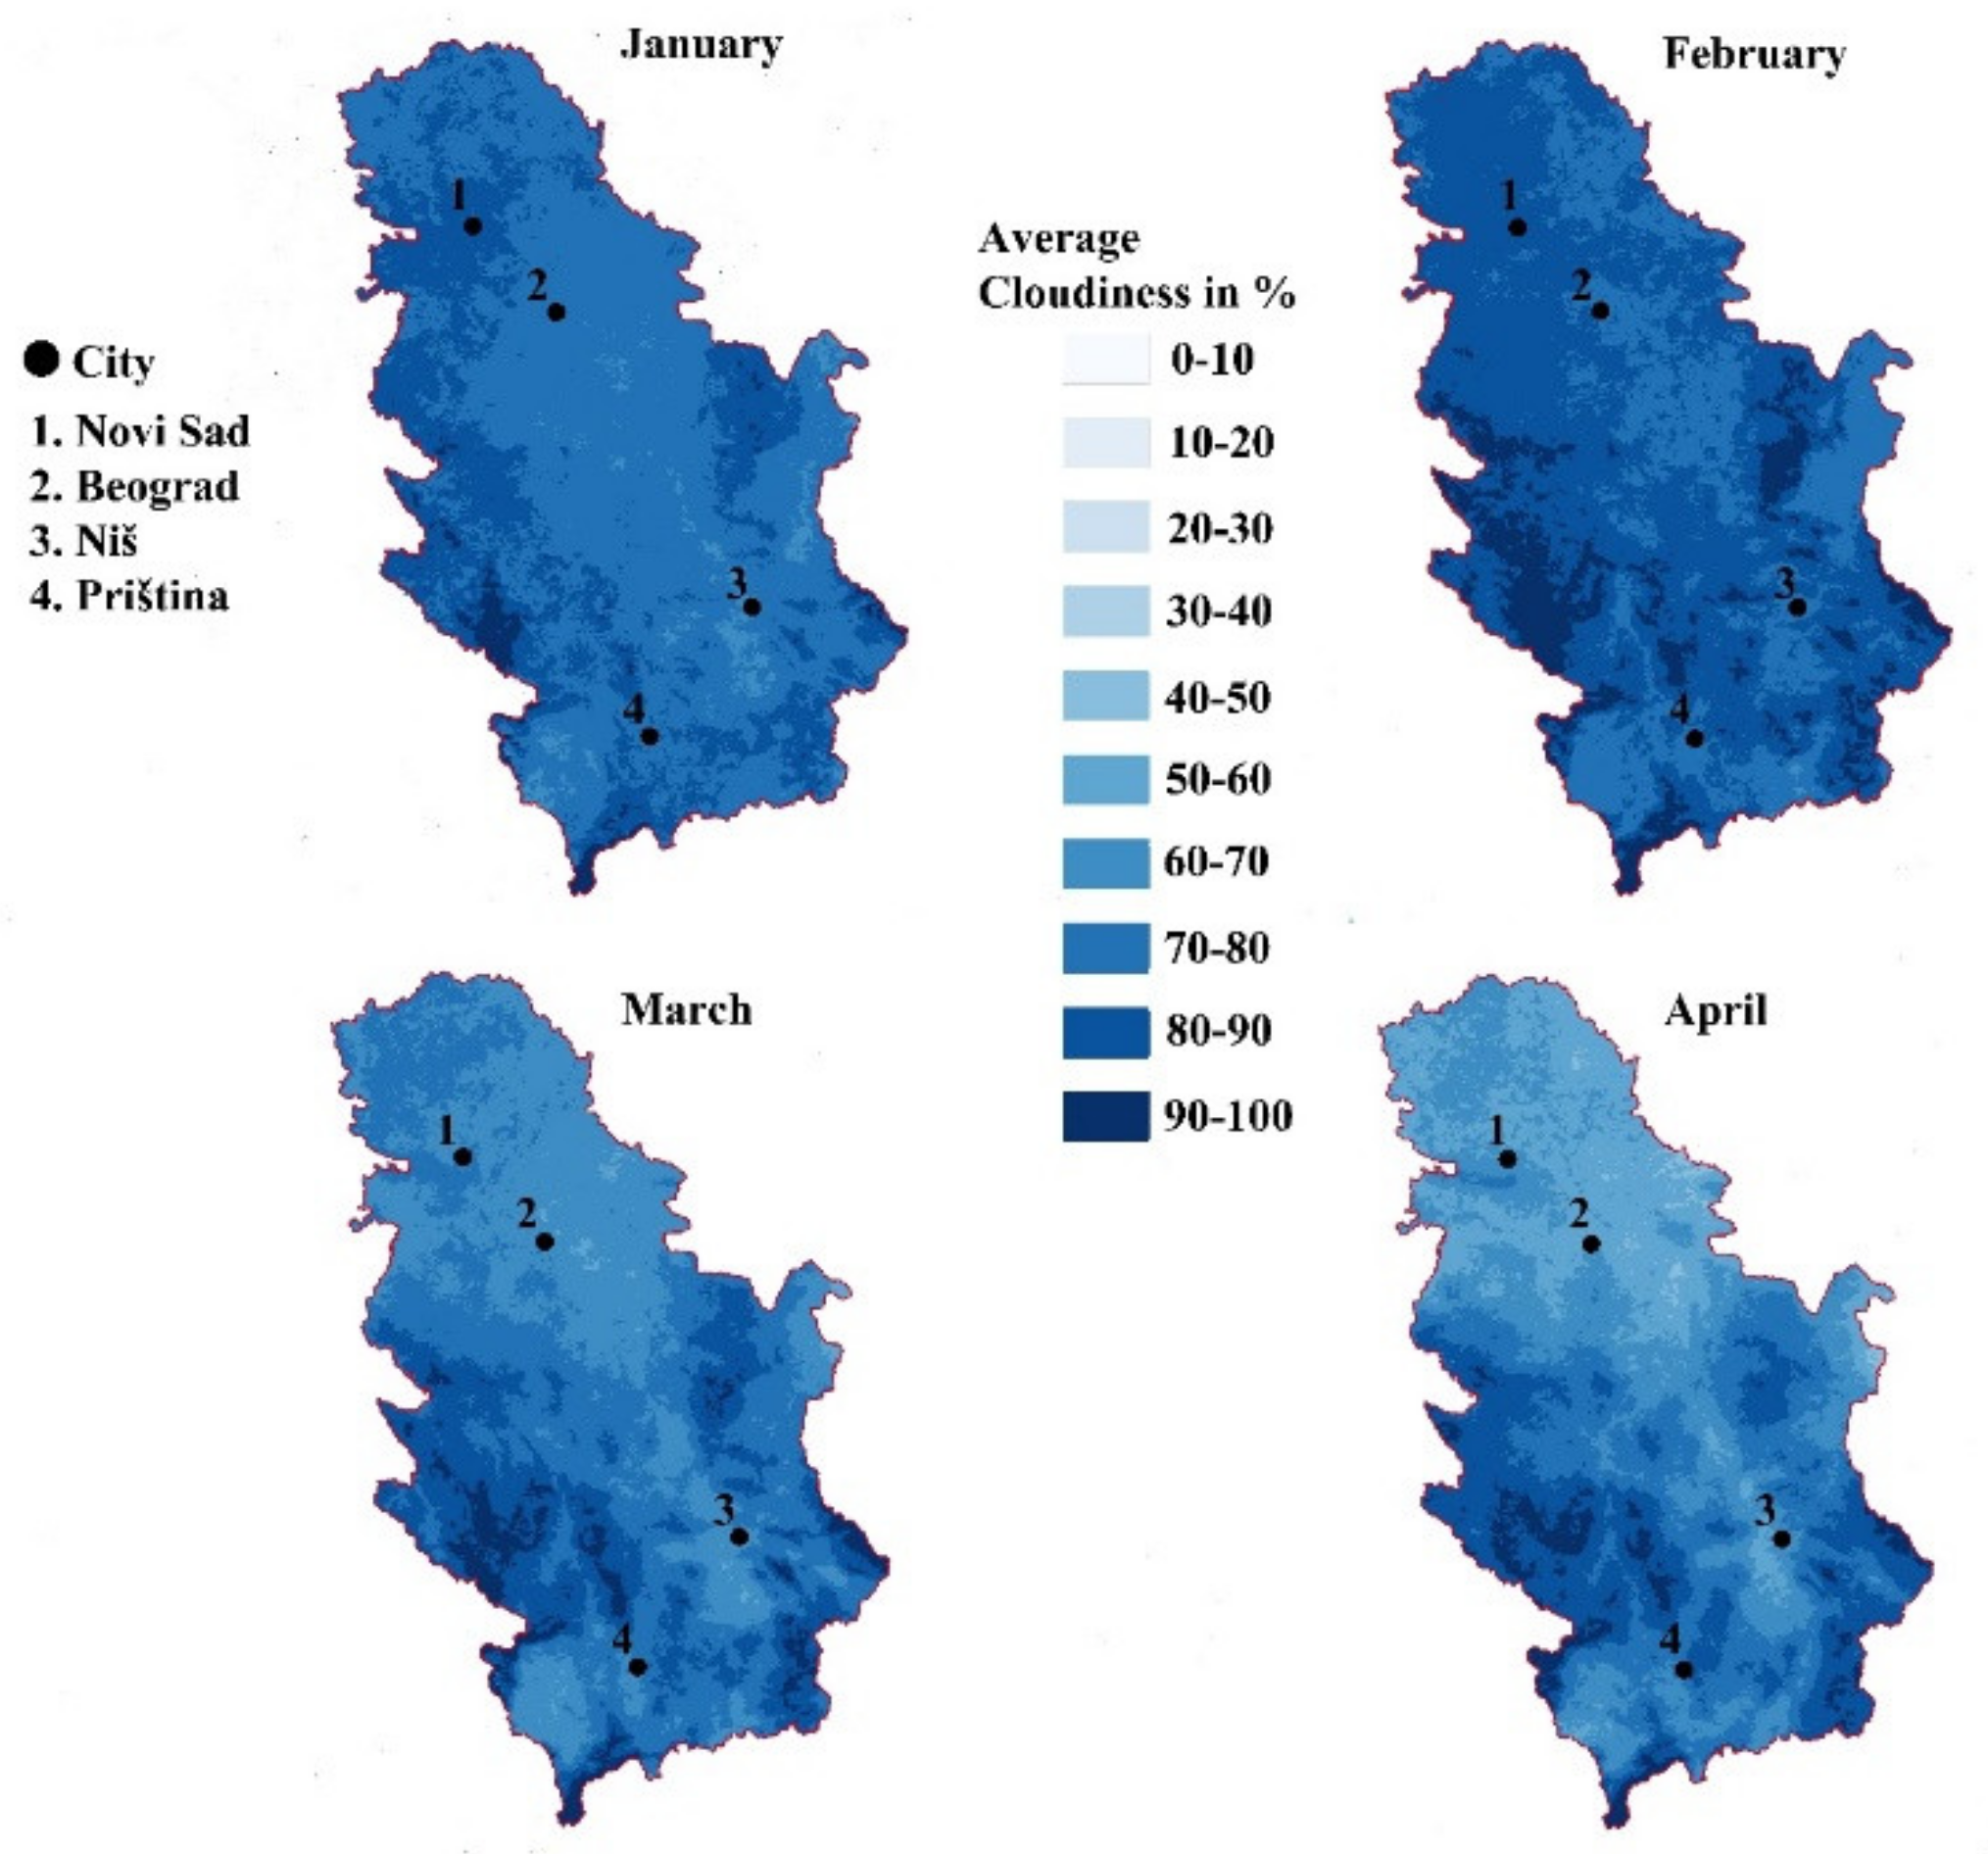
The analysis of the synoptic data of the relative cloudiness in %, which was downloaded from the MODIS satellite and later digitized and vectorized within GIS software, produced the following results. December was the first winter month and had the highest cloudiness between with 90–100% and a territory of 1867.5 km2. The highest cloudiness was distributed in Eastern Serbia, then more to the north in the vicinity of the Danube river, a part of Western Serbia, South-East Kosovo, and South-East Serbia. The cloudiness covered more than 70% of the area at an elevation higher than 700 m. According to Figure 3, February was the month with the highest cloudiness in the winter season. January covered an area of 1456.4 km2 with the maximum cloudiness from 9–100%. Within the last 30 years, the highest cloudiness in this month was in the far East, West, and South-West Serbia, where 80% of these territories occupy elevations higher than 1000 m. In February, the class of 90–100% covered the area of 3856.5 km2 or 4.36% of the territory of the country. Unlike in January, in February, cloudiness did not only cover the areas at the highest elevations. The distribution of territories was identical to those in January, the difference being the northern and eastern parts of the Province of Kosovo, the whole of West Serbia, and a part of Central Serbia, as well as the Pester plateau. March, being the first spring month, had very similar areas of cloudiness like January (Figure 3). The territories were distributed in Western, Eastern, and South-East Serbia, and in the South of Kosovo. A part of the territories with the highest cloudiness was located in Central Serbia. The cloudiness covered somewhat lower elevations, between 300–500 m. The total area of the maximum cloudiness of 90–100% was 2102 km2.
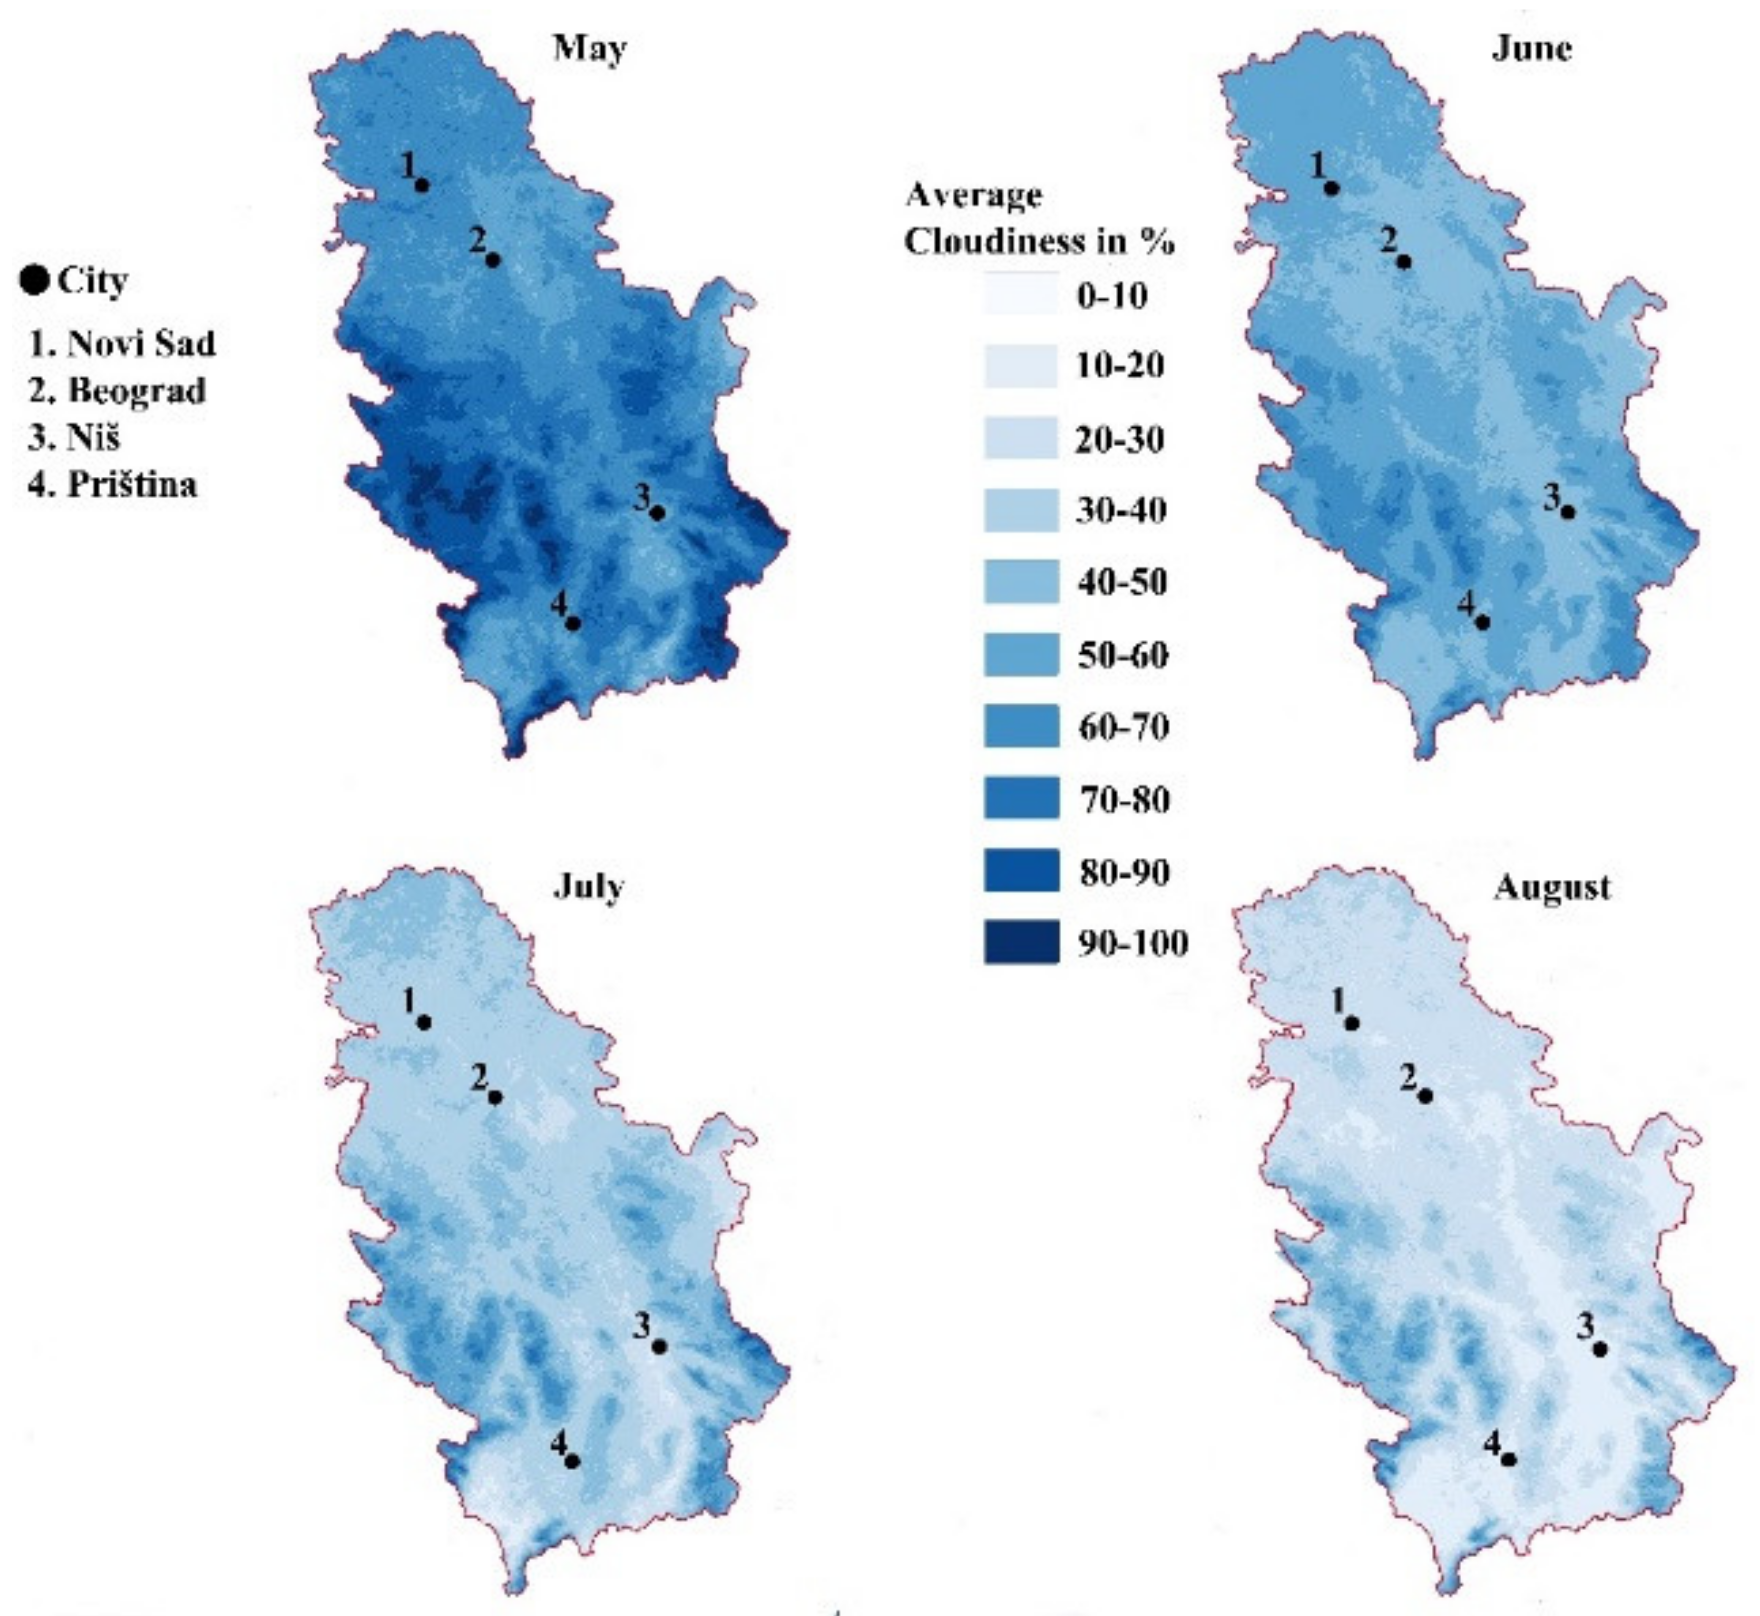
In April, the highest cloudiness of 90–100% covered an area of 2330 km2. This was characterized by the areas in the Eastern parts of the country, in the vicinity of Timok, Pek, and partly Danube. Western Serbia was also covered by clouds in the mountains of Golija, Maljen, and Suvobor. In Kosovo, the areas covered were in the West and in the South. Eastern Serbia had a lot of territories with a maximum cloudiness, most of them being in the Stara mountain. May is a spring month, with the cloudiness being higher than for any other spring month, and the areas with a maximum cloudiness comprised 2560.6 km2. This degree of cloudiness is distributed in the west of Serbia, towards the Drina river, in central Serbia, in some parts of Šumadija, towards the mountains Kopaonik, Goč, Željin. In Eastern Serbia, cloudiness spread over the Suva and Stara mountain; further in the west parts of Kosovo in Mokra Gora; in the south; and on the mountains Prokletije, Šara, Paštrik, and Koritnik (Figure 4).
June, as the first summer month, had much less cloudiness than the winter and spring months. There was no belt of maximum cloudiness of 90–100%. The average cloudiness in June was at maximum values of 70–80%. The belt matched the belts of the maximum cloudiness from the previous months, and was therefore pronounced in the west and in the east of the country and in Kosovo. July, unlike June, had maximum cloudiness areas of 90–100% in the Stara mountain and partly in Mokra Gora in Kosovo. The total maximum cloudiness area comprised 360 km2. The distribution of cloudiness was identical to June. In August, the area of maximum cloudiness comprised an area of 267.5 km2. Maximum cloudiness was distributed over the Stara mountain and partly over the mountain Šara (see Figure 5).
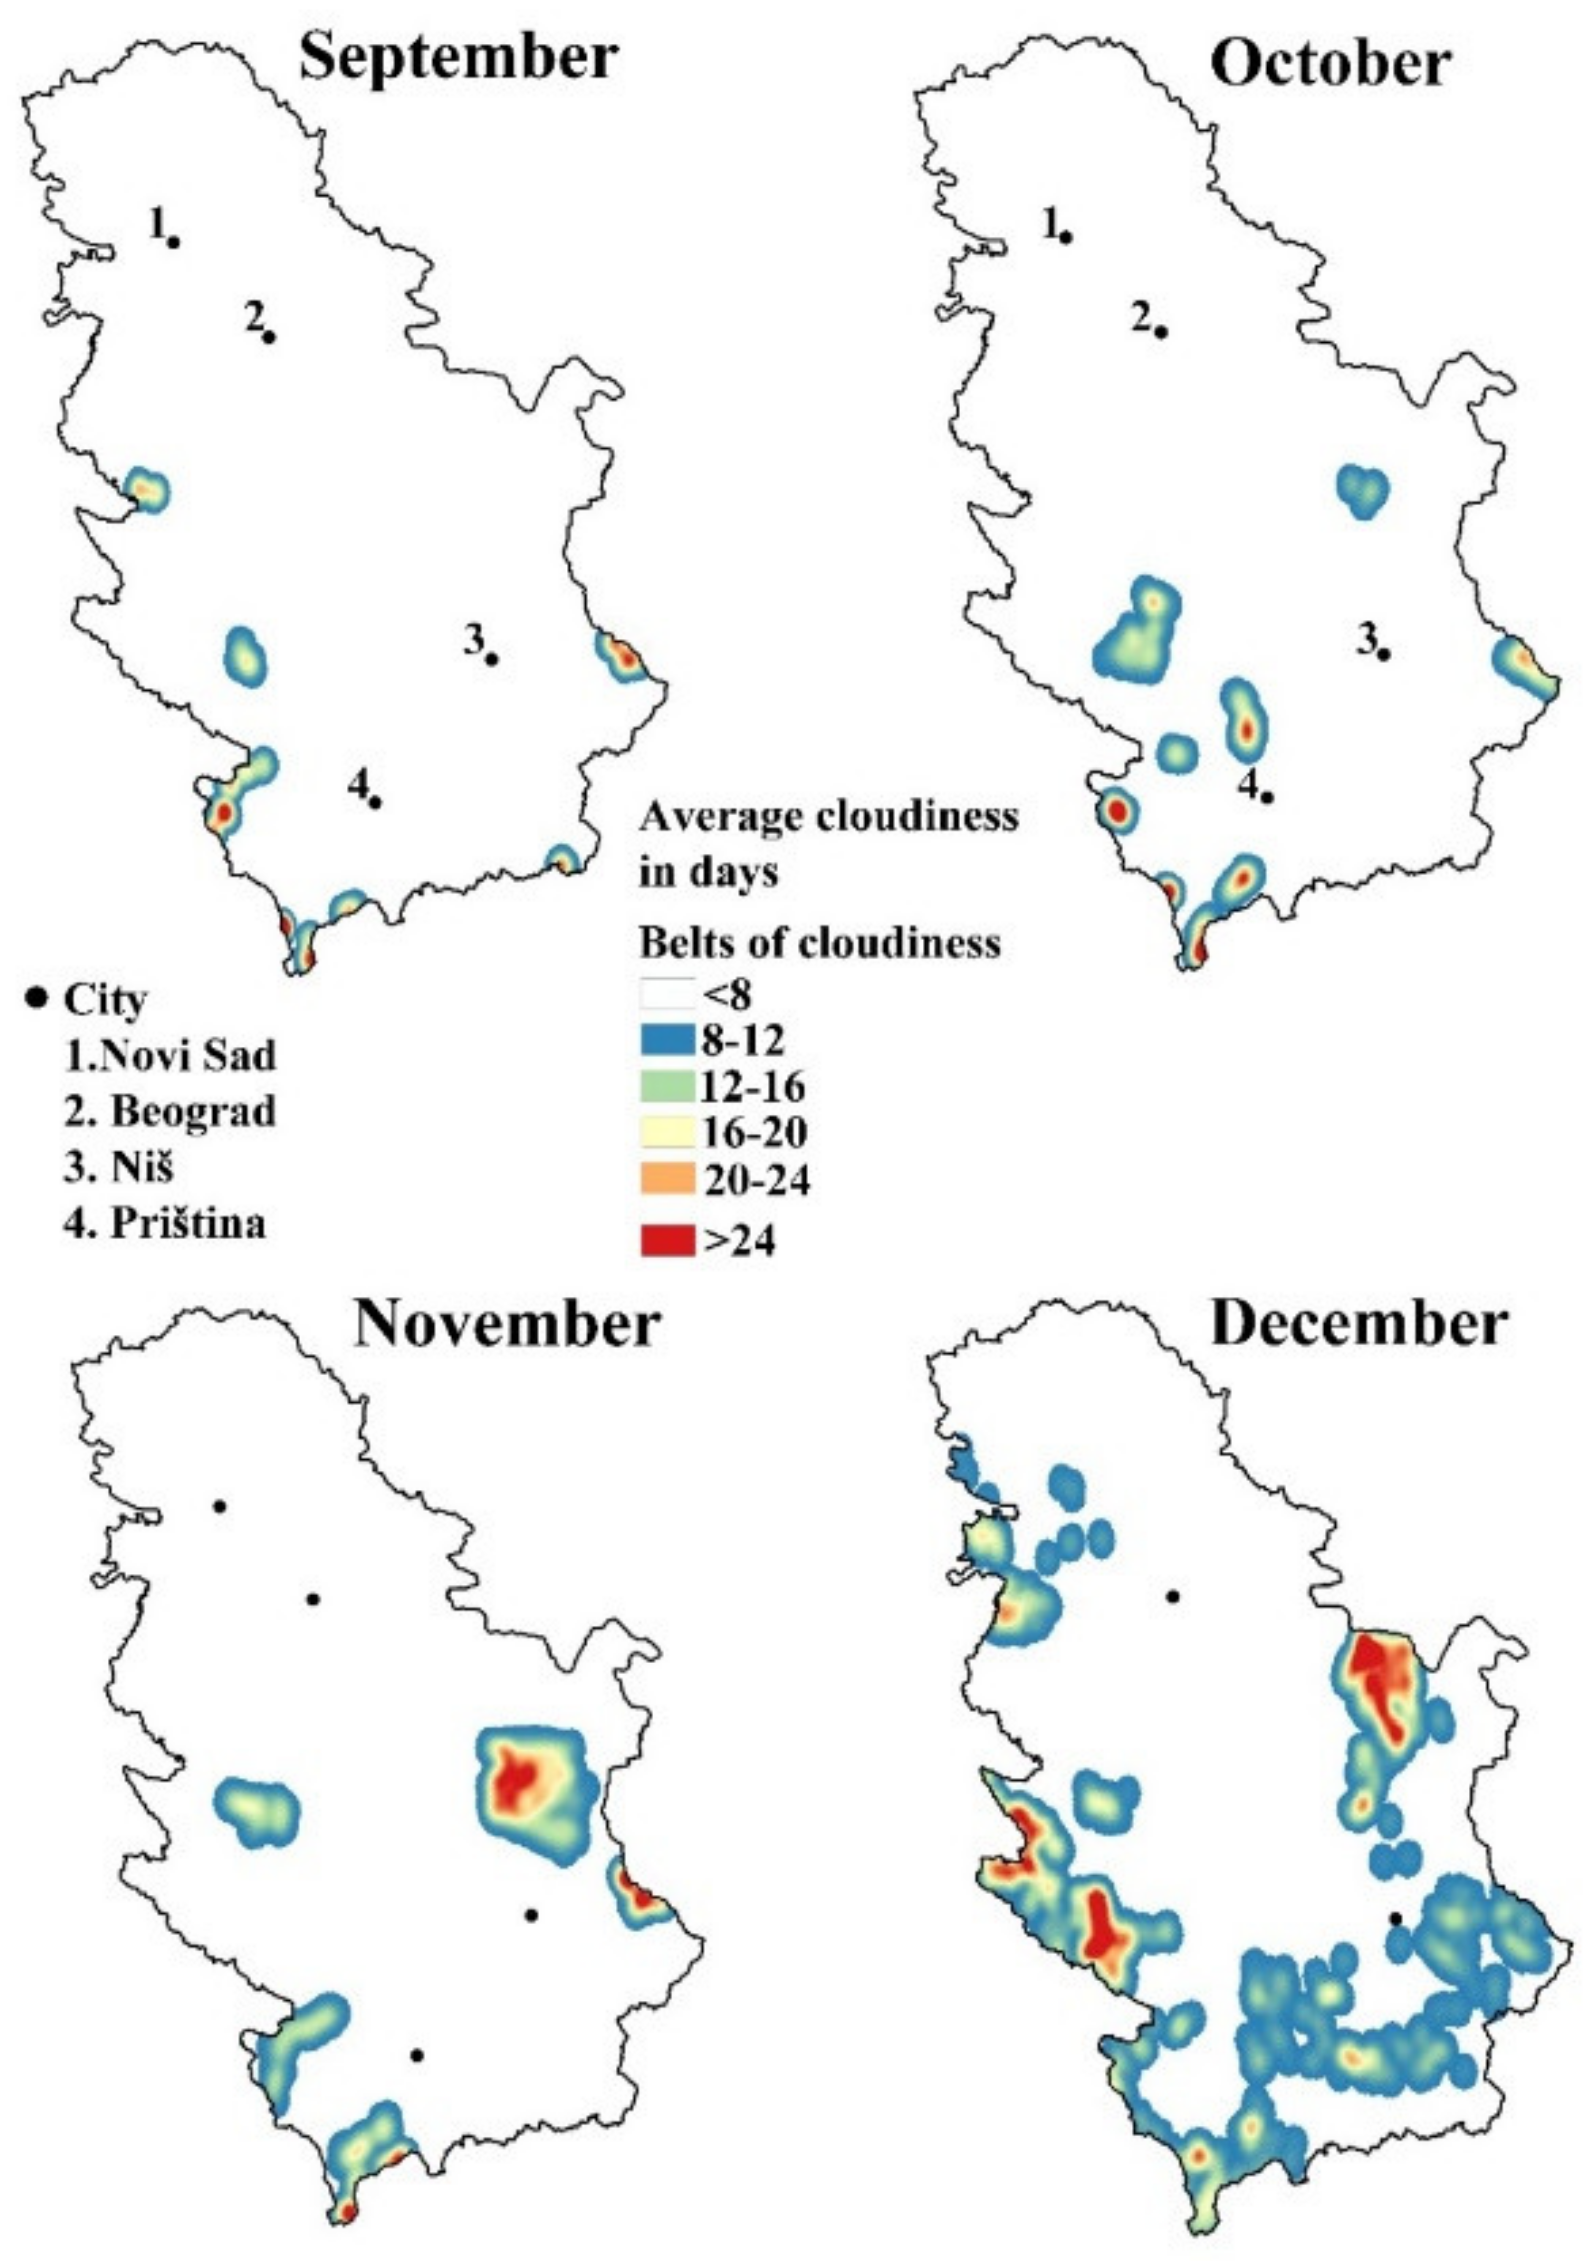
September, as the first autumn month, had cloudiness higher than all of the summer months. Maximum cloudiness in % was distributed in the North-Eastern slopes of the Stara mountain, and in the East and the West of Kosovo in the mountains Šar, Mokra Gora. The total area of maximum cloudiness was 856.2 km2. In October, cloudiness was higher than in September, and it also had a different distribution. Maximum cloudiness of 90–100% was distributed in the east of the country, in the vicinity of Danube, and partly in the Stara mountain. There was also a belt in the south of Kosovo and a part in The Pester plateau. The total area of maximum cloudiness was 902.3 km2.The total area of maximum cloudiness of 90–100% in November comprised an area of 1345.1 km2. The areas were distributed in the Stara mountain; the Pešter plateau; partly in Central Serbia; and in the north, east, and south part of Kosovo (see Figure 5).
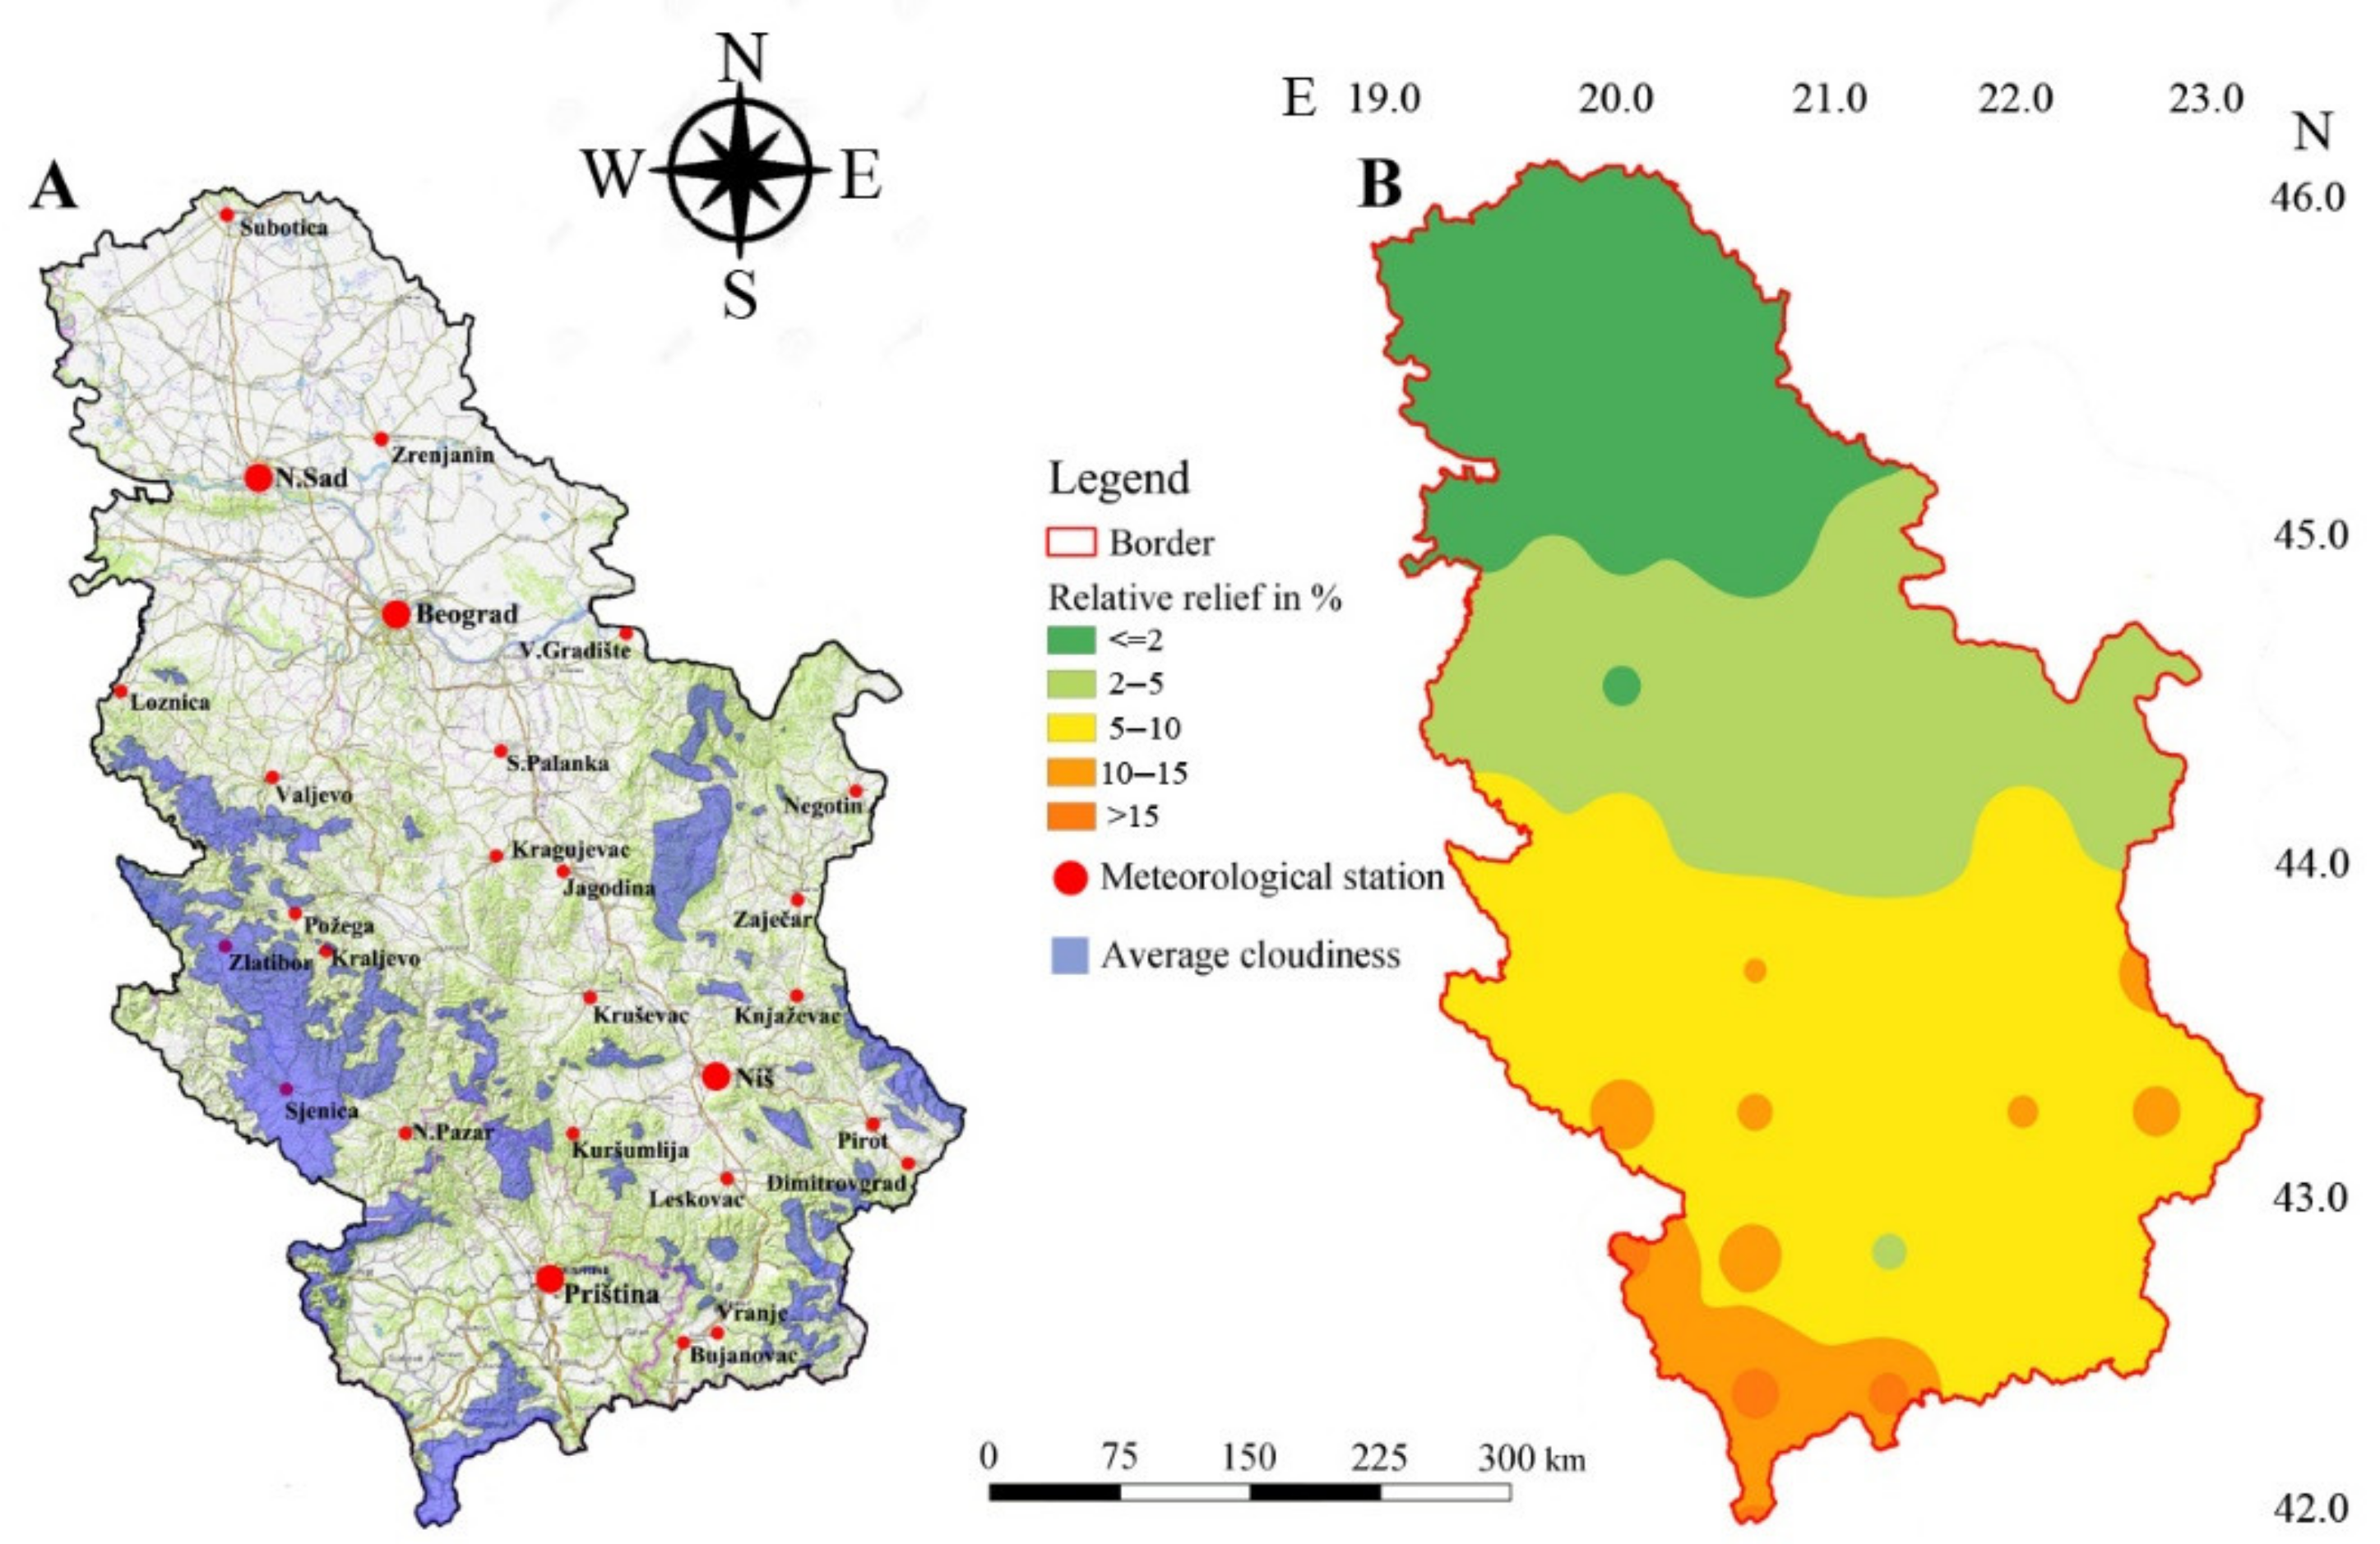
Complete analysis of the relative cloudiness in %, for the first time conducted in this research, pointed to the cloudiest areas in the last thirty years and their dependence on relief. The terrain (elevation) showed the connection of cloudiness and the topography (Figure 6A,B). Upon the completed analysis of the relief properties, there were five areas of different relief features. The first area with the lowest slope of relief ≤2% is situated in the Province of Vojvodina and one small part in Central Serbia. The second area comprises central Serbia to Jagodina in the south, i.e., Valjevo and Loznica in the west and Negotin in the east. In this area, the slope of relief was between 2 and 5%. The third area starts from central Serbia towards the south and comprises South, South-East, South-West, and Western Serbia, as well as the north-east part of the province of Kosovo. Within this area, which had the slope from 5 to 10%, there were also some parts belonging to slopes between 10 and 15 %. The fourth area with the inclination of relief higher than 15% comprises the south-west parts of Kosovo, a part of the country with the most pronounced inclination that comprises the area of the mountains of Prokletije and Šar, which are at the same time the highest mountains in the country. This area borders with Montenegro, Albania, and Macedonia. The most northern part of the maximum cloudiness distribution was within the triangle of Smederevska Palanka, Veliko Gradište, and Negotin, very close to the River Danube. The relative relief in this area was 2 to 5 %, with the total maximum cloudiness being 20%. The following area with a high cloudiness was within the area of the slope of relief between 5 and 10%, comprising 65% of the area. Within the area with the slope of relief between 10 and 15%, there were 10 % of territories with the maximum cloudiness, and within the area with the slope higher than 15%, there were 5% of territories with the maximum cloudiness.
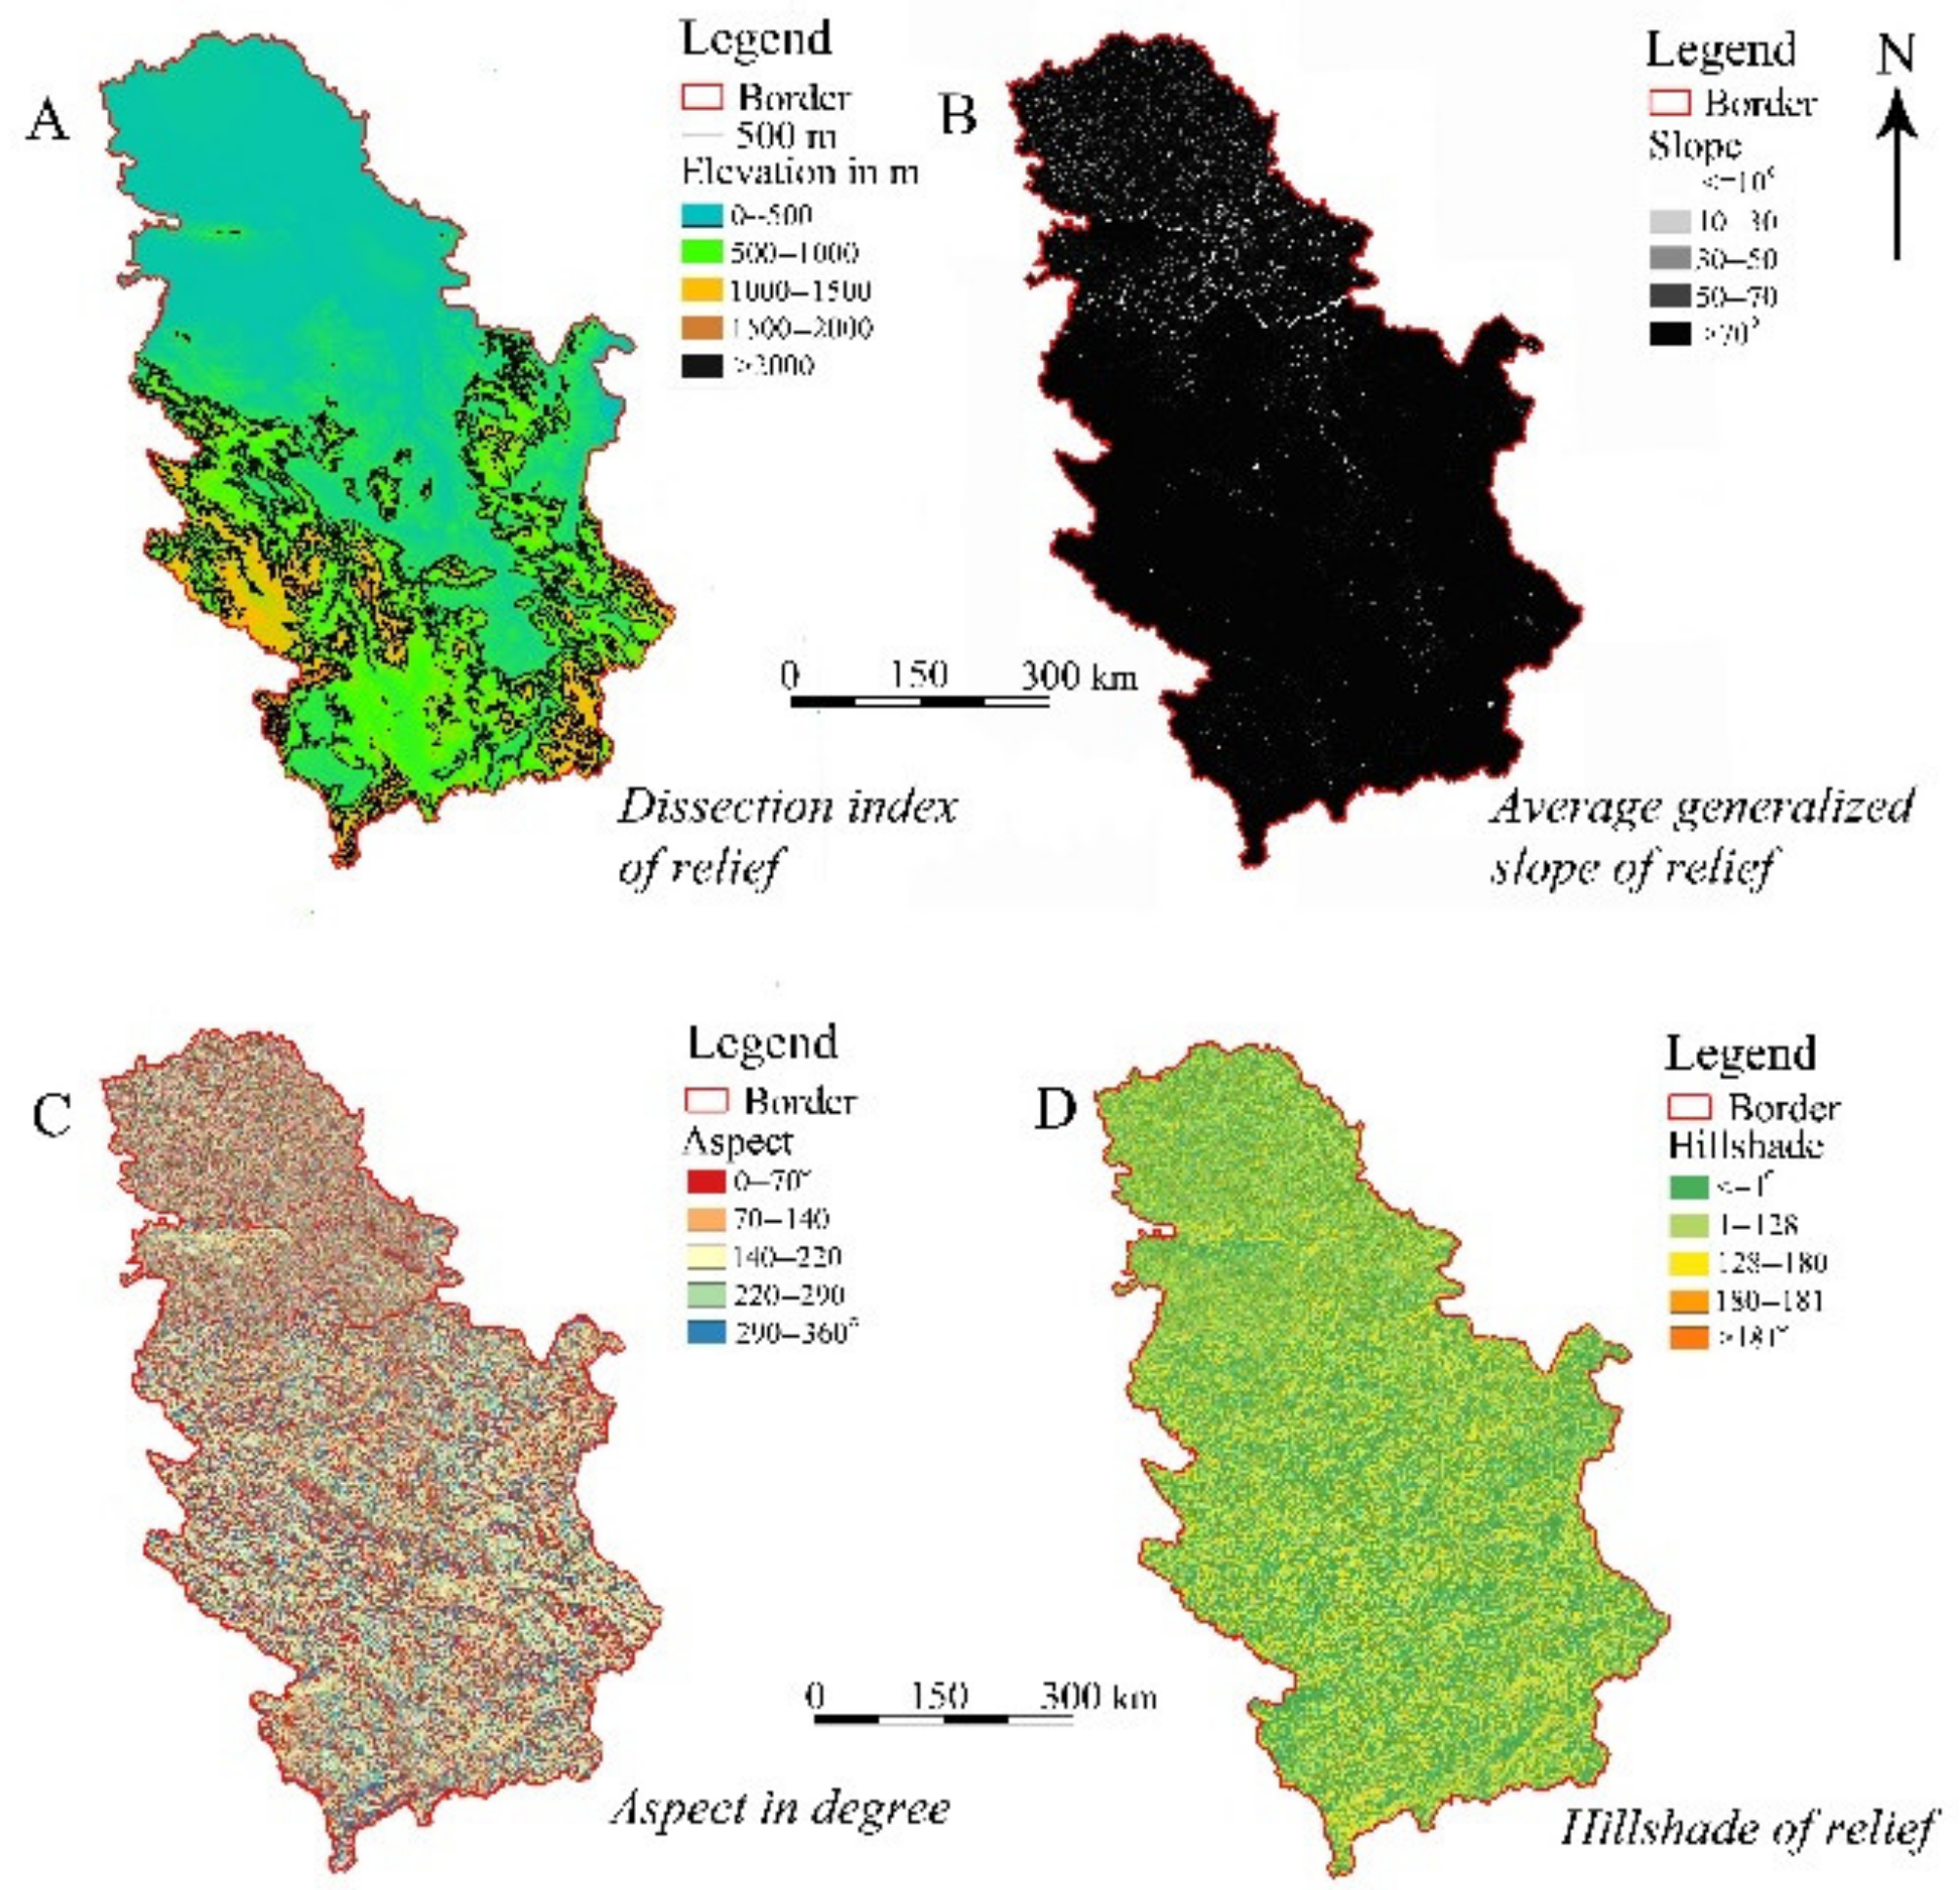
A complete analysis of the relief (see Figure 7A–D) showed that all parameters of relief, such as aspect, hillshade, dissection index, and average generalized slope of index, were in accordance with the terrain relative relief (elevation).

3.1. Absolute Cloudiness in the Last Thirty Years

The number of cloudy days within the period 1989–2019 showed the months with the highest cloudiness and the areas covered by the highest cloudiness. This parameter precisely shows the connection between the cloudiness and the relief. In January, the days were less cloudy than in February and December, which, for the last thirty years has been connected to the lower precipitation volume. This datum also shows the potential connection with the relief and extreme weather. Extreme weather is manifested by extreme precipitation and extreme climatological and hydrological droughts.
Based on the results presented in Figure 8 and Table 1, we came to a conclusion that the cloudiest month within last thirty years was February, with the highest degree of cloudiness in the winter season, after that it was the month December. February has eight more days of cloudiness covering a territory of 40,803.9 km2. The high cloudiness in February is on the area of 1350.1 km2 and mostly distributed in Eastern Serbia on the Stara mountain and in the South-East parts of the Stara mountain. Other areas with high cloudiness that stand out are the locations between Vranje and Medveđa, on the mountain Kukavica and partly in the southern slopes of mountain Radan. Unlike February, which has the biggest territory with the highest monthly cloudiness, in January, the total area covered by clouds was 567.1 km2. These territories are located on the Stara mountain, the eastern part of the country with 23.7 km distance from the city of Pirot. Other large territories with the highest cloudiness are located in the mountains Šara and Dragaš. It is also interesting that one high cloudiness area in January is located in the Pester area near Sjenica. December covered the area of 18,004.6 km2, with more than eight cloudy days, whereas the areas with extreme cloudiness of 24 days comprised the territory of 4427.1 km2. The cloudiness was distributed in the eastern parts of the country, and in the west on the mountain Golija, the Pešter plateau, and the mountain Pobijenik at Priboj (see Figure 8 and Table 1). As the month during the shift of seasons, March covered the area of 4101.4 km2 with eight cloudy days, and the area of 408.2 km2 had cloudiness for more than 24 days. March had the highest cloudiness out of all of the months of this season. In April, the territory covered by clouds for more than eight days was 3881.3 km2. The highest cloudiness comprised the area of 355.6 km2 and was located in the western part of Kosovo on the mountain Prokletije and partly on the mountain Paštrik. Another large belt of cloudiness was on Stara mountain at Crna Trava.
In May, the area with more than 24 days of cloudiness occupied the territory of 306.5 km2, whereas the area with less that 24 days occupies the territory of 3767.2 km2.The territories with the highest cloudiness for more than 24 days are Mountain Zlatibor and Golija. When it came to the summer months, the highest cloudiness was in August. June covered the territory of 81.9 km2 with cloudiness for more than eight days, i.e., 1516.4 km2 with the cloudiness for more than 24 days (see Figure 9 and Table 1). The highest cloudiness in this month was in Kosovo on the Šar mountain and on Prokletije, and partly on the Stara mountain, in the east part of the country. The analysis showed that in the past thirty years (1989–2019), July was the month with the lowest average absolute cloudiness in the country. It had an area of 55.1 km2 with more than 24 cloudy days, and an area of 1094.6 km2 with the cloudiness of eight and more days, located in the identical territory as in June. August haf cloudiness for more than 24 days that covered an area of 2851.8 km2 and extreme cloudiness covering an area of 122.5 km2.
September was the first autumn month that had the lowest cloudiness for all autumn months. It covered an area of 3094 km2 with cloudiness for more than eight days. Extreme cloudiness in this month occupied a territory of 257.2 km2. The highest cloudiness was located on the mountain Prokletije at the border with Montenegro. This was followed by cloudiness on the Stara mountain and Šar mountain in the territory of Kosovo. October was characterized by cloudiness for more than 8 days in a territory of 330 km2, whereas the cloudiness for more than 8 days was distributed in the territory of 6419 km2. November, as the autumn month, had the highest cloudiness, covering the area of 1034.2 km2 with more than 24 cloudy days, whereas the area covered by clouds for more than 8 days was 9319 km2. The highest cloudiness was located on the Stara mountain at Bela Palanka and on the Homolje mountains at Resavica. Furthermore, pronounced cloudiness was present on the Šar Mountain in Kosovo (see Figure 11 and Table 1). After a detailed analysis, it was concluded that the cloudiest months were February, December, and November, whereas the least cloudy were July, then June and August (see Figure 9, Figure 10 and Figure 11 and Table 1).
The mountainous part of Western Serbia is characterized by slight inclinations of relief that do not exceed the angle of 15 %, after GIS and numerical analysis were conducted. The analysis of the energy of the relief and slopes showed that the relief of the mountain systems of Western Serbia along the Drina, at the border with Bosnia and Herzegovina, is slightly to moderately steep. Mountains such as Zlatibor (1496 m) and Golija (1833 m) have moderately steep slopes, especially in the north. Slight and uneven relief is distributed between 300 and 600 m of isohypses, whereas it is somewhat steeper between 600 m and 1200 m of contour lines in the SW. Very steep relief is distributed between 1200 m and 1800 m with azimuth on NE and NW (see Figure 7C,D, Figure 6A,B). The mountain Povlen (1348 m) has low relief, very slight relief between the contour lines of 300 m and 600 m, slightly uneven relief between the contour lines of 600 m and 900m, and relatively steep relief between the contour lines of 900 m and 1200 m. The steepest relief is distributed in the direction of NW and WE. This mountain has a somewhat different distribution of cloudiness throughout the year, which is influenced by the relief. The highest cloudiness on the mountains of Western Serbia in the past thirty years was distributed at the elevations between 500 m and 1000 m. This was followed by cloudiness to 200m, and subsequently by cloudiness at an elevation of 1200 m (see Figure 10).The situation in the Province of Kosovo is different compared to Western and Eastern Serbia. Kosovo is characterized by big and high mountain ranges such as Prokletije (2656 m) Šar (2212 m), Paštrik (1987 m) and Koritnik (2395 m). The highest peak of the country, Djeravica, is on Prokletije. The energy of relief on this mountain is the largest in the country. A very slight relief is found between the contour lines of 400 m and 700 m, in the SW and SE. Slightly uneven relief is found between the isohypses of 700 m and 1300 m in the SE and in the east. A sudden increase in the energy of relief starts above the contour lines of 1300 m. Steep relief is pronounced between the isohypses of 1300 m to 2000 m in the west and in the east, whereas very steep relief is at 2600 m in the south and (see Figure 7C,D, Figure 6A,B). According to the special hypsometry of the mountains belonging to the Province of Kosovo, there is a somewhat different zonal distribution of cloudiness in line with the elevation. The highest cloudiness is between the elevations of 600 m and 1000 m, 1000 m and 1300 m, and finally between 2100 m and 2300 m. The total amount of cloudy days in the mountains of Kosovo is 35% higher than in the mountains of Western Serbia, i.e., 45% higher than in the mountains in Eastern Serbia. The mountains of Eastern Serbia have had significantly lower absolute cloudiness per days in the last thirty years compared with the mountains of Western Serbia and Kosovo. Between the isohypses of 200 m and 500 m, the relief is slight, and is then slightly uneven between 500 m and 1000 m, steep between 1000 m and 1500 m, and very steep at the isohypses between 1500 m and 2000 m. Slight relief is distributed in the SW, south, and east, whereas in the north, and NE relief is very steep. The highest cloudiness occurs at elevations between 200 m and 500 m, 500 m and 1000 m, and 1000 m and 1500 mm, respectively, whereas the lowest cloudiness occurs at elevations between 0 and 200 m, and then between 1500 m and 1800 m (see Figure 6A,B and Figure 7A,C). After the digitization of all of the recordings, we estimated total areas for potential cloud seeding in 5% of the territory and at an elevation higher than 1200 m. The best results for cloud seeding would be in May, on 15% of the territory, and the worst in the July, being 0.7%. The yearly amount of cloud seeding after adding only months without atmospheric precipitation is 10 × 1013 L or 1.1% of all estimated potable waters in Serbia. Although the summer season has small areas of average cloudiness, it would be suitable for cloud seeding in the territory of 1.7% in June, 0.7% in July, 2.1% in August, and 2.0% in September, or in total 6.5% calculated in the last thirty years. The summer season has 10 × 1011 L approximately. This kind of water collecting in Serbia may be used more in the future due to expected climate change effects.

3.2. The Analysis of Linear Trend and Mann–Kendall Test

In the statistical approach, the trend magnitude was defined. First, when the trend was greater than zero, less than zero, or equal to zero, the sign of the trend was negative (decrease), positive (increase), or had no trend (no change), respectively [66,67]. Having done the trend test and the analysis of linear test within XL-stat and Excel software, we obtained more concrete results and were able to calculate the extent of the trend of changes in cloudiness within the past thirty years. Maximum cloudiness (in %) was taken only from the parts of the country where it was the most pronounced within past thirty years (see Figure 12).
From Figure 12, we can observe that the thirty year period is a long enough sequence for the analysis of the data on cloudiness in Serbia, and is fully in accordance with the WMO standards. The most distinctive trend is observable for Western Serbia, which is approximate to the trend in the Province of Kosovo according to the MK test (see Figure 12). Small trend values are present in the data related to Eastern Serbia (see Figure 12, Table 2 and Table 3).
The complete analysis of all three sequences of data on cloudiness in percentage gave the following results. With the analysis of the Mann–Kendall test for Western Serbia, the H0 hypothesis confirmed the fact of probability of the trend with approximately 89.59%. In the Province of Kosovo, there was 85.54% of the existence of a trend. The analysis of data on Western Serbia and Kosovo showed a very pronounced value for the trend. Based on the data for Eastern Serbia, the value of the H0 hypothesis was 19.22%, according to which even if there was a trend, it was negligible (see Table 2 and Table 3). In this way, a certain trend for the increase in cloudiness was shown in three different areas in Serbia, i.e., in Western and Eastern Serbia, and the Province of Kosovo, successively. Based on everything listed here, the following conclusions were drawn: Relative cloudiness, or cloudiness (in %) on the territory of Serbia, within the period 1989–2019, with the maximum overcast was the most pronounced in Western Serbia on high mountains along the border with Bosnia and Herzegovina and Montenegro along the Drina. Western Serbia had the largest areas of cloudiness of 90–100%. This cloudiness was less pronounced in the East of the country, more precisely in the NE, towards the Danube, along the border with Bulgaria and Romania, on the Stara and Suva mountains. This cloudiness had smaller areas than the cloudiness in Western Serbia and Kosovo. Within the Province of Kosovo, cloudiness was higher than in Eastern Serbia and it was distributed on high mountains such as Paštrik, Koritnik, Prokletije, and Šara. Absolute cloudiness (per days) showed a match with 90% of the territories. The highest zone of cloudiness was in Kosovo, at an elevation between 1800 and 2000 m. On average, taking all three areas into account, the highest cloudiness per day was between 500–1000 m. The main conclusion is that cloudiness in Serbia depends on the elevation, but not to the same extent as was previously expected. Raw data on cloudiness after the performed analysis of the trend have shown that there is a trend. The biggest trend is in Western Serbia, despite the fact that the mountains there are lower than in the eastern parts of the country or Kosovo. Future climate changes, if pronounced on the territory of Serbia, may partly be amortized by the relief, particularly at elevations above 1000 m. The lowest maximum cloudiness in the previous thirty years was in the territory of Vojvodina and in the urban zones of Belgrade, the capital. It is certain that there is cloudiness in these areas too, but not at the level of maximum (90–100%). For the first time, in this research, it was shown that mountains of Eastern Serbia had a lower precipitation due to the lower percentage of cloudiness. Thus, it led to raising the issue about the water sustainability of this region in the future. It also refers to some parts of Vojvodina, but also Central, South, and partly South-East Serbia. In comparison with the closest region of cloudiness in Montenegro, there are some similarities in linear trends (see [12]). The equation of cloudiness and overcast in this closest region showed some positive slight trends after the Mann–Kendall test analysis. The similarity was the biggest in the winter season. This confirmation was connected with cyclone elements through the winter season over the Adriatic Sea. There were also other factors that could be the subject of some future investigations.

4. Conclusions

Cloudiness is very important for the agricultural production, distribution, and migration of fauna. This research is an attempt to show the connection between cloudiness as a meteorological phenomenon and relief on the territory of Serbia. In the majority of manuscripts, whose focus is on the analysis of meteorological phenomena and climate, i.e., climate change, the importance of the relief properties’ analysis is not emphasized enough. Although this research was conducted on a relatively small territory of 88,361 km2, it can serve as a base for further investigations into the connection of the relief and climate. Flora is completely dependent on cloudiness, including key factors such as reproduction, growth, survival, and migration. With the help of a very precise grid of 1 km2 downloaded from the MODIS spectrometer, the monthly average frequencies of the clouds were analyzed for the period of 30 years on the territory of Serbia. We obtained the data on cloudiness on a monthly and annual basis. Cloud cover is strongly related to hypsometry. Now, when we have all the areas of cloudiness displayed, it is possible to plan a strategy and the adaptation of agriculture to the forthcoming climate change. Regions with higher cloudiness, and thus a bigger precipitation budget, could represent potential water supplies, which may serve for irrigation. Regions with lower cloudiness should have an irrigation plan not dependent on precipitation. The flora and fauna in the zones of high cloudiness should be preserved by protecting the forest habitats. The main results in this research presented more cloudiness in February in south-east and east region of the country. The topography is a key factor that determines the circulation of lower layers of the troposphere, and its analysis and the knowledge thus gained may in time give more precise and detailed forecast. The territory analyzed in this research is too small to draw general conclusions, but is at the same time, the beginning of a deeper analysis of the relation of meteorological elements and the relief. Finally, it could be important in case of climate change effects on the territory of Serbia. In February, this cloudiness is above 1000 m of altitude and covers almost 47% of the territory. In May, the maximum cloudiness covers 19% of the territory and is positioned at the altitude of 800 m in the western parts of the country. In December, the cloudiness covers 32% of the territory and the cloudiness is at 900 m of altitude. The month with the least cloudiness in the last thirty years is July. Although summer season has small areas of average cloudiness, it would be suitable for cloud seeding in the territory of 1.7% in June, 0.7% in July, 2.1% in August, and 2.0% in September. This could be approximately 10 × 1010 L. The cloud seeding would be effective at elevations higher than 1200 m in the summer season. The cloud seeding may be one of the alternatives for using water in the future. If those were the territories close to borders with other countries, precautions should be taken not to disturb the water balance. Therefore, the main findings of this research play an important part in further deeper analyses of potential cloud seeding in Serbia.

Author Contributions

Conceptualization, A.V. and T.L.; methodology, A.V., T.L., C.M., J.Ž. and L.N.; software, A.V. and U.D.; validation, D.K., J.G., and M.G.; formal analysis, A.V. and N.M.B.; investigation, A.V., T.L., L.S. and C.M.; resources, I.Ž. and N.B.; data curation, A.V., I.M. and U.D., T.L.; writing—original draft preparation, A.V. and T.L.; writing—review and editing, A.V., T.L. and U.D.; visualization, A.V., T.L., U.D. and J.G. All of the authors have read and agreed to the published version of the manuscript.

Funding

This research received no external funding.

Institutional Review Board Statement

Not applicable.

Informed Consent Statement

Not applicable.

Data Availability Statement

To obtain the data for this study, please contact the authors via email.

Acknowledgments

We confirm that all of the authors made an equal contribution to the study’s development. Part of the research was supported by the H2020 WIDESPREAD-05-2020 Twinning: ExtremeClimTwin (GA No. 952384).

Conflicts of Interest

The authors declare no conflict of interest.

References

  1. Renaud, V.; Rebetez, M. Comparison between open-site and below-canopy climatic conditions in Switzerland during the exceptionally hot summer of 2003. Agric. For. Meteorol. 2009, 149, 873–880. [Google Scholar] [CrossRef]
  2. Oriani, F.; Ohana-Levi, N.; Marra, F.; Straubhaar, J.; Mariethoz, G.; Renard, P.; Karnieli, A.; Morin, E. Simulating small-scale rainfall fields conditioned by weather state and elevation: A data-driven approach based on rainfall radar images. Water. Resour. 2017, 53, 8512–8532. [Google Scholar] [CrossRef]
  3. Mazgareanua, P.; Biron, P.M.; Buffin-Bélangerb, T. A fuzzy GIS model to determine confluence morphological sensitivity to tributary inputs at the watershed scale. Geomorphology 2020, 357, 107095. [Google Scholar] [CrossRef]
  4. Srivastava, A.; Saco, P.M.; Rodriguez, J.F.; Kumari, N.; Chun, K.P.; Yetemen, O. The role of landscapemorphology on soil moisture variability in semi-aridecosystems. Hydrol. Process. 2021, 35, e13990. [Google Scholar] [CrossRef]
  5. Kumari, N.; Saco, P.M.; Rodriguez, J.F.; Johnstone, S.A.; Srivastava, A.; Chun, K.P.; Yetemen, O. The grass is not always greener on the other side: Seasonal reversal of vegetation greenness in aspect-driven semiarid ecosystems. Geophys. Res. Lett. 2020, 47, e2020GL088918. [Google Scholar] [CrossRef]
  6. Wilson, A.M.; Jetz, W. Remotely Sensed High-Resolution Global Cloud Dynamics for Predicting Ecosystem and Biodiversity Distributions. PLoS Biol. 2016, 14, e1002415. [Google Scholar] [CrossRef]
  7. Goldsmith, G.R.; Matzke, N.J.; Dawson, T.E. The incidence and implications of clouds for cloud forest plant water relations. Ecol. Lett. 2013, 16, 307–314. [Google Scholar] [CrossRef]
  8. Graham, E.A.; Mulkey, S.S.; Kitajima, K.; Phillips, N.G.; Wright, S.J. Cloud cover limits net CO2 uptake and growth of a rainforest tree during tropical rainy seasons. Proc. Nat. Acad. Sci. USA 2003, 100, 572–576. [Google Scholar] [CrossRef] [Green Version]
  9. Warren, S.G.; Hahn, C.J.; London, J.; Chervin, R.M.; Jenne, R.L. Global Distribution of Total Cloud Cover and Cloud Type Amounts Over Land (No. NCAR/TN-273+STR); University Corporation for Atmospheric Research: Boulder, CO, USA, 1986. [Google Scholar] [CrossRef]
  10. Barrett, E.C.; Grant, C.K. Relations Between Frequency Distributions of Cloud over the United Kingdom based on Conventional observations and imagery from Landsat 2. Weather 1979, 34, 416–424. [Google Scholar] [CrossRef]
  11. Dörnbrack, A.; Kaifler, B.; Kaifler, N.; Rapp, M.; Wildmann, N.; Garhammer, M.; Ohlmann, K.; Payne, J.M.; Sandercock, M.; Austin, E.J. Unusual appearance of mother-of-pearl clouds above El Calafate, Argentina (50°21′S, 72°16′W). Weather 2020, 75, 378–388. [Google Scholar] [CrossRef]
  12. Burić, D.; Stanojević, G. Trends and possible causes of cloudiness variabilit in Montenegro in the period 1961−2017. Clim. Res. 2020, 81, 187–205. [Google Scholar] [CrossRef]
  13. Wylie, D.; Jackson, D.L.; Menzel, W.P.; Bates, J.J. Trends in Global Cloud Cover in Two Decades of HIRS Observations. J. Clim. 2005, 18, 3021–3031. [Google Scholar] [CrossRef]
  14. Norris, J.R. What Can Cloud Observations Tell Us About Climate Variability? Space Sci. Rev. 2000, 94, 375–380. [Google Scholar] [CrossRef]
  15. Clement, A.C.; Burgman, R.; Norris, J.R. Observational and model evidence for positive low-level cloud feedback. Science 2009, 325, 460–464. [Google Scholar] [CrossRef] [Green Version]
  16. Tošić, I.; Hrnjak, I.; Gavrilov, M.B.; Unkašević, M.; Marković, S.B.; Lukić, T. Annual and seasonal variability of precipitation in Vojvodina, Serbia. Theor. Appl. Climatol. 2014, 117, 331–341. [Google Scholar] [CrossRef]
  17. Unkašević, M.; Radinović, Đ. 2000: Statistical analysis of daily maximum and monthly precipitation at Belgrade. Theor. Appl. Climatol. 2000, 66, 241–249. [Google Scholar] [CrossRef]
  18. Tošić, I.; Unkašević, M. Analysis of precipitation series for Belgrade. Theor. Appl. Climatol. 2005, 80, 67–77. [Google Scholar] [CrossRef]
  19. Hrnjak, I.; Lukić, T.; Gavrilov, M.B.; Marković, S.B.; Unkašević, M.; Tošić, I. Aridity in Vojvodina, Serbia. Theor. Appl. Climatol. 2014, 115, 323–332. [Google Scholar] [CrossRef]
  20. Bačević, N.; Vukoičić, D.; Nikolić, M.; Janc, N.; Milentijević, N.; Gavrilov, M.B. Aridity in Kosovo and Metohija, Serbia. Carpathian J. Earth. Environ. Sci. 2017, 12, 563–570. [Google Scholar]
  21. Rosenfeld, D.; Woodley, W.L. Effects of Cloud Seeding in West Texas. J. Appl. Meteorol. Climatol. 1989, 28, 1050–1080. [Google Scholar] [CrossRef] [Green Version]
  22. Dennis, A.S. Weather Modification by Cloud Seeding. Int. Geophys. Ser. Rep. Pap. 1980, 24, 670. [Google Scholar]
  23. Givati, A.; Rosenfeld, D. Separation between Cloud-Seeding and Air-Pollution Effects. J. Appl. Meteorol. 2005, 44, 1298–1314. [Google Scholar] [CrossRef]
  24. Sfîcă, L.; Beck, C.; Nita, A.I.; Voiculescu, M.; Birsan, M.V.; Philipp, A. Cloud cover changes driven by atmospheric circulation in Europe during the last decades. Int. J. Climatol. 2020, 1–20. [Google Scholar] [CrossRef]
  25. Krichak, S.; Alpert, P. Signatures of the NAO in the atmospheric circulation during wet winter months over the Mediterranean region. Theor. Appl. Climato. 2005, 82, 27–39. [Google Scholar] [CrossRef]
  26. Efthymiadis, D.; Goodness, C.M.; Jones, P.D. Trends in Mediterranean gridded temperature extremes and large−scale circulation influences. Nat. Hazards Earth. Syst. Sci. 2011, 11, 2199–2214. [Google Scholar] [CrossRef]
  27. West, H.; Quinn, N.; Horswell, M. Spatio-Temporal Variability in North Atlantic Oscillation Monthly Rainfall Signatures in Great Britain. Atmosphere 2021, 12, 763. [Google Scholar] [CrossRef]
  28. Pyrina, M.; Moreno-Chamarro, E.; Wagner, S.; Zorita, E. Surface and Tropospheric Response of North Atlantic Summer Climate from Paleoclimate Simulations of the Past Millennium. Atmosphere 2021, 12, 568. [Google Scholar] [CrossRef]
  29. Ebert, K.C.; Hättestranda, C.; Hall, A.M.; Alm, G. DEM identification of macroscale stepped relief in arctic northern Sweden. Geomorphology 2011, 132, 339–350. [Google Scholar] [CrossRef]
  30. Hayakawa, Y.S.; Oguchi, T. GIS analysis of fluvial knickzone distribution in Japanese mountain watersheds. Geomorphology 2009, 111, 27–37. [Google Scholar] [CrossRef]
  31. Hoffmann, H.E.; Roth, R. Cloudphysical parameters in dependence on height above cloud base in different clouds. Meteorol. Atmos. Phys. 1989, 41, 247–254. [Google Scholar] [CrossRef] [Green Version]
  32. Vogelgesang, R. Radiation transfer in finite cylindrical clouds. Meteorol. Atmos. Phys. 1996, 58, 205–214. [Google Scholar] [CrossRef]
  33. Petitcolin, F.; Vermote, E. Land surface reflectance, emissivity and temperature from MODIS middle and thermal infrared data. Remote Sens. Environ. 2002, 83, 112–134. [Google Scholar] [CrossRef]
  34. Roger, J.C.; Vermote, E.F. A Method to Retrieve the Reflectivity Signature at 3.75 μm from AVHRR Data. Remote Sens. Environ. 1998, 64, 103–114. [Google Scholar] [CrossRef]
  35. Schneider, A.; Friedl, M.A.; Potere, D. A new map of global urban extent from MODIS satellite data. Environ. Res. Lett. 2009, 4, 044003. [Google Scholar] [CrossRef] [Green Version]
  36. Nee, J.B.; Lu, C.Y. Seasonal migration of cirrus clouds by using CALIOP observations. Meteorol. Atmos. Phys. 2021, 133, 579–587. [Google Scholar] [CrossRef]
  37. Ponomarev, E.; Yakimov, N.; Ponomareva, T.; Yakubailik, O.; Conard, S.G. Current Trend of Carbon Emissions from Wildfires in Siberia. Atmosphere 2021, 12, 559. [Google Scholar] [CrossRef]
  38. Heidinger, A.K.; Evan, A.T.; Foster, M.J.; Walther, A. A naive Bayesian cloud-detection scheme derived from CALIPSO and applied within PATMOS-x. J. Appl. Meteorol. Climatol. 2012, 51, 1129–1144. [Google Scholar] [CrossRef]
  39. Valjarević, A.; Djekić, T.; Stevanović, V.; Ivanović, R.; Jandziković, B. GIS numerical and remote sensing analyses of forest changes in the Toplica region for the period of 1953–2013. Appl. Geogr. 2018, 92, 131–139. [Google Scholar] [CrossRef]
  40. Ceppi, P.; Nowack, P. Observational evidence that cloud feedback amplifies global warming. Proc. Natl. Acad. Sci. USA 2021, 118, e2026290118. [Google Scholar] [CrossRef] [PubMed]
  41. Yao, B.; Teng, S.; Lai, R.; Xu, X.; Yin, Y.; Shi, C.; Liu, C. Can atmospheric reanalyses (CRA and ERA5) represent cloud spatiotemporal characteristics? Atmos. Res. 2020, 244, 105091. [Google Scholar] [CrossRef]
  42. Dee, D.P.; Uppala, S.M.; Simmons, A.J.; Berrisford, P.; Poli, P.; Kobayashi, S.; Andrae, U.; Balmaseda, M.A.; Balsamo, G.; Bauer, P.; et al. The ERA-Interim reanalysis: Configuration and performance of the data assimilation system. Q. J. R. Meteorol. Soc. 2011, 137, 553–597. [Google Scholar] [CrossRef]
  43. Thornton, M.W.; Atkinson, P.M.; Holland, D.A. A linearised pixel-swapping method for mapping rural linear land cover features from fine spatial resolution remotely sensed imagery. Comput. Geosci. 2007, 33, 1261–1272. [Google Scholar] [CrossRef]
  44. Liu, R.; Liu, Y. Generation of new cloud masks from MODIS land surface reflectance products. Remote Sens. Environ. 2013, 133, 21–37. [Google Scholar] [CrossRef]
  45. Wilson, A.M.; Silander, J.A. Estimating uncertainty in daily weather interpolations: A Bayesian framework for developing climate surfaces. Int. J. Climatol. 2014, 34, 2573–2584. [Google Scholar] [CrossRef]
  46. Lukić, T.; Marić, P.; Hrnjak, I.; Gavrilov, M.B.; Mladjan, D.; Zorn, M.; Komac, B.; Milošević, Z.; Marković, S.B.; Sakulski, D.; et al. Forest fire analysis and classification based on a Serbian case study. Acta. Geogr. Slov. 2017, 57, 51–63. [Google Scholar] [CrossRef] [Green Version]
  47. Jawak, S.D.J.; Luis, A.J. Improved land cover mapping using high resolution multiangle 8-band WorldView-2 satellite remote sensing data. Appl. Remote Sens. 2013, 7, 073573. [Google Scholar] [CrossRef]
  48. Li, T.; Fu, B.; Ge, X.; Wang, B.; Peng, M. Satellite data analysis and numerical simulation of tropical cyclone formation. Geophys. Res. Lett. 2003, 30, 2122. [Google Scholar] [CrossRef] [Green Version]
  49. Lu, L.; Shen, X.; Cao, R. Elevational Movement of Vegetation Greenness on the Tibetan Plateau: Evidence from the Landsat Satellite Observations during the Last Three Decades. Atmosphere 2021, 12, 161. [Google Scholar] [CrossRef]
  50. Gorelick, N.; Hancher, M.; Dixon, M.; Ilyushchenko, S.; Thau, D.; Moore, R. Google Earth Engine: Planetary-scale geospatial analysis for everyone. Remote Sens. Environ. 2017, 202, 18–27. [Google Scholar] [CrossRef]
  51. Liu, C.; Yang, S.; Di, D.; Yang, Y.; Zhou, C.; Hu, X.; Sohn, B. A Machine Learning-based Cloud Detection Algorithm for the Himawari-8 Spectral Image. Adv. Atmos. Sci. 2021. [Google Scholar] [CrossRef]
  52. Letu, H.; Yang, K.; Nakajima, T.Y.; Ishimoto, H.; Nagao, T.M.; Riedi, J.; Baran, A.J.; Ma, R.; Wang, T.; Shang, H.; et al. High-resolution retrieval of cloud microphysical properties and surface solar radiation using Himawari-8/AHI next-generation geostationary satellite. Remote Sens. Environ. 2020, 239, 111583. [Google Scholar] [CrossRef]
  53. Srivastava, A.; Rodriguez, J.F.; Saco, P.M.; Kumari, N.; Yetemen, O. Global Analysis of Atmospheric Transmissivity Using Cloud Cover, Aridity and Flux Network Datasets. Remote Sens. 2021, 13, 1716. [Google Scholar] [CrossRef]
  54. Tomazos, K.; Butler, R. Volunteer tourism: The new ecotourism? Anatolia Int. J. Tour. Res. 2009, 20, 196–211. [Google Scholar] [CrossRef] [Green Version]
  55. Valjarević, A.; Filipović, D.; Valjarević, D.; Milanović, M.; Milošević, S.; Živić, N.; Lukić, T. GIS and remote sensing techniques for the estimation of dew volume in the Republic of Serbia. Meteorol. Appl. 2020, 27, e1930. [Google Scholar] [CrossRef]
  56. Flantua, S.G.A.; van Boxel, J.H.; Hooghiemstra, H.; van Smaalen, J. Application of GIS and logistic regression to fossil pollen data in modelling present and past spatial distribution of the Colombian savanna. Clim. Dyn. 2007, 29, 697–712. [Google Scholar] [CrossRef] [Green Version]
  57. Ivanov, V.Y.; Vivoni, E.R.; Bras, R.L.; Entekhabi, D. Catchment hydrologic response with a fully distributed triangulated irregular network model. Water Resour. Res. 2004, 40, W11102. [Google Scholar] [CrossRef]
  58. Wu, J.; Amaratunga, K. Wavelet triangulated irregular networks. Int. J. Geogr. Inf. Sci. 2003, 17, 273–289. [Google Scholar] [CrossRef]
  59. Yang, B.; Li, Q.; Shi, W. Constructing multi-resolution triangulated irregular network model for visualization. Comput. Geosci. 2005, 31, 77–86. [Google Scholar] [CrossRef]
  60. Berg, N.; Hori, T.; Take, W.A. Calculation of 3D displacement and time to failure of an earth dam using DIC analysis of hillshade images derived from high temporal resolution point cloud data. Landslides 2020, 17, 499–515. [Google Scholar] [CrossRef]
  61. Barbier, N.; Proisy, C.; Véga, C.; Sabatier, D.; Couteron, P. Bidirectional texture function of high resolution optical images of tropical forest: An approach using LiDAR hillshade simulations. Remote Sens. Environ. 2011, 115, 167–179. [Google Scholar] [CrossRef]
  62. O’Driscoll, J. Landscape applications of photogrammetry using unmanned aerial vehicles. J. Archaeol. Sci. Rep. 2018, 22, 32–44. [Google Scholar] [CrossRef]
  63. Brewer, J.; Ames, D.P.; Solan, D.; Lee, R.; Carlisle, J. Using GIS analytics and social preference data to evaluate utility-scale solar power site suitability. Renew. Energy 2015, 81, 825–836. [Google Scholar] [CrossRef]
  64. Mann, H.B. Non-parametric tests against trend. Econometrica 1945, 13, 245–259. [Google Scholar] [CrossRef]
  65. Kendall, M. A new measure of rank correlation. Biometrika 1938, 30, 81–89. [Google Scholar] [CrossRef]
  66. Gilbert, R.O. Statistical Methods for Environmental Pollution Monitoring; Wiley: New York, NY, USA, 1987. [Google Scholar]
  67. Karmeshu, N. Trend Detection in Annual Temperature and Precipitation using the Mann Kendall Test—A Case Study to Assess Climate Change on Select States in the Northeastern United States. Master’s Thesis, University of Pennsylvania, Philadelphia, PA, USA, 2012. [Google Scholar]
  68. Razavi, T.; Switzman, H.; Arain, A.; Coulibaly, P. Regional climate change trends and uncertainty analysis using extreme indices: A case study of Hamilton, Canada. Clim. Risk Manag. 2016, 13, 43–63. [Google Scholar] [CrossRef] [Green Version]
  69. Gavrilov, M.B.; Marković, S.B.; Janc, N.; Nikolić, M.; Valjarević, A.; Komac, B.; Zorn, M.; Punišić, M.; Bačević, N. Assessing average annual air temperature trends using the Mann-Kendall test in Kosovo. Acta Geogr. Slov. 2018, 58, 8–25. [Google Scholar] [CrossRef] [Green Version]
Figure 1. The geographical position of the Republic of Serbia.
Atmosphere 12 00964 g001
Figure 2. Algorithms and procedures used in this research.
Atmosphere 12 00964 g002
Figure 3. The average cloudiness within the period of 1989–2019 for January, February, March, and April.
Atmosphere 12 00964 g003
Figure 4. The average cloudiness within the period of 1989–2019 for May, June, July, and August.
Atmosphere 12 00964 g004
Figure 5. The average cloudiness within the period of 1989–2019 for September, October, November, and December.
Atmosphere 12 00964 g005
Figure 6. (A) Areas with high cloudiness in the last thirty years (1989–2019). (B) Terrain relative relief of Serbia from the North to the East.
Atmosphere 12 00964 g006
Figure 7. Analysis of the terrain in Serbia in four areas: (A) dissection index of relief; (B) slope of relief; (C) aspect of relief; (D) hillshade of relief.
Atmosphere 12 00964 g007
Figure 8. Average distribution of cloudiness (January, February, March, and April) in the territory of Serbia per day for the period of 1989–2019.
Atmosphere 12 00964 g008
Figure 9. Average distribution of cloudiness (May, June, July, and August) in the territory of Serbia per day for the period of 1989–2019.
Atmosphere 12 00964 g009
Figure 10. Average distribution of cloudiness (September, October, November, and December) in the territory of Serbia per day for the period of 1989–2019.
Atmosphere 12 00964 g010
Figure 11. The box-plot of average cloudiness in the Republic of Serbia.
Atmosphere 12 00964 g011
Figure 12. Three trend series for three different parts of Serbia.
Atmosphere 12 00964 g012
Table 1. Average cloudiness in days in the territory of Serbia for the last thirty years (1989−2019). Clou in km2.—cloudiness per km2; d.—days; Jan.—January; Feb.—February; Mar.—March; Jun.—June; Jul.—July; Aug.—August; Sep.—September; Oct.—October; Nov.—November; Dec.—December; MIM—minimum; MAX—maximum; STVDEV—standard deviation.
Clou. in km2.Jan.Feb.Mar.Apr.MayJun.Jul.Aug.Sep.Oct.Nov.Dec.
<877,99847,557.184,259.684,479.784,593.886,844.687,266.485,509.285,266.181,94274,028.882,663.7
8–12687234,452.219902024224571148318992334400193192885
12–161024110111689991727234073520013392427988
16–20198432329030214632812374.9134242234184
20–2483856829730120312493.521.11705081318523
>24567135040835625781.955.112325733010341117
Total88,36188,36188,36188,36188,36188,36188,36188,36188,36188,36188,36188,361
MIN10232329030114681.955.121.182.7242234184
MAX77,99847,557.184,259.684,479.784,593.886,844.687,266.685,509.285,266.181,94274,028.882,663.7
Quartile163576432531621716110186.81783751105639
Quartile3565026,866.617721742191361544716081815333575962443
Median1411273076262758730023242922892318721052
STVDev31,095.420,815.834,070.434,178.234,236.935,331.135,537.434,683.534,567.732,958.929,23933,295.2
Table 2. The trend equation (y), trend magnitude (∆y), and probability of confidences (p) for a relative cloudiness time series (from 1989 to 2019).
Time SeriesThe Trend Equation∆y (Cloudiness %)p (%)
Western Serbiay = 0.5444x + 54.839400.476
Province of Kosovoy = 0.3145x + 60.452100.417
Eastern Serbiay = 0.1734x + 50.77420<0.0001
Table 3. The main results of the analysis of cloudiness trends from 1989−2019.
Time SeriesThe Trend EquationMann–Kendall Test
Western SerbiaPositive trendSignificantly positive trend
Province of KosovoPositive trendSignificantly positive trend
Eastern SerbiaNo trendSlightly positive trend
Publisher’s Note: MDPI stays neutral with regard to jurisdictional claims in published maps and institutional affiliations.