Article

Emission of PM2.5-Bound Polycyclic Aromatic Hydrocarbons from Biomass and Coal Combustion in China

School of Space and Environment, Beihang University, Beijing 100191, China
*
Author to whom correspondence should be addressed.
Atmosphere 2021, 12(9), 1129; https://doi.org/10.3390/atmos12091129
Submission received: 12 July 2021 / Revised: 25 August 2021 / Accepted: 30 August 2021 / Published: 2 September 2021

Abstract

:
Field measured PAH emissions from diverse sources in China are limited or even not available. In this study, the PM2.5-bound PAH emission factors (EFs) for typical biomass and coal combustion in China were determined on-site. The measured total PAH EFs were 24.5 mg/kg for household coal burning, 10.5–13.9 mg/kg for household biofuel burning, 8.1–8.6 mg/kg for biomass open burning, and 0.021–0.31 mg/kg for coal-fired boilers, respectively. These EF values were compared with previous studies. The sources profiles of PAHs for four sources were developed to use in chemical mass balance receptor modelling. BaP equivalent EFs (EFBaPeq) were calculated to evaluate PAH emission toxicity among different combustion sources, and were 6.81, 2.94–4.22, 1.59–3.62, and 0.0006–0.042 mg/kg for those four types of sources, respectively.

1. Introduction

Polycyclic Aromatic Hydrocarbons (PAHs), a group of environmental organic pollutants, have received great concern due to their widespread occurrence and adverse ecological and health impact [1,2,3,4]. Human exposure to atmospheric PAHs can cause acute or chronic health effects, such as skin irritation and lung cancer [5]. PAHs are primarily from the incomplete combustion of carbonaceous materials including fossil fuel and biomass. Emissions of PAH vary with combustion sources [1,2].
China had the largest emissions of PAHs around the world and contributed 21 percent of total global emissions in 2007, with the largest source of contributions being household solid fuel combustion [6,7,8]. China has the most complex system of pollution and emission sources in the world. China is by far the largest producer of electricity, cement, iron, and steel, etc., and the largest consumer of coal. Furthermore, technologies and emission control measures vary widely within the same sector. For example, for coal combustion, coal-fired power plants are characterized by high combustion efficiency and high efficiency in emission control, and coal-fired industrial boilers feather a relatively low combustion efficiency and inefficient emission control measures; however, coal stoves in rural households burn inefficiently and have no emission controls [9]. However, only a small number of sources had been characterized by PAH emissions. A few measurements have been conducted to measure PAH emission factors (EFs) for household biomass and coal combustion in the laboratory or in the field [10,11,12,13,14,15,16,17,18]. However, the information of PAH EFs measured on site from other sources are limited or even not available [19,20,21]. An EF is a representative value that relates the quantity of an air pollutant released to the atmosphere within a specific activity, which is important in estimating air pollutant emissions from various sources [22]. The limited available data on PAH EFs for diverse emission sources in China are the dominant contributor to the uncertainty in the PAH emission inventories [6,7].
Receptor models have been widely applied to the quantitative identification of sources of PAHs in the atmosphere, aquatic sediment, and soil [23,24,25,26,27,28,29]. The chemical mass balance model (CMB) is one of these receptor models that uses source profiles and speciated ambient, sediment, and soil data to quantify source contributions for a given receptor. Source profiles are key input data for CMB running. The lack of reliable source profiles of PAHs limits the application of CMB to the identification of sources of PAHs to some extent. In some cases, the missing of localized and specific source profiles of PAHs has led to greater uncertainty in the modeling results. Reviewing the previous studies indicates that due to existing differences in the sampling technique and/or analytical method, large inconsistencies among the literature for the source profiles of PAHs often occurred.
In this study, the PAH EFs for biomass and coal combustion (i.e., biomass open burning and household biofuel burning, coal-fired boilers for electricity generation, coal-fired industrial boilers, and household coal combustion) were determined in the field under the same sampling and analysis method. The results were compared with values in the literature. The PAH profiles for four sources were also provided. The PAH emission toxicity, among different combustion sources, was evaluated. It is hoped that these efforts will lead to a better understanding of the PAH emissions from diverse emission sources in China.

2. Materials and Methods

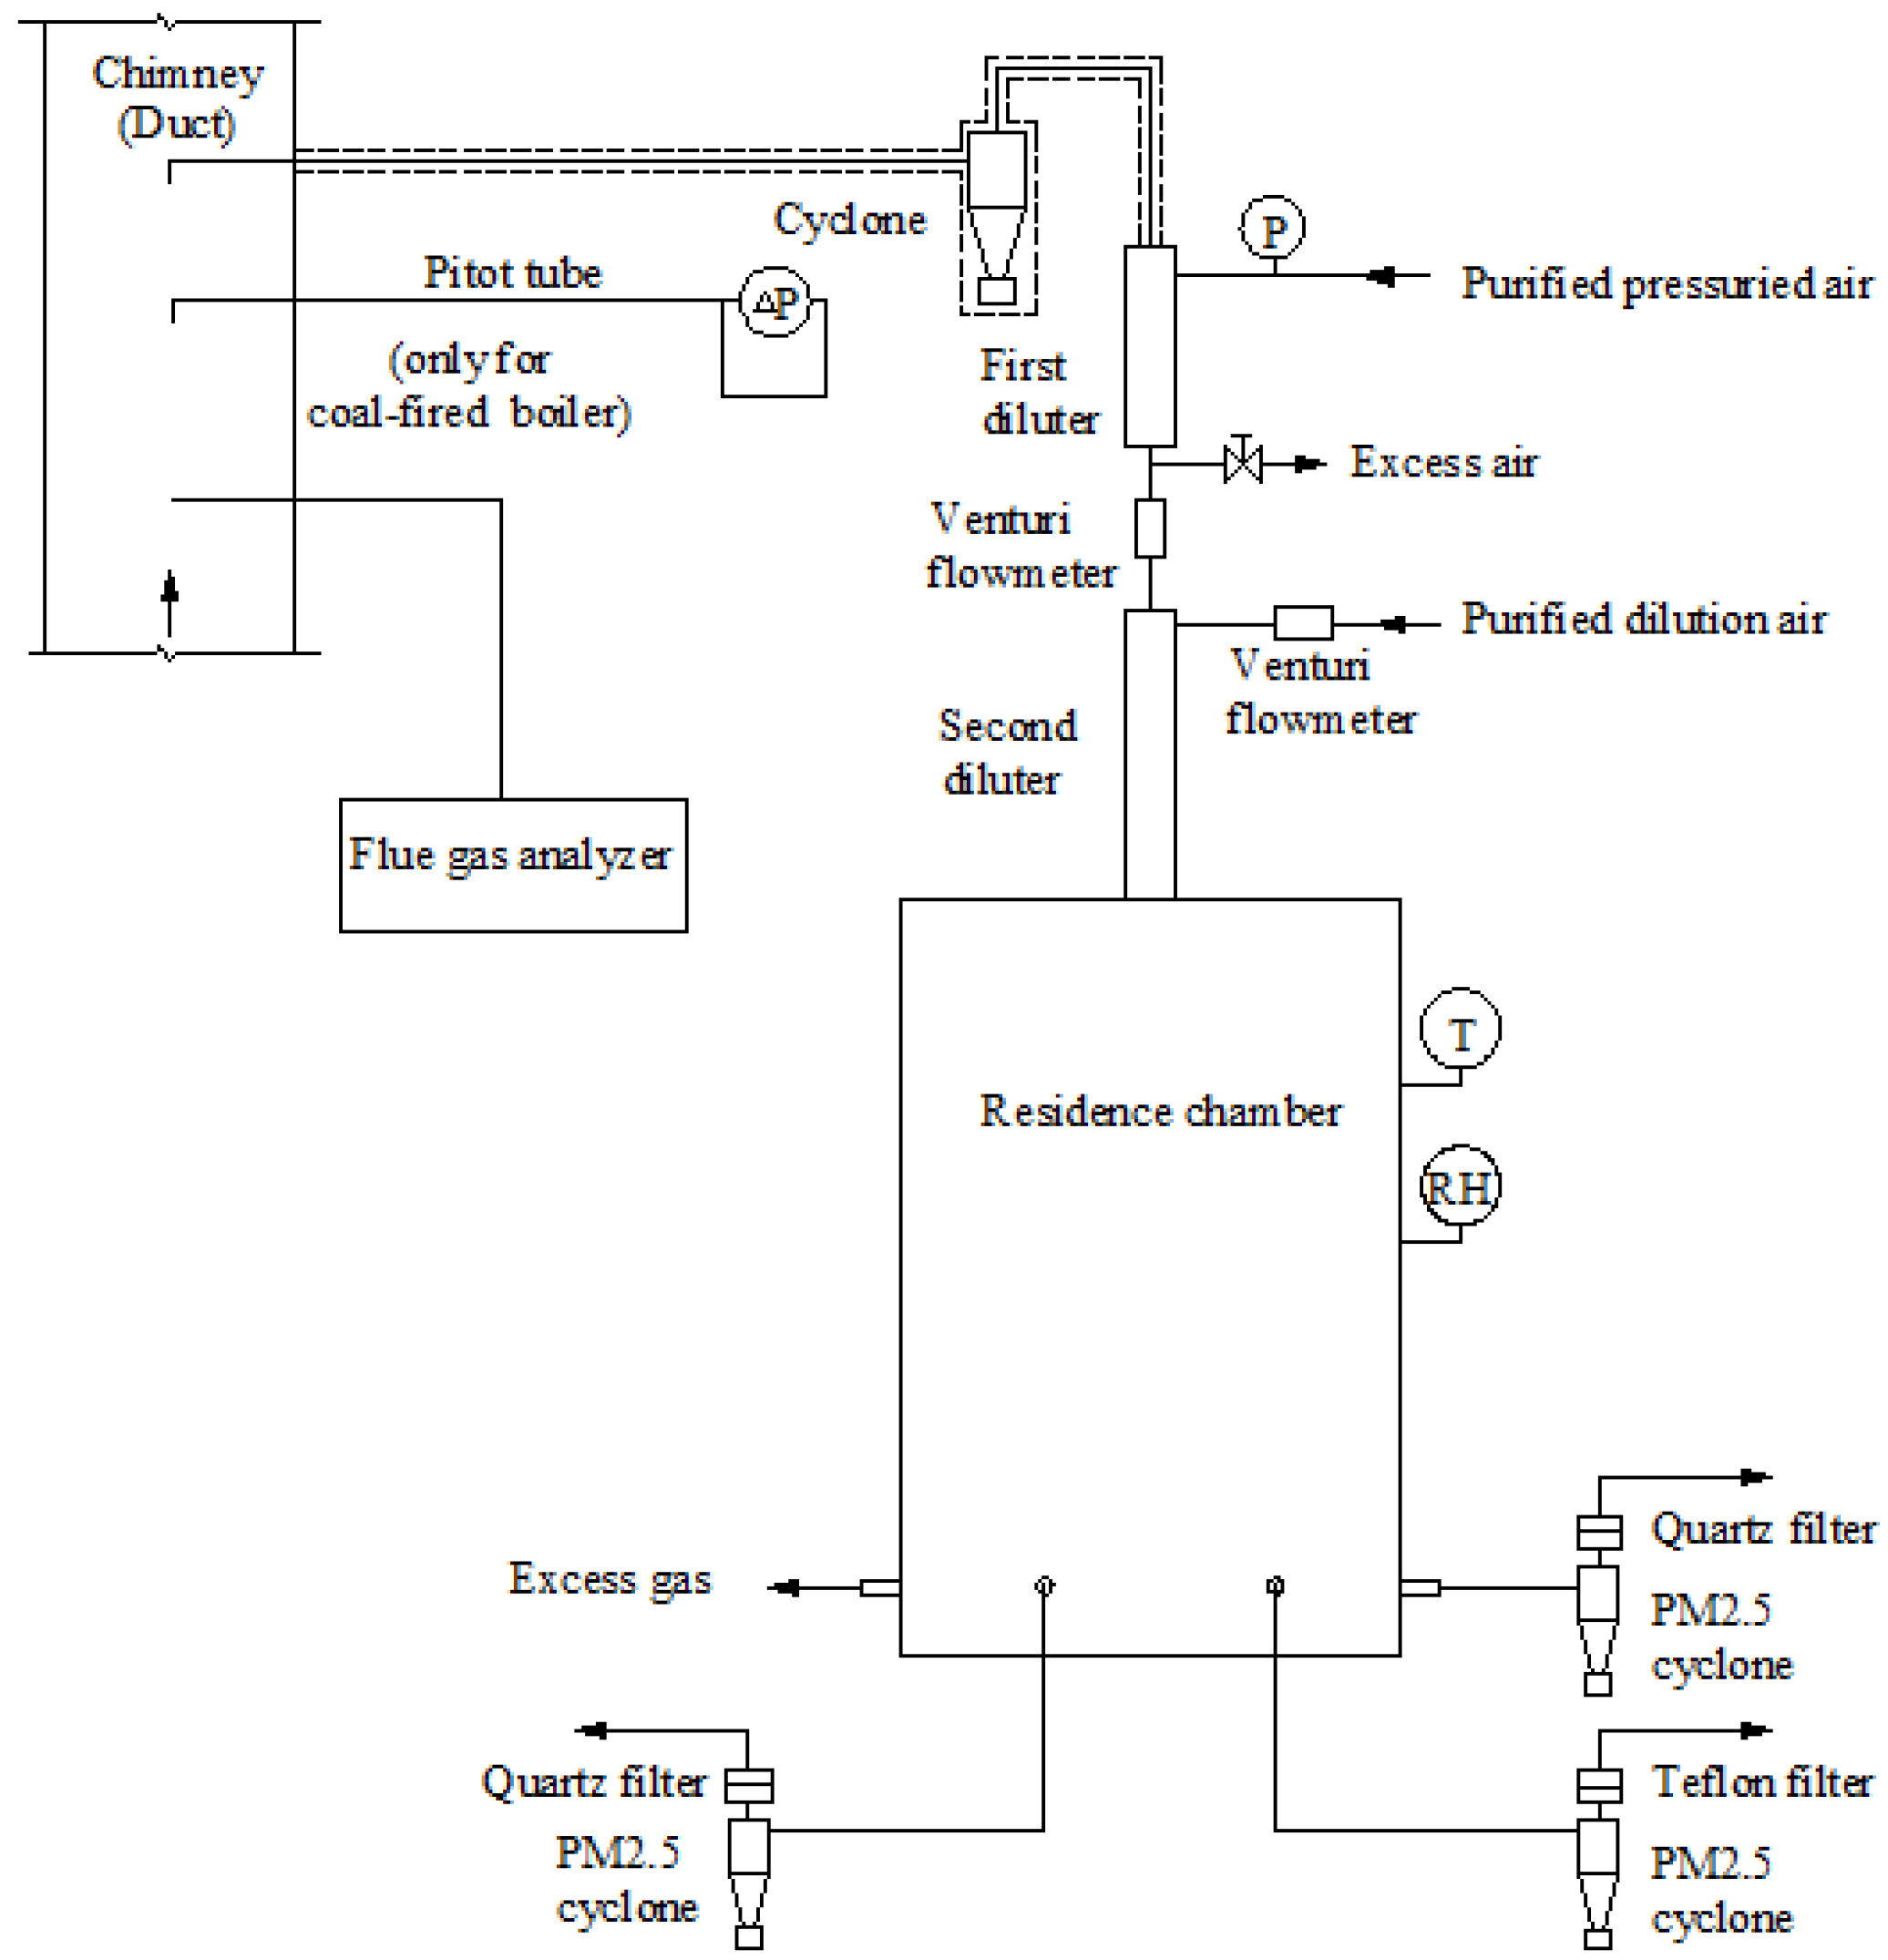
2.1. Combustion Sources and Sampling

Biomass open burning emission experiments were carried out on site at a rural area in Shandong province. Experimental procedure and sampling methods were described by Li et al. [30,31] and are briefly summarized here. Wheat straw and maize stover, which totally account for 59% of total production of agricultural residues [30], were chosen as representatives of agricultural residues. Wheat straw and maize stover were spread in windrows on an open area of the field, respectively. About 40 to 60 kg of the biomass was burned in each run. The headfire ignition technique was used. The samples were collected downwind. The sampling site was about 5 to 10 m from the fire, far enough for smoke emissions to be diluted and cooled to the ambient temperature before sampling. The sampling period covered the entire burn cycle and ranged from 35 to 45 min for each test, including flaming stage and smoldering stage. For each biomass, three successful measurements were conducted. Prior to the planned biomass open burning, ambient background concentrations were measured. Before each measurement, the burned biomass was weighed, and a small part was sealed and sent back to the laboratory for proximate and ultimate analysis. After burning, the residual ash was collected and weighed, and a small part of it was sealed and brought to the laboratory to determine its carbon content. PM2.5 was collected by two parallel middle-volume samplers (78 L/min). One sampler was equipped with 47-mm quartz-fiber filters for organic carbon (OC), elemental carbon (EC), and PAHs analysis. Gases were collected into a 20-L Tedlar bag. The air bag was filled by adjusting the flow rate of the pump throughout the sampling period. After sampling, some of gas samples in the 20-L Tedlar bags were transported to a few 1-L Tedlar bags for different subsequent gas phase component analyses.
Household biofuel combustion emission experiments were conducted in the field in one rural household in Shandong province. Three types of biofuels (including two crop wastes, i.e., wheat straw and maize stover and one woody fuel) widely used in the local households were chosen, and an improved stove (with an enclosed combustion chamber and a chimney, built-in-place brick stove) was selected. The sampling procedures were described in detail in our earlier work [32,33] and are briefly summarized here. A local women operated the stove as per their common cooking practice. The burning cycle was about 30 to 50 min. The sampling period covered the entire cycle. The sampling system included a flue gas analyzer (Model KM9106, Keison), and a dilution system with PM2.5 samplers (Figure 1) [34]. The concentrations of CO2 and CO in the flue were continuously monitored using the flue gas analyzer. The instrument was calibrated before each field study. PM2.5 samples were diluted by the purified air and cooled close to ambient temperature. A dilution air ratio of about 20 and a residence time of about 80 s were applied in the study. PM2.5 samples were collected in three parallel PM2.5 cyclones with filter packs, operating at a flow rate of 16.7 L/min. One filter pack was a 47-mm Teflon filter for determining PM2.5 mass using gravimetric analysis. One filter pack was 47-mm quartz-fiber filters for OC/EC and PAHs analysis. For each biofuel, three tests were carried out. The biofuel burned and the residual ash was weighed, and a small part of them were sealed and brought to the laboratory to determine their carbon content.
Household coal burning emission experiments were carried out on site in one rural household in Chongqing. One typical type of coal, i.e., bituminous raw coal, was used in the measurement, and the coal was burned in a built-in-place brick stove with a chimney. A local woman operated the stove as per their common cooking practice. The sampling period covered the entire cycle, from fire start to fire extinction, and lasted about 150 min. The flue gas measurement and dilution sampling were the same as household biofuel combustion experiments (Figure 1). The coal burned and the residual ash was also weighed, and their carbon content was also analyzed.
Three coal-fired boiler emission field measurements were conducted in Jiangsu, Beijing, and Jilin, respectively. All these boilers burned bituminous coal. One was a coal-fired power plant with a pulverized coal (PC) boiler with a steam flow rate of 670 t/h and a generating capacity of 200 MW. Air pollutant control devices (APCDs) installed in this boiler were an electrostatic precipitator (ESP) and a limestone-based wet flue gas desulfurization (WFGD). The samples were collected both at the outlet of ESP and outlet of WFGD. The second was a coal-fired industrial boiler, a chain-grate boiler, providing hot water for heating, with nominal capacity of 20 t/h. A spray scrubber was set up to remove both particulate matter and SO2. The samples were collected at the outlet of the scrubber. The third was also a coal-fired industrial boiler, a chain-grate boiler, providing steam for industrial production, with nominal capacity of 4 t/h. A cyclone was installed to remove particulate matter. The samples were collected at the outlet of the cyclone. The dilution sampling system, the same as that used in the household biofuel/coal combustion emission experiments, was used to collect PM2.5. A pitot tube was used to measure the gas flow velocity in the duct (Figure 1). During test run periods, those boilers were under normal operating conditions. Sampling lasted 90 min for coal-fired industrial boilers and 150 min for the coal-fired power plant.
The information about the above combustion sources is summarized in Table S1. Additionally, proximate analysis and ultimate analysis for the tested biomass and fuel are given in Table S2.
In the above field measurements, blank samples were also collected for PM2.5 and PAHs analysis.

2.2. Analysis Methods

PM2.5-bound PAHs analysis was described in detail by Chen et al. [35] and is briefly summarized here. Samples in quartz filters were spiked with PAH internal standards and then ultrasonically extracted three times for 20 min each with dichloromethane (DCM). The extracts were purified by passing through silica gel column. Then, the eluents were concentrated to 2 mL with a rotary evaporator. After that, the solvents were replaced with n-hexane. The extracts were further concentrated to 100 μL using nitrogen blow-down, and finally stored at 4 °C for PAH analysis.
The 16 PAHs (naphthalene (Nap) with 2-rings; acenaphthylene (Acy), acenaphthene (Ace), fluorene (Flu), phenanthrene (Phe), and anthracene (Ant) with 3-rings; fluoranthene (Flt), pyrene (Pyr), benzo[a]anthracene (BaA), and chrysene (Chr) with 4-rings; benzo[b]fluoranthene (BbF), benzo[k]fluoranthene (BkF), benzo[a]pyrene (BaP), and dibenzo[a,h]anthracene (DBA) with 5-rings; indeno [1,2,3-cd] pyrene (IcP) and benzo[g,h,i]perylene (BghiP) with 6-rings) in the extract, listed in the Priority Pollutants of United States Environmental Protection Agency (US EPA), were analyzed using gas chromatographic-mass spectrometry (GC-MS) (Trace GC Polaris Q, Thermo Scientific, USA). The separation was achieved by using a DB-5MS capillary column (J&W Scientific Technologies, USA, 30 m × 0.25 mm i.d., 0.25 μm film thickness). MS was used in selected ion monitoring mode. Following US EPA Method TO-13A, laboratory blanks, the field blank, standards, and species-dependent recovery efficiencies were analyzed. Recovery of the standards of PAHs ranged from 80 to 125%, except Nap. The recovery of Nap only reached 60% because of its strong volatility.
Samples in quartz filters were also analyzed for OC and EC contents using a DRI Model 2001 Thermal/Optical Carbon Analyzer (Atmoslytic Inc., Calabasas, CA, USA) following the IMPROVE_A thermal optical transmittance (TOR) protocol. The quartz filters were heated at 500 °C for 4 h to remove any volatile components prior to particle sampling. For biomass open burning, the concentrations of CO2, CO, and total hydrocarbons (THCs) were analyzed using a gas chromatograph with a flame ionization detector (GC-FID). Different packed columns were applied to separate CO2 and CO. The separated CO2 and CO were converted to CH4 by H2 at 375 °C in a nickel catalytic converter, which was determined by the FID. THCs were analyzed as CH4 content by the FID equipped with a blank column. Prior to quantification of THCs’ content, small air peak was reduced from the THCs peak. The carbon content in the tested biomass for open burning, biofuels and coal burned in the household stoves was analyzed using a CHN elemental analyzer (Model CE-440, Exeter Analytical Inc., North Chelmsford, MA, USA). The carbon content in those residual ash was also determined using the same analyzer.

2.3. Calculation of EFs of PAHs

For coal-fired boilers, EFs of PM2.5 and PM2.5-bound PAH species were calculated as follows:
E F i = C i × υ × S × t M
where Ci is the average concentration of PM2.5 or PM2.5-bound PAH species during the whole sampling period, υ is the gas flow velocity in the duct and measured using a Pitot tube, S is the cross-sectional area of the duct, t is the sampling time, and M is the weight of the coal consumed during the whole sampling period.
For biomass open burning, biofuels and coal burned in the household stoves, EFs are determined using carbon mass balance method [30,33,36]. This method assumes the total mass of carbon combusted (carbon in fuel minus carbon remaining in ash) equals the total mass of carbon emitted as carbonaceous species such as CO2, CO, total hydrocarbon species in gaseous phase, and carbon in particulate phase, and has been widely used in emission tests, particularly for field measurements [14,16,30,33,37,38,39].
C f C a = C C O 2 + C C O + C T H C s + C P M
where Cf and Ca are the carbon mass in the fuel and ash, respectively. CCO2, CCO, CTHCs, and CPM are the carbon mass in CO2, CO, total hydrocarbons (THCs), and particles, respectively. Sum of OC and BC in PM2.5 are regarded as carbon mass in particles in the calculation. THCs were not measured in this study. This omission should not have a significant impact on the results. Previous studies have found that omitting THCs results in less than 5% additional error [36]. Zhang et al. [36] gave details about the emission factors that were derived from the carbon mass balance method. EFs of PM2.5 or PM2.5-bound PAH can be calculated by multiplying CO2 EF and the mass emission ratios of PM2.5 or PAH to CO2.
E F i = E F C O 2 × C i C C O 2
where EFCO2 is CO2 EFs, CCO2 is the mass concentration of CO2, and Ci is the mass concentration of PM2.5 or PAH individual species.

2.4. Health Risk Assessment Method

In order to evaluate PAH emission toxicity among different combustion sources, BaP equivalent EFs (EFBaPeq) are applied, which are defined as the emission of BaP equivalent quantity per unit fuel mass, and calculated as follows
E F B a P e q = Σ ( E F i × T E F i )
where EFi is the emission factor of PAH species, TEFi is the toxic equivalent factor (TEF) of PAH species. TEF values, as proposed by Nisbet and Lagoy [40], are 0.001, 0.001, 0.001, 0.001, 0.001, 0.01, 0.001, 0.001, 0.1, 0.01, 0.1, 0.1, 1, 5, 0.1, and 0.01 for Nap, Acy, Ace, Flu, Phe, Ant, Flt, Pyr, BaA, Chr, BbF, BkF, BaP, DBA, IcP, and BghiP, respectively.

3. Results and Discussion

3.1. Emission Factors of PM2.5-Bound PAHs

The emission factors of the PM2.5-bound PAHs from various combustion sources are shown in Table 1. The EFs are reported in the unit of pollutants mass per fuel mass on an air-dried basis. The total emission factor of 16 PAHs (ΣPAHs) is the highest for household coal burning, 24.5 mg/kg fuel burned; followed by the household burning of three types of biofuel, with the ΣPAHs in the range of 10.5–13.9 mg/kg; next is the open burning of two types of crop straw, with the emission factor slightly lower than that of household biofuel burning, in the range of 8.1–8.6 mg/kg. Finally, the ΣPAHs’ emission factor for coal-fired boilers is much lower than those of the first three types, among which the lowest emission factor is for a coal-fired power plant, with the ΣPAHs’ emission factor from the FGD outlet being only 0.05 mg/kg, which is two to three orders of magnitude lower than that of household coal/biofuel burning. Compared with the measured PM2.5 emission factors, the ΣPAHs only account for about 0.2~7‰ of PM2.5, with household coal burning being the highest and coal-fired power plant being the lowest.
BaP is commonly regarded as an indicator of the cancer risk assessment of PAHs [40]. Its emission factor is the highest for household coal burning, 1.62 mg/kg fuel burned; and is the lowest for coal-fired boilers, ranging from 0.003 to 0.0003 mg/kg. BaP emission factors for biomass open burning and household biofuel combustion are in the middle range, which ranges from 0.56 to 0.79 mg/kg. Similar with the ΣPAHs, BaP emission factors for coal-fired boilers are two to three orders of magnitude lower than those for household coal/biofuel burning.
PAHs are mostly formed during incomplete combustion [1,2]. Small household coal and biofuel burning and biomass open burning are characterized by the poor mixing efficiencies of air and fuel, low combustion temperature, and short residence time in the combustion chamber, resulting in high incomplete combustion, and then large PAH emissions; while coal-fired boilers, especially large pulverized coal boilers in the power plant, have a high combustion temperature, high mixing efficiencies of air and fuel, and a relatively long residence time in the combustion chamber, which facilitates the sufficient combustion of fuel and low PAH formation. Furthermore, those boilers are equipped with APCDs to remove air pollutants including PAHs; therefore, the PAH emission factors are very low.
Several studies have measured the emission factors of PAHs from various combustion sources (Table S3). Jenkins et al. [41] conducted open burning simulations from in the wind tunnel simulations to investigate the PAH emission from crop and forest residues burning and obtained emission factors of a total of 19 PAH species (including gas phase and particulate phase) for cereals and wood in the range of 7.9–350 and 14.2–30.6 mg/kg, respectively. Our ΣPAHs emission factors from the open burning of two crop straws for the particulate phase are at the lower end of those values, including the gas phase and particulate phase. Hays et al. [42] simulated the open burning of two major grain crops in an enclosure and the reported PM2.5-bound PAH emission factors were 1.8 to 15.7 g/kg. Wiriya et al. [43] investigated emissions from the open burning of three types of biomass in a burning chamber, and the obtained PAH emission factors of the PAHs in PM10 were 0.47–0.91 g/kg. Our data are within the range of Hay et al. [31]; however, they are much higher than those of Wiriya et al. [43]. Oanh et al. [44] measured emissions from rice straw open burning both in the field and in the laboratory simulation in Thailand, and they reported that the field measurement emission factors of PM2.5 bound PAHs were 16.6 ± 1.7 g/kg. Those data for the laboratory simulation were 2.2 ± 0.2 g/kg. Our results are lower than those field data; however, they are greater than those laboratory measurements. Most of the studies on the open burning of PAH emissions were conducted in the laboratory, and the laboratory simulation experiments demonstrated that PAH emissions are dependent on the biomass type and its moisture, biomass loading, burning style (i.e., spreading or pile burning), burning condition, and weather condition [41,43,44]. More on-site measurements that capture the real-world burning and emissions of open burning are expected in the future.
For coal-fired boilers, previous studies generally applied a hot temperature sample method with a filter to capture particulate phase PAHs (under hot temperature) and XAD-2 resin to collect gas-phase PAHs (Table S2). It is worth noting that hot temperature sampling could make more aromatic compounds partition into the gas phase and less into the particulate-phase. Those boilers were all equipped with air pollution control devices (APCDs). The previously reported emission factors of total PAH species (including gas phase and particulate phase) for PC boilers are very low, in the range of 0.002 to 0.6 mg/kg [20,45,46,47]. Our ΣPAHs emission factors from PC boilers for the particulate phase fall in the range of those values. However, Wang et al. [19] reported a high PAH emission factor (3.53 mg/kg) for a CFB, which is greater than those values in previous studies for PC boilers, also higher than the data for the PC boilers and chain-grate boilers obtained in this study. At present, the data about the PAHs emitted from a CFB and chain-grate boiler are limited. However, those boilers are widely used in China; more measurements on the PAH emissions from those boilers are highly needed in the future to fill this data gap.
A few measurements have been conducted in the laboratory and in the field to characterize the PAH emissions from household solid fuel burning [10,11,12,13,14,15,16,17,18,48,49,50] (Table S2). Previous studies have shown that significant differences in the measured emission factors between laboratory and field tests were frequently observed. Field measurements often reported higher emission data compared to those laboratory tests [51]. Since field measurements provide more realistic emissions under real household burning conditions, we focus on comparing our on-site test data with those obtained from field measurements in the literature. The particulate phase PAH EFs reported in the literature range from 21.7 to 429.2 mg/kg for biofuel burning, and 1.7 to 206 mg/kg for coal burning, varying two orders of magnitude due to many factors including stove types, fuel type and its properties, fuel adding, combustion condition, air supply, etc. Our ΣPAHs emission factors for household solid fuel burning are in lower end of those values. It should be noted that the variation in our data was relatively small, which may be due to the limited samples of stove types and fuels in this study.

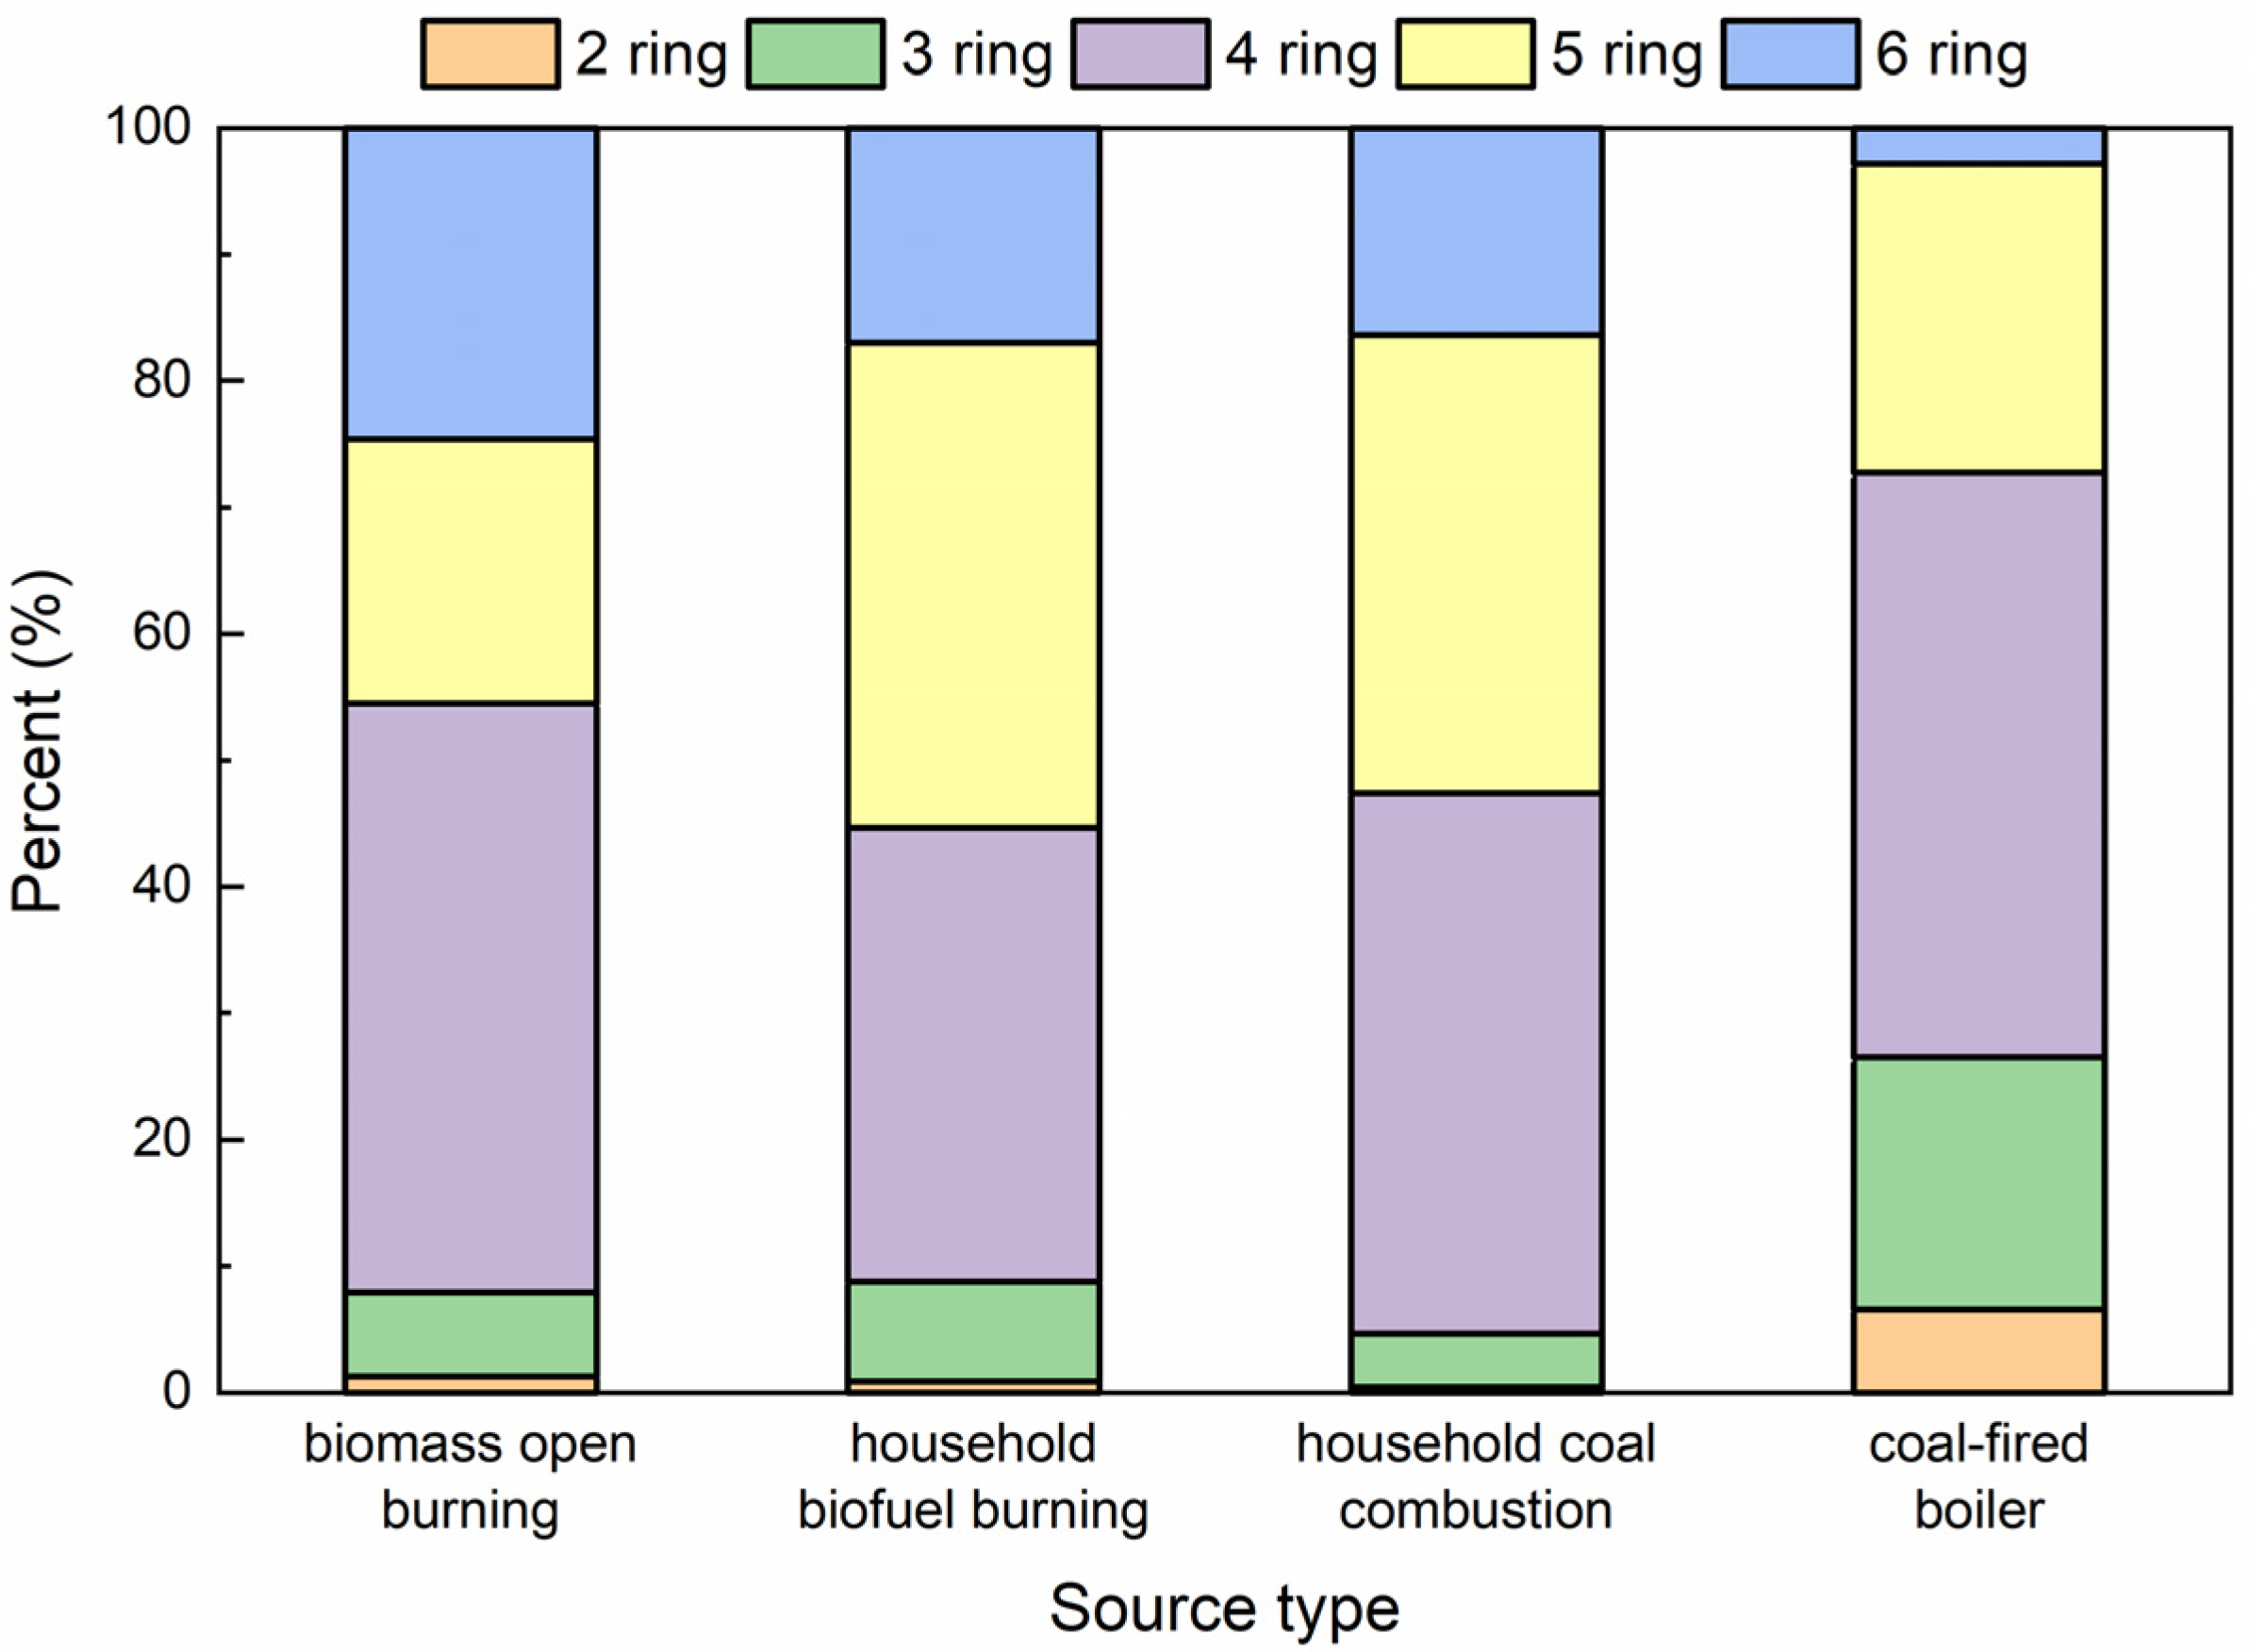
3.2. PAHs Composition Profiles

According to the similarity of emission sources obtained in this study, we categorized them into four sources, i.e., biomass open burning, household biofuel burning, household coal combustion, and coal-fired boiler. The concentration of an individual PAH was divided by the concentration of the ΣPAHs in the samples and normalized to a dimensionless weight percentage. The normalized results were statistically averaged under the same category. The source profiles of the PAHs for the four types of sources were established and are shown in Table 2.
The predominate PAHs in the PM2.5 emitted from biomass open burning were BaA, IcP, Flt, and Pyr. The five PAHs that, on average, contributed a percentage over 10% of the ΣPAHs in the PM2.5 from household biofuel burning were IcP, BaA, Flt, Pyr, and BbF. For household coal burning, Flt, Pyr, IcP, and BaA had the highest concentrations in the PM2.5 samples, while for the coal-fired boiler with a high combustion efficiency, five PAHs, namely BaA, Phe, Flt, BkF, and Pyr, all contributed more than 10% to the ΣPAHs and together accounted for close to 80% of the ΣPAHs. Of these, Phe contributed approximately 20%, significantly higher than its contribution in the other sources (4.1–7.3%).
The similarities between the profiles of the PAHs for four types of sources were evaluated by applying the coefficient of divergence (CD). The CD is a self-normalizing parameter to measure the spread of the data points from the two databases and is calculated as follows:
C D j k = 1 p i = 1 p ( x i j x i k x i j + x i k ) 2
where j and k represent the two types of source profiles, p is the number of PAH species, and xij and xik represent the average percent of PAH species i for sources of j and k [52,53,54]. If the CD value approaches zero, the two profiles are similar. If its value approaches one, those two are very different.
The calculated CD values between coal-fired boilers and other sources are all over 0.6, which indicates a strong difference in the profiles of the PAHs. Its values for household coal combustion vs. biofuel burning and biomass open burning are 0.36 and 0.38, respectively, which also shows a large difference. As expected, the CD value for biomass open burning vs. household biofuel burning is about 0.3, showing similarity to a certain extent.
To further identify the indicatory PAHs among these four categories of sources, the following equation was introduced:
R a t i o j i = x i j ( x i ) min
where xij is the ith individual PAH percent in the j source; and (xi)min is the minimum of four types of sources. A higher value of Ratioji means that the percent of the ith PAH from source j is higher than those of other sources and could be recognized as an indicatory PAH [46,55].
Nap was excluded from the calculation as suggested by Yang et al. [46,55] and Kong et al. [54]. Based on the calculation of Equation (6), the indicatory PAH species from biomass open burning, household biofuel burning, household coal combustion, and coal-fired boiler are (IcP, Chr), (Acy, Flu), (BghiP, Flt), and (Phe, BkF), respectively. This information is the first step for the source appointment of the PAHs’ contribution to the atmosphere, aquatic sediment, and soil.
It is worthy to note that some PAH profiles reported in the previous literature covered PAHs in both the gas and particulate phase; however, some included PAHs only in the particulate phase. In some cases, those data can be converted to each other if the percent of the particulate phase in both phases are known [23]. In this study, only the particulate phase PAHs profiles were obtained, which can be useful for source apportionment for atmospheric particulate bound PAHs or PAHs in the sediment and soil.
The PAH distributions by the number of benzene rings are presented in Figure 2. The lower molecular weight (LMW, two and three rings) of PAHs contributes only 5.5–10.5% to the ΣPAHs from biomass open burning and household coal/biofuel burning, while it contributes considerably (27.3%) to PM2.5 samples from coal-fired boilers. The middle molecular weight (MMW, four rings) of PAHs accounts for about 50% of the ΣPAHs for four different types of sources. The higher molecular weight (HMW, five and six rings) of PAHs contributes 43.3–56.2% to the ΣPAHs from biomass open burning and household coal/biofuel burning, much higher than those values (25.1%) for coal-fired boilers. The difference in LMW and HMW content between coal-fired boilers with other sources is related to the differences in combustion temperature and combustion efficiency. With respect to the impact on human health, carcinogenic PAHs are mostly associated with higher molecular weight, while the PAHs with a lower molecular weight are generally categorized as low or non-carcinogenic compounds [40]. The difference in the content of the LMW and HMW of the PAHs for various sources indicated the variation in PAH toxicity among the emission sources, which will be further discussed in next section.

3.3. Health Risk Assessment

Based on the method mentioned in Section 2.4, the EFBaPeq is calculated and given in Table 2. The highest EFBaPeq for household coal burning is 6.8 mg/kg fuel burned; followed by biofuel household burning and biomass open burning, in the range of 1.6–4.2 mg/kg; EFBaPeq is the lowest for coal-fired boilers and its value is as low as 0.0006 mg/kg, which is three to four orders of magnitude lower than that of aforementioned three types of sources. EFBaPeq orders for various sources generally agree with those of PAH EFs. Overall, the HMW of PAHs contributes about 90% of EFBaPeq and two species with high TEF values, i.e., BaP and DBA, contribute about 80%. Our EFBaPeq values for biofuel burning are generally higher than that reported by Shen et al. [10] in a laboratory study (0.19–3.14 mg/kg); however, our data for the burning of a bituminous coal chunk are much lower than that obtained by Shen et al. (52.0 ± 73.2 mg/kg). EFBaPeq is associated with the amount of PM emitted due to the combustion of unit mass fuel. We further propose a concept to characterize the toxicity of the particulate matter itself, i.e., BaPeq unit PM emission (mg/kg), which is defined as a BaP equivalent quantity per unit mass of PM emitted. BaPeq unit PM emission is calculated as follows:
BaP eq   unit   PM   emission   =   E F i × T E F i E F P M 2.5
The calculated values for biomass open burning, household biofuel burning, household coal burning, coal-fired power plant, and coal-fired industrial boiler are 0.28 ± 0.15, 1.1 ± 0.5, 2.0, 0.010 ± 0.011, and 0.13 ± 0.10 mg/kg, respectively. The highest values are for household coal burning, followed by household biofuel burning and biomass open burning, then coal-fired industrial boiler, and the lowest values are for coal-fired power plant. The data for the first three types of sources are much greater than that for coal-fired boilers, which indicates that the PM from the first three types of sources is more toxic than coal-fired boilers.

4. Conclusions

The investigation of PAH emissions from four typical combustion sources in China were conducted on-site. The PAH EFs for those sources were quantified and followed the following order: household coal burning (24.5 mg/kg), household biofuel burning (10.5–13.9 mg/kg), biomass open burning (8.1–8.6 mg/kg), and coal-fired boilers (0.021–0.31 mg/kg). The results were compared with those values in the literature. The source profiles of the PAHs for the four sources were established. The HMW of PAHs contributed 43.3–56.2% to the ΣPAHs from biomass open burning and household coal/biofuel burning, much higher than those values (25.1%) for coal-fired boilers. EFBaPeq for four sources were also estimated and followed the following order: household coal burning (6.81 mg/kg), household biofuel burning (2.94–4.22 mg/kg), biomass open burning (1.59–3.62 mg/kg), and coal-fired boilers (0.0006–0.042 mg/kg). The BaPeq unit PM emission was proposed to characterize the toxicity of the particulate matter itself and indicated that the PM emitted from a coal-fired boiler is less toxic than the other three sources.

Supplementary Materials

The following are available online at https://www.mdpi.com/article/10.3390/atmos12091129/s1, Table S1: Description of combustion sources; Table S2: Proximate analysis and ultimate analysis for the tested biomass and fuel; Table S3: Summary of emission factors of PAHs (mg/kg fuel burned) from various combustion sources in the literatures.

Author Contributions

X.L. designed the experiments, analyzed the data, and wrote the manuscript, Z.W. and T.G. conducted the experiment, collected and analyzed the samples, and analyzed the data. All authors have read and agreed to the published version of the manuscript.

Funding

This work was supported National Natural Science Foundation of China (Grant No. 41775121).

Institutional Review Board Statement

Not applicable.

Informed Consent Statement

Not applicable.

Data Availability Statement

Not applicable.

Conflicts of Interest

The authors declare no conflict of interest.

References

  1. Mastral, A.M.; Callen, M.S. A review an polycyclic aromatic hydrocarbon (PAH) emissions from energy generation. Environ. Sci. Technol. 2000, 34, 3051–3057. [Google Scholar] [CrossRef]
  2. Ravindra, K.; Sokhi, R.; Van Grieken, R. Atmospheric polycyclic aromatic hydrocarbons: Source attribution, emission factors and regulation. Atmos. Environ. 2008, 42, 2895–2921. [Google Scholar] [CrossRef] [Green Version]
  3. Zhang, Y.X.; Tao, S.; Shen, H.Z.; Ma, J.M. Inhalation exposure to ambient polycyclic aromatic hydrocarbons and lung cancer risk of Chinese population. Proc. Natl. Acad. Sci. USA 2009, 106, 21063–21067. [Google Scholar] [CrossRef] [PubMed] [Green Version]
  4. Han, J.; Liang, Y.S.; Zhao, B.; Wang, Y.; Xing, F.T.; Qin, L.B. Polycyclic aromatic hydrocarbon (PAHs) geographical distribution in China and their source, risk assessment analysis. Environ. Pollut. 2019, 251, 312–327. [Google Scholar] [CrossRef]
  5. Kim, K.H.; Jahan, S.A.; Kabir, E.; Brown, R.J.C. A review of airborne polycyclic aromatic hydrocarbons (PAHs) and their human health effects. Environ. Int. 2013, 60, 71–80. [Google Scholar] [CrossRef]
  6. Shen, H.Z.; Huang, Y.; Wang, R.; Zhu, D.; Li, W.; Shen, G.F.; Wang, B.; Zhang, Y.Y.; Chen, Y.C.; Lu, Y.; et al. Global Atmospheric Emissions of Polycyclic Aromatic Hydrocarbons from 1960 to 2008 and Future Predictions. Environ. Sci. Technol. 2013, 47, 6415–6424. [Google Scholar] [CrossRef] [Green Version]
  7. Xu, S.S.; Liu, W.X.; Tao, S. Emission of polycyclic aromatic hydrocarbons in China. Environ. Sci. Technol. 2006, 40, 702–708. [Google Scholar] [CrossRef] [PubMed]
  8. Zhang, Y.; Lin, Y.; Cai, J.; Liu, Y.; Hong, L.; Qin, M.; Zhao, Y.; Ma, J.; Wang, X.; Zhu, T.; et al. Atmospheric PAHs in North China: Spatial distribution and sources. Sci. Total Environ. 2016, 565, 994–1000. [Google Scholar] [CrossRef]
  9. Li, M.; Liu, H.; Geng, G.; Hong, C.; Liu, F.; Song, Y.; Tong, D.; Zheng, B.; Cui, H.; Man, H.; et al. Anthropogenic emission inventories in China: A review. Natl. Sci. Rev. 2017, 4, 834–866. [Google Scholar] [CrossRef]
  10. Shen, G.F.; Tao, S.; Chen, Y.C.; Zhang, Y.Y.; Wei, S.Y.; Xue, M.; Wang, B.; Wang, R.; Lu, Y.; Li, W.; et al. Emission Characteristics for Polycyclic Aromatic Hydrocarbons from Solid Fuels Burned in Domestic Stoves in Rural China. Environ. Sci. Technol. 2013, 47, 14485–14494. [Google Scholar] [CrossRef]
  11. Chen, Y.J.; Sheng, G.Y.; Bi, X.H.; Feng, Y.L.; Mai, B.X.; Fu, J.M. Emission factors for carbonaceous particles and polycyclic aromatic hydrocarbons from residential coal combustion in China. Environ. Sci. Technol. 2005, 39, 1861–1867. [Google Scholar] [CrossRef] [PubMed]
  12. Chen, Y.J.; Zhi, G.R.; Feng, Y.L.; Tian, C.G.; Bi, X.H.; Li, J.; Zhang, G. Increase in polycyclic aromatic hydrocarbon (PAH) emissions due to briquetting: A challenge to the coal briquetting policy. Environ. Pollut. 2015, 204, 58–63. [Google Scholar] [CrossRef] [PubMed]
  13. Shen, G.F.; Chen, Y.C.; Xue, C.Y.; Lin, N.; Huang, Y.; Shen, H.Z.; Wang, Y.L.; Li, T.C.; Zhang, Y.Y.; Su, S.; et al. Pollutant Emissions from Improved Coal- and Wood-Fuelled Cookstoves in Rural Households. Environ. Sci. Technol. 2015, 49, 6590–6598. [Google Scholar] [CrossRef] [PubMed]
  14. Shen, G.F.; Tao, S.; Wei, S.Y.; Chen, Y.C.; Zhang, Y.Y.; Shen, H.Z.; Huang, Y.; Zhu, D.; Yuan, C.Y.; Wang, H.C.; et al. Field Measurement of Emission Factors of PM, EC, OC, Parent, Nitro-, and Oxy- Polycyclic Aromatic Hydrocarbons for Residential Briquette, Coal Cake, and Wood in Rural Shanxi, China. Environ. Sci. Technol. 2013, 47, 2998–3005. [Google Scholar] [CrossRef] [Green Version]
  15. Wei, S.Y.; Shen, G.F.; Zhang, Y.Y.; Xue, M.; Xie, H.; Lin, P.C.; Chen, Y.C.; Wang, X.L.; Tao, S. Field measurement on the emissions of PM, OC, EC and PAHs from indoor crop straw burning in rural China. Environ. Pollut. 2014, 184, 18–24. [Google Scholar] [CrossRef] [Green Version]
  16. Du, W.; Wang, J.Z.; Zhuo, S.J.; Zhong, Q.R.; Wang, W.; Chen, Y.C.; Wang, Z.L.; Mao, K.; Huang, Y.; Shen, G.F.; et al. Emissions of particulate PAHs from solid fuel combustion in indoor cookstoves. Sci. Total Environ. 2021, 771, 145411. [Google Scholar] [CrossRef]
  17. Sun, J.; Shen, Z.X.; Zeng, Y.L.; Niu, X.Y.; Wang, J.H.; Cao, J.J.; Gong, X.S.; Xu, H.M.; Wang, T.B.; Liu, H.X.; et al. Characterization and cytotoxicity of PAHs in PM2.5 emitted from residential solid fuel burning in the Guanzhong Plain, China. Environ. Pollut. 2018, 241, 359–368. [Google Scholar]
  18. Zhang, Y.; Shen, Z.X.; Sun, J.; Zhang, L.M.; Zhang, B.; Zou, H.J.; Zhang, T.; Ho, S.S.H.; Chang, X.J.; Xu, H.M.; et al. Parent, alkylated, oxygenated and nitrated polycyclic aromatic hydrocarbons in PM2.5 emitted from residential biomass burning and coal combustion: A novel database of 14 heating scenarios. Environ. Pollut. 2021, 268, 115881. [Google Scholar] [CrossRef]
  19. Wang, R.W.; Liu, G.J.; Sun, R.Y.; Yousaf, B.; Wang, J.Z.; Liu, R.Q.; Zhang, H. Emission characteristics for gaseous- and size-segregated particulate PAHs in coal combustion flue gas from circulating fluidized bed (CFB) boiler. Environ. Pollut. 2018, 238, 581–589. [Google Scholar] [CrossRef]
  20. Yin, X.F.; Yang, W.T.; Xue, H.M. PAHs Emission Characteristics and Assessment from the Coal Combustion Process in the Large Capacity Power Plant Boilers. In Advanced Materials Research; Trans Tech Publications Ltd.: Bäch SZ, Switzerland, 2013; Volume 726–731, pp. 1908–1916. [Google Scholar]
  21. Chen, Y.C.; Du, W.; Zhuo, S.J.; Liu, W.J.; Liu, Y.L.; Shen, G.F.; Wu, S.P.; Li, J.J.; Zhou, B.H.; Wang, G.H.; et al. Stack and fugitive emissions of major air pollutants from typical brick kilns in China. Environ. Pollut. 2017, 224, 421–429. [Google Scholar] [CrossRef] [PubMed]
  22. US EPA. Air Emissions Factors and Quantification. Available online: https://www.epa.gov/air-emissions-factors-and-quantification (accessed on 15 August 2021).
  23. Li, A.; Jang, J.K.; Scheff, P.A. Application of EPA CMB8.2 model for source apportionment of sediment PAHs in Lake Calumet, Chicago. Environ. Sci. Technol. 2003, 37, 2958–2965. [Google Scholar] [CrossRef]
  24. Hanedar, A.; Alp, K.; Kaynak, B.; Baek, J.; Avsar, E.; Odman, M.T. Concentrations and sources of PAHs at three stations in Istanbul, Turkey. Atmos. Res. 2011, 99, 391–399. [Google Scholar] [CrossRef]
  25. Gu, S.H.; Kralovec, A.C.; Christensen, E.R.; Van Camp, R.P. Source apportionment of PAHs in dated sediments from the Black River, Ohio. Water Res. 2003, 37, 2149–2161. [Google Scholar] [CrossRef]
  26. Bao, K.S.; Zaccone, C.; Tao, Y.Q.; Wang, J.; Shen, J.; Zhang, Y.F. Source apportionment of priority PAHs in 11 lake sediment cores from Songnen Plain, Northeast China. Water Res. 2020, 168, 115158. [Google Scholar] [CrossRef] [PubMed]
  27. Cattaneo, A.; Fermo, P.; Urso, P.; Grazia-Perrone, M.; Piazzalunga, A.; Tarlassi, J.; Carrer, P.; Cavallo, D.M. Particulate-bound polycyclic aromatic hydrocarbon sources and determinants in residential homes. Environ. Pollut. 2016, 218, 16–25. [Google Scholar] [CrossRef]
  28. Teixeira, E.C.; Agudelo-Castaneda, D.M.; Mattiuzi, C.D. Contribution of polycyclic aromatic hydrocarbon (PAH) sources to the urban environment: A comparison of receptor models. Sci. Total Environ. 2015, 538, 212–219. [Google Scholar] [CrossRef] [PubMed]
  29. Li, G.L.; Lang, Y.H.; Yang, W.; Peng, P.; Wang, X.M. Source contributions of PAHs and toxicity in reed wetland soils of Liaohe estuary using a CMB-TEQ method. Sci. Total Environ. 2014, 490, 199–204. [Google Scholar] [CrossRef]
  30. Li, X.G.; Wang, S.X.; Duan, L.; Hao, J.; Li, C.; Chen, Y.S.; Yang, L. Particulate and trace gas emissions from open burning of wheat straw and corn stover in China. Environ. Sci. Technol. 2007, 41, 6052–6058. [Google Scholar] [CrossRef]
  31. Li, X.H.; Wang, S.X.; Duan, L.; Hao, J.M. Characterization of non-methane hydrocarbons emitted from open burning of wheat straw and corn stover in China. Environ. Res. Lett. 2009, 4, 044015. [Google Scholar] [CrossRef]
  32. Li, X.H.; Duan, L.; Wang, S.X.; Duan, J.C.; Guo, X.M.; Yi, H.H.; Hu, J.N.; Li, C.; Hao, J.M. Emission characteristics of particulate matter from rural household biofuel combustion in China. Energy Fuels 2007, 21, 845–851. [Google Scholar] [CrossRef]
  33. Li, X.H.; Wang, S.X.; Duan, L.; Hao, J.M.; Nie, Y.F. Carbonaceous Aerosol Emissions from Household Biofuel Combustion in China. Environ. Sci. Technol. 2009, 43, 6076–6081. [Google Scholar] [CrossRef]
  34. Li, X.H.; Wang, S.X.; Duan, L.; Hao, J.M.; Long, Z.W. Design of a Compact Dilution Sampler for Stationary Combustion Sources. J. Air Waste Manag. Assoc. 2011, 61, 1124–1130. [Google Scholar] [CrossRef] [Green Version]
  35. Chen, Y.; Li, X.H.; Zhu, T.L.; Han, Y.J.; Lv, D. PM2.5-bound PAHs in three indoor and one outdoor air in Beijing: Concentration, source and health risk assessment. Sci. Total Environ. 2017, 586, 255–264. [Google Scholar] [CrossRef]
  36. Zhang, J.; Smith, K.R.; Ma, Y.; Ye, S.; Jiang, F.; Qi, W.; Liu, P.; Khalil, M.A.K.; Rasmussen, R.A.; Thorneloe, S.A. Greenhouse gases and other airborne pollutants from household stoves in China: A database for emission factors. Atmos. Environ. 2000, 34, 4537–4549. [Google Scholar] [CrossRef] [Green Version]
  37. Johnson, M.; Edwards, R.; Frenk, C.A.; Masera, O. In-field greenhouse gas emissions from cookstoves in rural Mexican households. Atmos. Environ. 2008, 42, 1206–1222. [Google Scholar] [CrossRef]
  38. Eilenberg, S.R.; Bilsback, K.R.; Johnson, M.; Kodros, J.K.; Lipsky, E.M.; Naluwagga, A.; Fedak, K.M.; Benka-Coker, M.; Reynolds, B.; Peel, J.; et al. Field measurements of solid-fuel cookstove emissions from uncontrolled cooking in China, Honduras, Uganda, and India. Atmos. Environ. 2018, 190, 116–125. [Google Scholar] [CrossRef]
  39. Weyant, C.L.; Chen, P.F.; Vaidya, A.; Li, C.L.; Zhang, Q.G.; Thompson, R.; Ellis, J.; Chen, Y.J.; Kang, S.C.; Shrestha, G.R.; et al. Emission Measurements from Traditional Biomass Cookstoves in South Asia and Tibet. Environ. Sci. Technol. 2019, 53, 3306–3314. [Google Scholar] [CrossRef] [PubMed]
  40. Nisbet, I.C.T.; LaGoy, P.K. Toxic Equivalency Factors (TEFs) for Polycyclic Aromatic Hydrocarbons (PAHs). Regul. Toxicol. Pharmacol. 1992, 16, 290–300. [Google Scholar] [CrossRef]
  41. Jenkins, B.M.; Jones, A.D.; Turn, S.Q.; Williams, R.B. Emission Factors for Polycyclic Aromatic Hydrocarbons from Biomass Burning. Environ. Sci. Technol. 1996, 30, 2462–2469. [Google Scholar] [CrossRef]
  42. Hays, M.D.; Fine, P.M.; Geron, C.D.; Kleeman, M.J.; Gullett, B.K. Open burning of agricultural biomass: Physical and chemical properties of particle-phase emissions. Atmos. Environ. 2005, 39, 6747–6764. [Google Scholar] [CrossRef]
  43. Wiriya, W.; Chantara, S.; Sillapapiromsuk, S.; Lin, N.H. Emission Profiles of PM10-Bound Polycyclic Aromatic Hydrocarbons from Biomass Burning Determined in Chamber for Assessment of Air Pollutants from Open Burning. Aerosol Air Qual. Res. 2016, 16, 2716–2727. [Google Scholar] [CrossRef] [Green Version]
  44. Oanh, N.T.K.; Ly, B.T.; Tipayarom, D.; Manandhar, B.R.; Prapat, P.; Simpson, C.D.; Liu, L.J.S. Characterization of particulate matter emission from open burning of rice straw. Atmos. Environ. 2011, 45, 493–502. [Google Scholar] [CrossRef] [PubMed] [Green Version]
  45. Hsu, W.T.; Liu, M.C.; Hung, P.C.; Chang, S.H.; Chang, M.B. PAH emissions from coal combustion and waste incineration. J. Hazard. Mater. 2016, 318, 32–40. [Google Scholar] [CrossRef] [PubMed]
  46. Yang, H.H.; Lee, W.J.; Chen, S.J.; Lai, S.O. PAH emission from various industrial stacks. J. Hazard. Mater. 1998, 60, 159–174. [Google Scholar] [CrossRef]
  47. Lu, C.M.; Dat, N.D.; Lien, C.K.; Chi, K.H.; Chang, M.B. Characteristics of Fine Particulate Matter and Polycyclic Aromatic Hydrocarbons Emitted from Coal Combustion Processes. Energy Fuels 2019, 33, 10247–10254. [Google Scholar] [CrossRef]
  48. Kim Oanh, N.T.; Bætz Reutergårdh, L.; Dung, N.T. Emission of Polycyclic Aromatic Hydrocarbons and Particulate Matter from Domestic Combustion of Selected Fuels. Environ. Sci. Technol. 1999, 33, 2703–2709. [Google Scholar] [CrossRef]
  49. Venkataraman, C.; Negi, G.; Sardar, S.B.; Rastogi, R. Size distributions of polycyclic aromatic hydrocarbons in aerosol emissions from biofuel combustion. J. Aerosol Sci. 2002, 33, 503–518. [Google Scholar] [CrossRef]
  50. Shen, G.F.; Wang, W.; Yang, Y.F.; Ding, J.N.; Xue, M.A.; Min, Y.J.; Zhu, C.; Shen, H.Z.; Li, W.; Wang, B.; et al. Emissions of PAHs from Indoor Crop Residue Burning in a Typical Rural Stove: Emission Factors, Size Distributions, and Gas-Particle Partitioning. Environ. Sci. Technol. 2011, 45, 1206–1212. [Google Scholar] [CrossRef] [Green Version]
  51. Roden, C.A.; Bond, T.C.; Conway, S.; Pinel, A.B.S.; MacCarty, N.; Still, D. Laboratory and field investigations of particulate and carbon monoxide emissions from traditional and improved cookstoves. Atmos. Environ. 2009, 43, 1170–1181. [Google Scholar] [CrossRef]
  52. Wongphatarakul, V.; Friedlander, S.K.; Pinto, J.P.A. Comparative study of PM2.5 ambient aerosol chemical databases. Environ. Sci. Technol. 1998, 32, 3926–3934. [Google Scholar] [CrossRef]
  53. Zhang, Z.; Friedlander, S.K. A Comparative Study of Chemical Databases for Fine Particle Chinese Aerosols. Environ. Sci. Technol. 2000, 34, 4687–4694. [Google Scholar] [CrossRef]
  54. Kong, S.; Ji, Y.; Li, Z.; Lu, B.; Bai, Z. Emission and profile characteristic of polycyclic aromatic hydrocarbons in PM2.5 and PM10 from stationary sources based on dilution sampling. Atmos. Environ. 2013, 77, 155–165. [Google Scholar] [CrossRef]
  55. Yang, H.H.; Lai, S.O.; Hsieh, L.T.; Hsueh, H.J.; Chi, T.W. Profiles of PAH emission from steel and iron industries. Chemosphere 2002, 48, 1061–1074. [Google Scholar] [CrossRef]
Figure 1. Schematic diagram of the dilution sampling system.
Atmosphere 12 01129 g001
Figure 2. Distribution characteristics of PAH rings.
Atmosphere 12 01129 g002
Table 1. Emission factors of PM2.5-bound PAHs (mg/kg fuel burned) and PM2.5 (g/kg fuel burned) from various combustion sources.
PAHsOpen BurningHousehold Biofuel CombustionHousehold
Coal Burning
Coal-Fired Industrial
Boiler (4 t/h)
Coal-Fired Industrial
Boiler (20 t/h)
Coal-Fired Power PlantCoal-Fired Power Plant
Outlet of ESPOutlet of WFGD
Wheat StrawMaize StoverWheat StrawMaize StoverWoodBituminous CoalBituminous CoalBituminous CoalBituminous CoalBituminous
Coal
Nap0.097 ± 0.032 a0.11 ± 0.040.099 ± 0.0060.18 ± 0.110.12 ± 0.050.12 b0.013 b0.0016 b0.0034 b0.0020 b
Ace0.12 ± 0.040.040 ± 0.0690.11 ± 0.010.15 ± 0.040.077 ± 0.0680.15 0.016 ND ND ND
AcyND cNDND0.016 ± 0.028NDND ND ND NDND
FluND0.089 ± 0.1550.12 ± 0.110.064 ± 0.1100.057 ± 0.098ND NDND ND ND
Phe0.37 ± 0.090.48 ± 0.211.1 ± 0.51.2 ± 0.60.50 ± 0.140.99 0.041 0.0057 0.0089 0.0053
Ant0.011 ± 0.0190.027 ± 0.0460.093 ± 0.0720.099 ± 0.0940.017 ± 0.0290.10 ND ND ND ND
Flt0.80 ± 0.320.58 ± 0.152.2 ± 0.72.0 ± 0.30.86 ± 0.464.7 0.039 0.0089 0.0067 0.0033
Pyr0.79 ± 0.310.56 ± 0.161.8 ± 0.61.7 ± 0.20.71 ± 0.374.2 0.028 0.0064 0.0050 0.0022
BaA1.7 ± 0.41.9 ± 0.41.6 ± 0.21.7 ± 0.41.6 ± 0.32.6 0.14 0.017 ND0.0015
Chr0.62 ± 0.140.69 ± 0.130.87 ± 0.330.82 ± 0.130.62 ± 0.211.0 ND ND ND ND
BbF0.22 ± 0.120.56 ± 0.751.2 ± 0.021.2 ± 0.41.3 ± 0.42.1 ND 0.015 ND 0.0014
BkF0.49 ± 0.110.38 ± 0.060.82 ± 0.280.68 ± 0.250.74 ± 0.211.2 0.031 0.0038 0.0061 0.0031
BaP0.64 ± 0.160.57 ± 0.100.79 ± 0.310.64 ± 0.220.76 ± 0.231.6 ND 0.0032 ND ND
DBA0.11 ± 0.190.52 ± 0.160.38 ± 0.110.35 ± 0.120.58 ± 0.380.85 0.0049 ND ND ND
IcP1.6 ± 0.41.7 ± 0.51.9 ± 0.41.7 ± 0.51.8 ± 0.63.1 ND ND NDND
BghiP0.43 ± 0.090.32 ± 0.070.80 ± 0.290.62 ± 0.220.72 ± 0.181.7 ND ND ND 0.0025
ΣPAHs d8.0 ± 1.88.5 ± 1.814 ± 413 ± 210 ± 224 0.31 0.062 0.030 0.021
ΣBaPeq1.6 ± 1.03.6 ± 0.63.3 ± 0.82.9 ± 1.04.2±2.06.8 0.042 0.0068 0.00064 0.00063
PM2.57.6 ± 4.112 ± 1.03.2 ± 0.34.5 ± 1.02.7 ± 0.43.40.210.120.260.035
a The results are given as average emission factor and standard deviation. b Single measurement results or combined analysis of several sampling filters, c Not detected or less than background level. d Sum of emission factor of 16 PAHs.
Table 2. Source profiles of PAHs for four types of sources. The data are present mass to ΣPAHs (%).
SpeciesBiomass Open
Burning
Household Biofuel
Burning
Household Coal CombustionCoal-Fired
Boiler
MeanSDMeanSDValueMeanSD
Nap1.27 0.33 1.07 0.56 0.49 6.76 4.05
Ace0.96 0.82 0.95 0.48 0.59 1.25 2.50
Acy0.00 0.00 0.04 0.12 0.00 0.00 0.00
Flu0.45 1.09 0.67 0.85 0.00 0.00 0.00
Phe5.04 0.98 7.28 3.23 4.06 19.28 9.58
Ant0.20 0.33 0.50 0.50 0.40 0.00 0.00
Flt8.36 2.37 12.91 4.20 18.99 16.21 4.22
Pyr8.16 2.38 10.79 3.61 17.11 11.65 3.39
BaA22.05 3.32 13.54 2.13 10.78 19.71 20.12
Chr7.97 0.46 6.09 0.86 4.25 0.00 0.00
BbF4.26 4.93 10.27 2.98 8.61 7.76 11.64
BkF5.39 1.10 5.99 1.18 5.04 12.74 6.11
BaP7.40 0.96 5.85 1.37 6.63 1.28 2.56
DBA3.89 3.93 3.61 2.05 3.46 0.40 0.79
IcP19.98 3.83 14.67 3.76 12.66 0.00 0.00
BghiP4.64 1.06 5.78 1.30 6.92 2.95 5.91
Publisher’s Note: MDPI stays neutral with regard to jurisdictional claims in published maps and institutional affiliations.

