Abstract
To determine the size distribution and source identification of PM-bound heavy metals in roadside environments, four different particle size (<0.2 μm, 0.2–0.5 μm, 0.5–1.0 μm and 1.0–2.5 μm) samples were collected and analyzed from four different types of roads during the summer of 2015 in Tianjin. The results showed that the concentrations of PM-bound heavy metal from the roadside environment sampling sites were 597 ± 251 ng/m3 (BD), 546 ± 316 ng/m3 (FK), 518 ± 310 ng/m3 (JY) and 640 ± 237 ng/m3 (WH). There were differences in the concentrations of the heavy metal elements in the four different particle size fractions. The concentrations of Cu, Zn, Cd, Sn and Pb were the highest in the larger particle size fraction (0.5–2.5 μm). Cd, Cu, Zn and Pb were the elements that indicated emissions from tire wear and brake pad wear. The concentrations of Cr, Co and Ni were the highest in the smallest particle size fraction (<0.5 μm), indicating that motor vehicle exhaust was their main source. The correlation analysis results showed that there are differences in the concentration, distribution and correlation of different PM-bound heavy metals in different particle size fractions. The PCA results show that the accumulative interpretation variances of PM0.2, PM0.2–0.5, PM0.5–1.0 and PM1.0–2.5 reached 80.29%, 79.56%, 79.57% and 71.42%, respectively. Vehicle exhaust was the primary source of PM-bound heavy metal collected from the roadside sampling sites, while brake pad wear and tire wear were the second most common sources of the heavy metal.
1. Introduction
Serious air pollution and smog are frequently observed in the Beijing-Tianjin-Hebei region. According to the latest source apportionment results released by the Ministry of Ecology and Environment (MEE), traffic emissions, industrial manufacturing, coal combustion and dust are the main sources of particulate matter (PM) in the ambient air of most cities in China. Among these sources, traffic has become the primary source of air pollution in Beijing, Guangzhou and Shenzhen. The contribution of traffic emissions to urban atmospheric environmental particulate matter is 45% in Beijing, 29.2% in Shanghai, 16.3% in Guangzhou and 20% in Tianjin [1]. As industrial pollution sources gradually migrate to the suburbs, the contribution of traffic emissions in the central urban areas becomes higher in some large and medium-sized cities. This study focuses on the emission characteristics of PM-bound heavy metals in the road environment, which have been significantly contributed to by traffic emissions in city.
Some researchers are studying vehicle emission factors and compiling an emissions inventory [2,3,4,5,6]. At the same time, a small number of researchers have studied the size-resolved distribution and the source identification of PM-bound heavy metals. Size-resolved distribution is one of the basic parameters used to characterize particulate matter and can be used to characterize the migration and deposition of particulate matter [7]. Domestic and foreign researchers have studied the size-resolved distribution of heavy metals in particles from traffic sources. Mery Malandrino [8] carried out an ambient aerosol sampling to determine the characteristics of metals in different size fractions, which were collected from the center of the city of Turin in 2011. The results showed that elements such as As, Co, Pb and V were mainly associated with fine particles (PM2.5), while Fe, Mn, Mo, Cd, Cr, Cu and Sn were mainly associated with coarse particles (PM10). Cheng Yan et al. [9] collected PM10 and PM2.5 samples from roadsides in Hong Kong in 2004, and the distinct differences between the chemical characteristics and sources of the PM2.5 and PM2.5–10 samples were investigated. These studies were both focused on the PM-bound heavy metal in PM2.5 and PM10 from traffic emissions, and there were few related studies on particle sizes smaller than PM2.5.
As motor vehicle emission standards become more stringent, basic data of particulate matter caused by traffic sources should be updated. In order to fill the data gap on the elemental composition and size-resolved distribution of particulate matter in the roadside environment in Tianjin, a DGI high-flow particle sampler was used to collect samples containing different sized particles from typical roads, including secondary road, major road, expressway and outer ring road. Ten kinds of heavy metal elements (Cr, Mn, Co, Ni, Cu, Zn, Cd, Sn, Sb and Pb) were analyzed by the ICP-MS. The main objectives were as follows: (1) to determine the size-resolved concentration distribution of PM-bound heavy metal at road environment; (2) to assess the possible sources of the heavy metal elements; and (3) to accumulate research data on the characteristics of urban road particulate matter caused by vehicle emissions and provide a scientific basis and recommendations for the control of pollution with traffic as the source.
2. Materials and Methods
2.1. Sampling Location
Tianjin is a city located in northern China. It is an international port and an eco-city. There are 1569 roads in urban areas of Tianjin, which consist of secondary roads, major roads, urban expressways and outer ring roads. Therefore, four roads characteristic of these road types were selected as the sampling sites for monitoring particulate matter and traffic flow in Tianjin (Table 1 and Figure 1). Baidi Road (BD) was selected to represent the secondary road. Baidi Road is a one-way, two lane road, and samples were collected from a lane with traffic moving from south to north. Residential housing, a school and shops were located on the sides of Baidi Road. The three other typical roads selected for this study were one-way, four lane roads. Fukang Road (FK) was selected to represent the major road. Jianyang Road (JY) was selected to represent the urban expressway. The samples were collected from a lane of Jianyang Road with traffic moving from south to north. Waihuan Road (WH) is an outer ring road, and samples were collected from a lane with traffic moving from southeast to northwest. There were no tall buildings on the sides of the outer ring road. A blank site (BL) was set on the top floor of the Tianjin Eco-environmental Testing Center during the sampling period. During the sampling period, the meteorological parameters (i.e., temperature, relative humidity, wind speed, wind direction) were measured hourly by the automatic weather station, which were shown in Table S1. The daily average temperature varied between 26 °C to 31 °C and the average relative humidity varied between 53% to 71%. The predominant wind direction was south-west wind (BD), north-east wind (FK), south-west wind (JY) and south wind (WH). The sampling site on the four roads were all in the downwind direction of vehicle emissions, which can ensure that the sampling results were more realistic.

Table 1.
Traffic flow data of sampled sites.
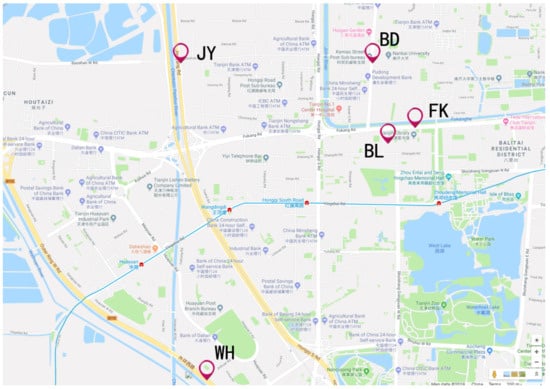
Figure 1.
Location of sampling sites.
The vehicle types of the four roads are shown in Table 1. It was found that gasoline vehicles were the main type on the four roads, accounting for 95.13–99.46%. During the sampling period, there were almost no heavy-duty diesel vehicles driving on the secondary road and major road. The number of diesel vehicles on urban expressway and outer ring road was relatively large, accounting for 3.84% and 4.87%, respectively.
2.2. Sampling and Analysis
The sampling instruments were situated 2 m away from the closest traffic lane and 1.5 m above the ground. The particulate matter was collected continuously from the four sampling sites between 7:00 and 23:00 from Thursday to Sunday during July in 2015. A DGI multi-stage collision type particle sampler (Model 1570, Dekati, Kangasala, Finland) was used to collect the particulate matter [10]. The flow rate of the DGI sampler is 70 L/min. During flow calibration, we connected the flow calibration instrument to the DGI sampling inlet. After the instrument is stable, the flow calibration instrument was used to measure and repeat the measurement 3 times to ensure that the error is within ±2%. The DGI sampler was evaluated pre and post-sampling to ensure the consistency of sampling flow rate. The DGI sampler was used at each stage of the DGI sampler to collect four fractions containing particles with sizes of <0.2 μm (size fraction I), 0.2–0.5 μm (size fraction II), 0.5–1.0 μm (size fraction III) and 1.0–2.5 μm (size fraction IV). A Teflon filter was used for sampling (47 mm, pore size of 5 μm, Millipore Corp., Saint Louis, USA). The samples obtained by the Teflon filter were used to determine the particulate matter mass and to analyze the heavy metal elements. Microwave digestion instrument (MDS-6G, Sineo, Shanghai, China) was used to process samples The Teflon filter. Inductively coupled plasma mass spectrometry (ICP-MS, Agilent 7500A, Agilent, Santa Clara, USA) was used for the elemental analysis, in which thirteen heavy metal elements present in the filters were analyzed and included Ti, Cr, Mn, Co, Ni, Cu, Zn, Cd, Sn, Sb and Pb. The methods used for sample pretreatment and analysis of the heavy metal elements are detailed in the literature [11].
2.3. Evaluation Model
2.3.1. Enrichment Factor (EF)
The enrichment factor of heavy metals can be used to evaluate the extent to which the concentration of heavy metals exceeds that of the background and to determine whether the pollution is caused by natural and anthropogenic sources [12,13,14]. The formula used to calculate the EF is as follows:
where Cn and Cref were the concentrations of the target element and the reference element in the sample (PM) and the upper continental crust (UCC), respectively. Ti and Si were typically used as reference elements [15]. In this study, Ti was selected as the reference element and the average element concentrations of UCC were obtained from Wei’s report [16]. The EF value was interpreted using the categorization shown in Table 2.
Table 2.
Enrichment factor (EF) categorization.
2.3.2. Principal Component Analysis (PCA)
Principal Component Analysis (PCA) is a kind of factor analysis that simplifies the reduction of data from complex relationships between variables [17,18,19]. There is a strong correlation between the chemical components of particulate matter originating from the same source of pollution. The goal of PCA is based on the interrelationship between different chemical components in the particle. The number of factors is screened and quantified among the many variables, and the load of each factor is calculated. These factors can be used to explain the majority of the changes in the analyzed elements from a large number of samples. Furthermore, the pollution sources that contribute to the chemical composition of the particulate matter are identified and analyzed. The PCA method was used to determine the source of the heavy metals in the particulate matter samples (which includes fractions I, II, III and IV) that were collected from the various roadside environments during the sampling period. First, the data obtained for each component of the PM were Z-score normalized using the conversion formula. Then, the metal components were described by several main factors using the maximum rotation method of variance, and the characteristic values of each factor were extracted. The higher the load value of the factor, the greater the representativeness.
2.4. Quality Assurance and Control
The filter used in the experiment was equilibrated in a constant temperature and humidity balance chamber for 48 h. When the filter was weighed, an electrostatic removal device was used to avoid interference. The analysis of a blank sample, a standard sample and a duplicate sample were required after every 10 samples for the elemental detection and analysis. All the glass vessels were soaked in dilute nitric acid for 24 h and rinsed with Milli-Q water. The relative standard deviation (RSD) of the data obtained for the duplicate samples is <5.6%. The regression coefficient of the calibration curves obtained for the various heavy metals is >0.999. The data were analyzed and processed using the statistical analysis software EXCEL 2019 (Microsoft Corporation) and SPSS 22.0 (IBM Corporation).
3. Results and Discussion
3.1. Concentrations of PM-Bound Heavy Metals
The concentrations of the PM-bound heavy metal in the samples collected from the four road environments in Tianjin are shown in Figure 2. The 10 elements evaluated in this study were all trace heavy metal elements. The total concentrations of these 10 heavy metal elements in the PM2.5 samples collected from the BD, FK, JY and WH sites were 597 ± 251 ng/m3, 546 ± 316 ng/m3, 518 ± 310 ng/m3 and 640 ± 237 ng/m3, respectively. The ratios of the heavy metal element concentrations compared to the PM2.5 concentration in the samples collected from each sampling site were 0.30% (BD), 0.35% (FK), 0.30% (JY) and 0.33% (WH). Overall, the concentrations of Zn and Mn were the highest, and the concentrations of Co, Cd, Sn and Sb were the lowest. The concentrations of the elements found in the samples collected from each sampling site were different. The higher concentrations of Zn, Pb, Cu and Sb found in the samples collected from the secondary road (BD) may be caused by the longer congestion time (low vehicle speed and multiple traffic lights), which indicated that the secondary roadside environment was more susceptible to pollution from motor vehicle emissions.
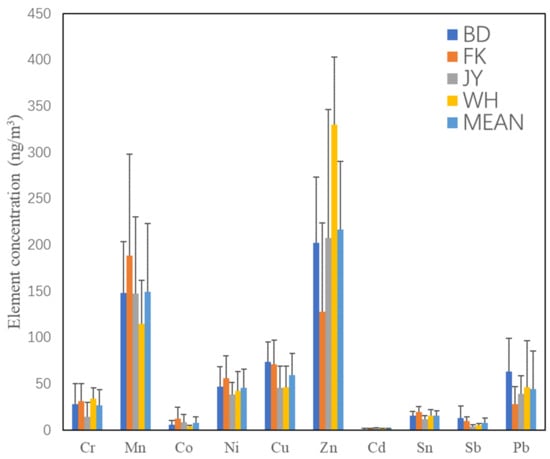
Figure 2.
Concentrations of the heavy metal elements measured in the samples collected at the four road environment sampling sites in Tianjin.
Table 3 showed the comparison of the amounts of some elements found in the PM2.5 samples collected in this study to that of those collected in other regions. The mass concentrations of Zn, Pb, Sb and Sn obtained in this study were lower than those measured in Beijing [20], Hong Kong [9], Macao [21] and Kolkata [22]. The samples obtained in this study were collected after new motor vehicle standards (China V) and fuel quality requirements (China V) were implemented in Tianjin, indicating that the implementation and improvement of the vehicle standards and fuel quality requirements had a greater impact on vehicle emissions. In addition, the mass concentrations of Mn and Ni obtained in this study were higher than those measured in Beijing, Hong Kong and Macao, indicating that these elements were affected by motor vehicle emissions and other anthropogenic pollution sources.
Table 3.
Concentration of heavy metal elements in the PM2.5 samples obtained from different regions (ng/m3).
3.2. Size-Resolved Concentration of Heavy Metal Elements
The size-resolved concentration of heavy metal elements, obtained from the four roadside environment sampling sites, were shown in Figure 3. There were differences in the concentration of most heavy metal elements for the various size fractions. The concentrations of Cu, Zn, Cd, Sn and Pb were the highest in size fraction III (0.5–1.0 μm) and size fraction IV (1.0–2.5 μm). Cd, Cu, Zn and Pb were the elements that indicate emissions from tire wear. Cu, Pb and Zn were the elements that indicate emissions from brake pad wear. The concentrations of these elements were the highest in the larger particle size fractions. In addition, Sb was usually added to brake pads in the form of Sb2S3, which could account for 5–7% [23,24]. In this study, Sb was present in size fraction II (0.2–0.5 μm) and size fraction III (0.5–1.0 μm). The concentrations of Cr, Co and Ni were the highest in size fraction I (<0.2 μm) and size fraction II (0.2–0.5 μm), indicating that the main source of Cr, Co and Ni was motor vehicle exhaust. Due to the differences in the sampling device parameters and the material and loading effect of the sampling membrane, the particle size distribution may vary in different research studies. Therefore, it was difficult to compare the results obtained using different particle size distribution studies. Overall, the size-resolved concentrations of heavy metal elements measured in this study were similar to those measured in Beijing [25].
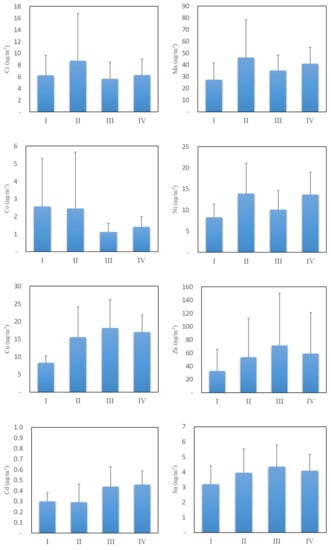
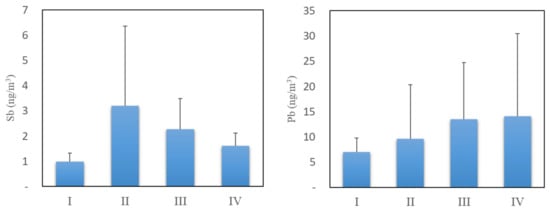
Figure 3.
Size-resolved concentration of heavy metal elements in particulate matter.
3.3. Source Identification of Heavy Metal Elements
3.3.1. Enrichment Factor
Enrichment factor (EF) is used to determine whether the element is affected by the anthropogenic source. The EFs of heavy metal elements in the particulate matter in the typical road environment are shown in Figure 4. The results show that EFs of Cr and Mn are less than 10, which was almost no enrichment in the roadside environment. The Mn element is less polluted in the roadside and the anthropogenic source is not the dominant factor.
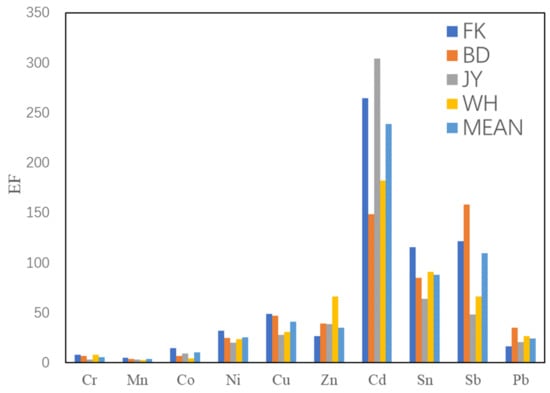
Figure 4.
Enrichment factors of metals in PM2.5 at roadside.
The EF values higher than 10 (Co, Cd, Cu, Ni, Pb, Sn, Sb and Zn) are highly enriched in the roadside environment, which are obviously related to the emission of anthropogenic pollution sources. Cd, Cu and Pb are positively correlated with vehicle exhaust emissions. Sb and Sn are mainly found in brake pads [26,27]. Zn is the main component of catalyst for the rubber tire manufacturing process [28].
3.3.2. PCA
The PCA factors were identified using the maximum variance rotation, and the resulting factor load matrix was shown in Table 4. A factor score of 0.5 was usually selected as the lowest significance level. The results showed that the accumulative interpretation variances of the four size fractions, PM0.2, PM0.2–0.5, PM0.5–1.0 and PM1.0–2.5, reached 80.29%, 79.56%, 79.57% and 71.42%, respectively, which better preserved the information of the original data.
Table 4.
Maximum variance rotation factor analysis of PM.
In PM0.2 and PM1.0–2.5, the initial interpretation variances of factor 1 were 55.01% and 50.99%, respectively. Cr, Co, Ni, Cu, Sn and Sb were found to have the highest loading coefficients. Accordingly, the presence of Ni, Cr and Co could be caused by the combustion of fossil fuels and transportation [29,30,31]. In addition, Zn, Sb, Sn, Cd and Mn were characteristic of non-exhaust emissions [32,33]. Sb was mainly from brake pad wear in motor vehicles. Therefore, the factor 1 of PM0.2 and PM1.0–2.5 could be interpreted as vehicle exhaust (VE) and brake pad wear sources (BW). The loading factor of Zn, Cd and Pb in factor 2 was higher in PM0.2 and PM1.0–2.5. Zn, Cu and Cd were often indicators of pollution caused by vehicle tires wear [34,35,36]. Because of the increased use of unleaded gasoline, vehicle exhaust was no longer the main source of Pb. Pb might be mainly originating from the vehicle mechanical wear (such as tire wear). Therefore, the factor 2 of PM0.2 and PM1.0–2.5 could be interpreted as the tire wear source (TW).
In PM0.2–0.5 and PM0.5–1.0, the PCA results were different from other particle sizes. These factors included about 79.56% (PM0.2–0.5) and 79.57% (PM0.5–1.0) of total variance. Factor 1 was related to Cr, Mn, Co and Ni included 43.44% (PM0.2–0.5) and 36.85% (PM0.5–1.0) of total variance, indicating the main source of vehicle exhaust (VE). Factor 2 was related to brake pad wear (BW) in these size fractions, which could be one of the main sources of metals such as Cu, Zn, Sb and Sn. Factor 3 was related to Zn, Cd and Pb which could be caused by tire wear (TW). Therefore, it could be seen that vehicle exhaust (VE), brake pad wear (BW) and tire wear (TW) were regarded as the three main sources of particulate matter at roadside environments.
4. Conclusions
The concentration of heavy metal elements in the PM samples collected from four roadside environment sampling sites, BD, FK, JY and WH, were 597 ± 251 ng/m3, 546 ± 316 ng/m3, 518 ± 310 ng/m3 and 640 ± 237 ng/m3, respectively. The concentrations of heavy metal elements found in the samples collected from various roads were different. Cd, Cu, Zn and Pb were the elements that indicated emissions from tire wear, and Cu, Pb and Zn were the elements that indicated emissions from brake pad wear. The concentrations of these elements were the highest in the larger particle size fractions. Based on the source identification results, there were differences in the analysis results obtained for particles with different particle sizes. PCA revealed the various source of heavy metals including vehicle exhaust, brake pad wear and tire wear at roadside environments. Concerning the population of new energy vehicles increasing in the future, exhaust emissions will be significantly reduced. While the brake pad wear and tire wear will probably be the main source of heavy metals at roadside. Therefore, it is necessary to strengthen the research on the prevention and control of PM from non-exhaust sources of vehicles.
Supplementary Materials
The following are available online at https://www.mdpi.com/article/10.3390/atmos12091130/s1, Table S1. Meteorological parameters during sampling.
Author Contributions
Q.Z.: Conceptualization, Methodology, Writing—Original draft preparation, Writing—Review and Editing. Y.Z.: Validation. L.W.: Supervision. H.M.: Funding acquisition, Methodology, Writing—Review and Editing. All authors have read and agreed to the published version of the manuscript.
Funding
This work was supported by the Tianjin Science and Technology Plan Project (19YFZCSF00960, 20YFZCSN01000), Tianjin Education Commission Research Project (2017KJ053) and The Fundamental Research Funds for the Central University (63211075).
Institutional Review Board Statement
Not applicable.
Informed Consent Statement
Not applicable.
Data Availability Statement
The data presented in this study are available on request from the corresponding author.
Conflicts of Interest
The authors declare no conflict of interest.
References
- MEE. China Vehicle Environmental Management Annual Report (2018); Ministry of Ecology and Environment of the People’s Republic of China: Beijing, China, 2018.
- He, J.; Wu, L.; Mao, H.; Liu, H.; Jing, B.; Yu, Y.; Ren, P.; Feng, C.; Liu, X. Development of a vehicle emission inventory with high temporal-spatial resolution based on NRT traffic data and its impact on air pollution in Beijing—Part 2: Impact of vehicle emission on urban air quality. Atmos. Chem. Phys. 2016, 16, 3171–3184. [Google Scholar] [CrossRef] [Green Version]
- Jing, B.; Wu, L.; Mao, H.; Gong, S.; He, J.; Zou, C.; Song, G.; Li, X.; Wu, Z. Development of a vehicle emission inventory with high temporal-spatial resolution based on NRT traffic data and its impact on air pollution in Beijing—Part 1: Development and evaluation of vehicle emission inventory. Atmos. Chem. Phys. 2016, 16, 3161–3170. [Google Scholar] [CrossRef] [Green Version]
- Song, C.; Ma, C.; Zhang, Y.; Wang, T.; Wu, L.; Wang, P.; Liu, Y.; Li, Q.; Zhang, J.; Dai, Q.; et al. Heavy-duty diesel vehicles dominate vehicle emissions in a tunnel study in northern China. Sci. Total Environ. 2018, 637, 431–442. [Google Scholar] [CrossRef] [PubMed]
- Zhang, Q.; Wu, L.; Fang, X.; Liu, M.; Zhang, J.; Shao, M.; Lu, S.; Mao, H. Emission factors of volatile organic compounds (VOCs) based on the detailed vehicle classification in a tunnel study. Sci. Total Environ. 2018, 624, 878–886. [Google Scholar] [CrossRef] [PubMed]
- Zhang, Q.; Wu, L.; Yang, Z.; Zou, C.; Liu, X.; Zhang, K.; Mao, H. Characteristics of gaseous and particulate pollutants exhaust from logistics transportation vehicle on real-world conditions. Transp. Res. Part D Transp. Environ. 2016, 43, 40–48. [Google Scholar] [CrossRef]
- Allen, A.G.; Nemitz, E.; Shi, J.P.; Harrison, R.M.; Greenwood, J.C. Size distributions of trace metals in atmospheric aerosols in the United Kingdom. Atmos. Environ. 2001, 35, 4581–4591. [Google Scholar] [CrossRef]
- Malandrino, M.; Casazza, M.; Abollino, O.; Minero, C.; Maurino, V. Size resolved metal distribution in the PM matter of the city of Turin (Italy). Chemosphere 2016, 147, 477–489. [Google Scholar] [CrossRef] [PubMed]
- Cheng, Y.; Lee, S.; Gu, Z.; Ho, K.; Zhang, Y.; Huang, Y.; Chow, J.C. PM2.5 and PM10–2.5 chemical composition and source apportionment near a Hong Kong roadway. Particuology 2015, 18, 96–104. [Google Scholar] [CrossRef]
- Happo, M.S.; Uski, O.; Jalava, P.I.; Kelz, J.; Brunner, T.; Hakulinen, P.; Mäki-Paakkanen, J.; Kosma, V.M.; Jokiniemi, J.; Obernberger, I. Pulmonary inflammation and tissue damage in the mouse lung after exposure to PM samples from biomass heating appliances of old and modern technologies. Sci. Total Environ. 2013, 443, 256–266. [Google Scholar] [CrossRef]
- Zhang, Q.-J.; Wu, L.; Zhang, Y.-J.; Fang, X.-Z.; Mao, H.-J.; Wu, L.-P. Characteristics and health risk assessment of heavy metal in PM2.5 in tunnel environment. China Environ. Sci. 2018, 38, 4706–4712. [Google Scholar]
- Galindo, N.; Yubero, E.; Nicolas, J.F.; Varea, M.; Crespo, J. Characterization of metals in PM1 and PM10 and health risk evaluation at an urban site in the western Mediterranean. Chemosphere 2018, 201, 243–250. [Google Scholar] [CrossRef]
- Wang, J.; Pan, Y.; Tian, S.; Chen, X.; Wang, L.; Wang, Y. Size distributions and health risks of particulate trace elements in rural areas in northeastern China. Atmos. Res. 2016, 168, 191–204. [Google Scholar] [CrossRef]
- Mohsen, M.; Ahmed, M.B.; Zhou, J.L. Particulate matter concentrations and heavy metal contamination levels in the railway transport system of Sydney, Australia. Transp. Res. Part D Transp. Environ. 2018, 62, 112–124. [Google Scholar] [CrossRef]
- Duan, J.; Tan, J.; Wang, S.; Hao, J.; Chai, F. Size distributions and sources of elements in particulate matter at curbside, urban and rural sites in Beijing. J. Environ. Sci. 2012, 24, 87–94. [Google Scholar] [CrossRef]
- Wei, F. Background value of soil environment in China. Environ. Sci. 1991, 12, 12–19. [Google Scholar]
- Romanazzi, V.; Casazza, M.; Malandrino, M.; Maurino, V.; Piano, A.; Schilirò, T.; Gilli, G. PM10 size distribution of metals and environmental-sanitary risk analysis in the city of Torino. Chemosphere 2014, 112, 210–216. [Google Scholar] [CrossRef] [Green Version]
- Soleimani, M.; Amini, N.; Sadeghian, B.; Wang, D.; Fang, L. Heavy metals and their source identification in particulate matter (PM2.5) in Isfahan City, Iran. J. Environ. Sci. 2018, 72, 166–175. [Google Scholar] [CrossRef]
- Talbi, A.; Kerchich, Y.; Kerbachi, R.; Boughedaoui, M. Assessment of annual air pollution levels with PM1, PM2. 5, PM10 and associated heavy metals in Algiers, Algeria. Environ. Pollut. 2018, 232, 252–263. [Google Scholar] [CrossRef]
- Song, S.; Wu, Y.; Jiang, J.; Yang, L.; Hao, J. Characteristics of elements in size-resolved fine particles in a typical road traffic environment in Beijing. Acta Sci. Circumstantiae 2012, 32, 66–73. [Google Scholar]
- Wu, Y.; Hao, J.; Fu, L.; Hu, J.; Wang, Z.; Tang, U. Chemical characteristics of airborne particulate matter near major roads and at background locations in Macao, China. Sci. Total Environ. 2003, 317, 159–172. [Google Scholar] [CrossRef]
- Das, R.; Khezri, B.; Srivastava, B.; Datta, S.; Sikdar, P.K.; Webster, R.D.; Wang, X. Trace element composition of PM 2.5 and PM 10 from Kolkata—A heavily polluted Indian metropolis. Atmos. Pollut. Res. 2015, 6, 742–750. [Google Scholar] [CrossRef]
- Garg, B.D.; Cadle, S.H.; Mulawa, P.A.; Groblicki, P.J. Brake Wear Particulate Matter Emissions. Environ. Sci. Technol. 2000, 34, 4463–4469. [Google Scholar] [CrossRef]
- Sanders, P.G.; Xu, N.; Dalka, T.M.; Maricq, M.M. Airborne Brake Wear Debris: Size Distributions, Composition, and a Comparison of Dynamometer and Vehicle Tests. Environ. Sci. Technol. 2003, 37, 4060–4069. [Google Scholar] [CrossRef]
- Song, S.; Wu, Y.; Jiang, J.; Yang, L.; Cheng, Y.; Hao, J. Chemical characteristics of size-resolved PM2.5 at a roadside environment in Beijing, China. Environ. Pollut. 2012, 161, 215–221. [Google Scholar] [CrossRef]
- Harrison, R.M.; Jones, A.M.; Gietl, J.K.; Yin, J.; Green, D.C. Estimation of the contributions of brake dust, tire wear, and resuspension to nonexhaust traffic particles derived from atmospheric measurements. Environ. Sci. Technol. 2012, 46, 6523–6529. [Google Scholar] [CrossRef]
- Limited, K.M.; Kennedy, P.; Gadd, J. Preliminary Examination of Trace Elements in Tyres, Brake Pads and Road Bitumen in New Zealand; Ministry of Transport: Wellington, New Zealand.
- Dallosto, M.; Beddows, D.C.S.; Gietl, J.K.; Olatunbosun, O.; Yang, X.; Harrison, R.M. Characteristics of tyre dust in polluted air: Studies by single particle mass spectrometry (ATOFMS). Atmos. Environ. 2014, 94, 224–230. [Google Scholar] [CrossRef] [Green Version]
- Pant, P.; Harrison, R.M. Estimation of the contribution of road traffic emissions to particulate matter concentrations from field measurements: A review. Atmos. Environ. 2013, 77, 78–97. [Google Scholar] [CrossRef]
- Querol, X.; Viana, M.; Alastuey, A.; Amato, F.; Moreno, T.; Castillo, S.; Pey, J.; Rosa, J.D.L.; Campa, A.S.D.L.; Artíñano, B. Source origin of trace elements in PM from regional background, urban and industrial sites of Spain. Atmos. Environ. 2007, 41, 7219–7231. [Google Scholar] [CrossRef]
- Al-Momani, I.F. Trace elements in atmospheric precipitation at Northern Jordan measured by ICP-MS: Acidity and possible sources. Atmos. Environ. 2003, 37, 4507–4515. [Google Scholar] [CrossRef]
- Li, F.-H.; Zhang, Y.-J.; Zhang, J.; Yuan, Y.; Wu, L.; Mao, H.-J. Characteristics of Particulate and Inorganic Elements of Motor Vehicles Based on a Tunnel Environment. Huanjing Kexue 2018, 39, 1014–1022. [Google Scholar] [CrossRef]
- Thorpe, A.; Harrison, R.M. Sources and properties of non-exhaust particulate matter from road traffic: A review. Sci. Total Environ. 2008, 400, 270–282. [Google Scholar] [CrossRef] [PubMed]
- Adamiec, E.; Jarosz-Krzemińska, E.; Wieszała, R. Heavy metals from non-exhaust vehicle emissions in urban and motorway road dusts. Environ. Monit. Assess. 2016, 188, 1–11. [Google Scholar] [CrossRef] [Green Version]
- Apeagyei, E.; Bank, M.S.; Spengler, J.D. Distribution of heavy metals in road dust along an urban-rural gradient in Massachusetts. Atmos. Environ. 2011, 45, 2310–2323. [Google Scholar] [CrossRef]
- Wang, C.-H.; Yan, K.; Han, X.-Y.; Shi, Z.; Bi, L.-M.; Xiang, F.; Ning, P.; Shi, J.-W. Physico-chemical Characteristic Analysis of PM2.5 in the Highway Tunnel in the Plateau City of Kunming. Huanjing Kexue 2017, 38, 4968–4975. [Google Scholar] [CrossRef] [PubMed]


Publisher’s Note: MDPI stays neutral with regard to jurisdictional claims in published maps and institutional affiliations. |
© 2021 by the authors. Licensee MDPI, Basel, Switzerland. This article is an open access article distributed under the terms and conditions of the Creative Commons Attribution (CC BY) license (https://creativecommons.org/licenses/by/4.0/).