Abstract
Seasonal variations of the radon and radium activity concentrations in karstic water sources originating in karstic formations were investigated as part of a premiere systematic survey conducted in Romania. A database including a total of 228 drinking water samples collected from 30 distinct water sources adjacent to rural communities was compiled. The radon and radium activity concentrations for all seasons, assessed based on solid scintillation, ranged from 2.1 to 19.7 Bq/L and from 0.6 to 3.0 Bq/L, respectively. Overall, the detected radon and radium contents did not exceed the radioprotection standards recommended by national and European legislation. However, in at least one season, the measured values for 31% of the samples exceeded the 11.1 Bq/L maximum contaminant level for radon in drinking water recommended by the Environmental Protection Agency of the United States. The associated radiological risk, reported in terms of annual effective dose, was calculated to be between 9.8 × 10⁻⁶ and 6.0 × 10⁻⁵ mSv/y for radon and between 5.9 × 10⁻⁵ and 2.7 × 10⁻⁴ mSv/y for radium, which are considerably below the WHO (World Health Organization) guidelines at a value of 0.1 mSv/y.
1. Introduction
Radium (226Ra) occurs in virtually all types of rocks and soils, with its concentration being directly correlated with geological specificity. Radon (222Rn) is a chemically inert and radioactive gas produced by the direct decay of 226Ra. Once produced, radon infiltrates the interstitial fluids [1], where it can easily dissolve into groundwater [2]. 226Ra and 222Rn are two of the most common naturally occurring radionuclides in groundwater. The concentration of dissolved radon is dependent not only on the radium content of rocks but also on local factors such as groundwater chemistry, the presence of shear zones, soil porosity or the residence time of water in a specific aquifer [3,4,5]. Moreover, the flow of groundwater through soil and rocks containing radon and radium can lead to a concentration of radon activity in addition to that due to the original aquifer [6]. Once the groundwater reaches the surface, the radon content is almost entirely depleted [7,8] due to its radioactive decay and evasion to the atmosphere. Radon is both highly useful to humans and a carcinogen. Its presence in rocks, soil and water has greatly facilitated interdisciplinary research, such as studies on traceability in water discharge [9], fault zone detection [10], earthquake prediction by means of soil-radon [11] and groundwater-radon [12], fire detection [13] and urban pollution characterization [14]. On the other hand, its presence in living spaces and drinking water represents a major health hazard to both humans and non-human biota [15,16,17,18].
Large- and small-scale surveys conducted in Romania [19,20] pointed out that drinking water is often contaminated with radon, regardless of its origin. Water-soluble radon could increase indoor radon activity, which is known to cause lung cancer [16] and has also been linked with induced stomach cancer [21]. Additionally, contamination of the public drinking water supply by chemical and biological pollutants occurs often in Romania according to scientific [22,23,24] and public records (National Institute of Public Health). One specific example is represented by the spring waters in karstic regions which originate from groundwater. These particular types of waters are known to be polluted by human activities on the surface and by bats that inhabit the water crosses in caves, both of which add to the problems caused by the inherent lack of mechanical filtering of karst waters. Groundwater flowing through karst is vulnerable to contamination due to concentrated flow with reduced transit time and little self-purification within the system. By studying karstic sources of water, Moldovan et al. [25] hypothesized that, in karstic systems with diffuse input (caves, inlets, ponors, etc.), rainfall enters underground and reaches the surface through springs within days to months, gathering potential contaminants from the surface, especially in rural areas with agricultural fields. Radon concentrations in water represent an important dosimetry issue [26]. The global average dose from the inhalation of radon from all sources is approximately 1 mSv/y [27], which is slightly lower than half the total natural radiation exposure of 2.4 mSv/y [28].
Although the spatiotemporal variability of dissolved radon has previously been investigated, the focus of studies has mostly been on groundwater discharge [8,29,30] while dose assessment based on aquifer rock type has attracted less interest. In this study, we aim to evaluate the seasonal and spatial variability of 222Rn and 226Ra isotopes in raw drinking water from karstic springs and their associated health risk added to an already existing biological risk.
2. Materials and Methods
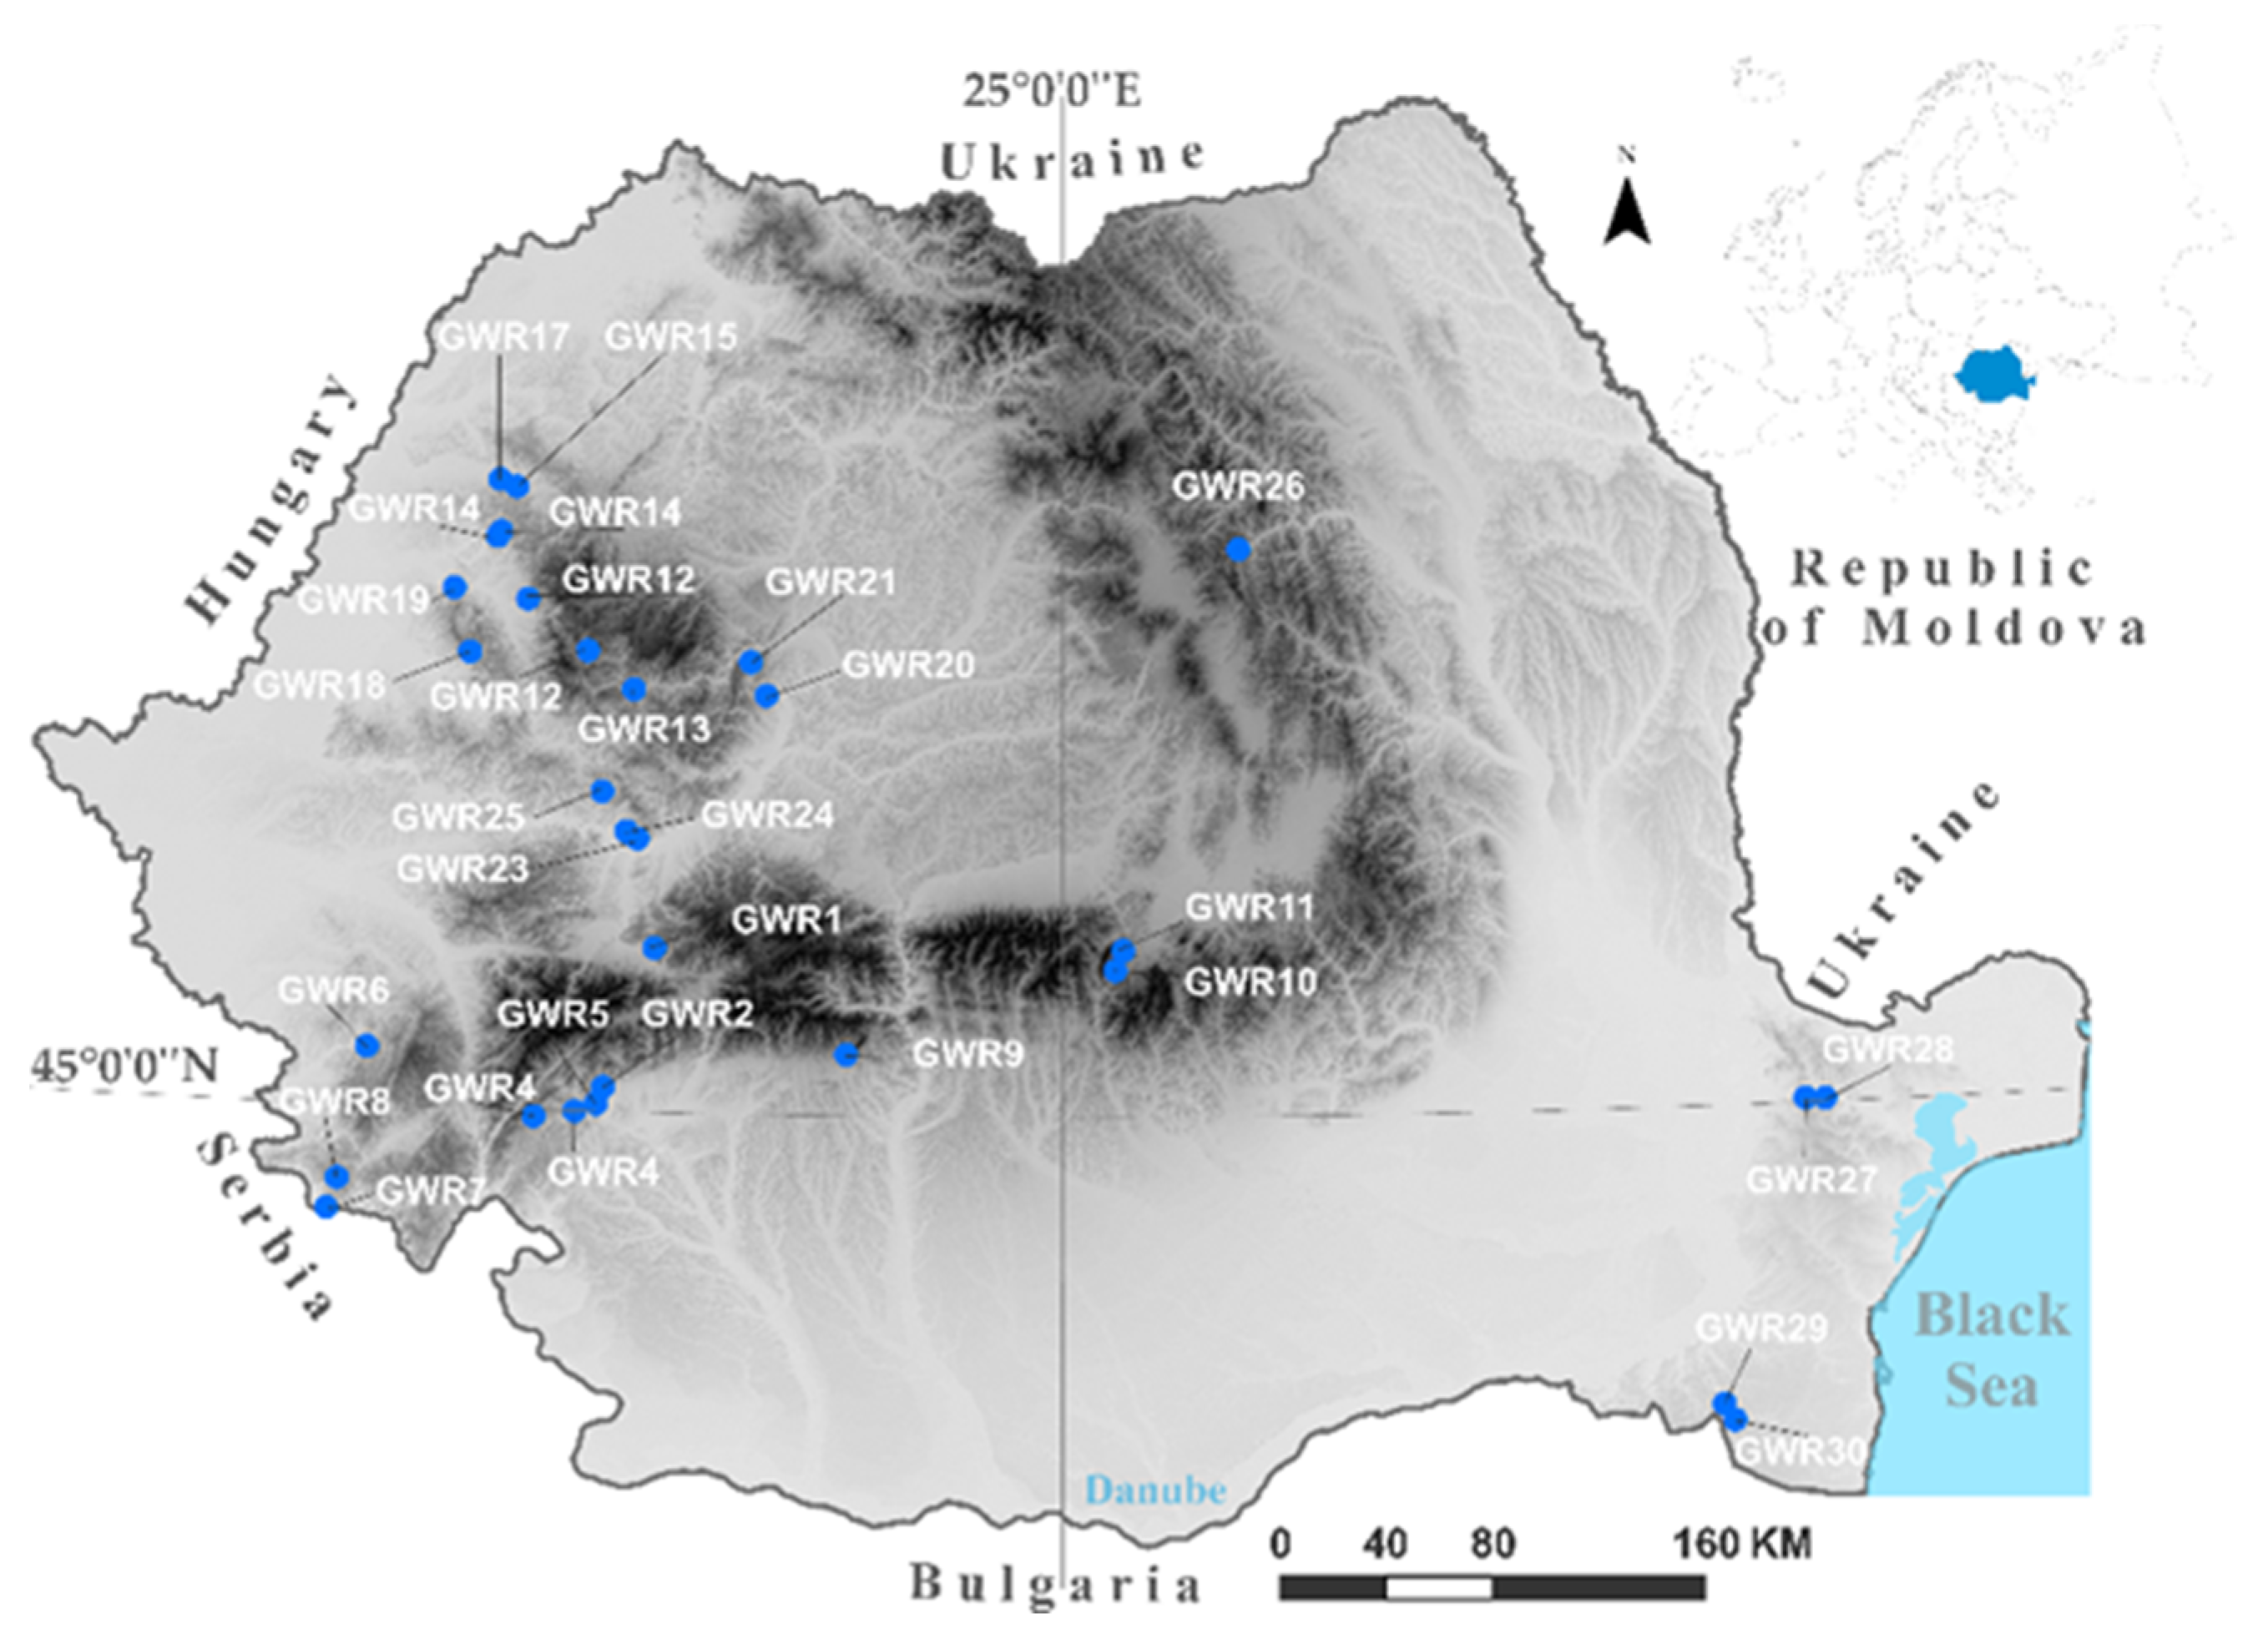
A total of 30 springs of karstic origin, located throughout the Romanian territory (Figure 1), were selected for this study. All of the selected springs are used for domestic and agricultural purposes by their local rural communities.

Figure 1.
The sampled karstic springs in Romania (blue dots) and the position of the country in Europe (upper right).
2.1. Concentration of 222Rn and 226Ra
Spring water sampling was performed at 30 publicly accessed sources spread throughout Romania (Figure 1), hereafter delineated as sampling points GWR1 (GroundWater Radon) to GWR30. Due to a persistent drought, one of the springs (GWR4) could not be in any of the field campaigns and, therefore, was excluded from our analysis. During the collection of autumn samples, GWR9 and GWR13 were also dry. Therefore, a total of 29 water samples were collected quarterly between October 2019 and August 2020. Glass bottles measuring 500 mL were filled from below the water flow and allowed to overflow vertically to avoid trapping air bubbles. The samples were then transported to the laboratory for analysis; the transport of samples did not require special conditions. The activity of 222Rn was determined using the LUK VR installation (Jiri Plch, Prague, Czech Republic) shortly after sampling to avoid significant decay loss. The radon concentration was determined after the water samples reached room temperature, following the accredited protocol from LiRaCC [7]. At a room temperature of 20 °C, the solubility coefficient of radon in water is 0.254. The LUK VR installation consists of a glass vessel (scrubber) in which the radon in water is brought into equilibrium with the radon in the air above the water by vigorous stirring and the LUK 2P device. Air containing radon is transferred into a scintillation chamber (Lucas cell). The scintillation chamber is located inside the LUK 2P device in front of a photomultiplier. (Jiri Plch, Prague, Czech Republic) Scintillations produced by the active deposit of radon introduced into the chamber are detected and counted after establishing the radioactive equilibrium between radon and its active deposit, using the photomultiplier.
The preparation of samples for the measurement and determination of the radon concentration from water is described below:
Before the start of each measurement, the water samples were brought to room temperature. The sample (measuring 300 cm3) was introduced into the scrubber, and then, the scrubber was closed and shaken very well for 1 min. It was then expected that equilibrium between the radon dissolved in the water sample and the radon in the air above it had been established. The air occupying the upper part of the scrubber (which has now become mixed with radon) was then transferred for measurement by the Lucas cell. The transfer process was conducted by using a syringe to add 150 cm3 of distilled, radon-free water to the water sample in the scrubber, so that the level of water inside the scrubber increases and a similar volume of air is pushed out through the valve (which is open during this process) to fill the Lucas cell (145 cm3). The Lucas cell was previously evacuated in order to be filled with the air now being forced in. A radon progeny filter was introduced between the scrubber and the Lucas cell. The Lucas cell was then connected to a photomultiplier tube for readout. The radon concentration in the water sample, CRn (Bq/L), and the number of collected counts, N (counts/s), are related as follows:
CRn = 7.6 × N (count s−1)
Taking into account errors due to radon measurement and statistics, the minimum detection limit (MDL) was estimated to be 0.2 Bq/L. This value for the MDL is below the lowest expected radon concentration levels that are found in surface water (normally ∼1 Bq/L). The statistical errors associated with the radon analysis were 5–6%, as explained by Cosma [7].
The efficiency of detection of the Lucas cell was determined using a control source manufactured and certified by the State Metrological Institute of the Czech Republic. A detailed description of the working protocol has been provided by Cosma [7]. Quality assurance has been achieved by participating in intercomparison exercises and radon-in-water proficiency tests, in both intercomparison exercises laboratory LiRaCC obtained satisfactory results [31].
226Ra was measured based on its secular equilibrium with 222Rn, which was achieved after the samples had been stored for 30 days in sealed columns, i.e., the radium concentration in the water was equal to the radon concentration 30 days after the sample had been collected. The radium in the water was measured using the LUK VR installation (described above) and following the same measuring protocol as in the radon determinations [32]. Considering all types of possible errors (statistic, measurements, etc.) usually sum up to about 25%, the detection limit for the radium in water measurements was assessed to be 0.05 Bq/L [33].
The physicochemical parameters of spring discharge, water temperature and conductivity were measured in situ during each sampling (Table 1). The pH and electrical conductivity (EC) were measured in situ using a portable multiparameter monitoring device with built-in temperature correction (Multi 340i, WTW, Wertheim, Germany), and the flow rate was measured by using a FP111 Flow Probe (Global Water, Phoenix, AZ, USA).

Table 1.
Temporal variability of the physicochemical parameters in the studied karstic springs.
2.2. Annual Effective Dose Due to Radon and Radium
The annual effective ingested doses were estimated according to the parameters introduced by the United Nations Scientific Committee on the Effects of Atomic Radiation [28] and by the International Atomic Energy Agency [34] and were calculated on the basis of the mean activity concentration using the following relation:
- -
- Dwater (mSv/y) represents the annual effective dose of radon or radium ingestion;
- -
- F is the committed effective dose per unit in water intake for adults, taken as 10−8 Sv/Bq for radon [28] and as 2.8 × 10⁻⁷ Sv/Bq for radium [34];
- -
- Cw is the water consumption rate, taken to be 2 L/day;
- -
- T is the duration of consumption (365 days);
- -
- Aw is the activity of radon or radium in water (Bq/L).
2.3. Statistical Analysis
Statistical analysis of the data was performed using the OriginPro 2019b software, and a Principal Component Analysis (PCA) was performed using XLSTAT Addinsoft 2021. PCA was used for the analysis of the physicochemical and radon–radium variables in the studied springs. The statistical distribution of the data was evaluated using the Shapiro-Wilk test. For the comparison of the repeated measures, an ANOVA test with Tukey’s post hoc analysis was used. In order to evaluate the intensity of the relationship between the examined variables, the Pearson correlation coefficient was calculated. The significance level α was set at 0.05.
3. Results and Discussions
3.1. Radon and Radium Concentrations
European and Romanian regulations set the admissible activity of radon in water at 100 Bq/L [35]. The US Environmental Protection Agency (EPA) [26] proposes a standard of 300 pCi/L (equivalent to 11.1 Bq/L) for radon contamination in drinking water from public water supplies.
In this study, the radon activity concentration in all seasons ranged from 2.1 to 19.7 Bq/L for the 29 active water sources (Table 2). The range of radon activity concentration is caused by specific particularities in groundwater dynamics due to the different permeability properties of the karst or other rocks crossed by the water.
Table 2.
Temporal variability of the radon activity concentration in the studied karstic springs.
The measured values are not significantly high and do not exceed the radioprotection standards recommended by national and European guidelines [35]. Radon data did, however, exceed the EPA limit (11.1 Bq/L) for at least one season in the case of nine water sources (31% from total number of samples), while samples from GWR17 and GWR20 exceeded the limit in all four investigated seasons.
It was also observed that six of the samples (21% of the total number of samples) collected from karstic springs used as drinking water by the local communities showed annual radon activity concentrations exceeding the EPA limit (Table 2). Fluctuation of the radon activity concentration in samples collected from the same body of water throughout the year has been reported by other studies [36,37,38], yet no consensus has so far been reached on the causes of such variations.
The 226Ra concentrations from the 29 springs, collected in all seasons, ranged between the lowest limit of detection for the used method and 3.0 Bq/L (Table 3), with an average of 1.1 Bq/L. In this study, we determined a radium concentration above the recommended World Health Organization guideline level for drinking water (1.0 Bq/L) in nine sources (30% of the total number of samples). The radium concentration in twenty spring water samples (70% of the total number of samples) were below this value [28].
Table 3.
Temporal variability of the radium activity concentration in the studied karstic springs.
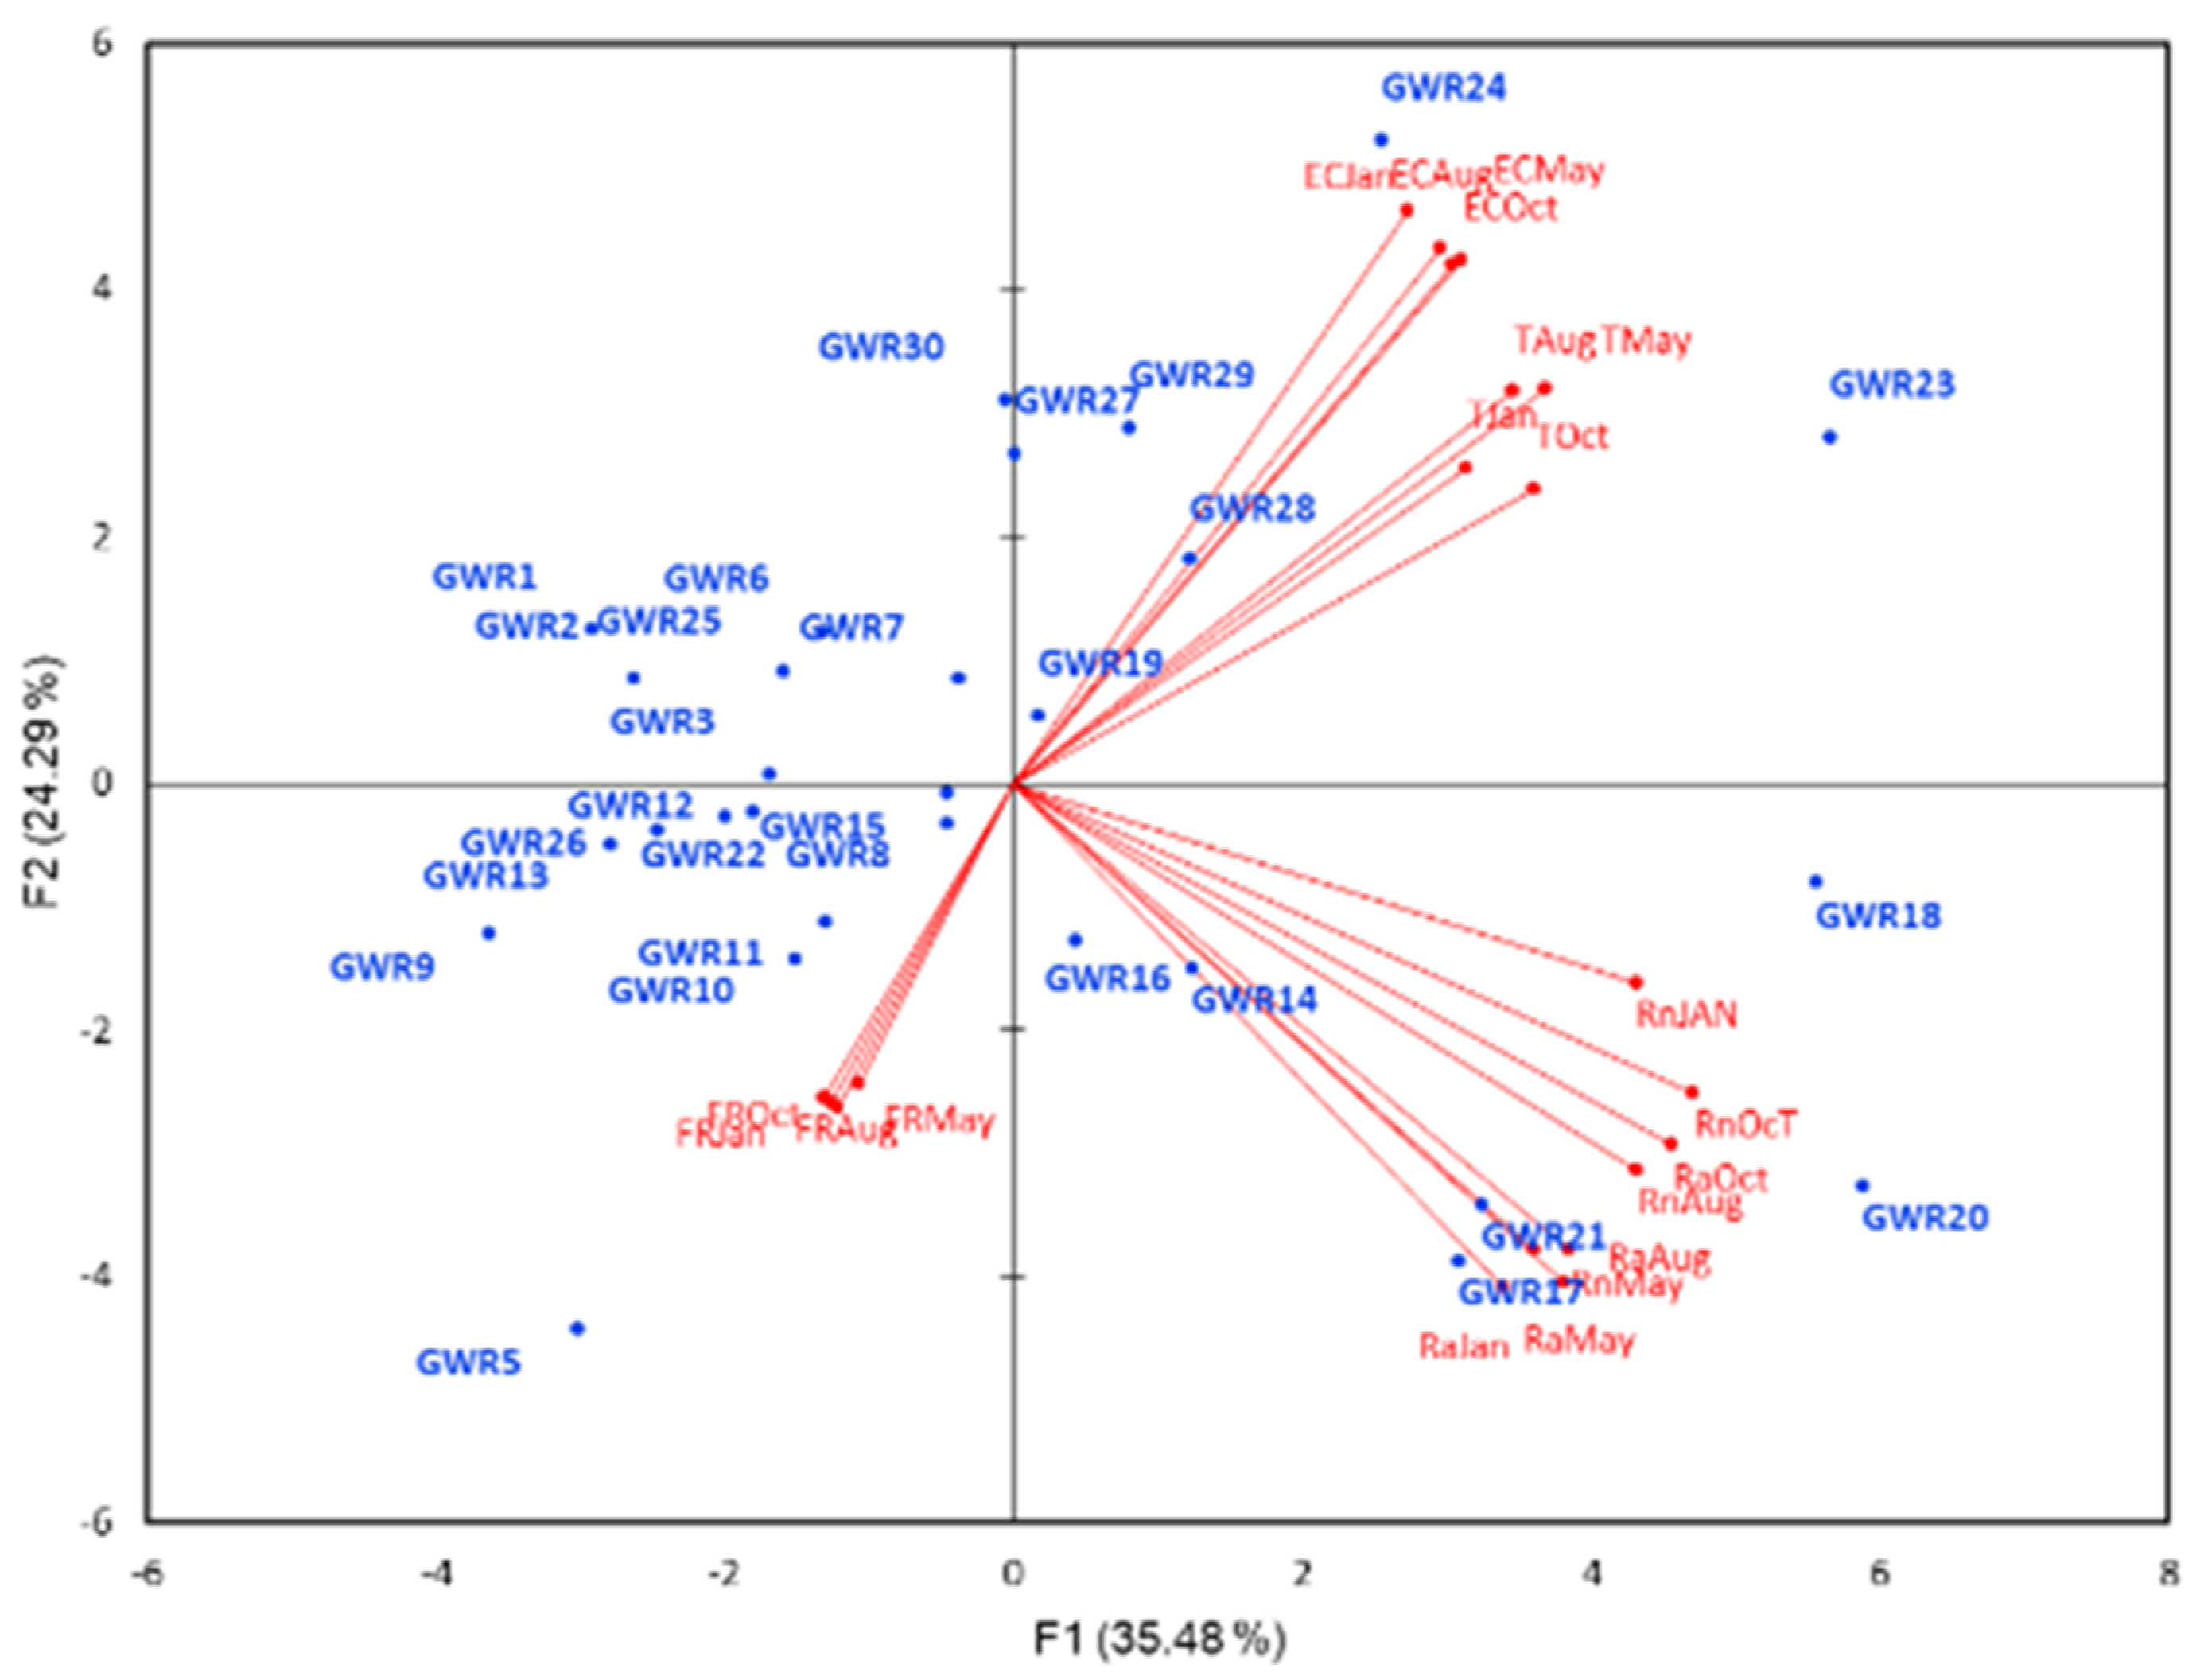
No correlation between the radon or radium activity concentrations and the measured physicochemical parameters was found in the PCA (Figure 2). Radon and radium are separated in a different quadrant from the flow rate, while temperature and electrical conductivity are grouped together. Very few springs are defined by temperature and conductivity (GWR23), flow rate (GWR5), or radon and radium (GWR20). Most of the springs are negatively correlated with radon and radium, especially along the F1 axis.
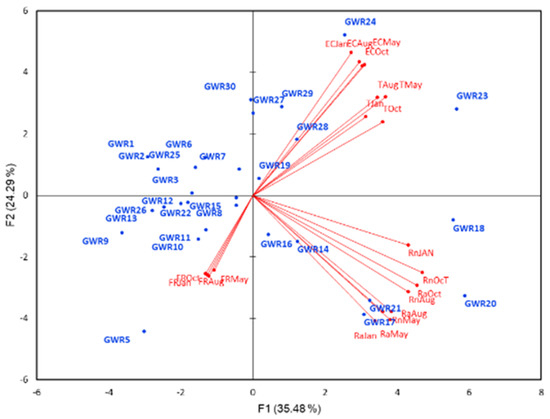
Figure 2.
The PCA of temperature (T), electrical conductivity (EC), flow rate (FR), radon (Rn), and radium (Ra) in the analyzed karstic springs (GWR—GWR30, except GWR4) for four months (Oct = October 2019; Jan = January 2020; May = May 2020; Aug = August 2020).
3.2. Radon and Radium Temporal Variability
The seasonal variability of radon and radium concentrations in karstic springs, assessed based on spot samples collected during the four seasons, is presented in the box plots in Figure 3 and Figure 4.

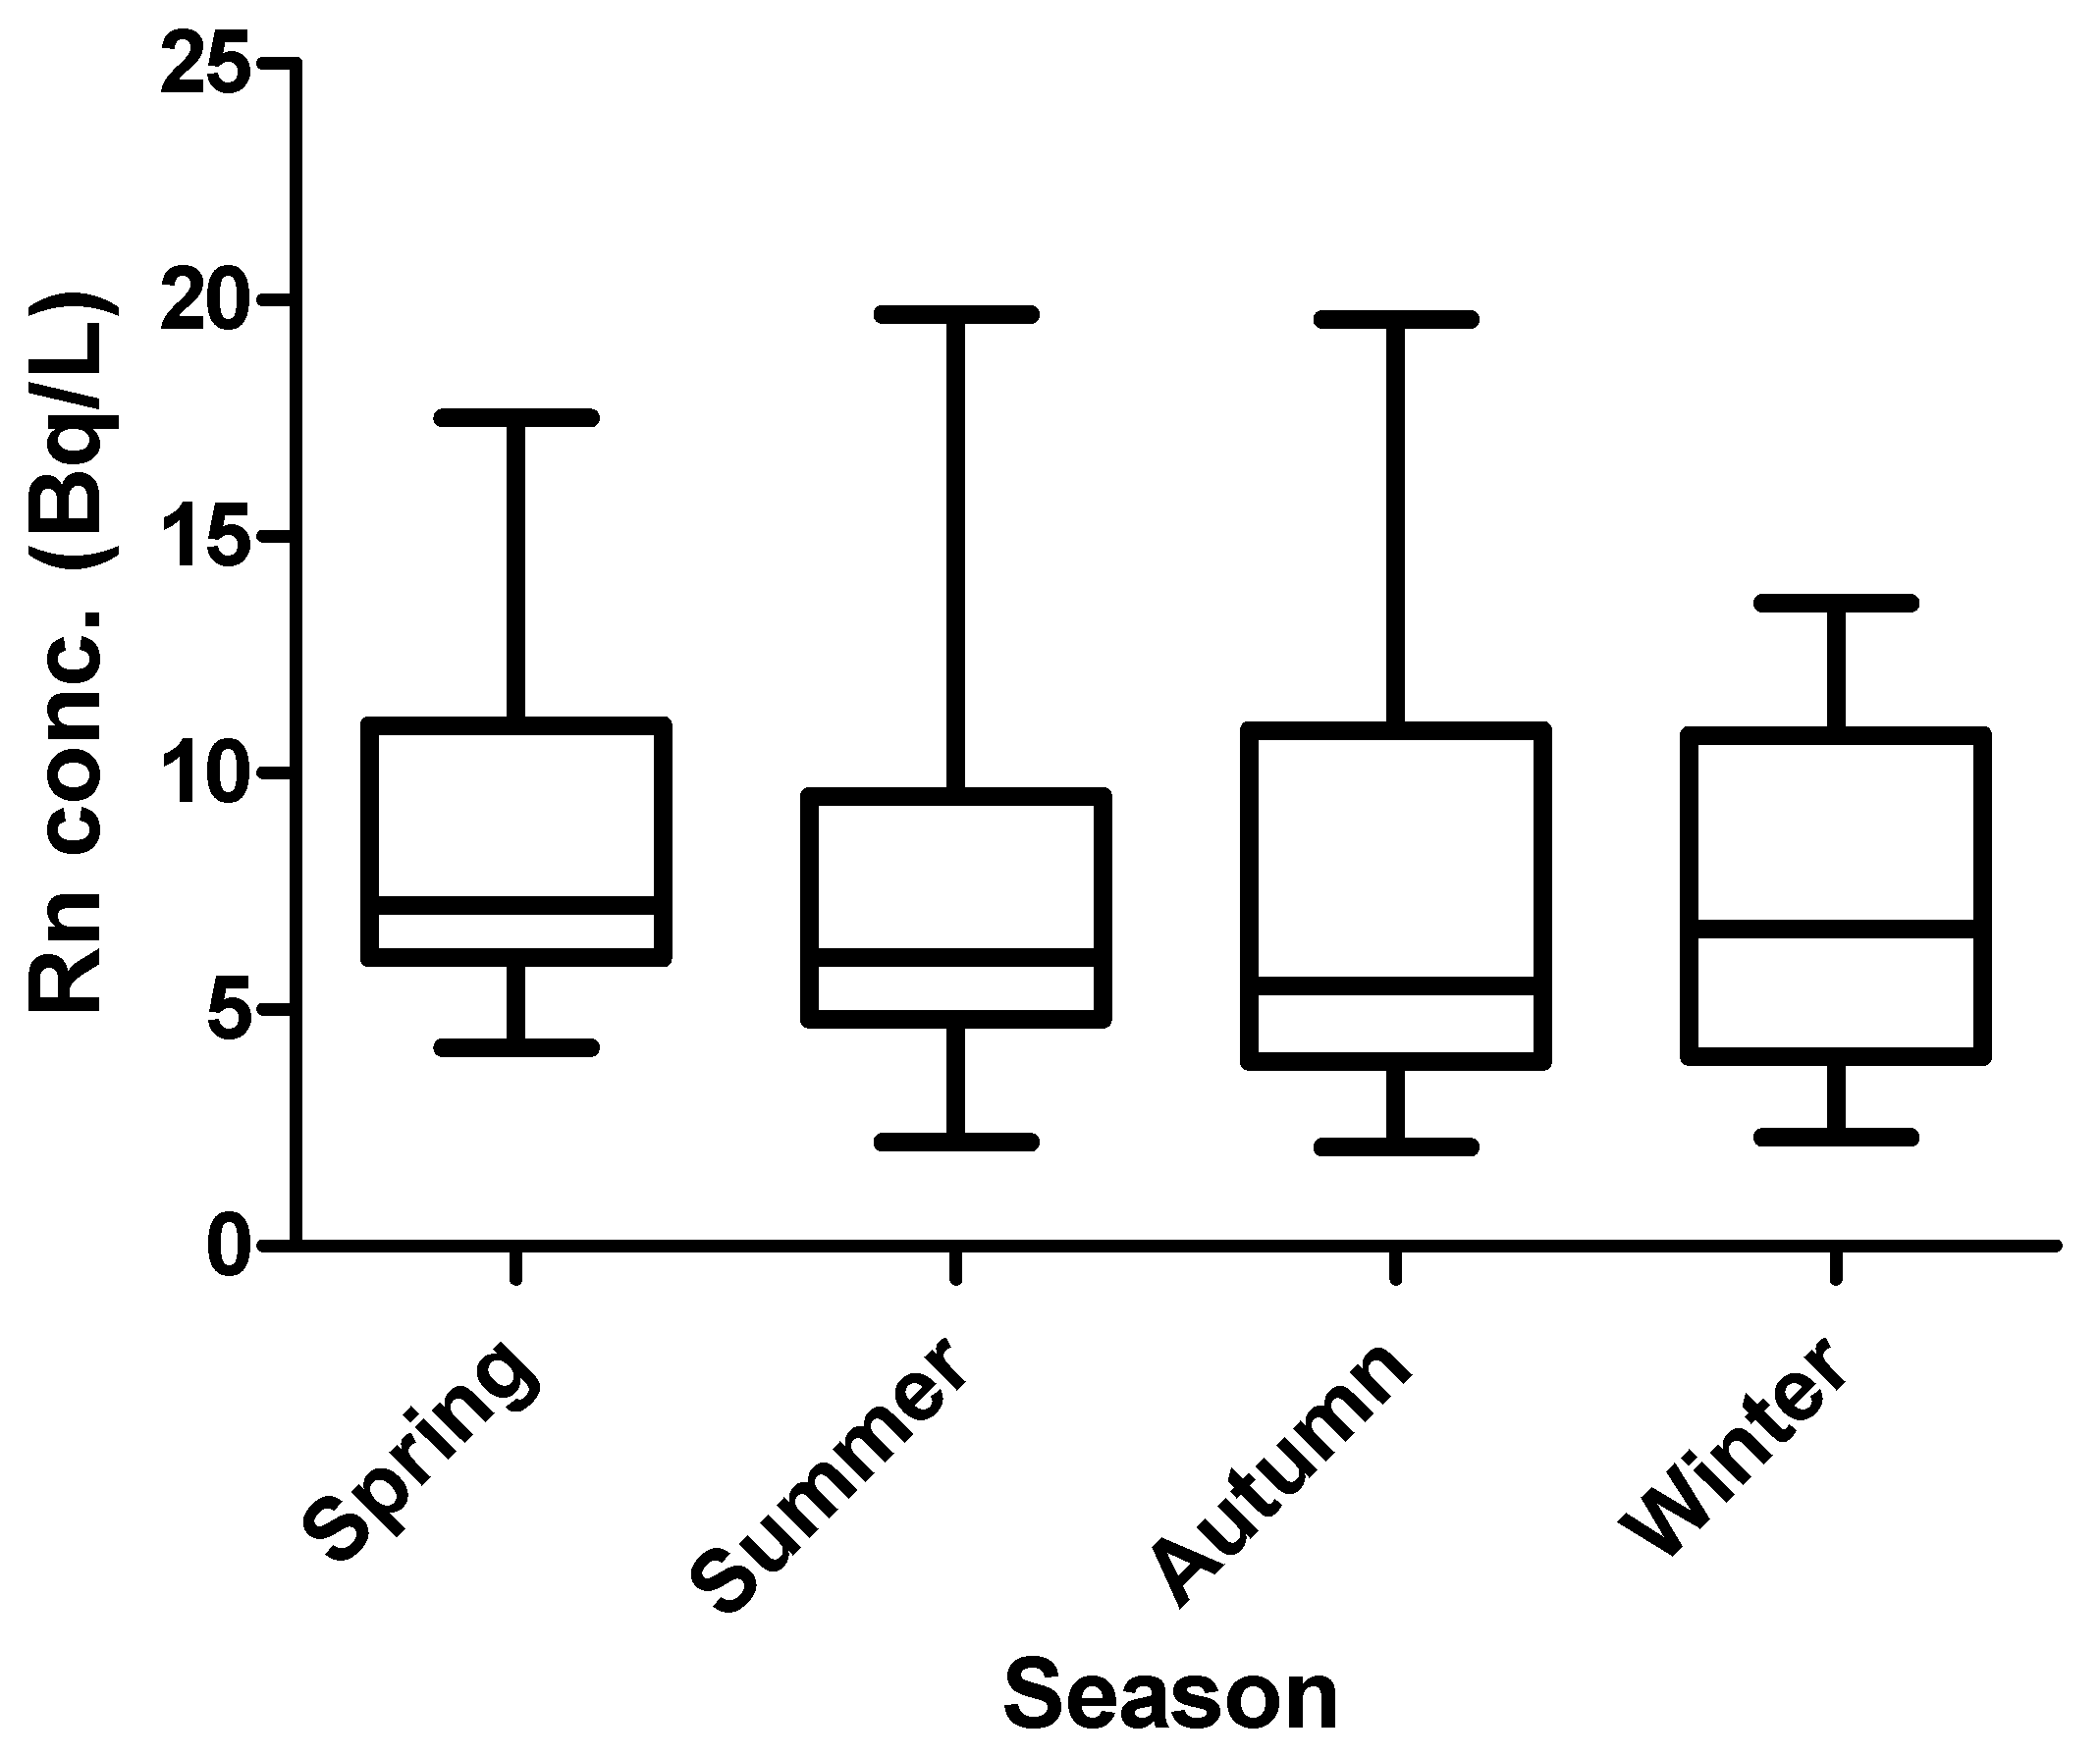
Figure 3.
Seasonal (season) distribution of radon activity concentration (Bq/L) in 29 Romanian karstic springs surveyed during 2019–2020.
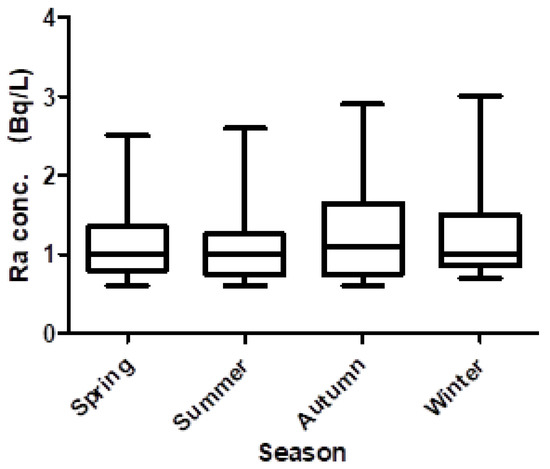
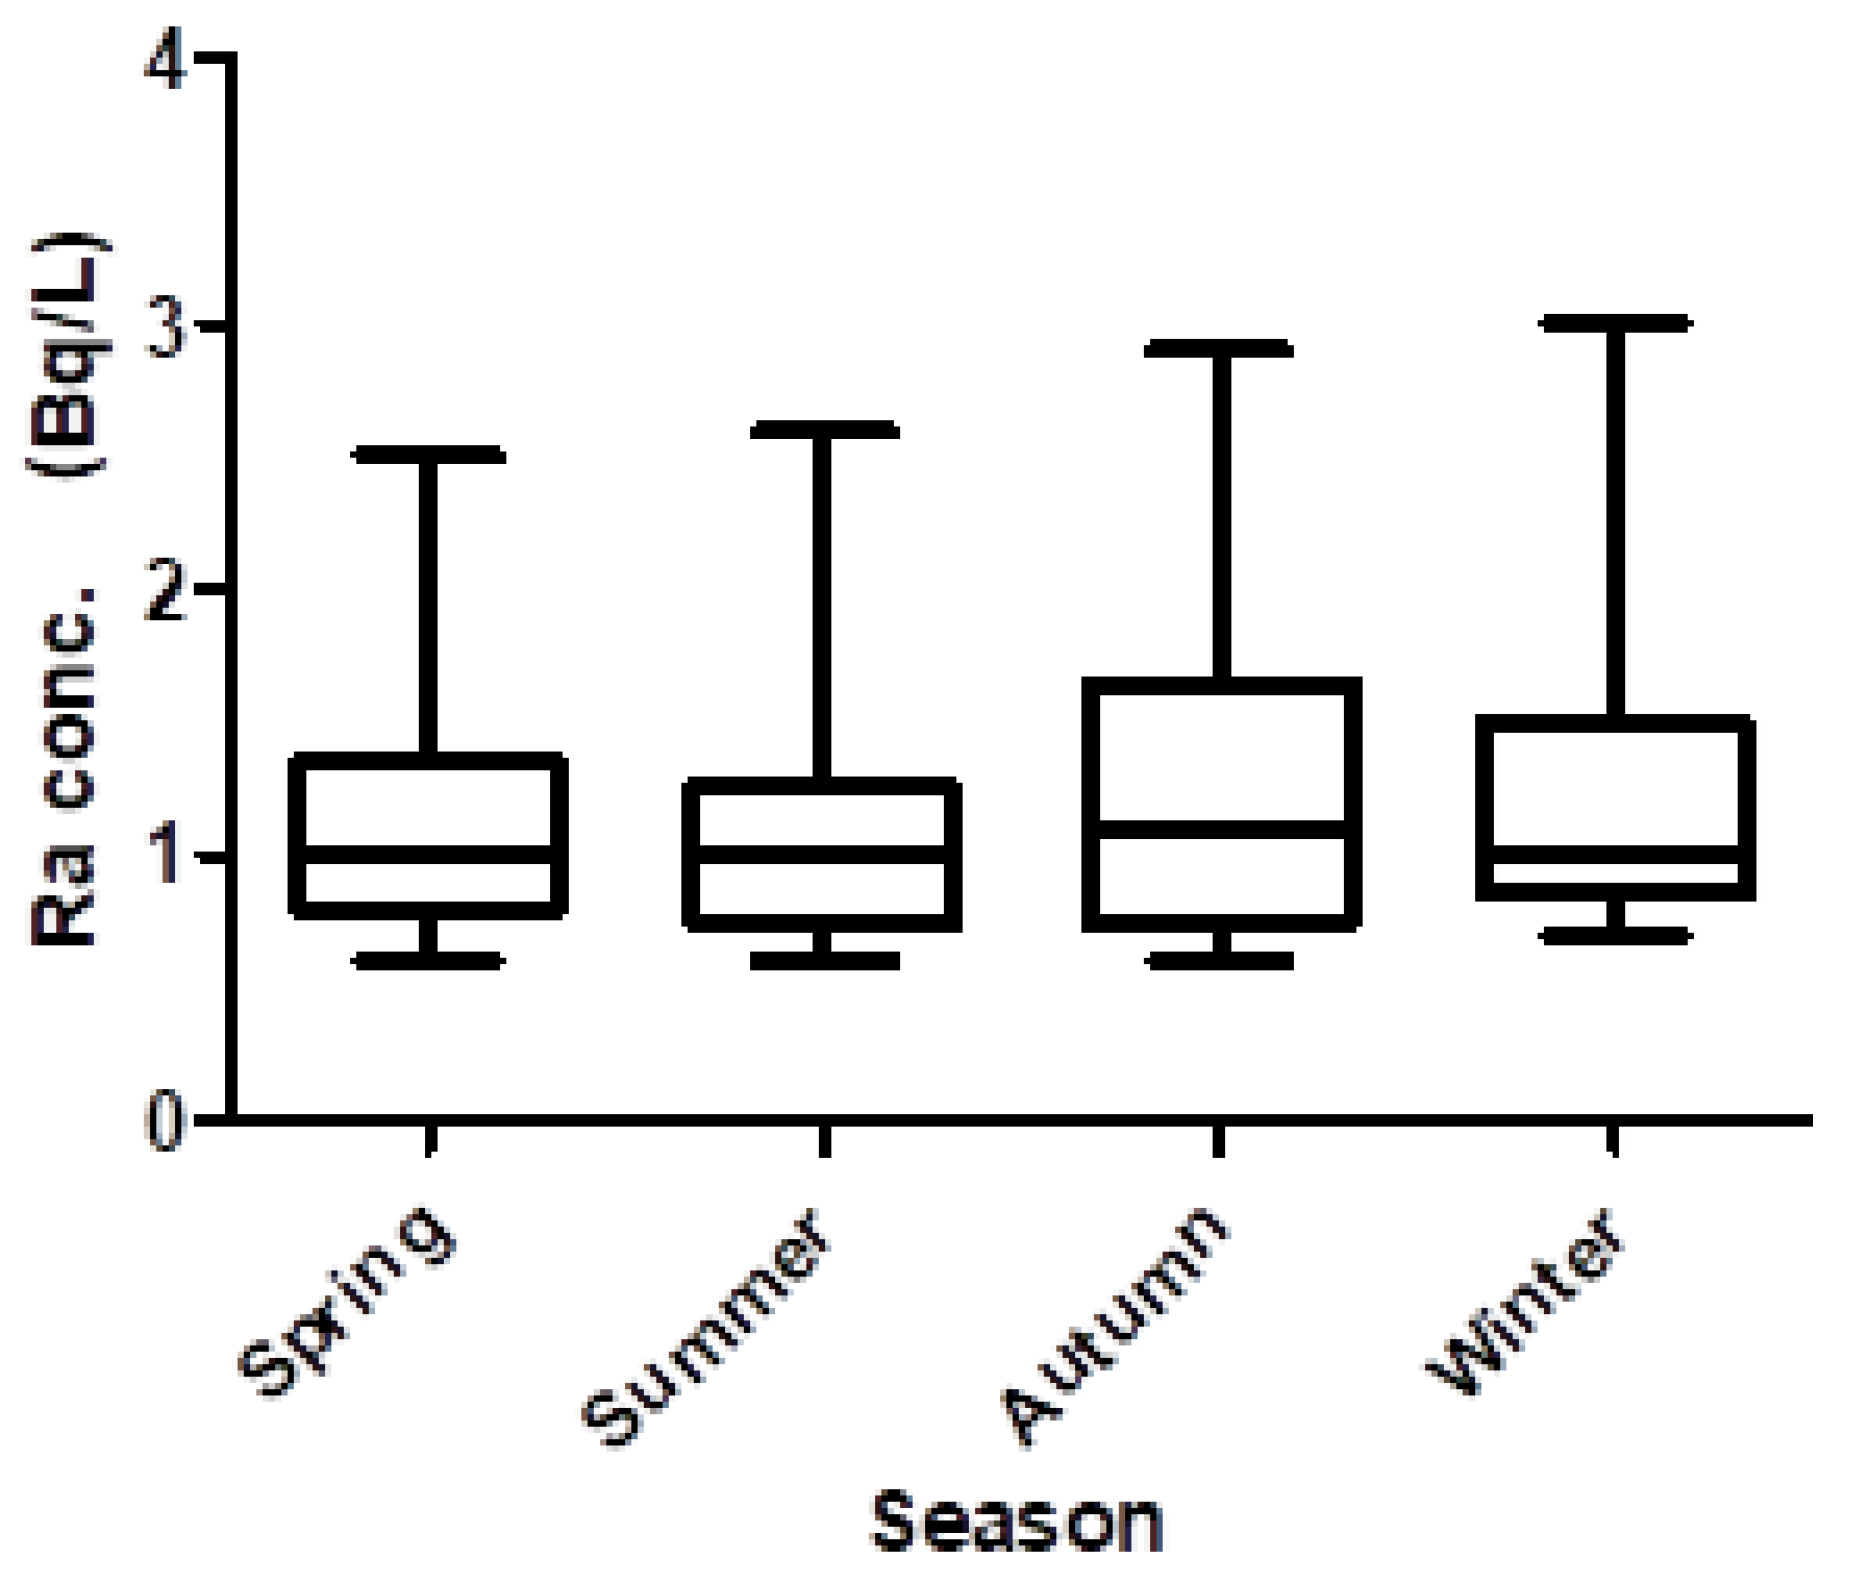
Figure 4.
Seasonal (season) distribution of radium concentration (Bq/L) in karstic springs.
The annual values and seasonal measurements of the radon activity concentrations show a log-normal distribution, as confirmed by the Shapiro-Wilk test when applied to the log-transformed data. The geometric means of the radon concentrations are between 6.05 Bq/L (Autumn–October) and 7.85 Bq/L (Spring–May), while the annual mean is 7.0 Bq/L. By applying the ANOVA test for repeated measures to the log-transformed data on the radon concentrations, a significant difference was obtained (F = 8.12, p < 0.001). The Tukey post hoc test indicated a significant difference between spring and autumn (p < 0.001) and between spring and winter (p < 0.01).
A similar statistical analysis was applied to radium measurements. Thus, a log-normal distribution was obtained for the four seasons but not for the annual computed means. The seasonal geometric means range from 1.03 Bq/L (Summer–August) to 1.15 Bq/L (Winter–January). A statistically significant difference was obtained by applying the ANOVA test for repeated measures and Tukey’s post hoc analysis to the radium concentrations during the hot (summer) and cold (winter) seasons (p = 0.02).
As shown, the highest radium activity occurred in autumn while the highest radon activity occurred in spring. The concentration of radon is higher in spring because the precipitation during this period combined with the melting of the snow increases the flow of the springs and decreases the flow time; consequently, the radon does not have time to be released from the water. On the other hand, the concentration of radium is higher in autumn because the flow of the springs is lower and the dissolution of rocks is more efficient. In order to show a correlation between the concentrations of radon and radium, the flow of the springs should be constant over a long period of time, but this was not achieved due to meteorological conditions.
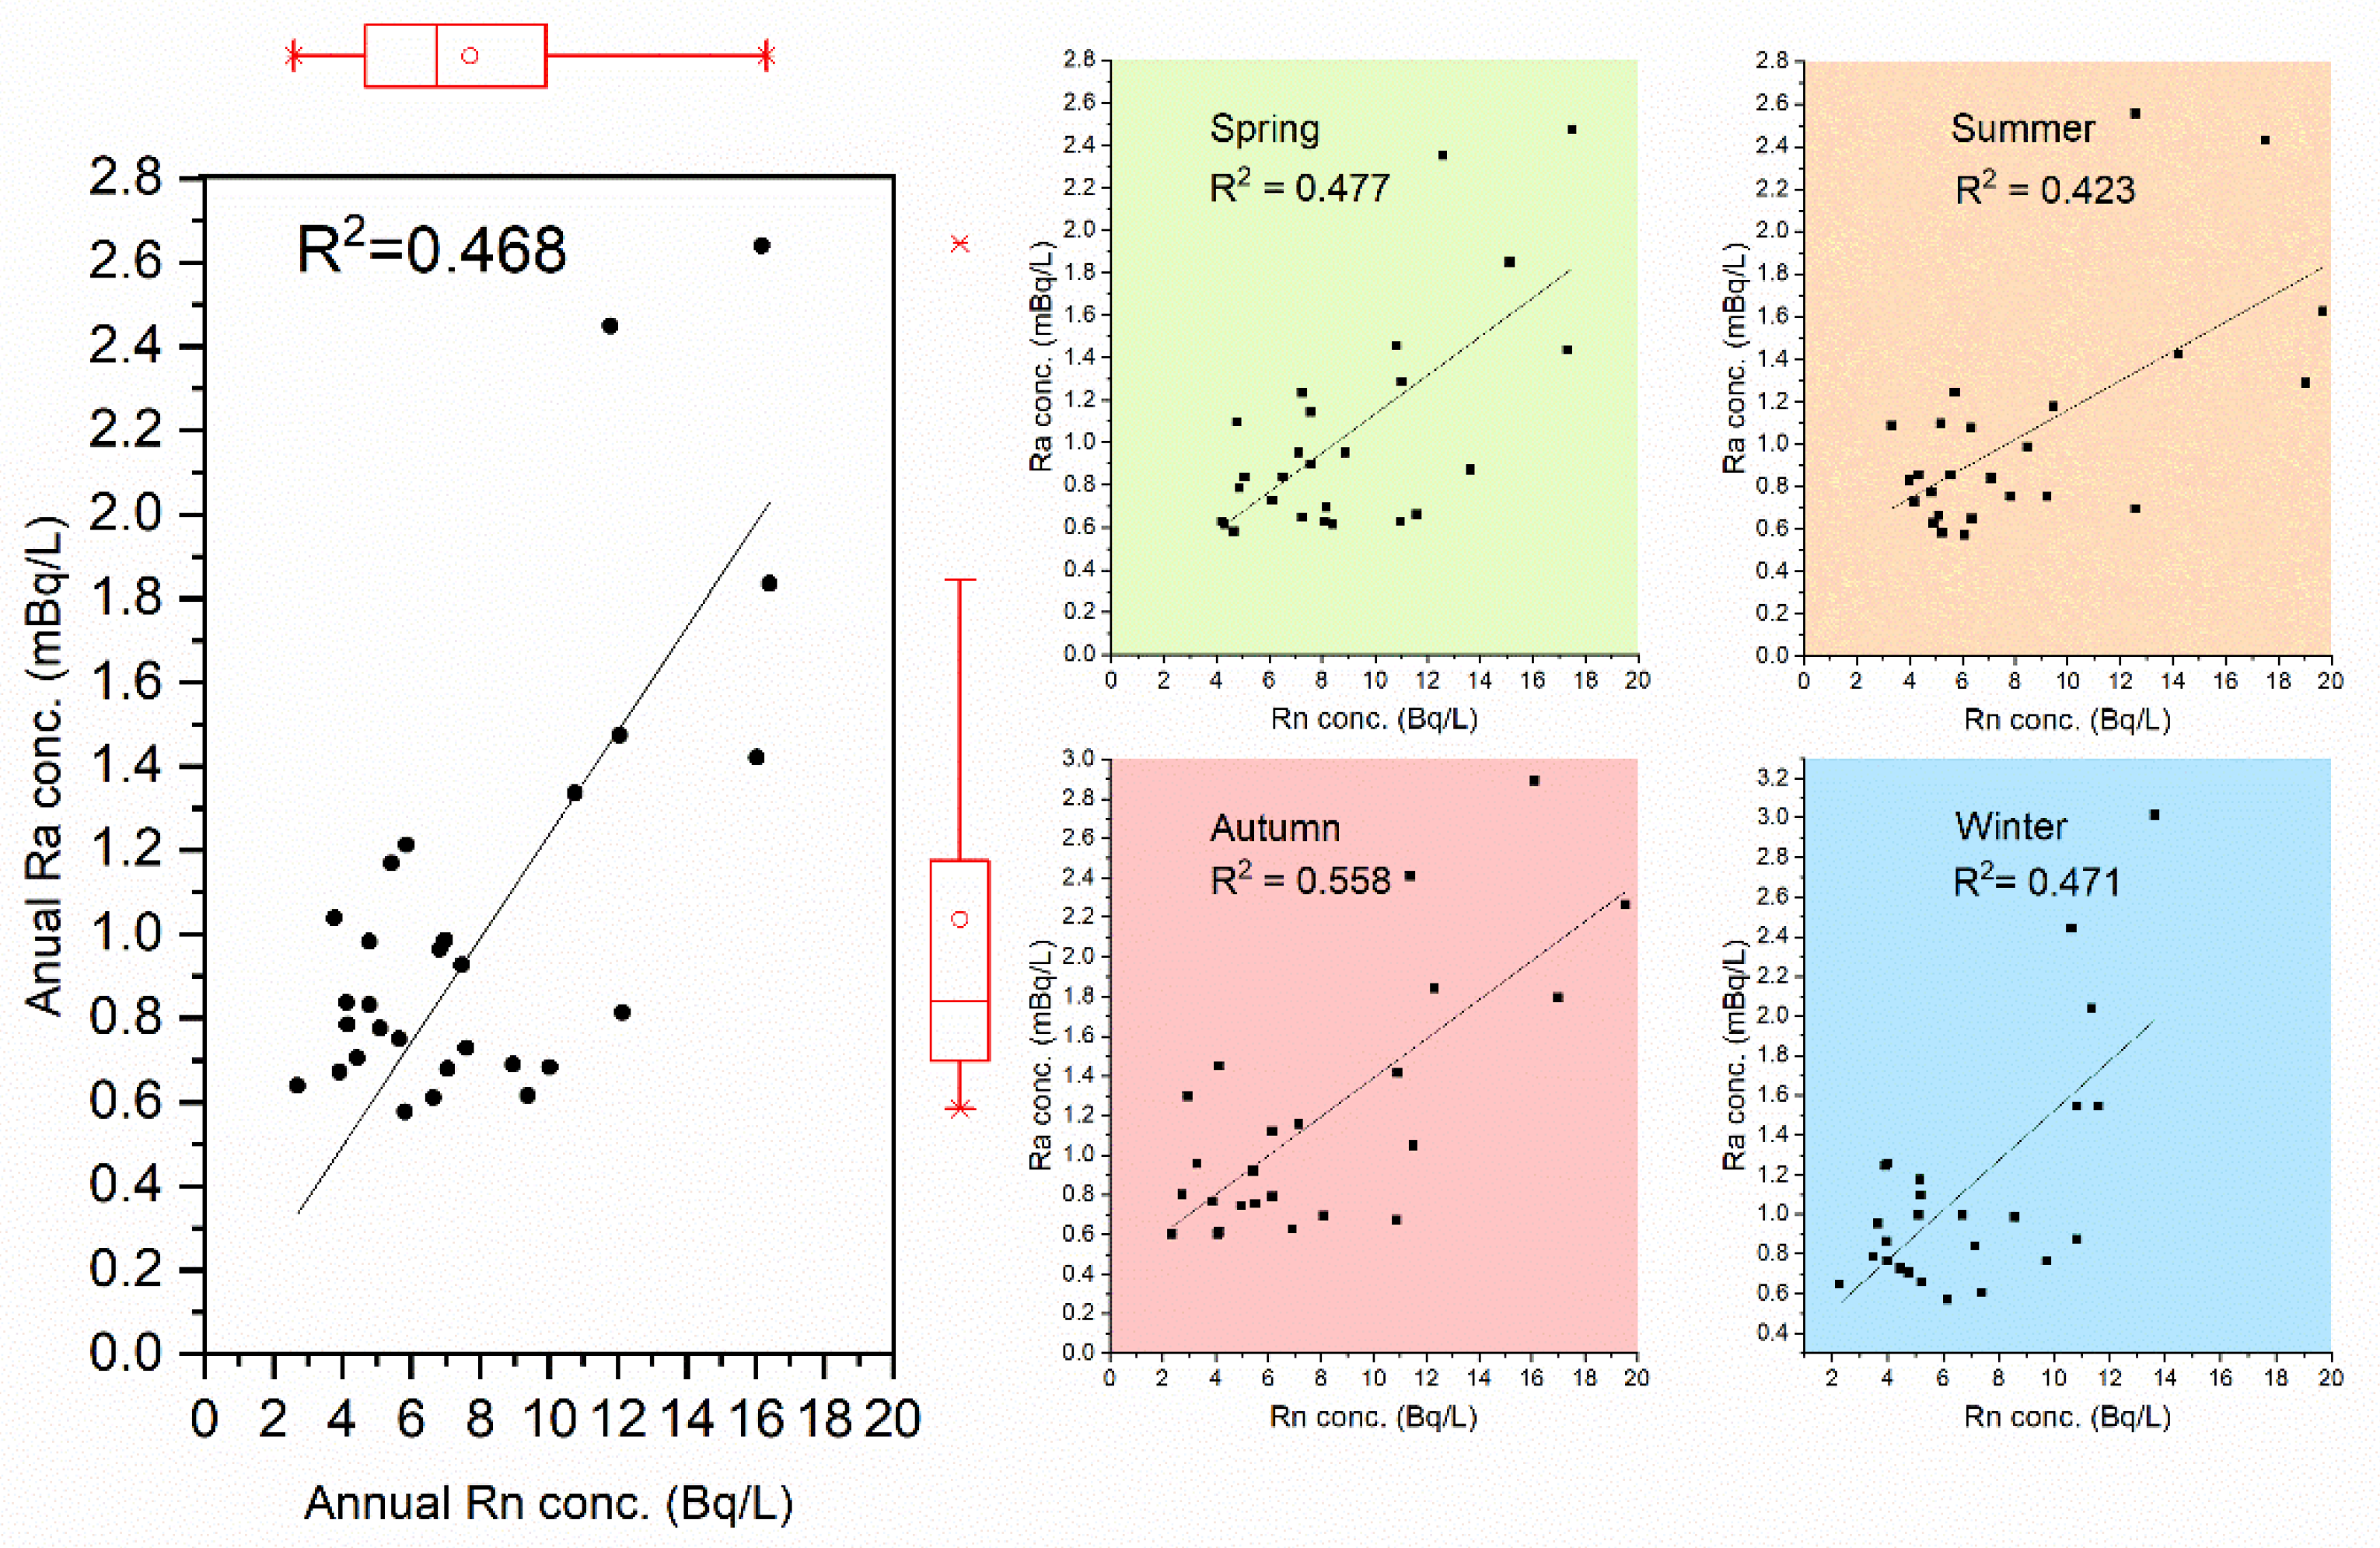
Figure 5 shows the correlations between the seasonal and annual radon and radium activity concentrations by calculating the Pearson correlation coefficient. A moderate correlation (0.65–0.75) was found between radon and radium measurements, regardless of the season in which the samples were taken.
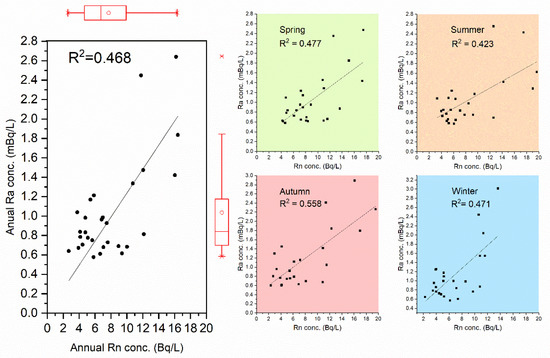
Figure 5.
The correlations between the seasonal (right) and annual (left) radon and radium concentrations.
3.3. Risk Assessment
The radiological health risks of 222Rn and 226Ra are mainly internal, occurring through inhalation and ingestion, and lead to dangerous health issues linked with the respiratory and digestive systems. Most of the cases of cancer attributed to radon in the household water supply arise from the inhalation of radioactive by-products produced by radon that has been released from the water into the air rather than from drinking the water. Furthermore, the increased level of indoor radon that is caused by using water in the home is generally small when compared with the level of indoor radon that originated in the soil beneath the home. Inhalation occurs during the degasification of radon when water is collected and used indoors, while ingestion occurs through the consumption of water containing radon and radium [38].
The consumption of the water investigated in the present study would lead to an annual effective dose of radon [31] between 9.8 × 10⁻⁶ and 6.0 × 10⁻⁵ mSv/y (Table 4). The highest risk was measured at the spring GWR17, though the radiological risk from the GWR4 spring could not be assessed during the period studied. The associated radiological risk, reported in terms of annual effective dose calculated for exposure to radium [34] dissolved in the investigated waters, was between 5.9 × 10⁻⁵ and 2.7 × 10⁻⁴ mSv/y. In this study, the average annual effective dose due to radon and radium dissolved in water samples was less than the WHO (World Health Organization’s) guideline value of 0.1 mSy/y [28].
Table 4.
Radon and radium annual activity concentrations and their associated dose calculated for the investigated karstic springs.
4. Conclusions
This study presents the first attempt at investigating the activity concentrations of radon and radium in Romanian karstic springs and at assessing their potential health hazards for users. The measured values do not exceed the radioprotection standards recommended by Romanian and European guidelines. The low concentrations clearly indicate that radon concentration in spring waters primarily depends on the lithology/geology, the tectonic structures and the presence of uranium minerals in the rock.
This article aims to undertake a risk assessment for exposure to radon in drinking water and thus to establish a link between radon in the air and water in terms of health impact. The radiological health risk for population exposure to radon and radium could be considered mainly internal, occurring through inhalation and ingestion, which leads to dangerous health issues linked with the respiratory and digestive systems. Inhalation occurs through the degasification of radon when water is collected and used indoors, while ingestion occurs through the consumption of water containing radon and radium.
Overall, in the investigated regions, there are no radiological protection requirements due to exposure to radon and radium from drinking water. The estimated doses from the consumption of water based on current preliminary results are insignificant when compared with other natural sources of radiation, such as indoor radon [39].
The correlation between radon and radium levels was moderate; 222Rn may have originated from differences in the geological characteristics of the underground pathways of each of the water sources. Locations where the radon concentration values exceeded the EPA-recommended limits should be monitored for a period of time to confirm these values. Monitoring these sources, especially those showing high fluctuations in radon concentration, would be an important way to prevent the possible radiologic risk caused by water ingestion and would contribute to a better understanding of the distribution of radioactive gases in Romanian groundwater.
Author Contributions
Conceptualization, A.L.C., M.C.M., B.D.B. and O.T.M.; Formal analysis, T.D.; Investigation, B.D.B. and O.T.M.; Methodology, A.L.C. and M.C.M.; Project administration, A.L.C.; Validation, T.D. and O.T.M. Writing—original draft, M.C.M. and B.D.B.; Writing—review & editing, T.D. All authors have read and agreed to the published version of the manuscript.
Funding
This study was financially supported by the EEA Financial Mechanism 2014–2021 under the project EEA-RO-NO-2018-0138 (GROUNDWATERISK), contract No. 4/2019.
Institutional Review Board Statement
Not applicable.
Informed Consent Statement
Not applicable.
Data Availability Statement
Data sharing not applicable.
Acknowledgments
We are grateful to our colleagues Ionuț Cornel Mirea for the map; Marius Kenesz, Traian Brad, Răzvan Adrian Arghir, and Alexandru Petculescu for sampling the spring water; and Horia Banciu for the suggestions in improving the manuscript.
Conflicts of Interest
The authors declare no conflict of interest.
References
- Nazaroff, W.W. Radon Transport from Soil to Air. Rev. Geophys. 1992, 30, 137–160. [Google Scholar] [CrossRef]
- Moreno, V.; Bach, J.; Baixeras, C.; Font, L. Radon Levels in Groundwaters and Natural Radioactivity in Soils of the Volcanic Region of La Garrotxa, Spain. J. Environ. Radioact. 2014, 128, 1–8. [Google Scholar] [CrossRef]
- Vinson, D.S.; Vengosh, A.; Hirschfeld, D.; Dwyer, G.S. Relationships between Radium and Radon Occurrence and Hydrochemistry in Fresh Groundwater from Fractured Crystalline Rocks, North Carolina (USA). Chem. Geol. 2009, 260, 159–171. [Google Scholar] [CrossRef] [Green Version]
- Dickson, B.L. The Environmental Behaviour of Radium; IAEA: Vienna, Austria, 1990; Volume 1, pp. 335–372. ISBN 92-0-125090-8. ISSN 0074-1914. Available online: https://inis.iaea.org/collection/NCLCollectionStore/_Public/21/039/21039568.pdf?r=1&r=1 (accessed on 20 July 2021).
- Roba, C.A.; Niţă, D.; Cosma, C.; Codrea, V.; Olah, S. Correlations between Radium and Radon Occurrence and Hydrogeochemical Features for Various Geothermal Aquifers in Northwestern Romania. Geothermics 2012, 42, 32–46. [Google Scholar] [CrossRef]
- Almeida, R.M.; Lauria, D.C.; Ferreira, A.C.; Sracek, O. Groundwater Radon, Radium and Uranium Concentrations in Região Dos Lagos, Rio de Janeiro State, Brazil. J. Environ. Radioact. 2004, 73, 323–334. [Google Scholar] [CrossRef] [PubMed]
- Cosma, C.; Moldovan, M.; Dicu, T.; Kovacs, T. Radon in Water from Transylvania (Romania). Radiat. Meas. 2008, 43, 1423–1428. [Google Scholar] [CrossRef]
- Luo, X.; Jiao, J.J. Unraveling Controlling Factors of Concentration Discharge Relationships in a Fractured Aquifer Dominant Spring-Shed: Evidence from Mean Transit Time and Radium Reactive Transport Model. J. Hydrol. 2019, 571, 528–544. [Google Scholar] [CrossRef]
- Duque, C.; Knee, K.L.; Russoniello, C.J.; Sherif, M.; Abu Risha, U.A.A.; Sturchio, N.C.; Michael, H.A. Hydrogeological Processes and near Shore Spatial Variability of Radium and Radon Isotopes for the Characterization of Submarine Groundwater Discharge. J. Hydrol. 2019, 579, 124192. [Google Scholar] [CrossRef]
- Miklyaev, P.S.; Petrova, T.B.; Marennyy, A.M.; Shchitov, D.V.; Sidyakin, P.A.; Murzabekov, M.A.; Lopatin, M.N. High Seasonal Variations of the Radon Exhalation from Soil Surface in the Fault Zones (Baikal and North Caucasus Regions). J. Environ. Radioact. 2020, 219, 106271. [Google Scholar] [CrossRef] [PubMed]
- Sahoo, S.K.; Katlamudi, M.; Barman, C.; Lakshmi, G.U. Identification of Earthquake Precursors in Soil Radon-222 Data of Kutch, Gujarat, India Using Empirical Mode Decomposition Based Hilbert Huang Transform. J. Environ. Radioact. 2020, 222, 106353. [Google Scholar] [CrossRef]
- Kawabata, K.; Sato, T.; Takahashi, H.A.; Tsunomori, F.; Hosono, T.; Takahashi, M.; Kitamura, Y. Changes in Groundwater Radon Concentrations Caused by the 2016 Kumamoto Earthquake. J. Hydrol. 2020, 584, 124712. [Google Scholar] [CrossRef]
- Wen, H.; Cheng, X.; Fan, S.; Xu, Y.; Ren, S.; Guo, J. A method for detecting hidden fire source in deep mine goafs based on radon measurement and its experimental verification. J. Appl. Geochem. 2020, 117, 104603. [Google Scholar] [CrossRef]
- Chambers, S.D.; Podstawczyńska, A. Characterizing Urban Pollution Variability in Central Poland Using Radon-222. Nukleonika 2020, 65, 59–65. [Google Scholar] [CrossRef]
- Vives i Batlle, J.; Ulanovsky, A.; Copplestone, D. A Method for Assessing Exposure of Terrestrial Wildlife to Environmental Radon (222Rn) and Thoron (220Rn). Sci. Total Environ. 2017, 605–606, 569–577. [Google Scholar] [CrossRef]
- Gaskin, J.; Doug, C.; Whyte, J.; Krewksi, D. Global Estimate of Lung Cancer Mortality Attributable to Residential Radon. Environ. Health Perspect. 2018, 126, 1–8. [Google Scholar] [CrossRef] [PubMed]
- Inácio, M.; Soares, S.; Almeida, P. Radon Concentration Assessment in Water Sources of Public Drinking of Covilhã’s County, Portugal. J. Radiat. Res. 2017, 10, 135–139. [Google Scholar] [CrossRef] [Green Version]
- Dicu, T.; Burghele, B.D.; Cucos, A.; Mishra, R.; Sapra, B.K. Assessment of annual effective dose from exposure to natural radioactivity sources in a case-control study in Bihor County, Romania. Radiat. Prot. Dosim. 2019, 185, 15–24. [Google Scholar] [CrossRef]
- Burghele, B.; Ţenter, A.; Cucoş, A.; Dicu, T.; Moldovan, M.; Papp, B.; Szacsvai, K. The first Large-Scale Mapping of Radon Concentration in Soil Gas and Water in Romania. Sci. Total Environ. 2019, 669, 887–892. [Google Scholar] [CrossRef]
- Nita, D.C.; Moldovan, M.; Sferle, T.; Ona, V.D.; Burghele, B.D. Radon Concentrations in Water and Indoor Air in North-West Regions of Romania. Cancer 2013, 2, 3. [Google Scholar]
- Khursheed, A. Doses to systemic tissues from radon gas. Radiat. Prot. Dosim. 2000, 88, 171–181. [Google Scholar] [CrossRef]
- Moldovan, O.T.; Constantin, S.; Cheval, S. Drip heterogeneity and the impact of decreased flow rates on the vadose zone fauna in Ciur-Izbuc Cave, NW Romania. Ecohydrology 2018, 11, e2028. [Google Scholar] [CrossRef]
- Moldovan, A.; Hoaghia, M.A.; Kovacs, E.; Mirea, I.C.; Kenesz, M.; Arghir, R.A.; Petculescu, A.; Levei, E.A.; Moldovan, O.T. Quality and Health Risk Assessment Associated with Water Consumption—A Case Study on Karstic Springs. Water 2020, 12, 3510. [Google Scholar] [CrossRef]
- Hoaghia, M.A.; Moldovan, A.; Kovacs, E.; Mirea, I.C.; Kenesz, M.; Brad, T.; Cadar, O.; Micle, V.; Levei, E.A.; Moldovan, O.T. Water Quality and Hydrogeochemical Characteristics of Some Karst Water Sources in Apuseni Mountains, Romania. Water 2021, 13, 857. [Google Scholar] [CrossRef]
- Moldovan, O.; Skoglund, R.Ø.; Banciu, H.L.; Cucoș, A.; Levei, E.A.; Perșoiu, A.; Lauritzen, S.E. Monitoring and Risk Assessment for Groundwater Sources in Rural Communities of Romania (GROUNDWATERISK). Res. Ideas Outcomes 2019, 1–20. Available online: https://bora.uib.no/bora-xmlui/handle/1956/23613 (accessed on 20 July 2021). [CrossRef] [Green Version]
- National Primary Drinking Water Regulations; Radon-222. Available online: https://www.federalregister.gov/documents/1999/11/02/99-27741/national-primary-drinking-water-regulations-radon-222 (accessed on 20 July 2021).
- Guidelines for Drinking-Water Quality, 4th ed.; Incorporating the 1st Addendum; Available online: https://www.who.int/publications/i/item/9789241549950 (accessed on 24 April 2017).
- Sources-to-Effects Assessment for Radon in Homes and Workplaces. Available online: https://ci.nii.ac.jp/naid/10026964099/#cit (accessed on 20 July 2019).
- Thivya, C.; Chidambaram, R.; Thilagavathi, R.; Keesari, T.; Rao, M.S.; Prasanna, M.V.; Nepolian, M. Occurrence of High Uranium and Radon in Hard Rock Aquifers of South India–Evaluating the Temporal and Spatial Trends. Groundw. Sustain. Dev. 2015, 1, 68–77. [Google Scholar] [CrossRef]
- Mullinger, N.J.; Binley, A.M.; Pates, J.M.; Crook, N.P. Radon in Chalk Streams: Spatial and Temporal Variation of Groundwater Sources in the Pang and Lambourn Catchments, UK. J. Hydrol. 2007, 339, 172–182. [Google Scholar] [CrossRef] [Green Version]
- Official Journal. Official Journal of the European Union. 2013, Volume 56, p. 216. Available online: https://eur-lex.europa.eu/legal-content/EN/TXT/PDF/?uri=OJ:C:2013:216:FULL&from=EL (accessed on 30 July 2013).
- Jobbágy, V.; Hult, M. Performance Evaluation of a European Scale Proficiency Test on Radon-in-Water Measurements in Europe. Appl. Radiat. Isot. 2020, 160, 109111. [Google Scholar] [CrossRef]
- Moldovan, M.; Benea, V.; Niţă, D.C.; Papp, B.; Burghele, B.D.; Bican-Brişan, N.; Cosma, C. Radon and Radium Concentration in Water from North-West of Romania and the Estimated Doses. Radiat. Prot. Dosim. 2014, 162, 96–100. [Google Scholar] [CrossRef] [PubMed]
- International Atomic Energy Agency. International Basic Safety Standards for Protection against Ionizing Radiation and for the Safety of Radiation Sources, CD-ROM ed.; Safety Series No. 115/CD; IAEA: Vienna, Austria, 2003; Available online: https://www.iaea.org/publications/6900/international-basic-safety-standards-for-protection-against-ionizing-radiation-and-for-the-safety-of-radiation-sources-cd-rom-edition-2003 (accessed on 20 July 2021).
- International Institute of Public Health. Establishing the Requirements for Protection of Human Health as Regards Radioactive Substances in Drinking Water. Available online: http://legislatie.just.ro/Public/DetaliiDocumentAfis/173618 (accessed on 27 November 2015).
- Shu’aibu, H.K.; Khandaker, M.U.; Baballe, A.; Tata, S.; Adamu, M.A. Determination of Radon Concentration in Groundwater of Gadau, Bauchi State, Nigeria and Estimation of Effective Dose. Radiat. Phys. Chem. 2020, 178, 108934. [Google Scholar] [CrossRef]
- Seminsky, K.Z.; Seminsky, A.K. Radon Concentration in Groundwater Sources of the Baikal Region (East Siberia, Russia). J. Appl. Geochem. 2019, 111, 104446. [Google Scholar] [CrossRef]
- Tirmarche, M.; Harrison, J.D.; Laurier, D.; Paquet, F.; Blanchardon, E.; Marsh, J.W. Lung Cancer Risk from Radon and Progeny and Statement on Radon. Ann. ICRP 2010, 40, 115. Available online: https://www.icrp.org/publication.asp?id=icrp%20publication%20115 (accessed on 20 July 2010).
- Cucos, A.; Papp, B.; Dicu, T.; Moldovan, M.; Burghele, B.D.; Moraru, I.T.; Țenter, A.; Cosma, C. Residential, soil and water radon surveys in north-western part of Romania. J. Environ. Radioact. 2017, 166, 412–416. [Google Scholar] [CrossRef] [PubMed]
Publisher’s Note: MDPI stays neutral with regard to jurisdictional claims in published maps and institutional affiliations. |
© 2021 by the authors. Licensee MDPI, Basel, Switzerland. This article is an open access article distributed under the terms and conditions of the Creative Commons Attribution (CC BY) license (https://creativecommons.org/licenses/by/4.0/).