Spatiotemporal Characteristics and Statistical Model Prediction of Potential Evaporation during the Growing Season in Ningxia
Abstract
:1. Introduction
2. Study Area, Dataset and Methods
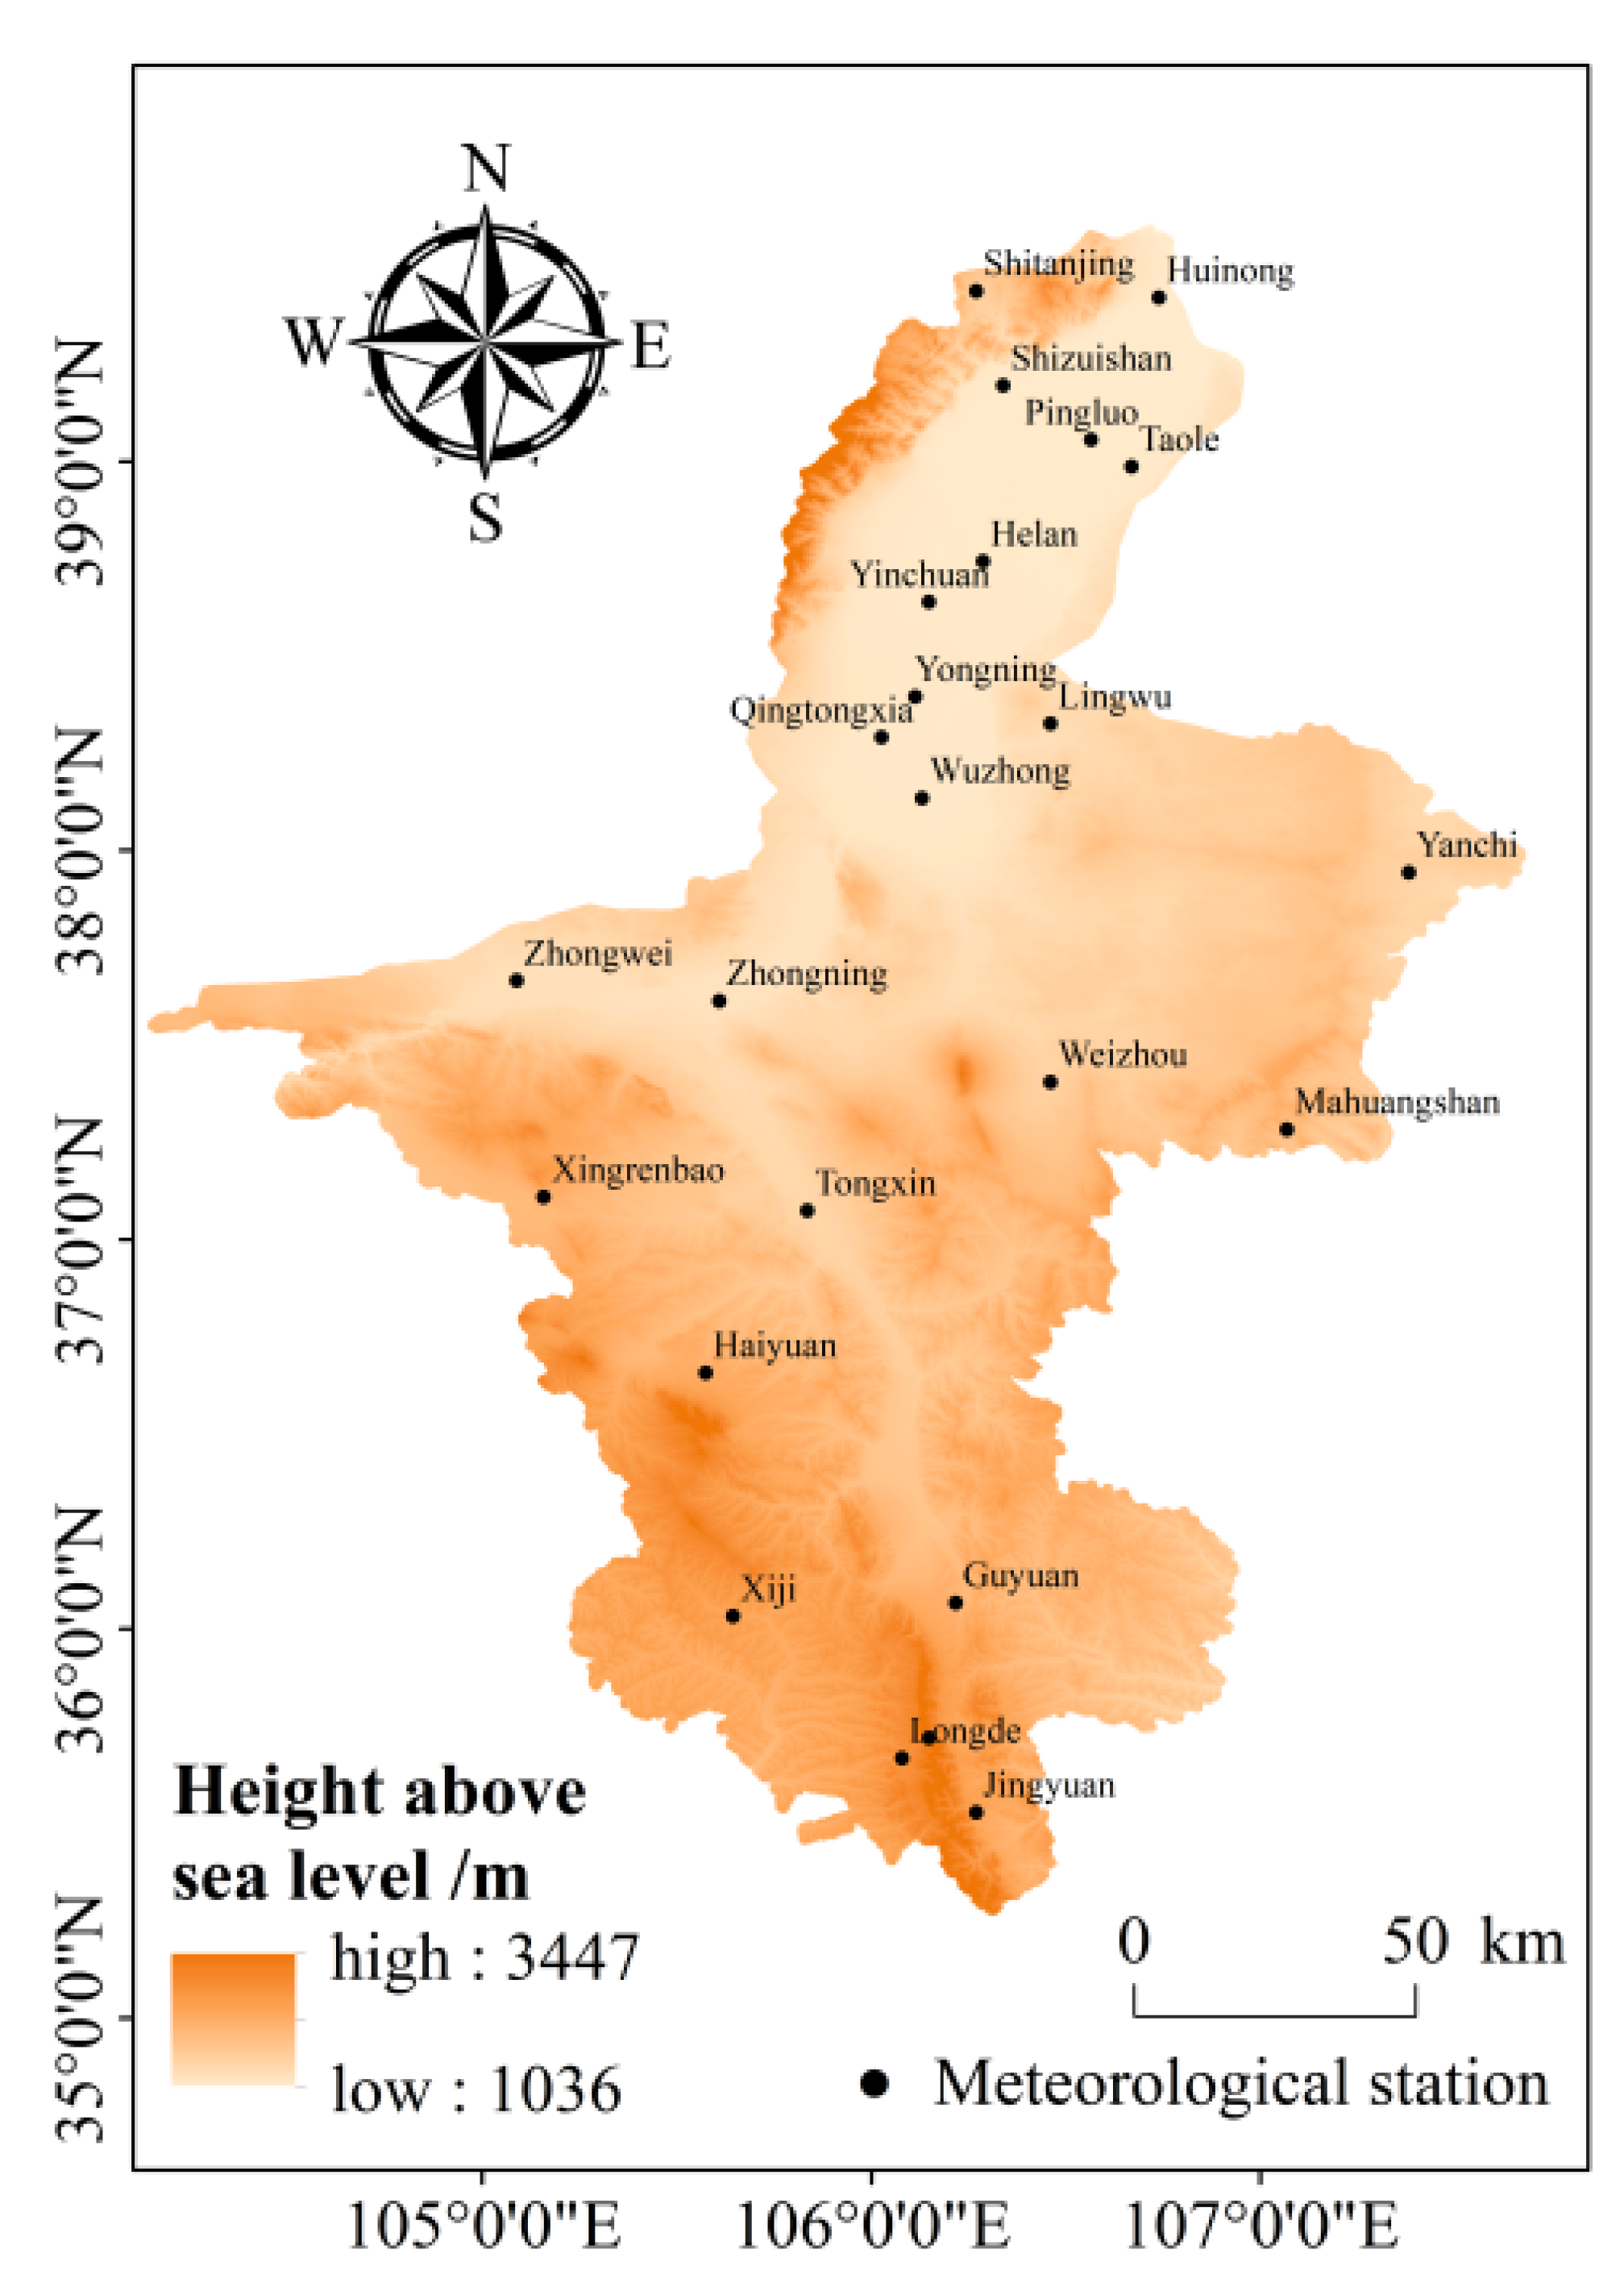
2.1. Study Area
2.2. Meteorological Data Sources
2.3. Research Methods
2.3.1. Penman–Monteith Equation (ET0)
2.3.2. Pearson Correlation Analysis
2.3.3. Variance Inflation Factor (VIF)
2.3.4. Mean Absolute Error (MAE)
2.3.5. Root Mean Square Error (RMSE)
2.3.6. Mean Absolute Percentage Error (MAPE)
2.3.7. Mann–Kendall Trend Test
3. Results and Analysis
3.1. Distribution and Trend of Potential Evaporation
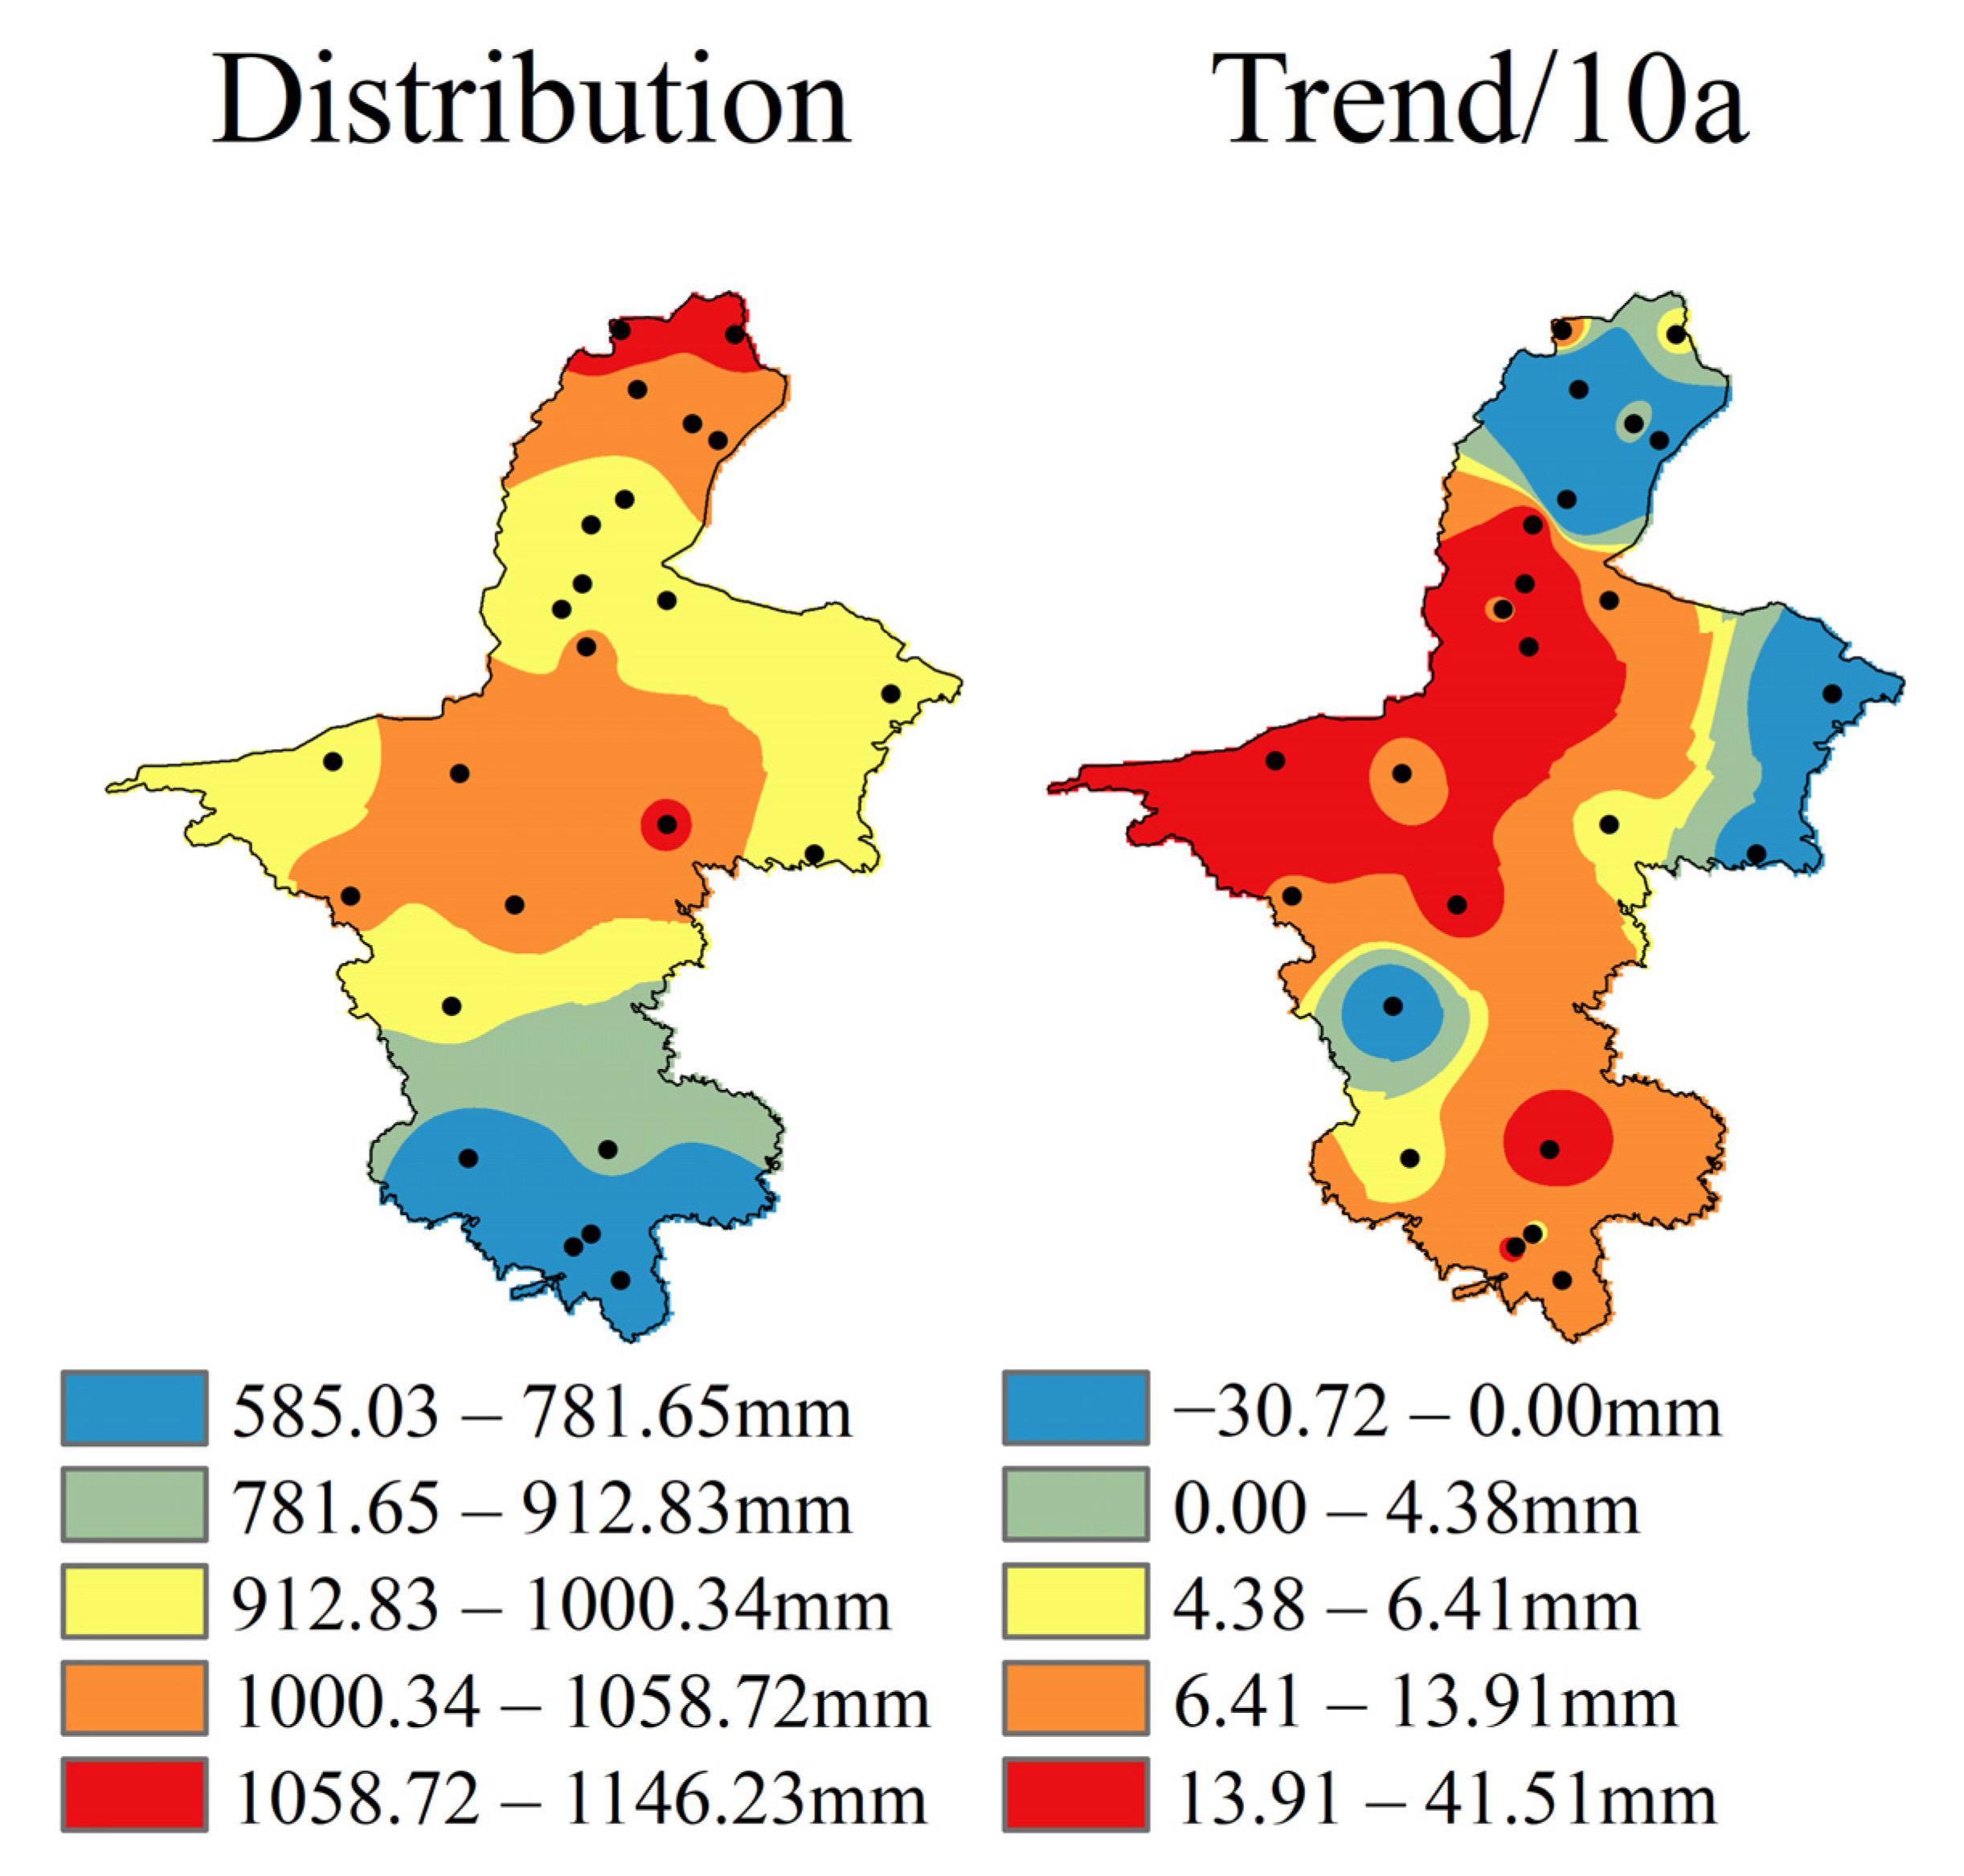
3.1.1. Distribution and Trend of Potential Evaporation in the Growing Season
3.1.2. Monthly Potential Evaporation Distribution and Trend in the Growing Season
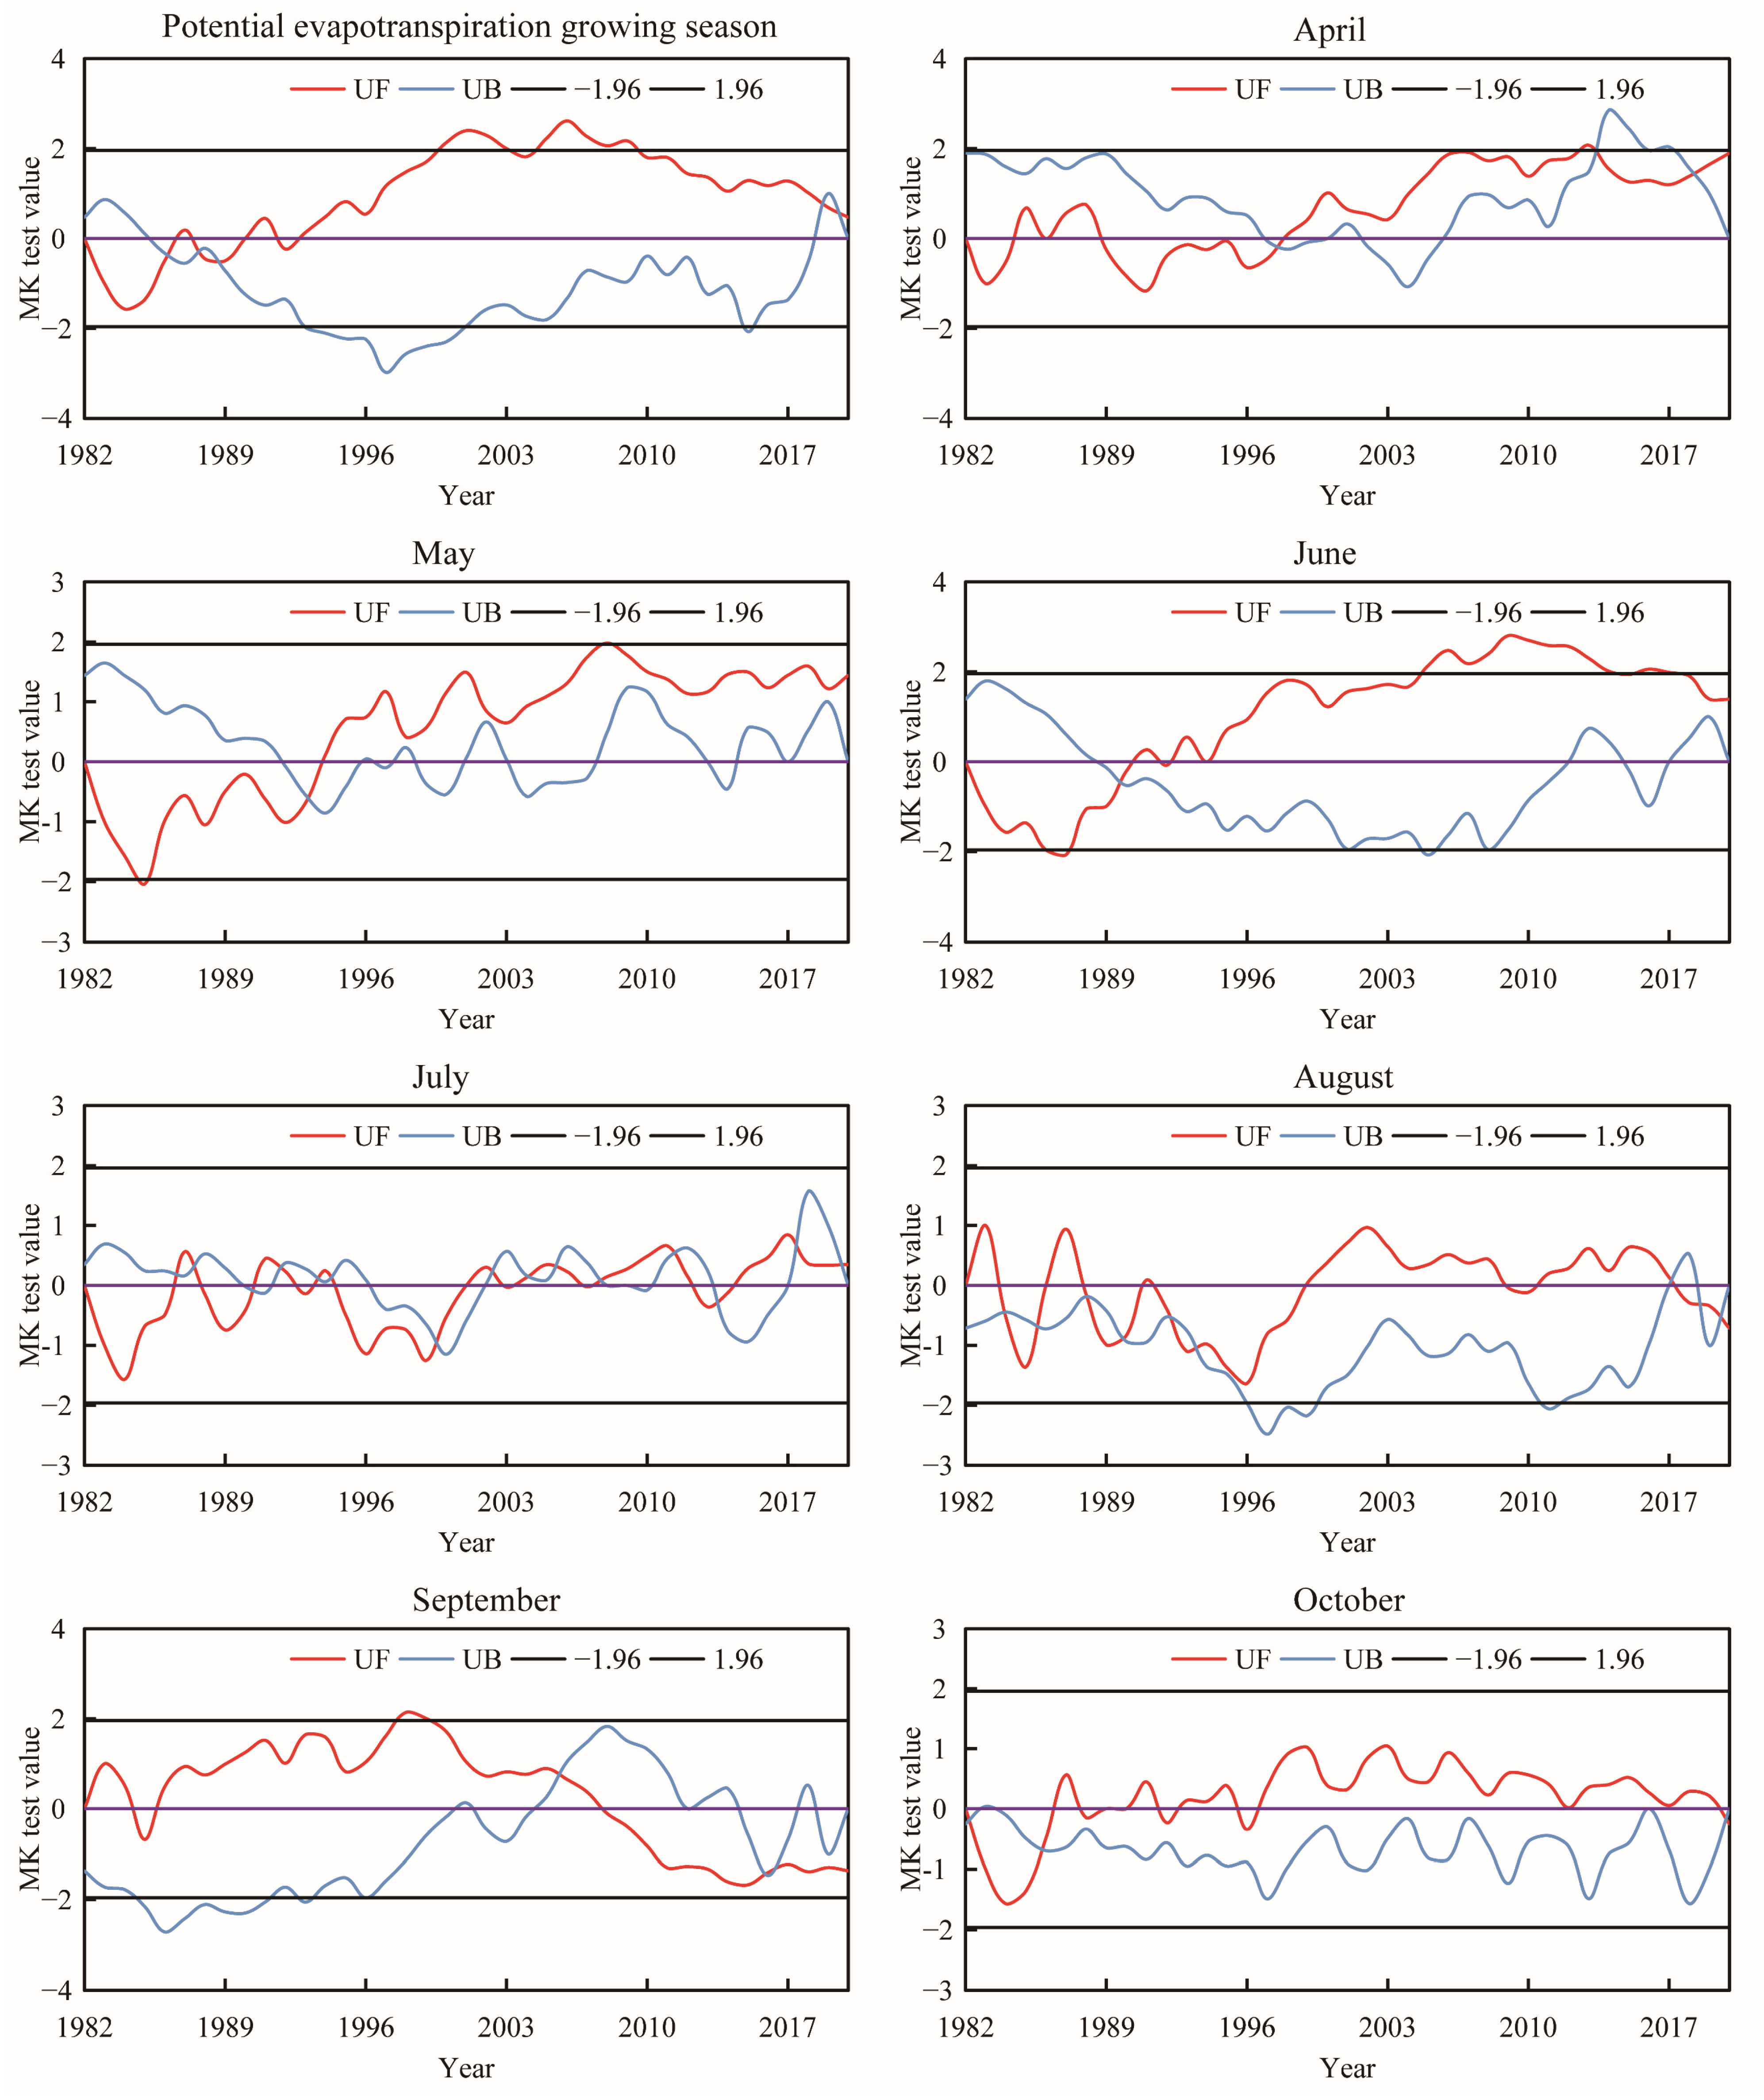
3.1.3. Time Evolution Trend and Mutation of Potential Evaporation
3.2. Prediction of Potential Evaporation
3.2.1. Factor Screening and Model Construction
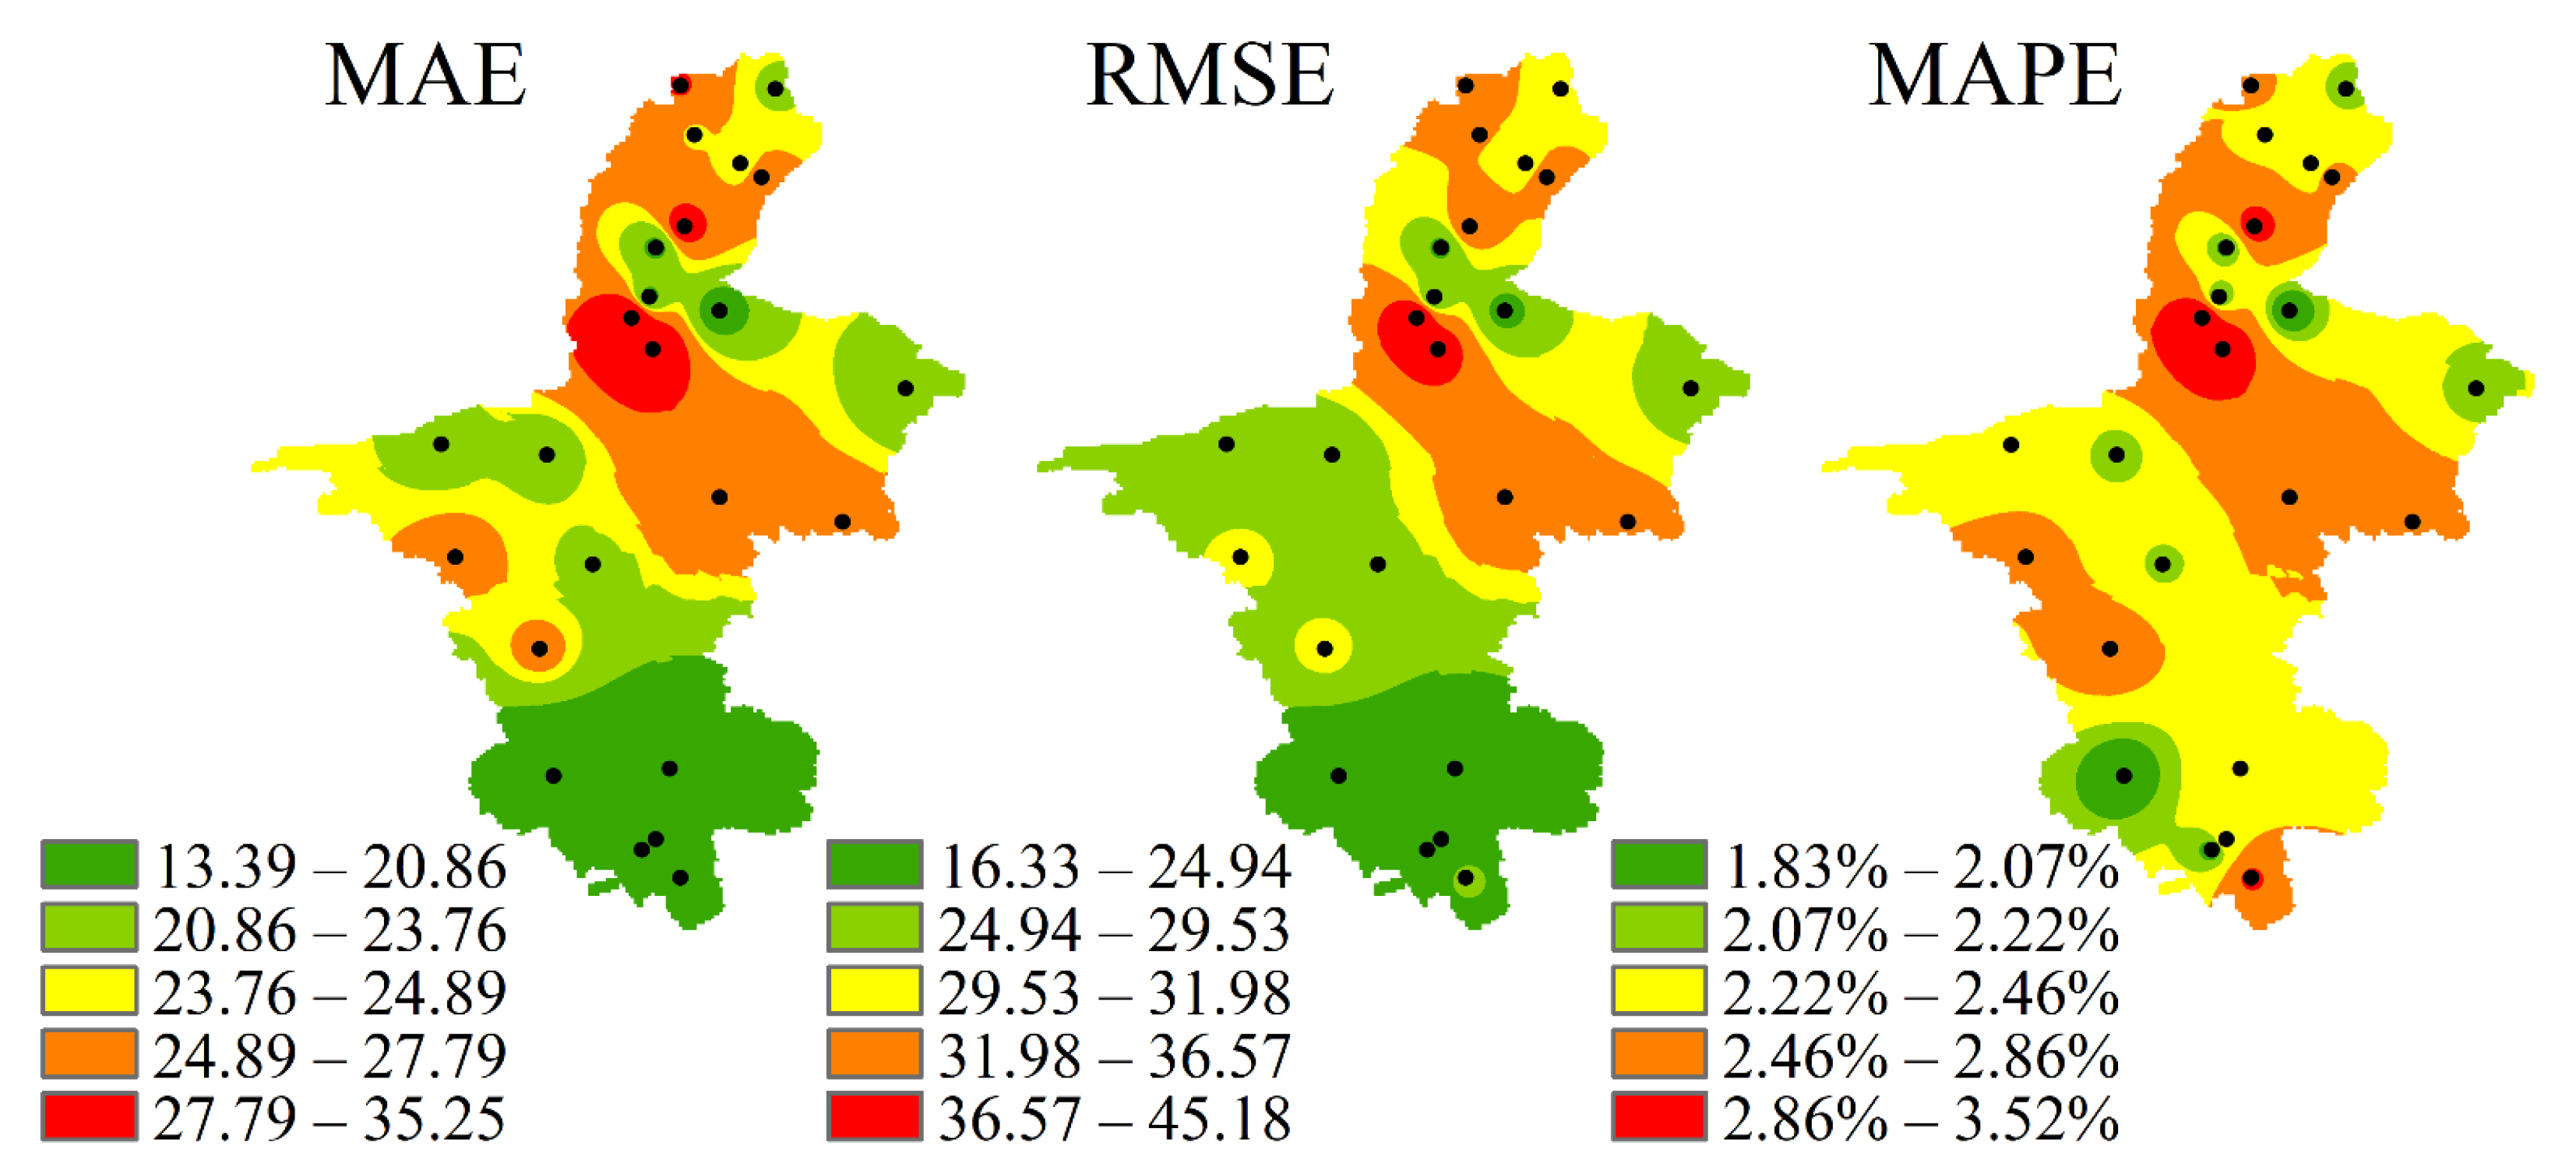
3.2.2. Establishment and Verification of the Potential Evaporation Prediction Model in the Growing Season
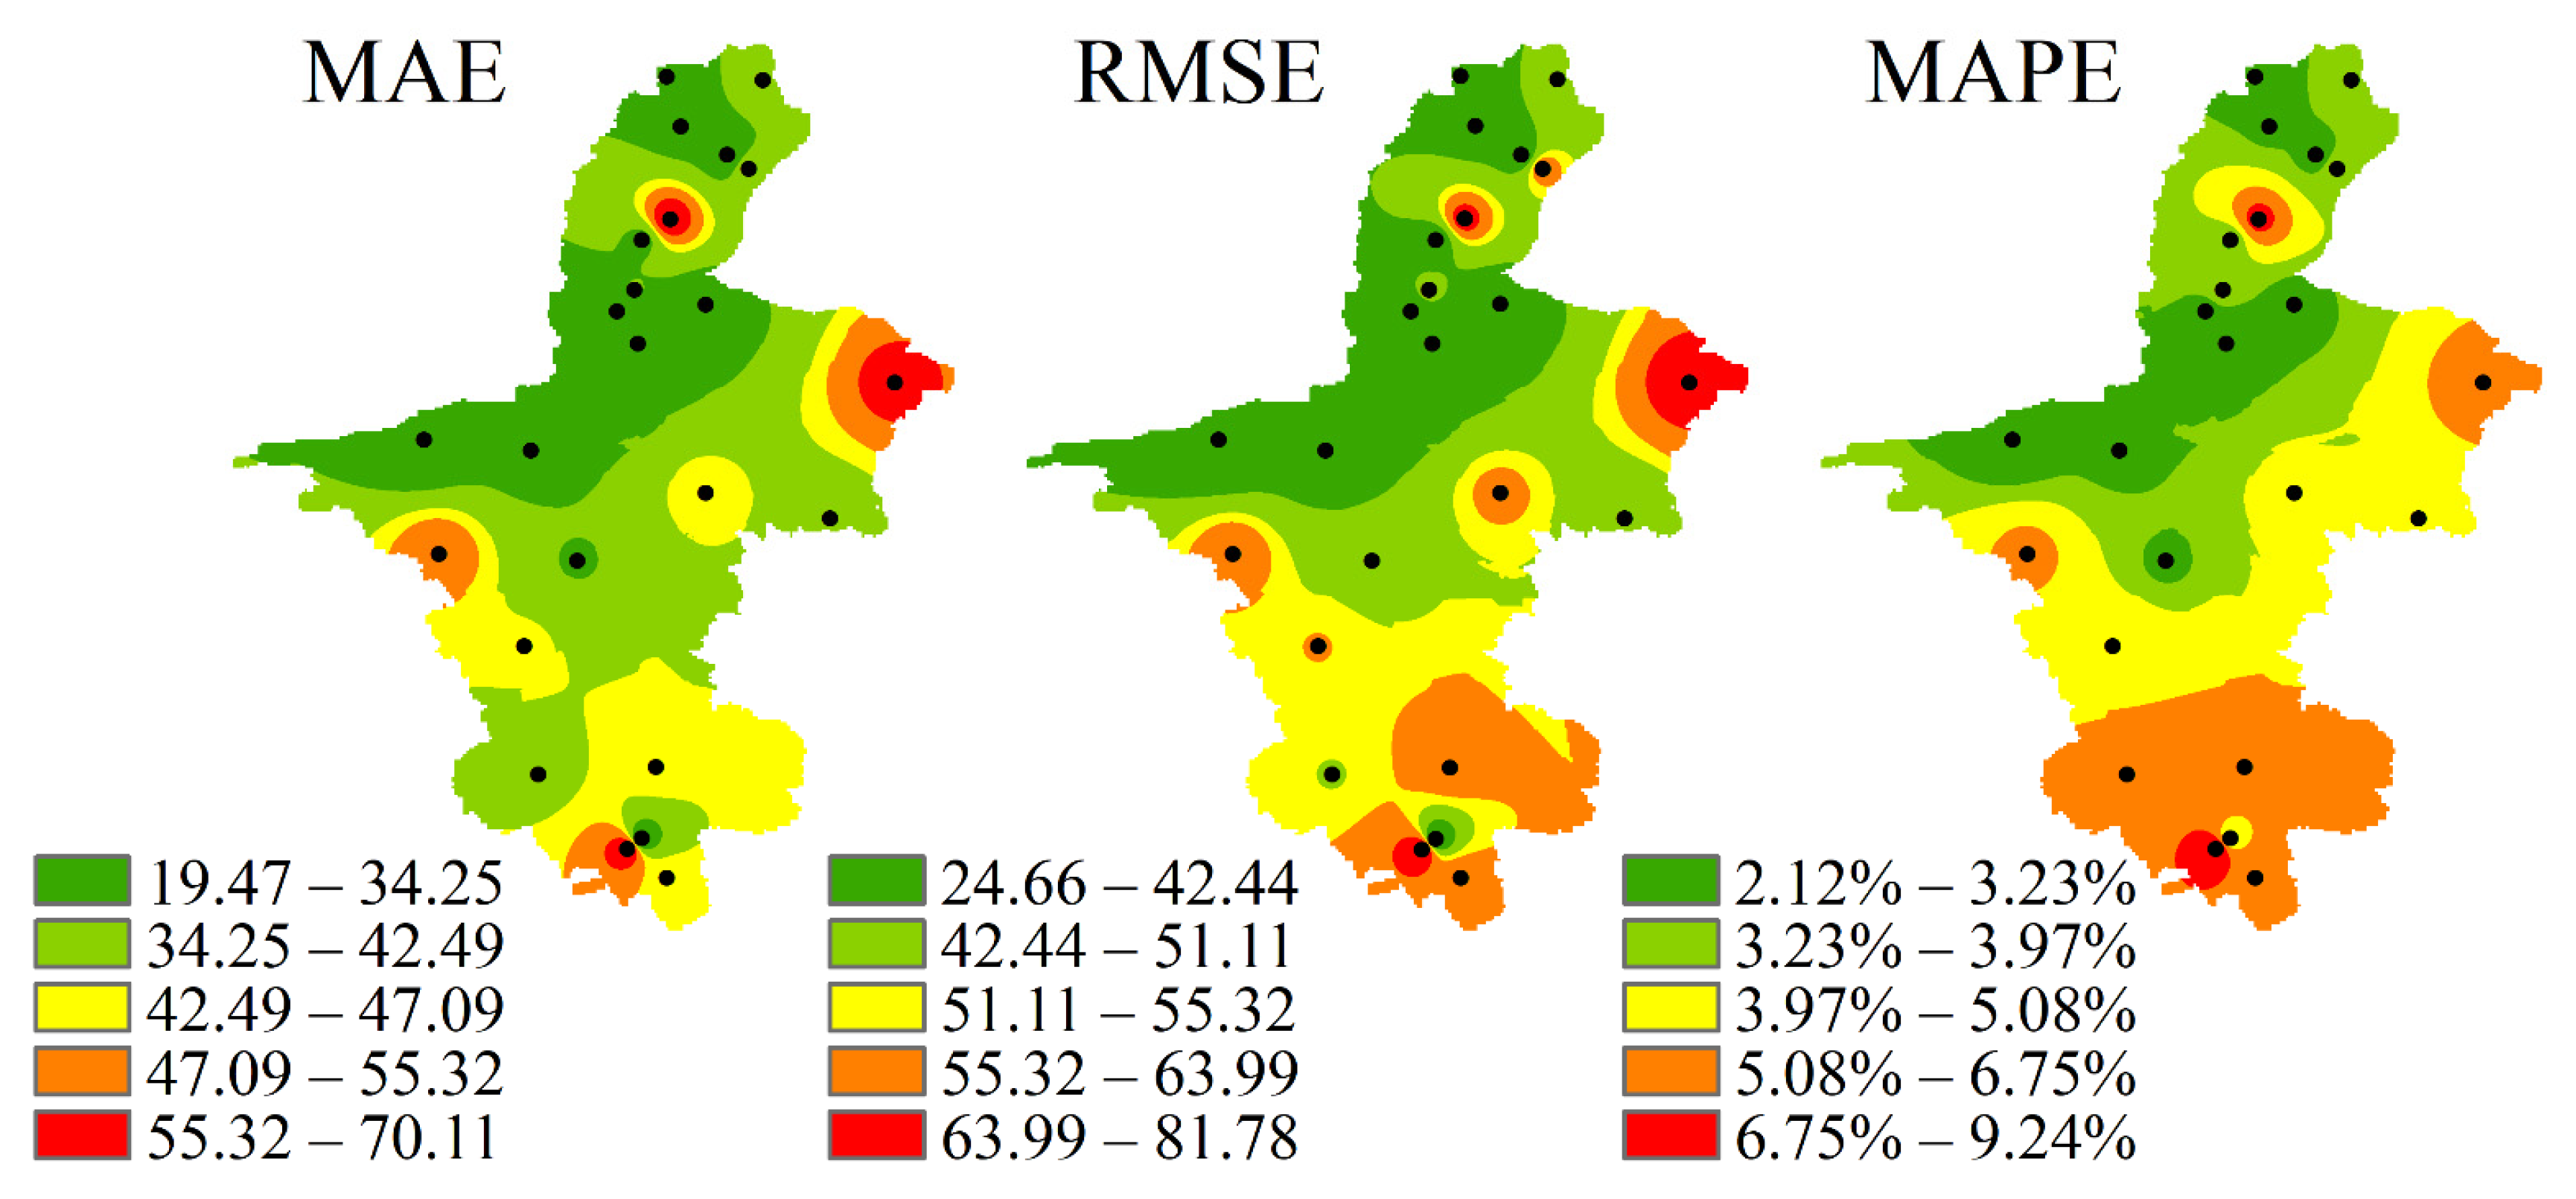
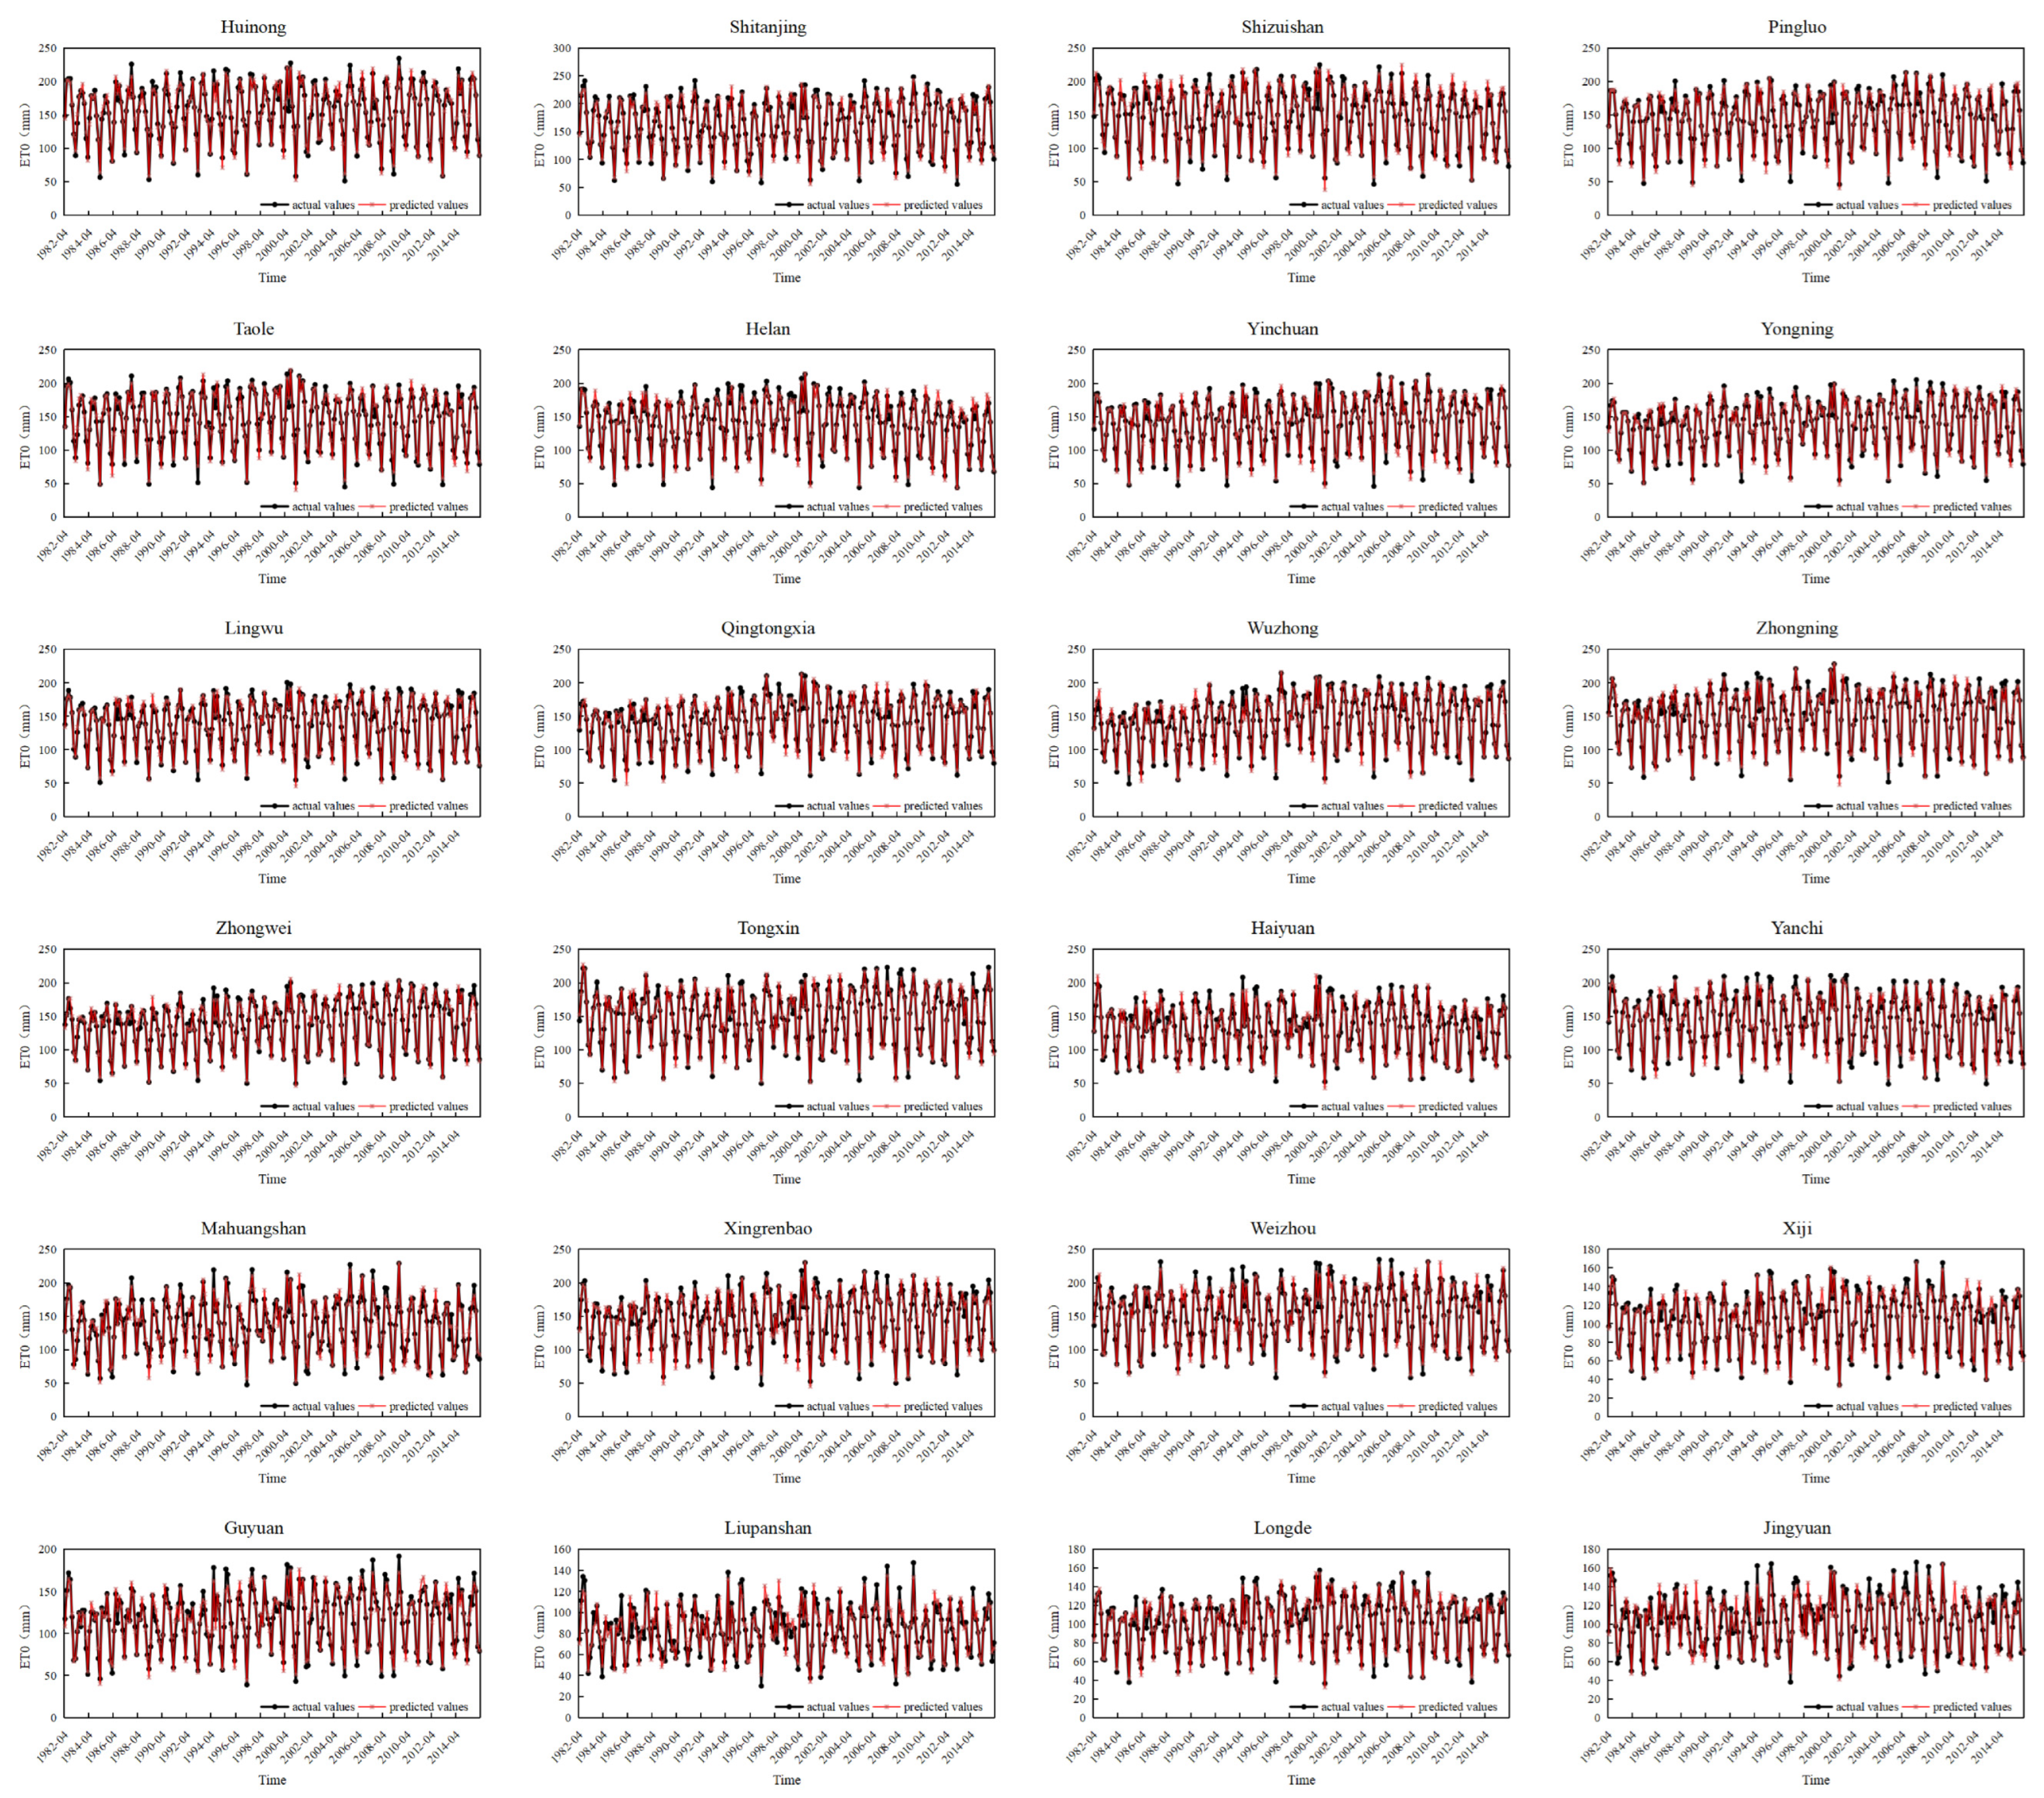
3.2.3. Fitting Back-Generation of Potential Evaporation in the Growing Season
3.2.4. Extrapolated Forecast of Potential Evaporation during the Growing Season
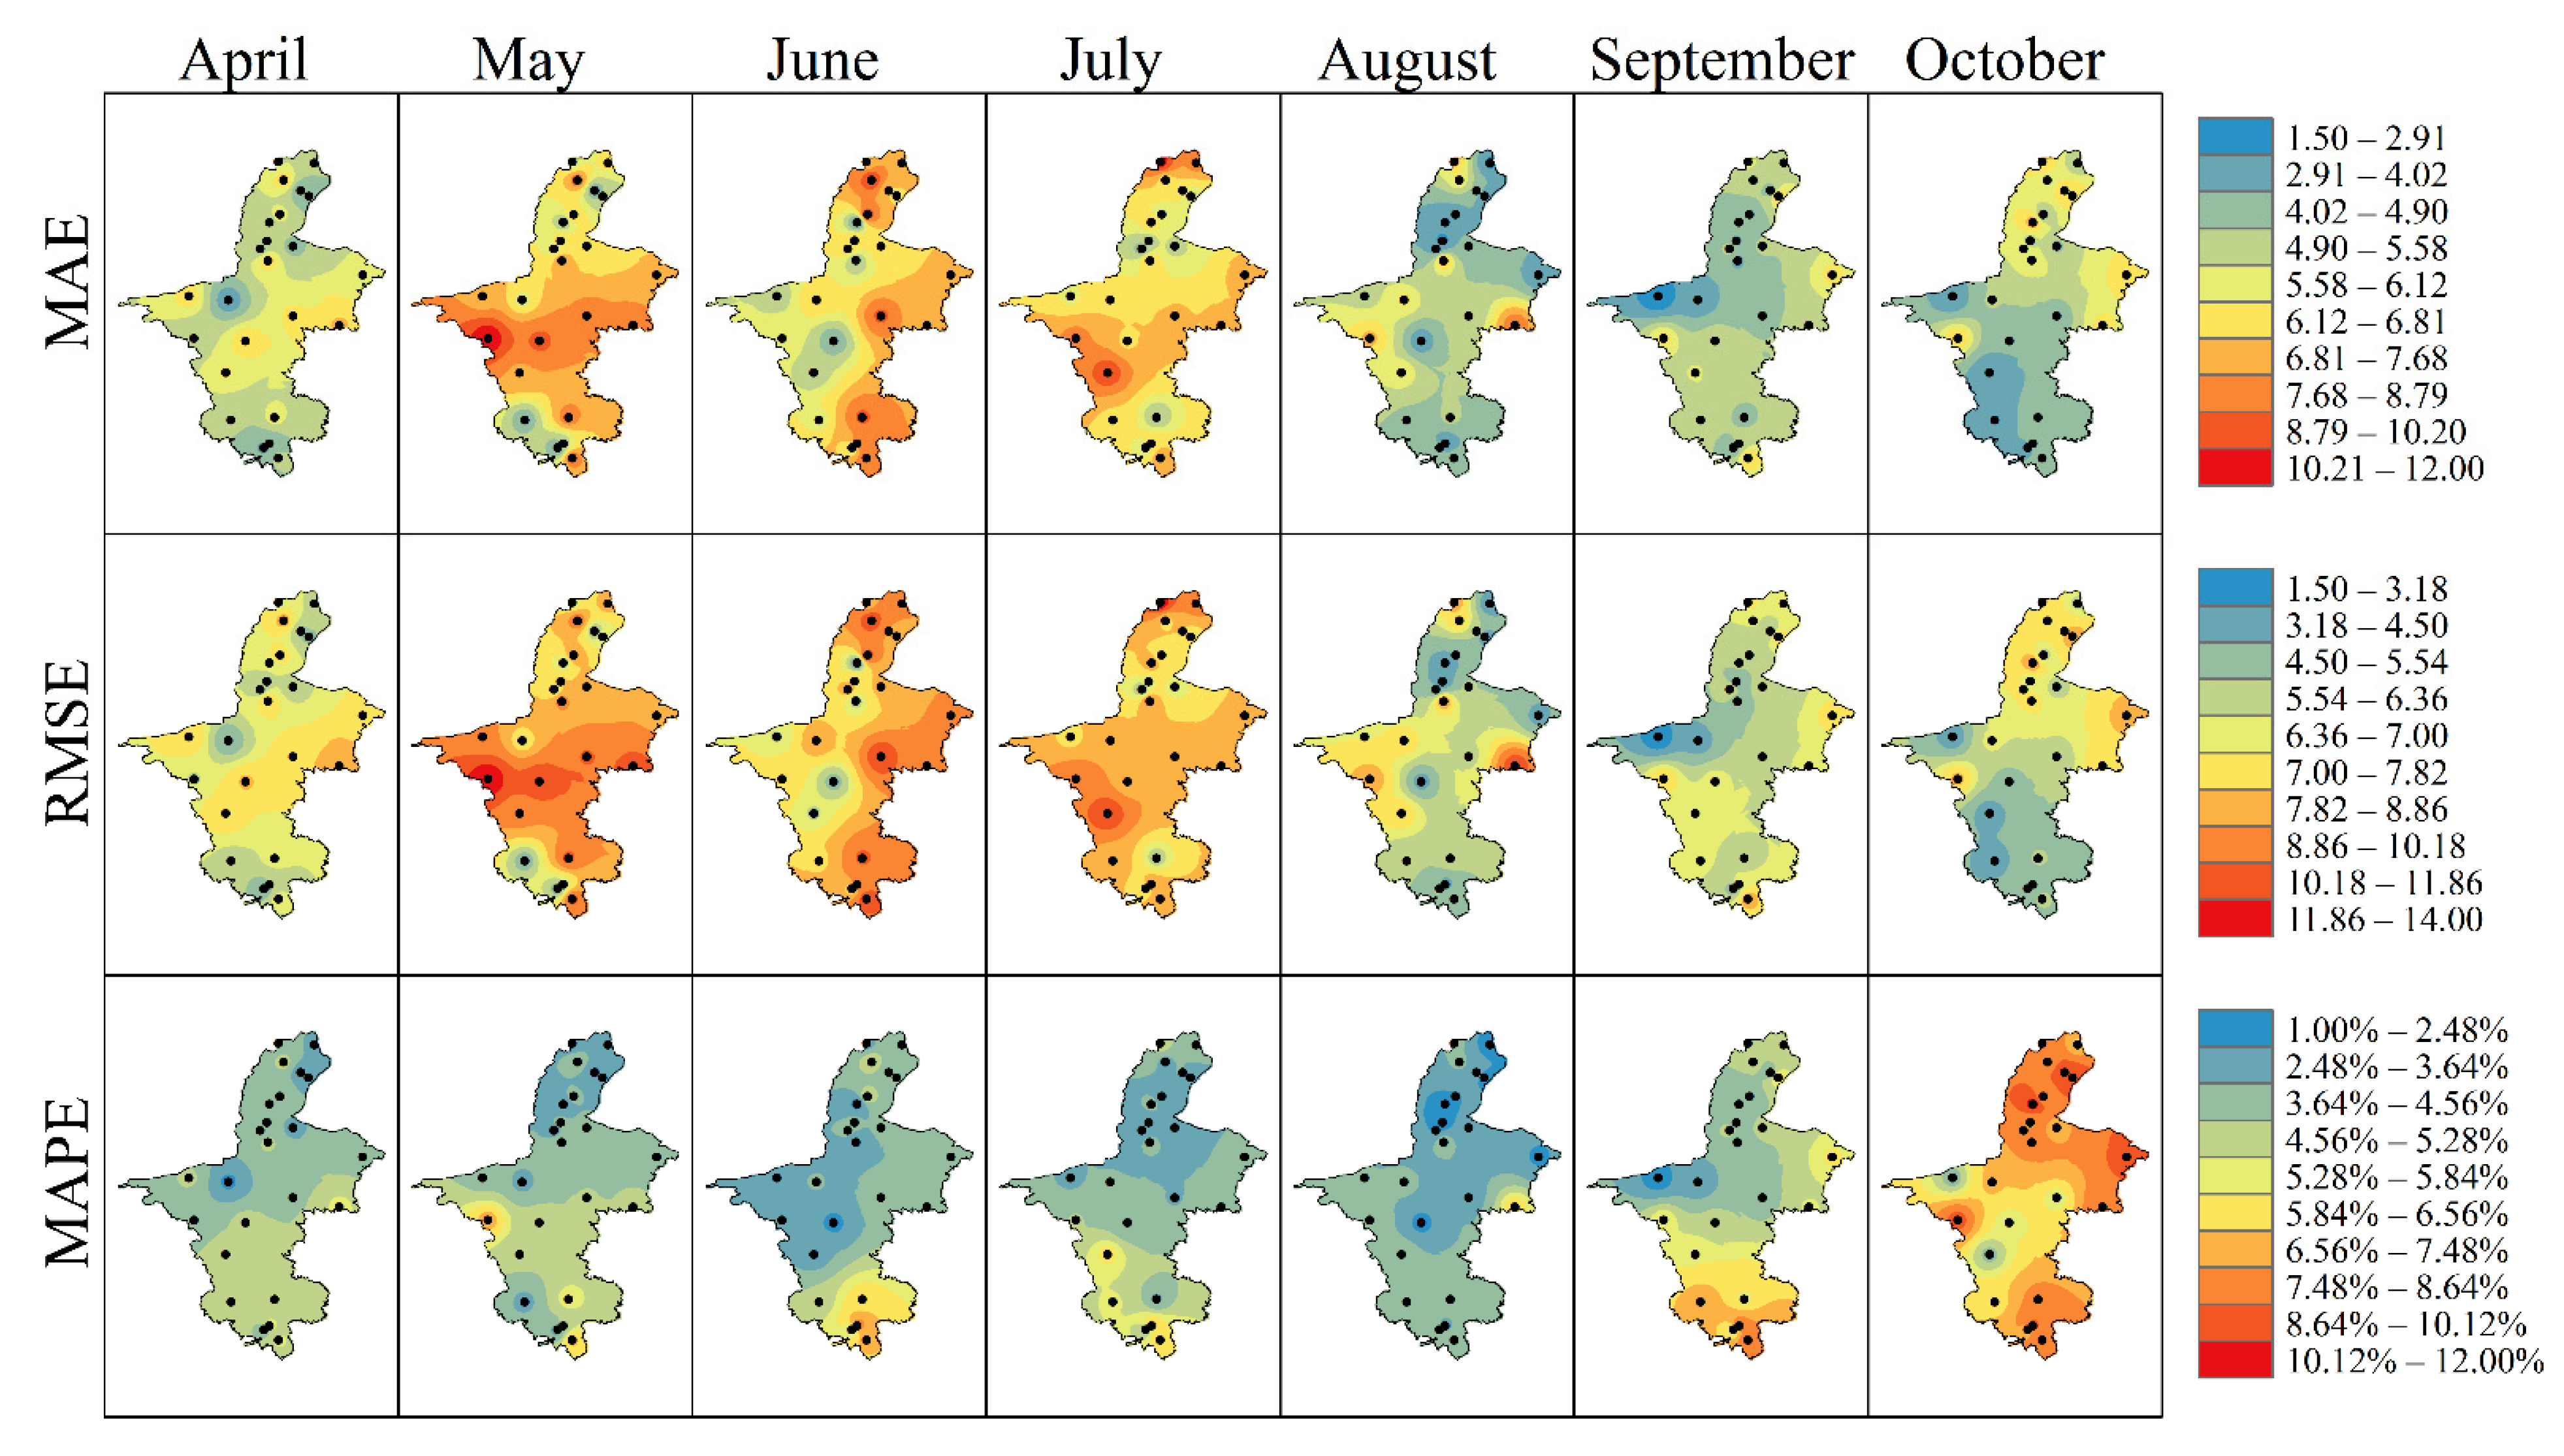
3.2.5. Monthly Fitting Back-Generation of Potential Evaporation in the Growing Season
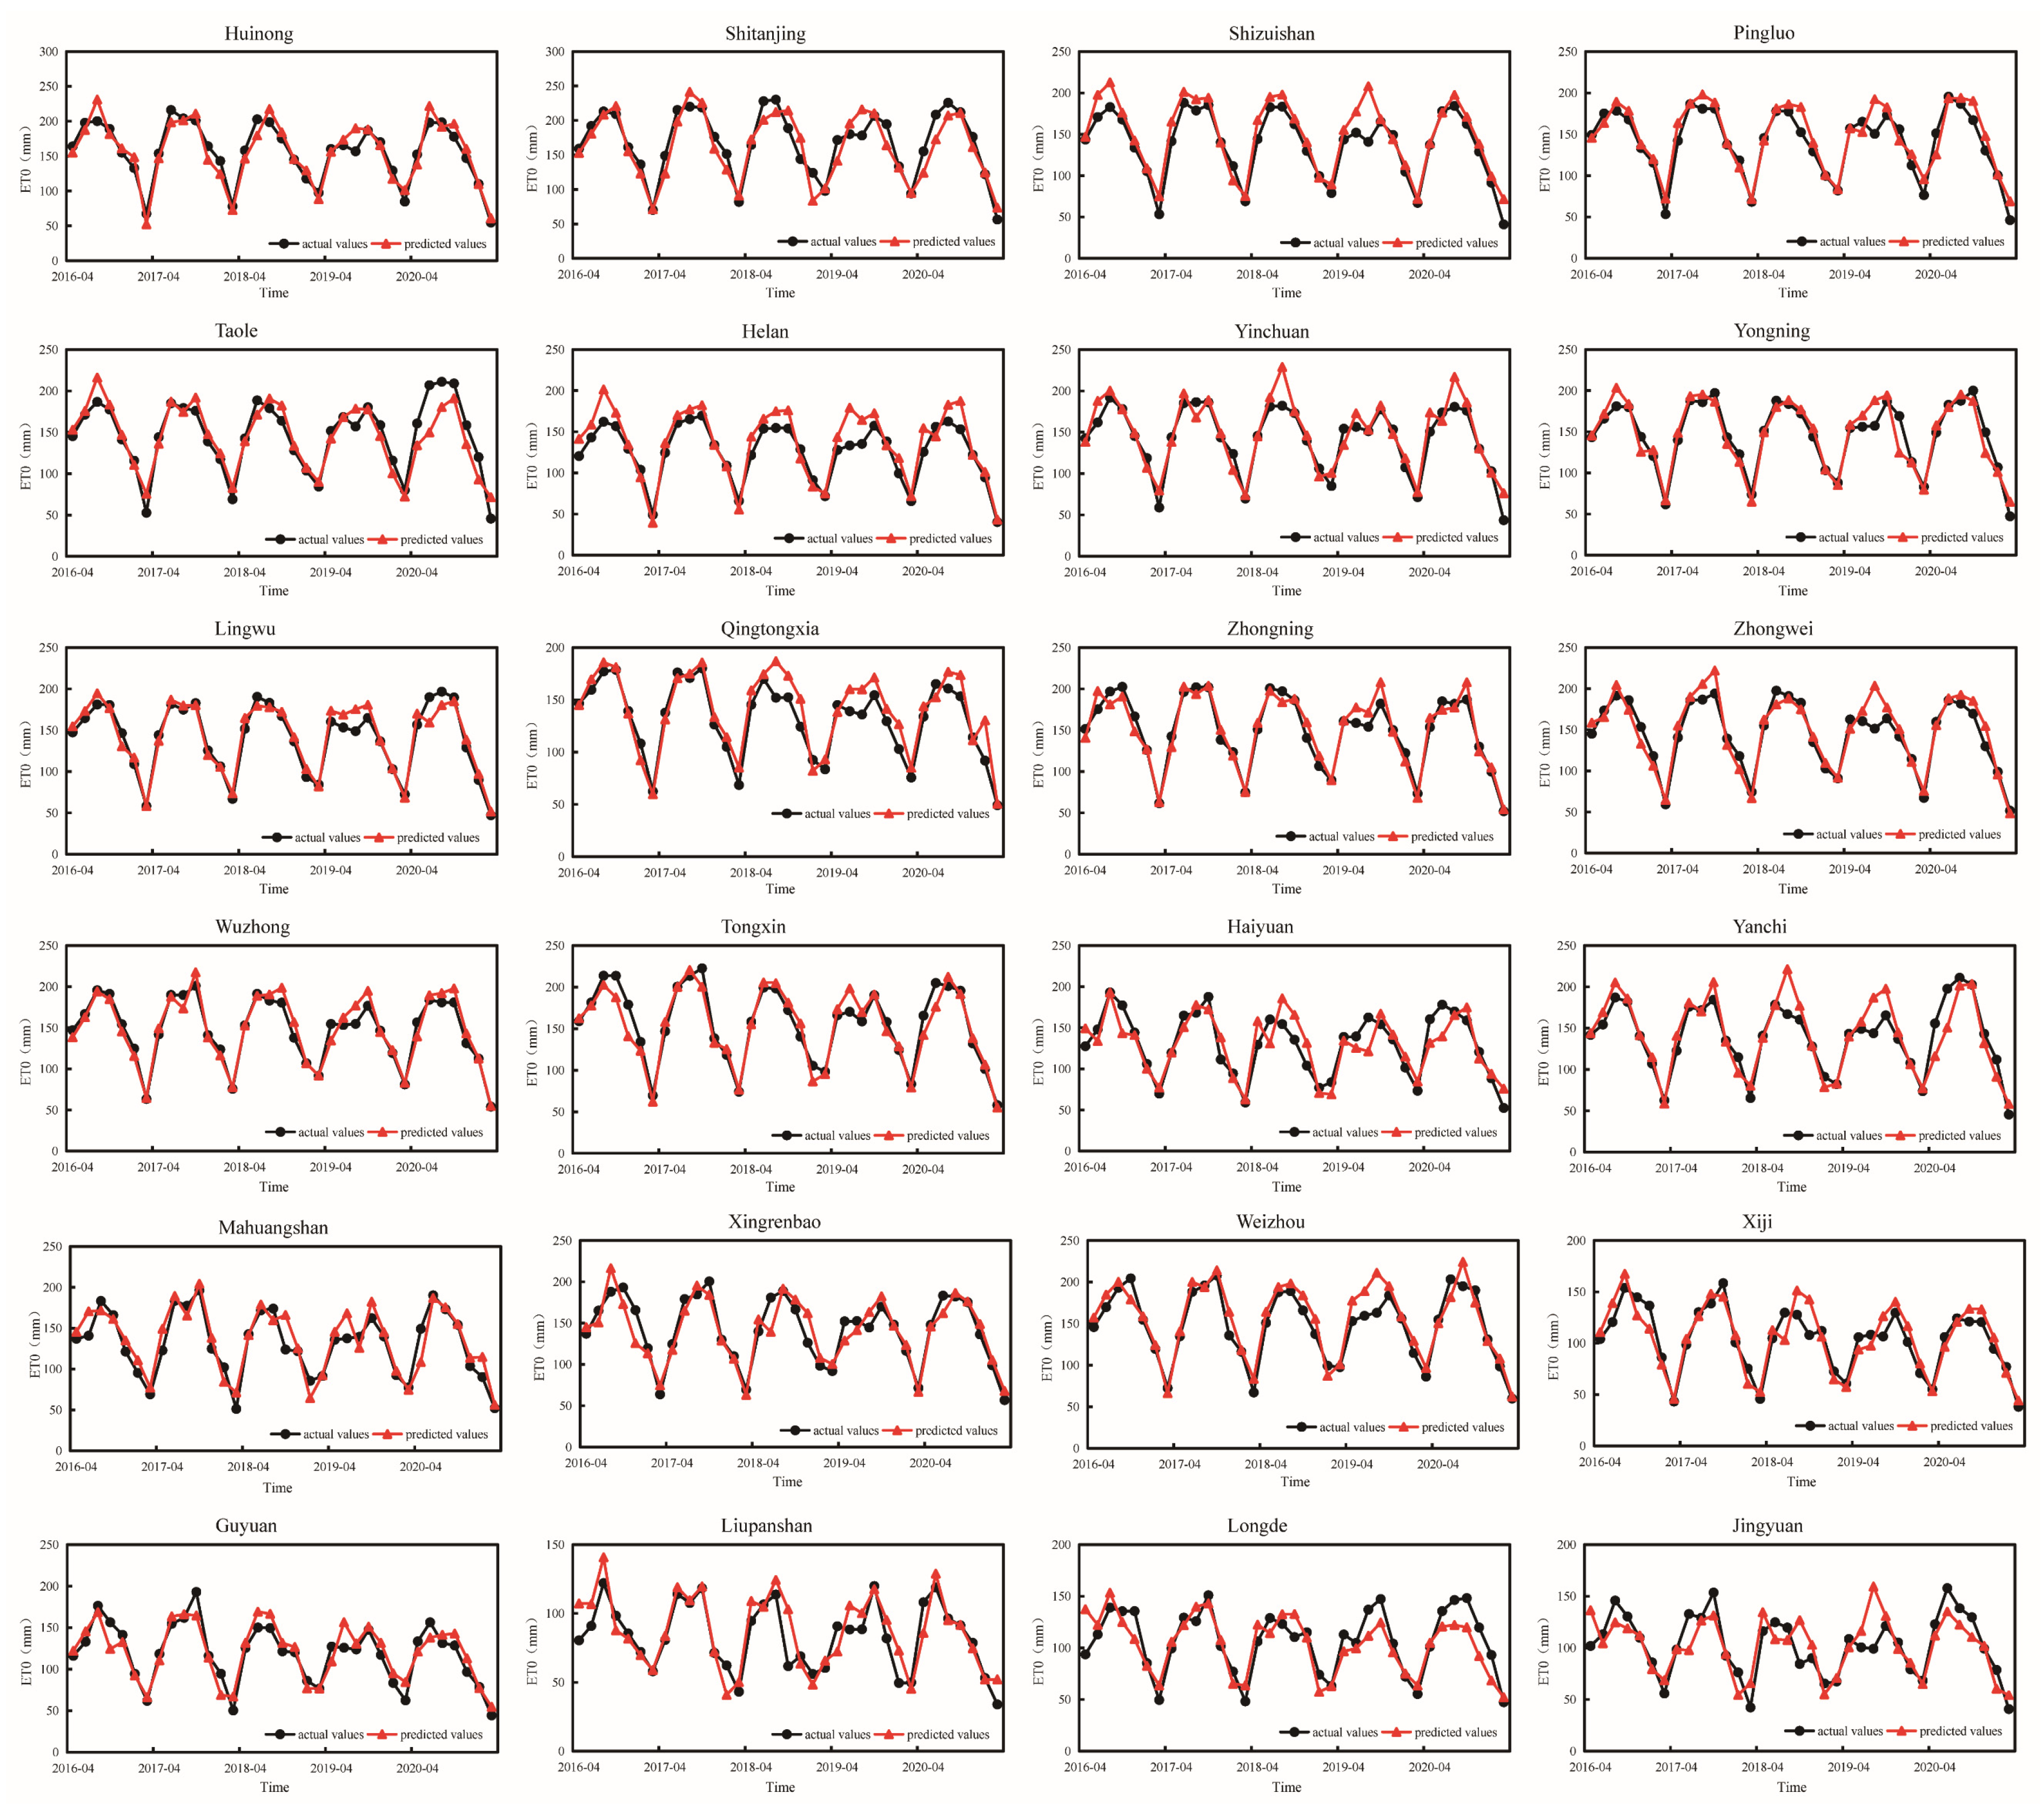
3.2.6. Monthly Extrapolation Forecast of Potential Evaporation in the Growing Season
4. Discussion
5. Conclusions
- (1)
- The areas with large potential evaporation in the growing season are mainly the central area and the northern side of the northern area of Ningxia. The western side of the central area of the Ningxia Hui Autonomous Region has a greater increasing trend, and the eastern and northern sides of the Ningxia Hui Autonomous Region have a decreasing trend.
- (2)
- On the monthly scale, the potential evaporation continued to increase from April to June, reached its maximum in June, continued to decrease from July to October, and was the smallest in October. The increasing trend of potential evaporation from April to June and the increasing trend of the west side of the central region are obvious, and the trend of potential evaporation from July to October is more obvious, during which the decreasing trend is most obvious in September, although most areas show a decrease to some extent. Among them, the northern side of the northern region and the eastern side of the central region have the largest decreasing trend.
- (3)
- According to the results of the MK test in the growing season, the change in potential evaporation in the growing season showed a trend of “increase–decrease”. According to the results of the monthly scale MK test, the potential evaporation in April, May, and June has shown an increasing trend over the past 30 years. The UF value in August and October has been relatively stable, and the trend of potential evaporation has been relatively stable. The potential evaporation in September has shown a downward trend over the past 20 years.
- (4)
- The prediction model of potential evaporation in the growing season established by atmospheric circulation has shown good results in Ningxia, demonstrating that the circulation factor can be used to establish the scheduling forecast for irrigation water.
Author Contributions
Funding
Institutional Review Board Statement
Informed Consent Statement
Data Availability Statement
Acknowledgments
Conflicts of Interest
References
- Allen, R.G.; Pereira, L.S.; Smith, M.; Raes, D.; Wright, J.L. FAO-56 dual crop coefficient method for estimating evaporation from soil and application extensions. J. Irrig. Drain. Eng. 2005, 131, 2–13. [Google Scholar] [CrossRef] [Green Version]
- Singh, V.P. Volume I: Rainfall-runoff modeling. In Hydrologic Systems; Prentice Hall: Englewood Cliffs, NJ, USA, 1988; p. 480. [Google Scholar]
- Jaramillo, F.; Prieto, C.; Lyon, S.W.; Destouni, G. Multimethod assessment of evapotranspiration shifts due to non-irrigated agricultural development in Sweden. J. Hydrol. 2013, 484, 55–62. [Google Scholar] [CrossRef] [Green Version]
- Qin, D.; Chen, Z.; Averyt, K.B.; Miller, H.L.; Solomon, S.; Manning, M.; Marquis, M.; Tignor, M. IPCC, 2007: Summary for Policymakers; Cambridge University Press: Cambridge, UK, 2007. [Google Scholar]
- Waller, P.; Yitayew, M. Crop Evapotranspiration. In Irrigation and Drainage Engineering; Springer: Cham, Switzerland, 2016; pp. 89–104. [Google Scholar]
- Duce P, Snyder R L, Spano D. Forecasting reference evapotranspiration. In Proceedings of the III International Symposium on Irrigation of Horticultural Crops, Lisbon, Portugal, 1 October 2000.
- Li, L.; Ni, W.; Li, Y.; Guo, D.; Gao, H. Impacts of Sea Surface Temperature and Atmospheric Teleconnection Patterns in the Northern Mid-Latitudes on Winter Extremely Cold Events in North China. Adv. Meteorol. 2021, 2021, 853457. [Google Scholar] [CrossRef]
- Xu, J.; Li, F. Response of lower Yellow River bank breachings to La Nia events since 924CE. Catena 2019, 176, 159–169. [Google Scholar] [CrossRef]
- Gritsun, A.S. Variability of extra tropical atmospheric circulation and periodic trajectories in simplified models of atmospheric dynamics. Izv. Atmos. Ocean. Phys. 2020, 56, 229–240. [Google Scholar] [CrossRef]
- Kyselý, J. Implications of enhanced persistence of atmospheric circulation for the occurrence and severity of temperature extremes. Int. J. Climatol. A J. R. Meteorol. Soc. 2007, 27, 689–695. [Google Scholar] [CrossRef]
- Schubert, S.; Rienecker, M.; Mlynczak, M.; Miller, T.; Schoeberl, M. Ocean and atmosphere: Predicting monthly to seasonal climate variability and the oceanic and atmospheric causes and effects. In Proceedings of the IGARSS 2003. 2003 IEEE International Geoscience and Remote Sensing Symposium, Toulouse, France, 21–25 July 2003; IEEE: Piscataway, NJ, USA, 2003; Volume 1, pp. 142–144. [Google Scholar]
- Jackson, L.C.; Smith, R.S.; Wood, R.A. Ocean and atmosphere feedbacks affecting AMOC hysteresis in a GCM. Clim. Dyn. 2017, 49, 173–191. [Google Scholar] [CrossRef] [Green Version]
- Zheng, J.; Li, B.; Chen, Y.; Chen, Z.; Lian, L. Spatiotemporal variation of upper-air and surface wind speed and its influencing factors in northwestern China during 1980–2012. Theor. Appl. Climatol. 2017, 133, 1303–1314. [Google Scholar] [CrossRef]
- Kononova, N.K.; Lupo, A.R. Changes in the Dynamics of the Northern Hemisphere Atmospheric Circulation and the Relationship to Surface Temperature in the 20th and 21st Centuries. Atmosphere 2020, 11, 255. [Google Scholar] [CrossRef] [Green Version]
- Po-Chedley, S.; Zelinka, M.D.; Jeevanjee, N.; Thorsen, T.J.; Santer, B.D. Climatology explains intermodel spread in tropical upper tropospheric cloud and relative humidity response to greenhouse warming. Geophys. Res. Lett. 2019, 46, 13399–13409. [Google Scholar] [CrossRef]
- Urban, G.; Migała, K.; Pawliczek, P. Sunshine duration and its variability in the main ridge of the Karkonosze Mountains in relation to with atmospheric circulation. Theor. Appl. Climatol. 2018, 131, 1173–1189. [Google Scholar] [CrossRef] [Green Version]
- Ahmadi, S.H.; Fooladmand, H.R. Spatially distributed monthly reference evapotranspiration derived from the calibration of Thornthwaite equation: A case study, South of Iran. Irrig. Sci. 2008, 26, 303–312. [Google Scholar] [CrossRef]
- Heydari, M.M.; Heydari, M. Calibration of Hargreaves–Samani equation for estimating reference evapotranspiration in semiarid and arid regions. Arch. Agron. Soil Sci. 2014, 60, 695–713. [Google Scholar] [CrossRef]
- Heydari, M.M.; Tajamoli, A.; Ghoreishi, S.H.; Darbe-Esfahani, M.K.; Gilasi, H. Erratum to: Evaluation and calibration of Blaney–Criddle equation for estimating reference evapotranspiration in semiarid and arid regions. Environ. Earth Sci. 2015, 74, 4053–4063. [Google Scholar] [CrossRef]
- Xu, Y.P.; Pan, S.; Fu, G.; Tian, Y.; Zhang, X. Future potential evapotranspiration changes and contribution analysis in Zhejiang Province, East China. J. Geophys. Res. D Atmos. Jgr. 2014, 119, 2174–2192. [Google Scholar] [CrossRef] [Green Version]
- Sun, H.; Hu, H.; Wang, Z.; Lai, C. Temporal Variability of Drought in Nine Agricultural Regions of China and the Influence of Atmospheric Circulation. Atmosphere 2020, 11, 990. [Google Scholar] [CrossRef]
- Willems, P. Compound intensity/duration/frequency-relationships of extreme precipitation for two seasons and two storm types. J. Hydrol. 2000, 233, 189–205. [Google Scholar] [CrossRef]
- Hudgins, L. Bivariate wavelet analysis of Asia monsoon and ENSO. Adv. Atmos. Sci. Engl. Version 1996, 13, 299–312. [Google Scholar] [CrossRef]
- Talaee, P.H.; Tabari, H.; Ardakani, S.S. Hydrological drought in the west of Iran and possible association with large-scale atmospheric circulation patterns. Hydrol. Processes 2014, 28, 764–773. [Google Scholar] [CrossRef]
- Huang, S.; Li, P.; Huang, Q.; Leng, G.; Hou, B.; Ma, L. The propagation from meteorological to hydrological drought and its potential influence factors. J. Hydrol. 2017, 547, 184–195. [Google Scholar] [CrossRef]
- Liu, Y. Influence of the Western North Pacific Summer Monsoon on Summer Rainfall over the Yangtze River Basin. Chin. J. Atmos. Sci. 2009, 33, 1225–1237. [Google Scholar]
- Zhang, Q.Y.; Tao, S.Y. Tropical and subtropical monsoon over east asia and its influence on the rainfall over eastern china in summer. Q. J. Appl. Meteorl. 1998, 9, 17–23. [Google Scholar]
- Climate Change 2013: The Physical Science Basis; Working Group I Contribution to the Fifth Assessment Report of the Intergovernmental Panel on Climate Change; Cambridge University Press: New York, NY, USA, 2013; Available online: https://www.ipcc.ch/site/assets/uploads/2017/09/WG1AR5_Frontmatter_FINAL.pdf (accessed on 10 August 2022).



| Time | Numbering | Index Name | Correlation | Time | Numbering | Index Name | Correlation |
|---|---|---|---|---|---|---|---|
| April of the previous year | X1 | Northern Hemisphere Polar Vortex Central Intensity Index | 0.338 * | September of the previous year | X19 | Western Pacific Subtropical High Northern Boundary Position Index | −0.345 * |
| April of the previous year | X2 | Western North Pacific Typhoon number | 0.348 * | September of the previous year | X20 | Asian Zonal Circulation Index | 0.318 * |
| May of the previous year | X3 | Eastern Pacific Subtropical High Northern Boundary Position Index | −0.394 * | September of the previous year | X21 | North Atlantic Triple index | −0.340 * |
| May of the previous year | X4 | Asia Polar Vortex Area Index | −0.440 ** | October of the previous year | X22 | Western North Pacific Typhoon number | −0.319 * |
| May of the previous year | X5 | Northern Hemisphere Polar Vortex Central Longitude Index | −0.318 * | November of the previous year | X23 | Indian Subtropical High Ridge Position Index | 0.327 * |
| May of the previous year | X6 | Central Pacific 850 mb Trade Wind Index | 0.322 * | November of the previous year | X24 | Northern Hemisphere Polar Vortex Area Index | −0.318 * |
| June of the previous year | X7 | North African–North Atlantic–North American Subtropical High Ridge Position Index | 0.525 ** | November of the previous year | X25 | East Atlantic–West Russia Pattern, EA/WR | −0.393 * |
| June of the previous year | X8 | North American Subtropical High Northern Boundary Position Index | 0.343 * | December of the previous year | X26 | Atlantic Subtropical High Ridge Position Index | 0.419 ** |
| June of the previous year | X9 | Western Pacific Subtropical High Western Ridge Point Index | 0.318 * | January of that year | X27 | Western Pacific Subtropical High Ridge Position Index | −0.411 ** |
| June of the previous year | X10 | Western Pacific Warm Pool Area Index | 0.323 * | January of that year | X28 | Pacific Subtropical High Ridge Position Index | −0.332 * |
| July of the previous year | X11 | Asia Polar Vortex Area Index | −0.421 ** | February of that year | X29 | Asian Zonal Circulation Index | 0.332 * |
| July of the previous year | X12 | Northern Hemisphere Polar Vortex Central Latitude Index | 0.418 ** | February of that year | X30 | South Indian Ocean Dipole Index | 0.536 ** |
| July of the previous year | X13 | East Asian Trough Intensity Index | 0.379 * | March of that year | X31 | East Asian Trough Position Index | −0.362 * |
| August of the previous year | X14 | North American Subtropical High Ridge Position Index | −0.491 ** | March of that year | X32 | Polar–Eurasia Pattern, POL | −0.320 * |
| August of the previous year | X15 | Western Pacific Subtropical High Western Ridge Point Index | −0.389 * | March of that year | X33 | South Indian Ocean Dipole Index | 0.474 ** |
| August of the previous year | X16 | Northern Hemisphere Polar Vortex Central Longitude Index | −0.319 * | ||||
| Last august | X17 | East Pacific 850 mb Trade Wind Index | −0.404 * | ||||
| Last august | X18 | Oyashio Current SST Index | 0.342 * |
| City | Model Formulas | Variance Inflation Factor | |||||
|---|---|---|---|---|---|---|---|
| Huinong | y = 1438.701 + 6.856 × 7 + 0.64 × 9 − 8.158 × 11 − 15.609 × 14 | X7 | X9 | X11 | X14 | ||
| 1.263 | 1.13 | 1.038 | 1.091 | ||||
| Shizuishan | y = 1675.5 − 0.03 × 3 − 13.094 × 10 − 21.89 × 27 + 51.134 × 30 | X3 | X10 | X27 | X30 | ||
| 1.042 | 1.118 | 1.059 | 1.088 | ||||
| Yinchuan | y = 672.282 + 0.224 × 1 + 6.772 × 10 − 18.617 × 14 − 5.996 × 24 + 0.039 × 26 + 17.952 × 33 | X1 | X10 | X14 | X24 | X26 | X33 |
| 1.32 | 1.473 | 1.126 | 1.239 | 1.289 | 1.196 | ||
| Shitanjing | y = −1377.114 + 0.114 × 13 − 23.61 × 14 + 33.532 × 33 | X13 | X14 | X33 | |||
| 1.314 | 1.045 | 1.295 | |||||
| Pingluo | y = 311.32 + 0.228 × 1 − 17.432 × 14 + 5.104 × 29 + 23.766 × 30 | X1 | X14 | X29 | X30 | ||
| 1.071 | 1.034 | 1.122 | 1.179 | ||||
| Taole | y = 1497.921 − 0.029 × 3 − 21.713 × 4 − 8.443 × 11 + 28.622 × 30 | X3 | X4 | X11 | X30 | ||
| 1.048 | 1.037 | 1.192 | 1.17 | ||||
| Helan | y = 1969.009 − 0.049 × 03 − 42.471 × 04 − 3.861 × 12 − 0.084 × 19 + 43.525 × 30 | X3 | X4 | X12 | X19 | X30 | |
| 1.046 | 1.245 | 1.639 | 1.109 | 1.245 | |||
| Yongning | y = 1544.971 − 13.188 × 14 − 0.176 × 16 − 16 × 17 + 10.35 × 18 + 0.038 × 26 + 22.343 × 33 | X14 | X16 | X17 | X18 | X26 | X33 |
| 1.163 | 1.2 | 1.306 | 1.309 | 1.277 | 1.262 | ||
| Lingwu | y = 621.255 + 0.175 × 1 + 0.447 × 9 − 17.038 × 14 − 9.442 × 17 + 19.333 × 33 | X1 | X9 | X14 | X17 | X33 | |
| 1.151 | 1.089 | 1.092 | 1.182 | 1.097 | |||
| Qingtongxia | y = 1292.535 − 25.765 × 28 + 9.383 × 29 − 73.376 × 32 | X28 | X29 | X32 | |||
| 1.026 | 1.04 | 1.033 | |||||
| Wuzhong | y = 1407.758 − 36.337 × 4 + 16.279 × 10 − 34.602 × 17 + 9.421 × 20 | X4 | X10 | X17 | X20 | ||
| 1.01 | 1.168 | 1.068 | 1.095 | ||||
| Zhongning | y = 1498.873 + 0.673 × 09 − 11.268 × 14 − 11.659 × 28 + 45.472 × 30 − 32.359 × 32 | X9 | X14 | X28 | X30 | X32 | |
| 1.044 | 1.13 | 1.122 | 1.01 | 1.035 | |||
| Zhongwei | y = 1935.119 + 4.937 × 8 + 8.996 × 10 − 18.349 × 17 − 6.358 × 24 − 18.253 × 27 − 2.936 × 31 | X8 | X10 | X17 | X24 | X27 | X31 |
| 1.154 | 1.383 | 1.177 | 1.262 | 1.165 | 1.351 | ||
| Tongxin | y = 2019.003 − 16.043 × 14 − 0.614 × 15 − 0.185 × 16 − 5.315 × 24 + 22.342 × 33 | X14 | X15 | X16 | X24 | X33 | |
| 1.156 | 1.177 | 1.164 | 1.153 | 1.201 | |||
| Xiji | y = 789.801 + 17.915 × 2 − 0.038 × 3 − 0.072 × 19 − 20.455 × 21 − 0.659 × 31 + 13.386 × 33 | X02 | X03 | X19 | X21 | X31 | X33 |
| 1.094 | 1.171 | 1.196 | 1.465 | 1.165 | 1.167 | ||
| Haiyuan | y = 947.905 + 29.972 × 2 − 0.035 × 3 − 0.376 × 15 + 23.52 × 33 | X2 | X3 | X15 | X33 | ||
| 1.074 | 1.075 | 1.223 | 1.198 | ||||
| Yanchi | y = 1398.19 − 0.03 × 3 − 21.875 × 4 − 0.435 × 15 − 0.044 × 19 + 43.928 × 25 + 39.461 × 30 | X3 | X4 | X15 | X19 | X25 | X30 |
| 1.039 | 1.138 | 1.464 | 1.206 | 1.55 | 1.559 | ||
| Mahuangshan | y = 1067.008 + 34.322 × 2 + 0.933 × 9 + 4.036 × 12 − 16.849 × 27 + 44.168 × 30 − 2.102 × 31 | X2 | X9 | X12 | X27 | X30 | X31 |
| 1.08 | 1.089 | 1.24 | 1.053 | 1.28 | 1.11 | ||
| Xingrenbao | y = 2114.237 − 8.852 × 11 − 17.166 × 14 − 6.311 × 24 + 0.058 × 26 + 23.573 × 33 | X11 | X14 | X24 | X26 | X33 | |
| 1.248 | 1.095 | 1.132 | 1.114 | 1.199 | |||
| Weizhou | y = 435.339 + 0.237 × 1 + 0.672 × 9 − 21.703 × 14 + 31.121 × 33 | X1 | X9 | X14 | X33 | ||
| 1.1 | 1.012 | 1.032 | 1.085 | ||||
| Guyuan | y = −1877.545 − 0.047 × 3 + 0.112 × 13 − 0.197 × 15 − 0.073 × 19 − 24.972 × 21 − 6.885 × 24 | X03 | X13 | X15 | X19 | X21 | X24 |
| 1.066 | 1.468 | 1.24 | 1.351 | 1.827 | 1.145 | ||
| Liupanshan | y = 945.127 + 12.909 × 2 − 14.132 × 14 − 0.062 × 19 + 4.85 × 29 − 29.462 × 30 + 34.969 × 33 | X2 | X14 | X19 | X29 | X30 | X33 |
| 1.192 | 1.226 | 1.13 | 1.146 | 4.617 | 4.283 | ||
| Longde | y = 1004.488 − 0.031 × 3 − 14.066 × 4 − 9.009 × 17 − 0.078 × 19 − 18.702 × 21 + 17.085 × 30 | X3 | X4 | X17 | X19 | X21 | X30 |
| 1.259 | 1.106 | 1.337 | 1.239 | 1.741 | 1.237 | ||
| Jingyuan | y = 1040.664 + 20.605 × 2 − 10.903 × 14 − 0.089 × 19 + 0.05 × 26 + 27.748 × 33 | X2 | X14 | X19 | X26 | X33 | |
| 1.149 | 1.1 | 1.036 | 1.038 | 1.042 | |||
| April | May | June | July | August | September | October |
|---|---|---|---|---|---|---|
| 127 | 138 | 70 | 36 | 62 | 100 | 88 |
| Place | April | May | June | July | August | September | October |
|---|---|---|---|---|---|---|---|
| Huinong | 5 | 5 | 5 | 4 | 14 | 5 | 7 |
| Shitanjing | 6 | 5 | 6 | 3 | 6 | 6 | 5 |
| Shizuishan | 5 | 5 | 3 | 10 | 5 | 9 | 7 |
| Pingluo | 7 | 9 | 5 | 4 | 5 | 7 | 5 |
| Taole | 6 | 4 | 7 | 6 | 12 | 5 | 5 |
| Helan | 4 | 5 | 3 | 5 | 7 | 5 | 8 |
| Yinchuan | 6 | 7 | 12 | 3 | 9 | 5 | 4 |
| Yongning | 6 | 6 | 5 | 6 | 16 | 10 | 7 |
| Lingwu | 6 | 5 | 4 | 6 | 6 | 5 | 6 |
| Qingtongxia | 6 | 8 | 5 | 9 | 8 | 4 | 5 |
| Wuzhong | 4 | 5 | 9 | 4 | 4 | 13 | 7 |
| Zhongning | 8 | 8 | 5 | 5 | 5 | 9 | 6 |
| Zhongwei | 3 | 5 | 6 | 8 | 4 | 14 | 10 |
| Tongxin | 9 | 4 | 14 | 6 | 13 | 5 | 7 |
| Haiyuan | 5 | 6 | 13 | 3 | 5 | 5 | 10 |
| Yanchi | 4 | 5 | 5 | 5 | 10 | 5 | 5 |
| Mahuangshan | 5 | 6 | 7 | 6 | 4 | 9 | 5 |
| Xingrenbao | 7 | 3 | 6 | 4 | 4 | 5 | 5 |
| Weizhou | 5 | 5 | 4 | 5 | 7 | 8 | 6 |
| Xiji | 5 | 9 | 5 | 3 | 4 | 2 | 7 |
| Guyuan | 6 | 5 | 4 | 9 | 5 | 4 | 5 |
| Liupanshan | 5 | 8 | 5 | 3 | 8 | 4 | 4 |
| Longde | 8 | 11 | 9 | 5 | 5 | 5 | 5 |
| Jingyuan | 6 | 4 | 5 | 3 | 8 | 3 | 7 |
Publisher’s Note: MDPI stays neutral with regard to jurisdictional claims in published maps and institutional affiliations. |
© 2022 by the authors. Licensee MDPI, Basel, Switzerland. This article is an open access article distributed under the terms and conditions of the Creative Commons Attribution (CC BY) license (https://creativecommons.org/licenses/by/4.0/).
Share and Cite
Liu, Z.; Sun, Q.; Xu, D.; Fan, W.; Wang, R.; Jiang, P. Spatiotemporal Characteristics and Statistical Model Prediction of Potential Evaporation during the Growing Season in Ningxia. Atmosphere 2022, 13, 1654. https://doi.org/10.3390/atmos13101654
Liu Z, Sun Q, Xu D, Fan W, Wang R, Jiang P. Spatiotemporal Characteristics and Statistical Model Prediction of Potential Evaporation during the Growing Season in Ningxia. Atmosphere. 2022; 13(10):1654. https://doi.org/10.3390/atmos13101654
Chicago/Turabian StyleLiu, Zhe, Quan Sun, Dejia Xu, Wenbo Fan, Rui Wang, and Peng Jiang. 2022. "Spatiotemporal Characteristics and Statistical Model Prediction of Potential Evaporation during the Growing Season in Ningxia" Atmosphere 13, no. 10: 1654. https://doi.org/10.3390/atmos13101654
APA StyleLiu, Z., Sun, Q., Xu, D., Fan, W., Wang, R., & Jiang, P. (2022). Spatiotemporal Characteristics and Statistical Model Prediction of Potential Evaporation during the Growing Season in Ningxia. Atmosphere, 13(10), 1654. https://doi.org/10.3390/atmos13101654


