Projecting Changes in Rainfall Extremes for the Huai River Basin in the Context of 1.5 °C and 2 °C Global Warming
Abstract
:1. Introduction
2. Data Sources and Methodology
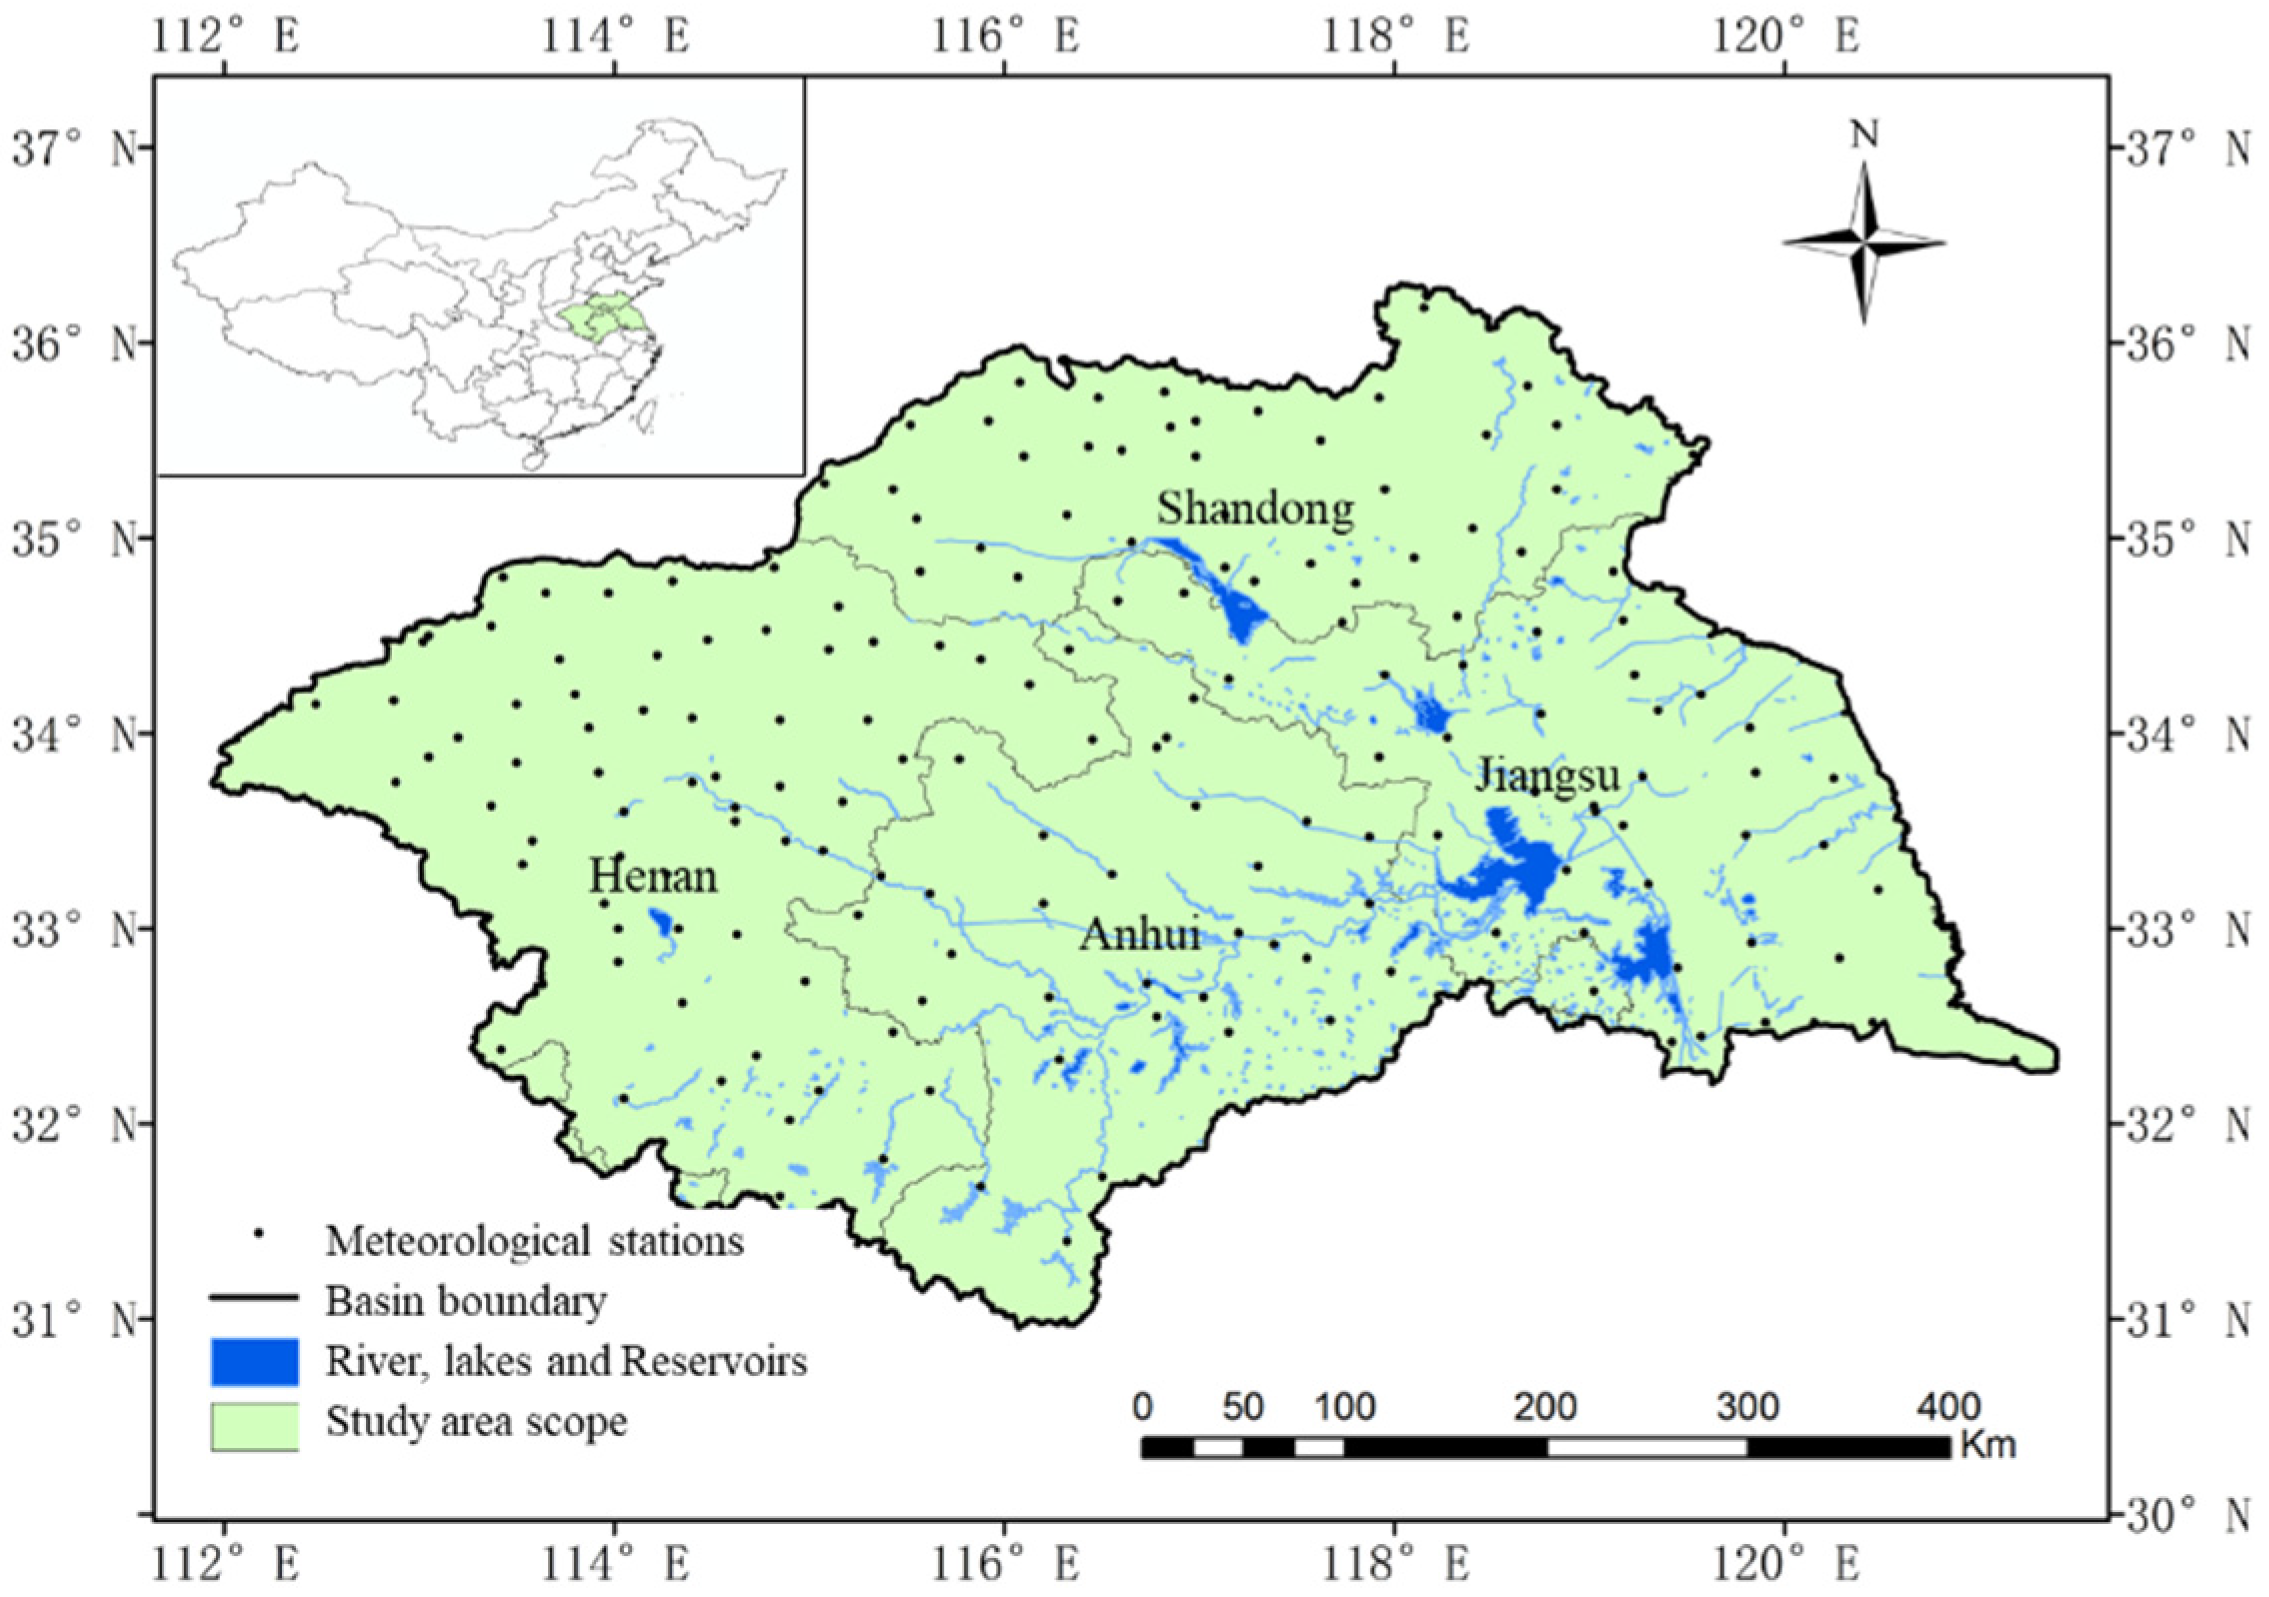
2.1. Study Catchment
2.2. Data Sources
2.3. Methods
2.3.1. Mann–Kendall Test
2.3.2. Theil Sen Slope Calculation
2.3.3. Extreme Rainfall Index
3. Results
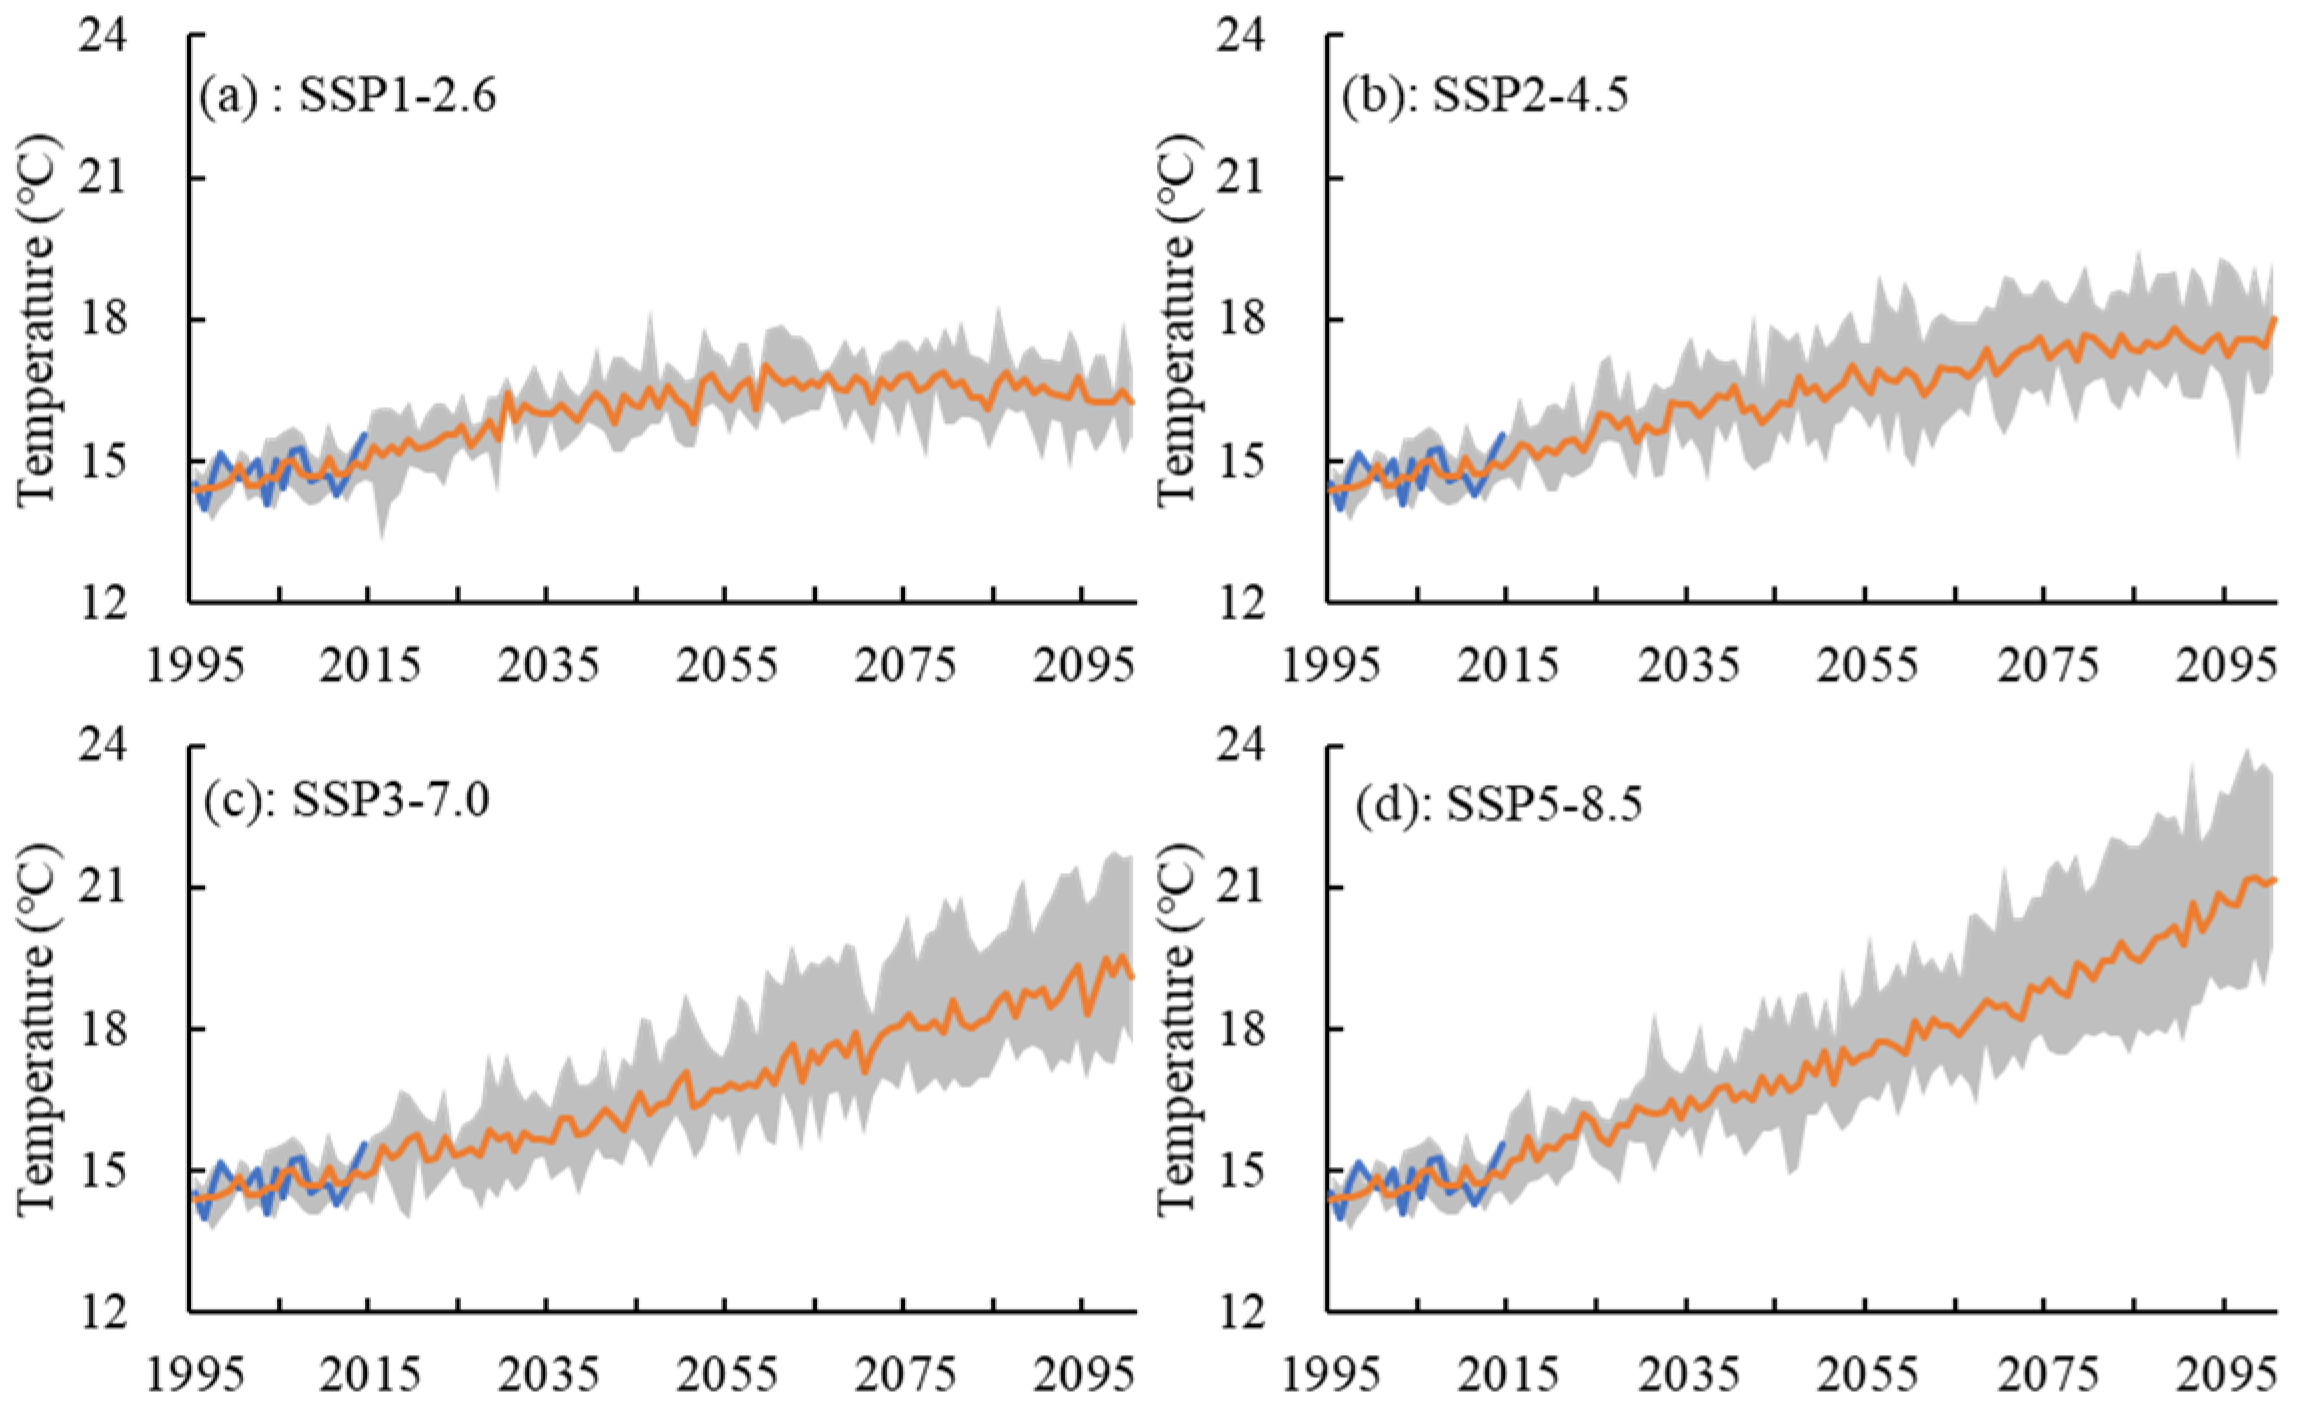
3.1. Historical Variation and Future Trend of Temperature
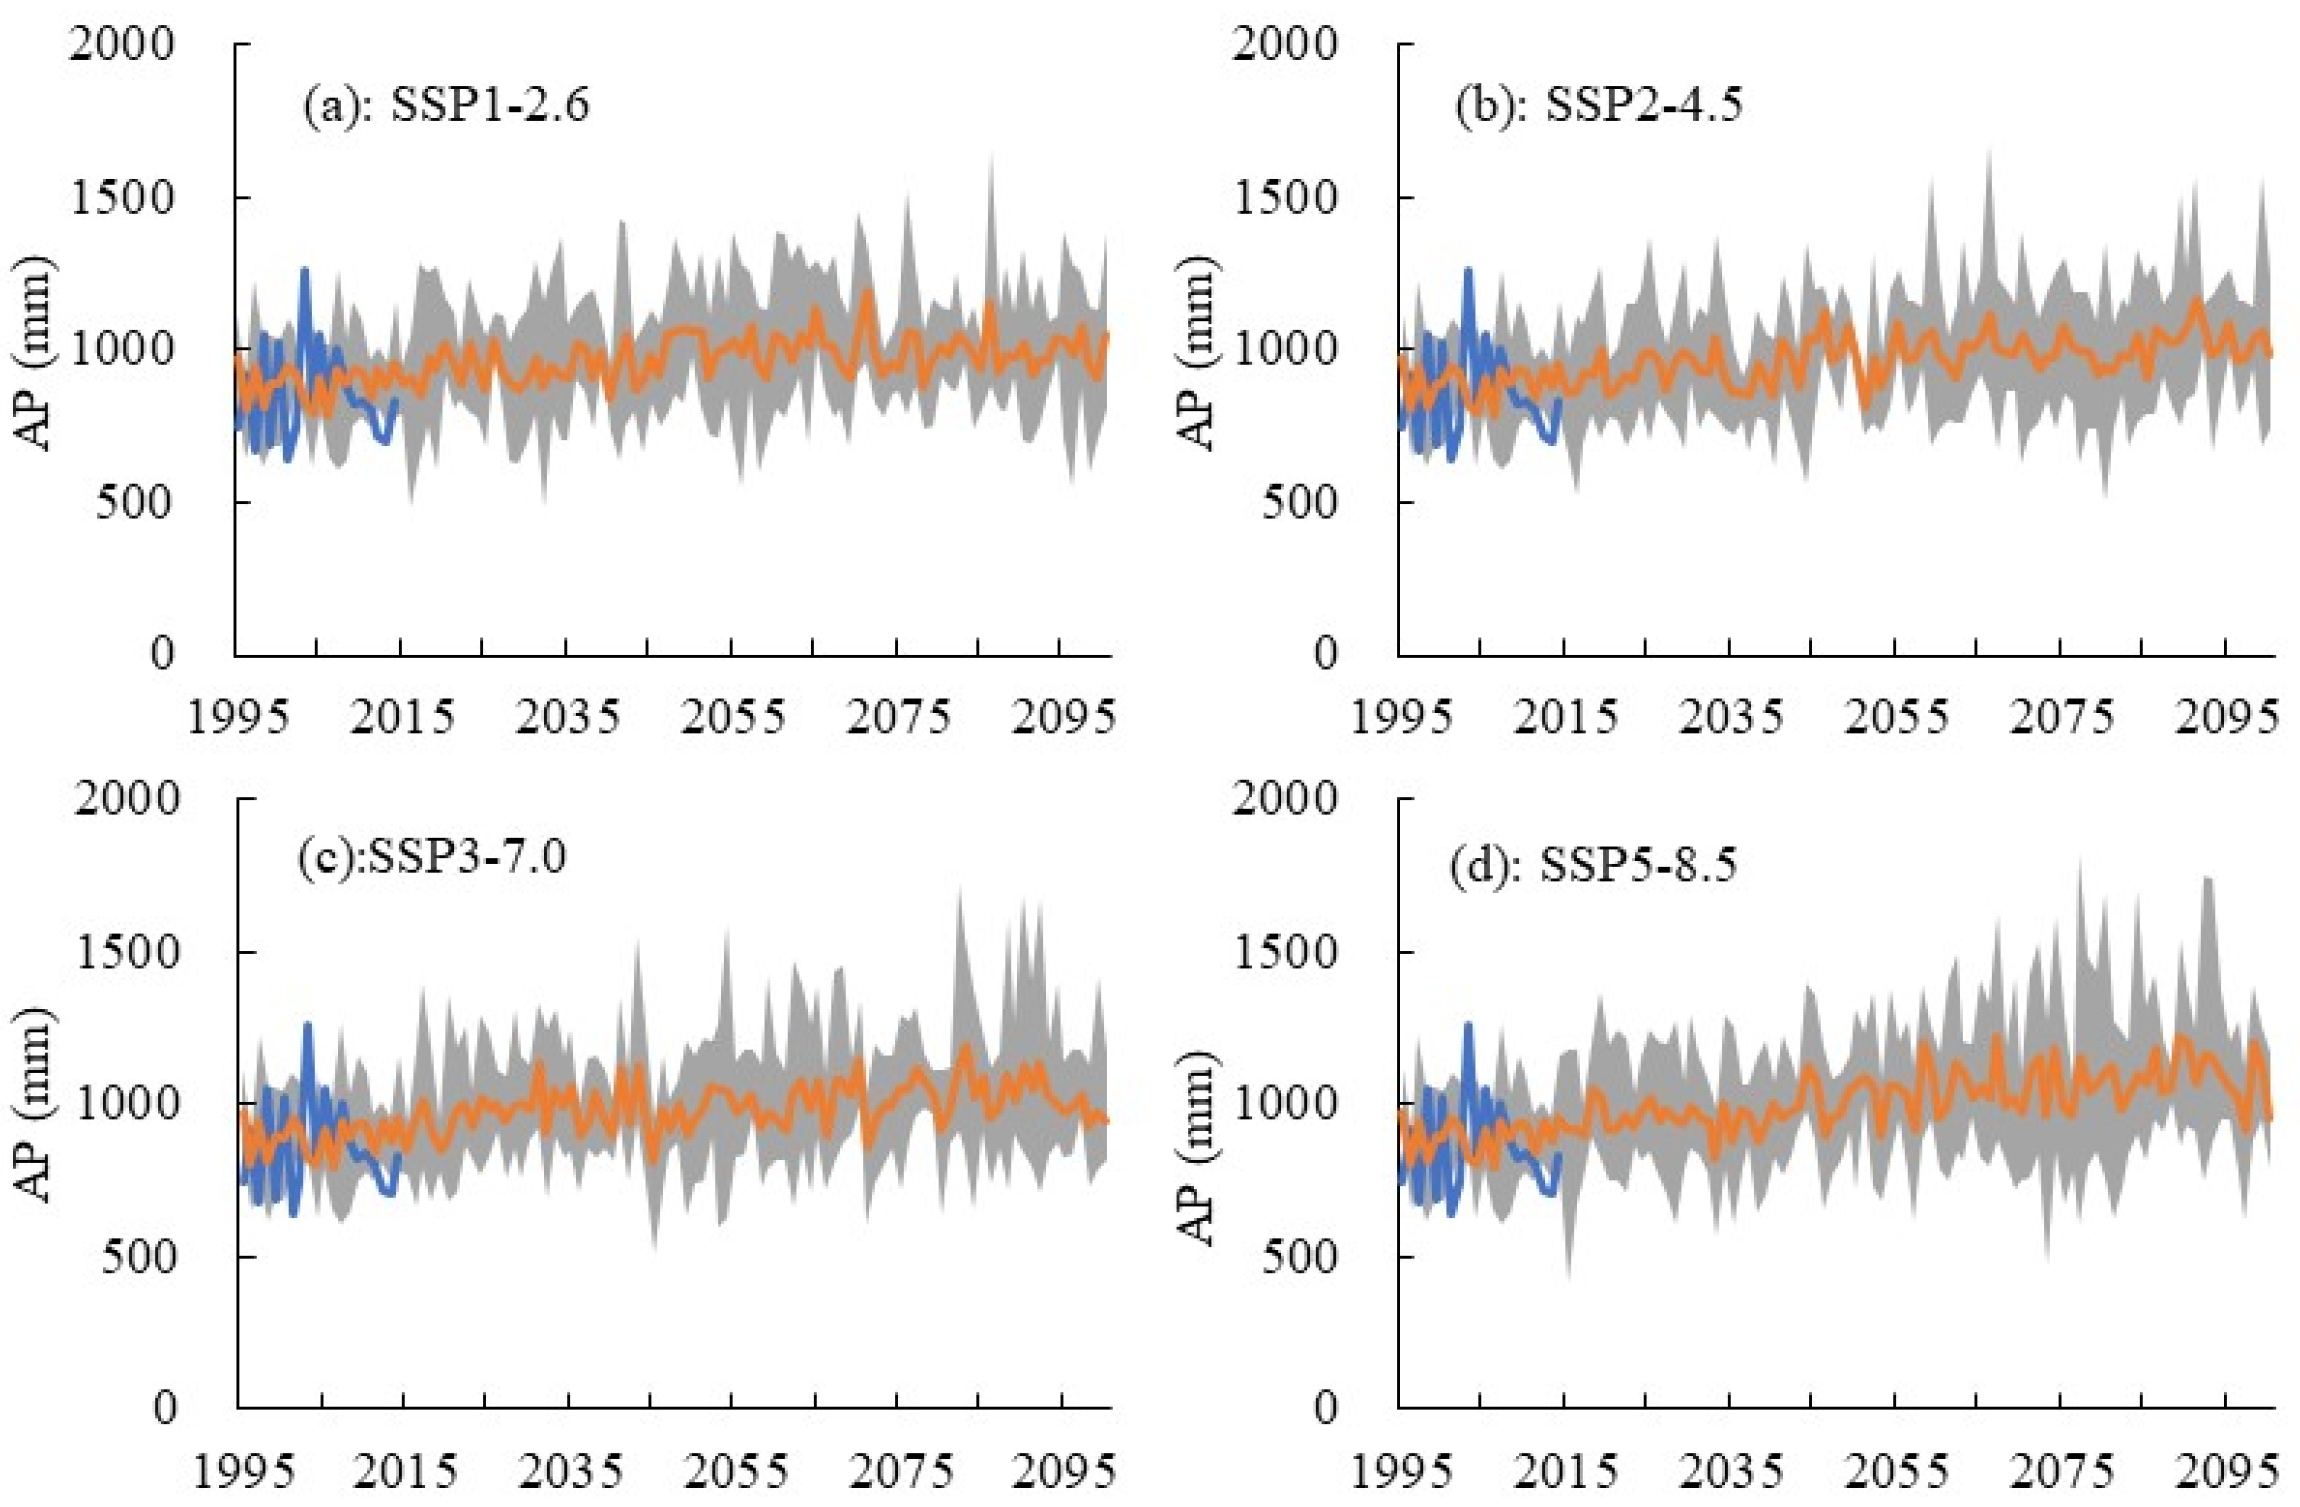
3.2. Historical Variation and Future Trends of Rainfall Extremes
3.3. Changes in Extreme Rainfall Indices under 1.5 °C and 2 °C Global Warming
3.3.1. Determination of Time Spans for 1.5 °C and 2.0 °C Global Warming
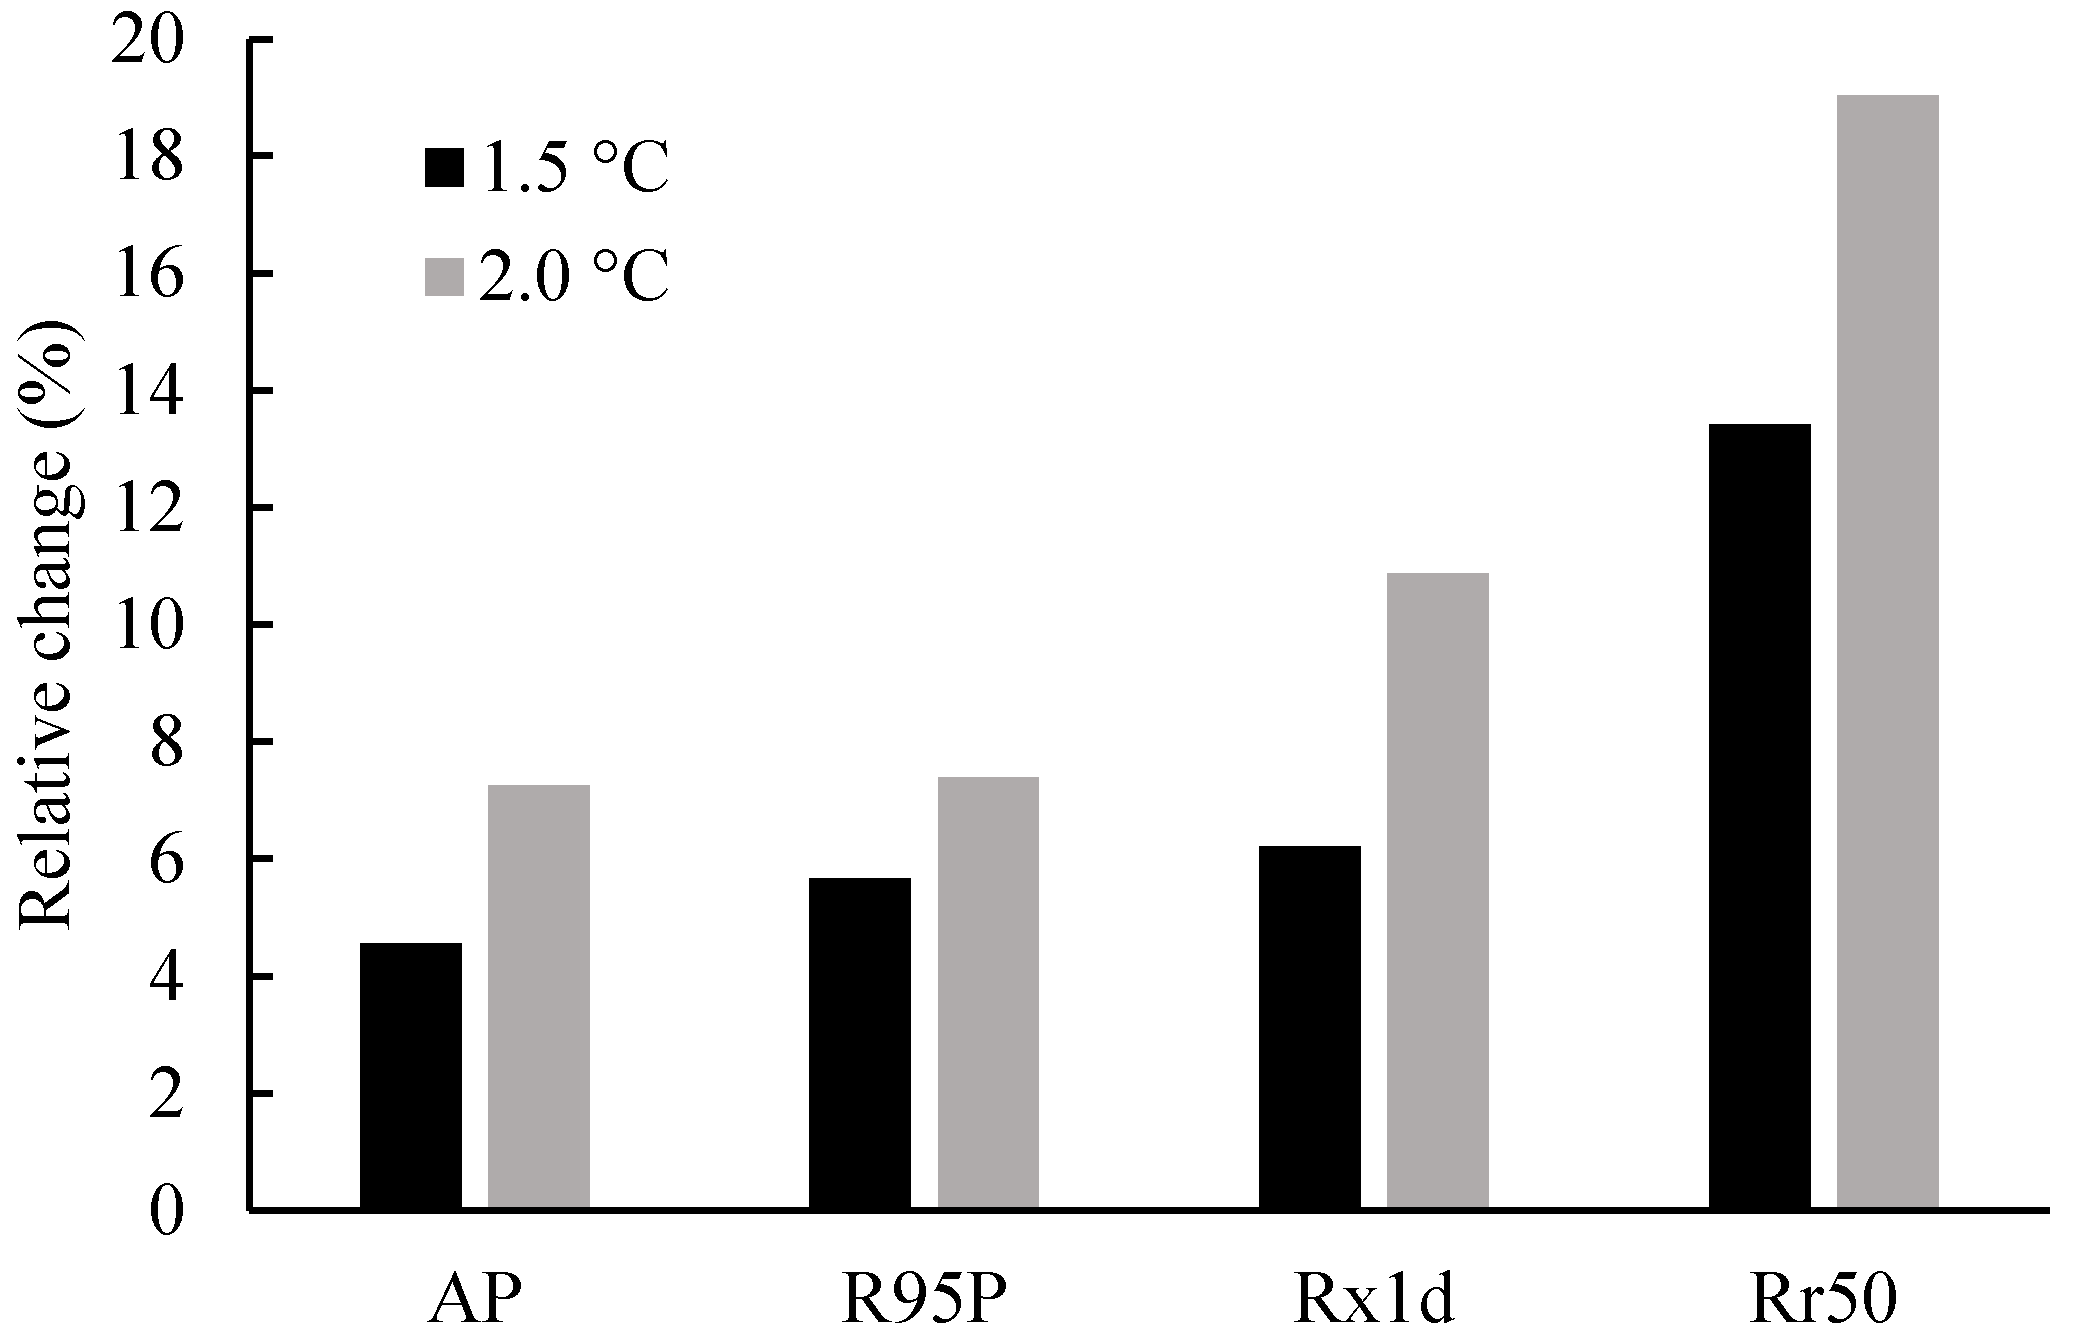
3.3.2. Changes in Extreme Rainfall Indices
3.4. Spatial Patterns of Changes in Extreme Rainfall Indices
4. Discussion
4.1. Extreme Rainfall Indices
4.2. GCMs Projections and Uncertainty
4.3. Historical and Future Trend in Extreme Rainfall Indices
5. Conclusions
- (1)
- During the baseline period, temperature over the Huai River basin presented a significant rising trend, while the four extreme rainfall indices exhibited insignificant decreasing trends. From 2015 to 2100, temperature will likely continue to rise significantly, and the extreme rainfall indices were projected to increase significantly under all four future climates scenarios, with the exception of Rx1d under scenarios SSP1-2.6 and SSP3-7.0.
- (2)
- The time spans of 1.5 °C and 2.0 °C global warming will likely occur in the 2030s and 2050s. In comparison with the baseline period, AP, R95P, Rx1d and Rr50 over the Huai River basin will likely increase by 4.6%, 5.7%, 6.2% and 13.4% under the warming scenario of 1.5 °C, while they will probably increase by 7.3%, 7.4%, 10.9% and 19.0%, respectively, under 2.0 °C global warming.
- (3)
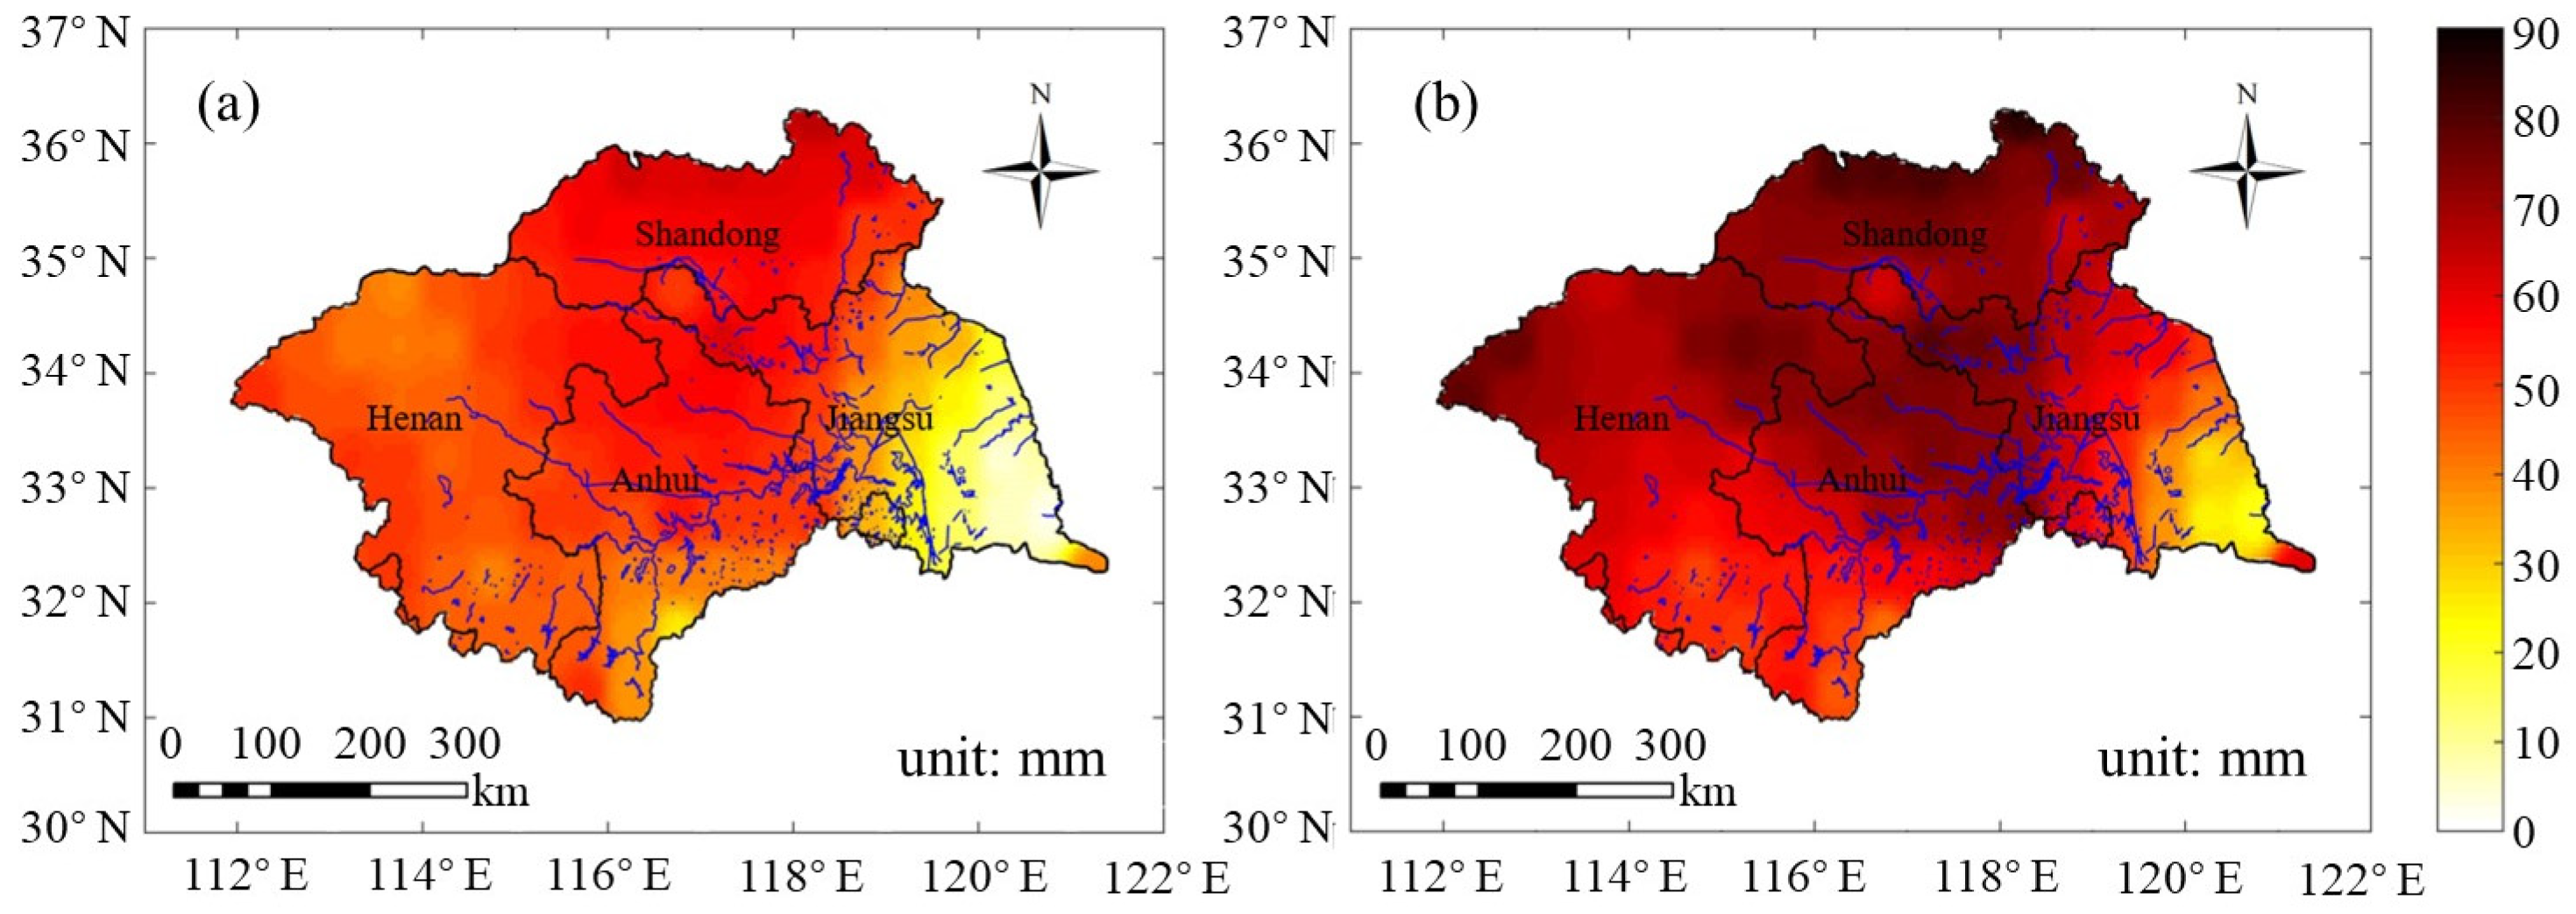
- The spatial patterns of changes in extreme rainfall i under the 1.5 °C and 2.0 °C warming scenarios are generally similar. For all four extreme rainfall indices, changes tend to decrease from north to south and from west to east, which means flood risk induced by global warming will probably extend to the whole Huai River basin.
Author Contributions
Funding
Institutional Review Board Statement
Informed Consent Statement
Data Availability Statement
Conflicts of Interest
References
- Ullah, I.; Saleem, F.; Iyakaremye, V.; Yin, J.; Ma, X.; Syed, S.; Hina, S.; Asfaw, T.; Omer, A. Projected changes in socioeconomic exposure to heatwaves in South Asia under changing climate. Earth’s Future 2022, 10, e2021EF002240. [Google Scholar] [CrossRef]
- IPCC. AR5 Climate Change 2013: The Physical Science Basis Contribution of Working Group I to the Fifth Assessment Report of the Intergovernmental Panel on Climate Change; Cambridge University Press: Cambridge, UK, 2013. [Google Scholar]
- IPCC. AR6 Climate Change 2021: The Physical Science Basis. Contribution of Working Group I to the Sixth Assessment Report of the Intergovernmental Panel on Climate Change; Cambridge University Press: Cambridge, UK, 2021. [Google Scholar]
- Gu, X.; Ye, L.; Xin, Q.; Zhang, C.; Zeng, F.; Sofia, D.; Papalexiou, S. Extreme Precipitation in China: A Review on Statistical Methods and Applications. Adv. Water Resour. 2022, 163, 104144. [Google Scholar] [CrossRef]
- Mizutori, M.; Guha, D. The Human Cost of Disasters: An Overview of the Last 20 Years (2000–2019). CRED & UNDRR 2020: 6–7. Available online: https://www.preventionweb.net/publication/human-cost-disasters-overview-last-20-years-2000-2019 (accessed on 23 January 2022).
- He, B. Thoughts and suggestions on the investigation of “7·20” extreme rainstorm disaster of four cities in mountainous area of Zhengzhou in Henan Province in 2021. China Flood Drought Manag. 2022, 32, 37–40, 51. [Google Scholar]
- Ministry of Emergency Management of China (MEM). Annual Report of Natural Hazards in 2021. 2022. Available online: https://www.mem.gov.cn/xw/yjglbgzdt/202201/t20220123_407204.shtml (accessed on 23 January 2022).
- Zhang, Q.; Singh, V.; Li, J.; Jiang, F.; Bai, Y. Spatio-temporal variations of precipitation extremes in Xinjiang, China. J. Hydrol. 2012, 434–435, 7–18. [Google Scholar]
- Song, X.; Zhang, J.; Kong, F. Probability distribution of extreme precipitation in Beijing based on extreme value theory. Sci. Sin. 2018, 48, 639–650. [Google Scholar] [CrossRef] [Green Version]
- Wang, H.; Pan, Y.; Chen, Z. Spatial and temporal patterns of temperature and precipitation extremes in the Huai River Basin, China in 1960–2014. Sci. Geogr. Sin. 2017, 37, 1900–1908. [Google Scholar] [CrossRef]
- Zhang, D.; Yan, D.; Wang, Y.; Lu, F.; Wu, D. Changes in extreme precipitation in the Huang-Huai-Hai River basin of China during 1960–2010. Theor. Appl. Climatol. 2015, 120, 195–209. [Google Scholar]
- Zhang, W.; Zhou, T. Significant increases in extreme precipitation and the associations with global warming over the global land monsoon regions. J. Clim. 2019, 32, 8465–8488. [Google Scholar] [CrossRef]
- Li, J.; Yu, R.; Sun, W. Duration and seasonality of the hourly extreme rainfall in the central-eastern part of China. Acta Meteorol. Sin. 2013, 27, 799–807. [Google Scholar] [CrossRef]
- Chen, H.; Sun, J. Changes in climate extreme events in China associated with warming. Int. J. Climatol. 2015, 35, 2735–2751. [Google Scholar] [CrossRef]
- Wang, L.; Yao, Z.; Jiang, L.; Wang, R.; Wu, S.; Lin, Z. Changes in Climate extremes and catastrophic events in the Mongolian Plateau from 1951 to 2012. J. Appl. Meteorol. Climatol. 2016, 55, 1169–1182. [Google Scholar] [CrossRef] [Green Version]
- Wang, H.; Asefa, T.; Erkyihun, S. Inter annual variabilities of the summer and winter extreme daily precipitation in the Southeastern United States. J. Hydrol. 2021, 603, 127013. [Google Scholar] [CrossRef]
- Taylor, K.; Stouffer, R.; Meehl, G. An overview of CMIP5 and the experiment design. Bull. Am. Meteorol. Soc. 2012, 93, 485–498. [Google Scholar] [CrossRef]
- Eyring, V.; Bony, S.; Meehl, G.; Senior, C.; Stevens, B.; Stouffer, R.; Taylor, K. Overview of the Coupled Model Intercomparison Project Phase 6 (CMIP6) experimental design and organization. Geosci. Model Dev. 2016, 9, 1937–1958. [Google Scholar] [CrossRef] [Green Version]
- Hamed, M.; Nashwan, M.; Shahid, S. Intercomparison of historical simulation and future projections of rainfall and temperature by CMIP5 and CMIP6 GCMs over Egypt. Int. J. Climatol. 2021, 42, 4316–4332. [Google Scholar] [CrossRef]
- Fu, G.; Charles, S.; Yu, J.; Liu, C. Decadal climatic variability, trends, and future scenarios for the north china plain. J. Clim. 2008, 22, 2111–2123. [Google Scholar] [CrossRef]
- Du, H.; Xia, J.; Zeng, S.; She, D.; Liu, J. Variations and statistical probability characteristic analysis of extreme precipitation events under climate change in Haihe river basin, china. Hydrol. Processes 2014, 28, 913–925. [Google Scholar] [CrossRef]
- Chen, H. Projected change in extreme rainfall events in China by the end of the 21st century using CMIP5 models. Chin. Sci. Bull. 2013, 58, 1462–1472. [Google Scholar] [CrossRef] [Green Version]
- Gao, X.; Shi, Y.; Zhang, D.; Wu, J.; Giorgi, F.; Ji, Z.; Wang, Y. Uncertainties in monsoon precipitation projections over China: Results from two high-resolution RCM simulations. Clim. Res. 2012, 52, 213–226. [Google Scholar] [CrossRef] [Green Version]
- Gouda, K.; Nahak, S.; Goswami, P. Evaluation of a GCM in seasonal forecasting of extreme rainfall events over continental India. Weather Clim. Extrem. 2018, 21, 10–16. [Google Scholar] [CrossRef]
- Yakaremye, V.; Zeng, G.; Yang, X.; Zhang, G.; Ayugi, B. Increased high-temperature extremes and associated population exposure in africa by the mid-21st century. Sci. Total Environ. 2021, 790, 148162. [Google Scholar] [CrossRef]
- IPCC. Global Warming of 1.5 °C; Cambridge University Press: Cambridge, UK, 2018. [Google Scholar]
- Betts, R.; Alfieri, L.; Bradshaw, C.; Caesar, J.; Feyen, L.; Friedlingstein, P.; Gohar, L.; Koutroulis, A.; Lewis, K.; Morfopoulos, C.; et al. Changes in climate extremes, fresh water availability and vulnerability to food insecurity projected at 1.5 °C and 2 °C global warming with a higher-resolution global climate model. Philos. Trans. R. Soc. A Math. Phys. Eng. Sci. 2018, 376, 20160452. [Google Scholar] [CrossRef]
- Su, B.; Huang, J.; Fischer, T.; Wang, Y.; WKundzewicz, Z.; Zhai, J.; Sun, H.; Wang, A.; Zeng, X.; Wang, G.; et al. Drought losses in China might double between the 1.5 °C and 2 °C warming. Proc. Natl. Acad. Sci. USA 2018, 115, 10600–10605. [Google Scholar] [CrossRef]
- UNFCCC. Paris Agreement. 2015. Available online: https://unfccc.int/sites/default/files/english_paris_agreement.pdf (accessed on 21 May 2019).
- Chen, J. Assessing changes of river discharge under global warming of 1.5 °C and 2 °C in the upper reaches of the Yangtze River Basin: Approach by using multiple GCMs and hydrological models. Quat. Int. 2017, 453, 63–73. [Google Scholar] [CrossRef]
- Zhai, R.; Tao, F.; Xu, Z. Spatial-temporal changes in runoff and terrestrial ecosystem water retention under 1.5 and 2 ℃ warming scenarios across China. Earth Syst. Dyn. 2018, 9, 717–738. [Google Scholar] [CrossRef] [Green Version]
- Wang, Y.; Wang, A.; Zhai, J.; Tao, H.; Jiang, T.; Su, B.; Yang, J.; Wang, G.; Liu, Q.; Gao, C.; et al. Tens of thousands additional deaths annually in cities of China between 1.5 °C and 2.0 °C warming. Nat. Commun. 2019, 10, 3376. [Google Scholar]
- Wang, G.; Zhang, J. Variation of water resources in the Huang-Huai-Hai areas and adaptive strategies to climate change. Quat. Int. 2015, 380–381, 180–186. [Google Scholar] [CrossRef]
- Dai, C.; Qin, X.; Lu, W.; Huang, Y. Assessing adaptation measures on agricultural water productivity under climate change: A case study of Huai River Basin, China. Sci. Total Environ. 2020, 721, 137777. [Google Scholar]
- Bian, G.; Zhang, J.; Chen, J.; Song, M.; He, R.; Liu, C.; Liu, Y.; Bao, Z.; Lin, Q.; Wang, G. Projecting Hydrological Responses to Climate Change Using CMIP6 Climate Scenarios for the Upper Huai River Basin, China. Front. Environ. Sci. 2021, 9, 602. [Google Scholar] [CrossRef]
- Mann, H. Nonparametric tests against trend. Econometrica 1945, 13, 245–259. [Google Scholar]
- Wang, G.; Yan, X.; Zhang, J.; Liu, C.; Jin, J.; Bao, Z.; Liu, Y. Detecting evolution trends in the recorded runoffs from the major rivers in China during 1950–2010. J. Water Clim. Chang. 2013, 4, 252–264. [Google Scholar] [CrossRef]
- Gemmer, M.; Fischer, T.; Jiang, T.; Su, B.; Liu, L. Trends in Precipitation Extremes in the Zhujiang River Basin, South China. J. Clim. 2011, 24, 750–761. [Google Scholar] [CrossRef]
- IPCC. Managing the Risks of Extreme Events and Disasters to Advance Climate Change Adaptation; Cambridge University Press: Cambridge, UK, 2012. [Google Scholar]
- Cannon, A. Selecting GCM Scenarios that Span the Range of Changes in a Multimodel Ensemble: Application to CMIP5 Climate Extremes Indices. J. Clim. 2015, 28, 1260–1267. [Google Scholar] [CrossRef]
- Dong, T.; Dong, W. Evaluation of extreme precipitation over Asia in CMIP6 models. Clim. Dyn. Obs. Theor. Comput. Res. Clim. Syst. 2021, 57, 1751–1769. [Google Scholar] [CrossRef]
- An, G.; Hao, Z. Variation of precipitation and streamflow in the upper and middle Huaihe River Basin, China, from 1959–2009. J. Coast. Res. 2017, 80, 69–79. [Google Scholar] [CrossRef]
- Alexander, L.; Zhang, X.; Peterson, T.; Caesar, J.; Gleason, B.; Klein Tank, A.; Haylock, M.; Collins, D.; Trewin, B.; Rahimzadeh, F. Global observed changes in daily climatic extremes of temperature and precipitation. J. Geophys. Res. 2006, 111, D05109. [Google Scholar] [CrossRef]
- Jones, P.; Horton, E.; Folland, C.; Hulme, M.; Parker, D.; Basnett, T. The use of indices to identify changes in climatic extremes. Weather. Clim. Extremes 1999, 42, 131–149. [Google Scholar] [CrossRef]
- Zhai, P.; Zhang, X.; Wan, H.; Pan, X. Trends in Total Precipitation and Frequency of Daily Precipitation Extremes over China. J. Clim. 2005, 18, 1096–1108. [Google Scholar] [CrossRef]
- Shi, J.; Cui, L.; Wang, J.; Du, H.; Wen, K. Changes in the temperature and precipitation extremes in China during 1961–2015. Quat. Int. 2019, 527, 64–78. [Google Scholar] [CrossRef]
- Peterson, T.; Taylor, M.; Demeritte, R.; Duncombe, D.; Burton, S.; Thompson, F.; Porter, A.; Mercedes, M.; Villegas, E.; Fils, R.; et al. Recent changes in climate extremes in the Caribbean region. J. Geophys. Res. Atmos. 2002, 107, 9–16. [Google Scholar] [CrossRef] [Green Version]
- Wang, L.; Zhang, J.; Shu, Z.; Wang, Y.; Bao, Z.; Liu, C.; Zhou, X.; Wang, G. Evaluation of the ability of CMIP6 global climate models to simulate precipitation in the Yellow River Basin, China. Front. Earth Sci. 2021, 9, 744462190. [Google Scholar] [CrossRef]
- Wang, L.; Ranasinghe, R.; Maskey, S.; van Gelder, P.H.A.J.M.; Vrijling, J.K. Comparison of empirical statistical methods for downscaling daily climate projections from cmip5 GCM: A case study of the Huai River Basin, China 2016. Int. J. Climatol. 2015, 36, 145–164. [Google Scholar] [CrossRef]
- Thompson, J.; Green, A.; Kingston, D.; Gosling, S. Assessment of uncertainty in river flow projections for the mekong river using multiple gcms and hydrological models. J. Hydrol. 2013, 486, 1–30. [Google Scholar] [CrossRef]
- Lee, T.; Galavi, H.; Huang, Y. Uncertainty in climate change impact studies: A review of developments and limitations. Int. J. Clim. Chang. Impacts Responses 2014, 6, 1–10. [Google Scholar]
- IPCC. Special Report on Emissions Scenarios; Cambridge University Press: Cambridge, UK, 2000. [Google Scholar]
- Van Vuuren, D.; Edmonds, J.; Kainuma, M.; Riahi, K.; Thomson, A.; Hibbard, K.; Hurtt, G.; Keam, T.; Krey, V.; Lamarque, J.; et al. Representative concentration pathways: An overview. Clim. Chang. 2011, 109, 5–31. [Google Scholar] [CrossRef]
- IPCC. AR4 Climate Change 2007: Impact, Adaptation and Vulnerability; Cambridge University Press: Cambridge, UK, 2007. [Google Scholar]
- IPCC. AR5 Climate Change 2014: Impact, Adaptation and Vulnerability; Cambridge University Press: Cambridge, UK, 2014. [Google Scholar]
- IPCC. AR6 Climate Change 2022: Impact, Adaptation and Vulnerability; Cambridge University Press: Cambridge, UK, 2022. [Google Scholar]
- Qiao, C.; Ning, Z.; Wang, Y.; Sun, J.; Lin, Q.; Wang, G. Impact of Climate Change on Water Availability in Water Source Areas of the South-to-North Water Diversion Project in China. Front. Earth Sci. 2021, 9, 747429. [Google Scholar] [CrossRef]
- Yang, C.; Yu, Z.; Hao, Z.; Zhang, J.; Zhu, J. Impact of climate change on flood and drought events in Huaihe River Basin, China. Hydrol. Res. 2012, 43, 14–22. [Google Scholar] [CrossRef]
- Wang, J.; Wang, G.; Elmahdi, A.; Bao, Z.; Yang, Q.; Shu, Z.; Song, M. Comparison of hydrological model ensemble forecasting based on multiple members and ensemble methods. Open Geosci. 2021, 13, 401–415. [Google Scholar] [CrossRef]
- Xia, J.; She, D.; Zhang, Y.; Du, H. Spatio-temporal trend and statistical distribution of extreme precipitation events in Huaihe River Basin during 1960–2009. J. Geogr. Sci. 2012, 22, 195–208. [Google Scholar] [CrossRef]
- Jin, H.; Chen, X.; Zhong, R.; Pan, Y.; Zhao, T.; Liu, Z.; Tu, X. Spatiotemporal distribution analysis of extreme precipitation in the Huaihe River Basin based on continuity. Nat. Hazards 2022. [Google Scholar] [CrossRef]
- Chen, C.; Shi, P.; Qu, S. Spatio-temporal trend of extreme precipitation in Huaihe River basin based on the future climate model. J. Xi’an Univ. Technol. 2019, 35, 494–500. [Google Scholar] [CrossRef]



| Model Name | Research Institutions | Original Resolution | Downscaling Resolution |
|---|---|---|---|
| CanESM5 | Canadian Center for Climate Modeling and Analysis, Canada | 2.8° × 2.8° | 0.5° × 0.5° |
| CNRM-ESM2-1 | Centre National de Recherches Météorologiques, France | 1.4° × 1.4° | 0.5° × 0.5° |
| IPSL-CM6A-LR | Institute Pierre Simon Laplace, France | 2.5° × 1.2676° | 0.5° × 0.5° |
| MIROC6 | Japan Agency for Marine-Earth Science and Technology, Japan | 1.4063° × 1.4° | 0.5° × 0.5° |
| MRI-ESM2-0 | Meteorological Research Institute, Japan | 1.125° × 1.12° | 0.5° × 0.5° |
| Name | Definition | Unit |
|---|---|---|
| AP | Sum of annual daily precipitation | mm |
| R95P | Total precipitation with daily precipitation ≥ 95% quantile value | mm |
| Rx1d | Maximum daily precipitation in a year | mm |
| Rr50 | Days with daily precipitation ≥ 50 mm in a year | day |
| Scenarios | Time Span | Tendency Rate (°C/10a) | M-K Statistics |
|---|---|---|---|
| Observed | 1995–2014 | 0.20 | 2.04 |
| Historical simulation | 1995–2014 | 0.26 | 3.70 |
| SSP1-2.6 | 2015–2100 | 0.14 | 6.20 |
| SSP2-4.5 | 2015–2100 | 0.30 | 11.04 |
| SSP3-7.0 | 2015–2100 | 0.50 | 12.07 |
| SSP5-8.5 | 2015–2100 | 0.67 | 12.63 |
| Scenarios | Time Span | AP | R95P | Rx1d | Rr50 |
|---|---|---|---|---|---|
| mm·a−1/− | mm·a−1/− | mm·a−1/− | d·(10a)−1/− | ||
| Observed | 1995–2014 | −1.02/−0.45 | −1.07/−0.58 | −0.33/−0.52 | −0.05/−0.45 |
| Historical simulation | 1995–2014 | 1.33/0.26 | −1.04/−0.58 | −0.78/−0.25 | −0.14/−1.10 |
| SSP1-2.6 | 2015–2100 | 0.97/2.92 | 0.44/2.61 | 0.04/0.74 | 0.03/2.25 |
| SSP2-4.5 | 2015–2100 | 1.00/4.59 | 0.66/3.60 | 0.06/2.73 | 0.04/2.50 |
| SSP3-7.0 | 2015–2100 | 1.45/2.91 | 0.54/2.88 | 0.12/1.37 | 0.04/2.58 |
| SSP5-8.5 | 2015–2100 | 2.10/5.64 | 1.10/5.41 | 0.23/4.69 | 0.07/4.23 |
| GCMs | Emission Scenarios | 1.5 °C Global Warming | 2 °C Global Warming |
|---|---|---|---|
| CanESM5 | SSP1-2.6 | 2024–2043 | 2037–2056 |
| SSP2-4.5 | 2024–2043 | 2035–2054 | |
| SSP3-7.0 | 2024–2043 | 2034–2053 | |
| SSP5-8.5 | 2023–2042 | 2033–2052 | |
| CNRM-ESM2-1 | SSP1-2.6 | 2038–2057 | / |
| SSP2-4.5 | 2028–2047 | 2046–2065 | |
| SSP3-7.0 | 2027–2046 | 2043–2062 | |
| SSP5-8.5 | 2023–2042 | 2036–2055 | |
| IPSL-CM6A-LR | SSP1-2.6 | 2020–2039 | 2039–2058 |
| SSP2-4.5 | 2019–2038 | 2034–2053 | |
| SSP3-7.0 | 2020–2039 | 2035–2054 | |
| SSP5-8.5 | 2019–2038 | 2035–2054 | |
| MIROC6 | SSP1-2.6 | 2054–2073 | / |
| SSP2-4.5 | 2037–2056 | 2064–2083 | |
| SSP3-7.0 | 2034–2053 | 2050–2069 | |
| SSP5-8.5 | 2031–2050 | 2044–2063 | |
| MRI-ESM2-0 | SSP1-2.6 | 2020–2039 | / |
| SSP2-4.5 | 2021–2040 | 2040–2059 | |
| SSP3-7.0 | 2022–2041 | 2036–2055 | |
| SSP5-8.5 | 2017–2036 | 2029–2048 |
Publisher’s Note: MDPI stays neutral with regard to jurisdictional claims in published maps and institutional affiliations. |
© 2022 by the authors. Licensee MDPI, Basel, Switzerland. This article is an open access article distributed under the terms and conditions of the Creative Commons Attribution (CC BY) license (https://creativecommons.org/licenses/by/4.0/).
Share and Cite
Wang, Y.; Wang, Y.; Wang, Y.; Ju, Q.; Jin, J.; Bao, Z. Projecting Changes in Rainfall Extremes for the Huai River Basin in the Context of 1.5 °C and 2 °C Global Warming. Atmosphere 2022, 13, 1708. https://doi.org/10.3390/atmos13101708
Wang Y, Wang Y, Wang Y, Ju Q, Jin J, Bao Z. Projecting Changes in Rainfall Extremes for the Huai River Basin in the Context of 1.5 °C and 2 °C Global Warming. Atmosphere. 2022; 13(10):1708. https://doi.org/10.3390/atmos13101708
Chicago/Turabian StyleWang, Yueyang, Yanjun Wang, Yan Wang, Qin Ju, Junliang Jin, and Zhenxin Bao. 2022. "Projecting Changes in Rainfall Extremes for the Huai River Basin in the Context of 1.5 °C and 2 °C Global Warming" Atmosphere 13, no. 10: 1708. https://doi.org/10.3390/atmos13101708
APA StyleWang, Y., Wang, Y., Wang, Y., Ju, Q., Jin, J., & Bao, Z. (2022). Projecting Changes in Rainfall Extremes for the Huai River Basin in the Context of 1.5 °C and 2 °C Global Warming. Atmosphere, 13(10), 1708. https://doi.org/10.3390/atmos13101708


