Article

An Integrated Air Quality Improvement Path of Energy-Environment Policies in the Guangdong-Hong Kong-Macao Greater Bay Area

Guangdong Provincial Environmental Protection Key Laboratory of Atmospheric Environment Management and Policy Simulation, Guangdong Provincial Academy of Environmental Science, Guangzhou 510045, China
*
Author to whom correspondence should be addressed.
Atmosphere 2022, 13(11), 1841; https://doi.org/10.3390/atmos13111841
Submission received: 10 October 2022 / Revised: 27 October 2022 / Accepted: 3 November 2022 / Published: 4 November 2022

Abstract

:
Energy-related clean air measures in the Guangdong–Hong Kong–Macao Greater Bay Area (GBA) can yield substantial air quality improvement benefits and promote energy structure optimization. Here, we first evaluate the reduction effect of the stringent energy-related clean air measures in the GBA during the 13th Five-Year Plan period. First, a reduction of 19.3% emission in air pollutant equivalent was measured in 2020 compared to 2015. Second, we compare the energy structure development and air quality benefits of energy-environment policy scenarios by 2025 (SBAU, SA, SO) geared towards proposing integrated energy-environment development paths of air quality improvement. Under SBUA, SA and SO, the annual average PM2.5 concentration will be 21.7, 19.9 and 18.1 μg/m3, respectively, and the total energy demand would be controlled within 318.9, 300.6 and 282.3 Mtce in the GBA in 2025, reaching 7.5%, 8.4% and 9.4% of SO2, 23.5%, 29.3% and 35.4% of NOX, 18.2%, 19.6% and 22.7% of primary PM2.5, and 25.1%, 29.9% and 34.7% of VOCs emission reductions compared to 2020, respectively. Our study proposes that it is necessary for the GBA to jointly set up regional air quality improvement targets and issue integrated regional energy-environment policies in the process of building an “Air Quality Improvement Pioneering Demonstration Area”.

1. Introduction

The Guangdong–Hong Kong–Macao Greater Bay Area (GBA), as one of the fastest-growing regions in China, is suffering from increasing pressure on controlling air pollution [1]. Although the air quality has been significantly improved in recent years, air pollution occurs frequently in cities within the GBA and even in the entire region [2]. Economic developments and urbanization are highly energy-dependent, which brings huge challenges in energy-environment policy as it tries to seek a balance between addressing air pollution and the security of energy system [3]. The energy structure and the degree of clean energy utilization in the GBA are relatively more sustainable in comparison with the highly coal-dependent energy structure nationwide (57%), as the coal consumption in the GBA accounted for less than one third of total energy consumption [4]. Taking benefits from the implementation of energy-related clean air measures such as coal consumption cap, energy structure adjustment, end-of-pipe measures of energy-intensive industries, the air quality of the GBA is better than that of the Beijing–Tianjin–Hebei and Yangtze River Delta regions in China, but it is still far from the level of advanced bay areas such as the three major bay areas in the US and the Tokyo Bay Area in Japan [5]. While continuous efforts on reducing the PM2.5 concentration and reversing the rising trend of O3 concentration are needed, the GBA also faced the problems of high dependence on external energy. In 2020, the regional energy dependence was as high as 75%, of which 100% of coal demand, 76% of crude oil demand and 55% of natural gas demand were imported from overseas or transferred from other regions in China [6]. Under the goal of reaching a world-class air quality, how to balance the growing energy demand brought by economy development and the urgent need of air pollutant emission reduction is one of the critical issues to be tackle by the governments in the GBA.
Studies have been carried out on the influences of energy-environment policies on air quality from both home and aboard. By forecasting the emission changes for key air pollutants, Vasilakos et al. found that the Zero Carbon Clean Energy Plan will produce air quality benefits to the reductions in ozone and PM mainly in the eastern US [7]. Tudor et al. assessed the EU Net-Zero Policy achievement of greenhouse gas and air pollutants in Central and Eastern Europe through automated forecasting algorithms [8]. Danek et al. used public data from low-cost sensor to show the significant reduction effect of the “no coal” policy on air pollution in Krakow [9]. Current domestic research also focuses on the emission reduction effects of clean air measures in coal-intensive and energy-intensive sectors [10,11]. Energy-related air pollution control actions in China from 2013 dramatically improved the national air quality and led to the co-benefits of a cleaner and more efficient energy system [12,13]. Tong et al. pointed out the importance of energy structure adjustment for air quality compliance in the Beijing–Tianjin–Hebei region [14].
Driven by ambitious clean air policies, substantial declines in air pollutant emissions after years of efforts during the 13th Five-Year Plan period (2015–2020) led to dramatic improvement of air quality in the GBA [15]. Previous regional-focused studies have demonstrated air pollutant mitigation effects brought from the implementation of air pollution control measures in industrial and transportation sectors in cities within the GBA [16,17,18,19,20], while insufficient studies have been conducted on the integrated air quality improvement path based on energy-induced structure adjustment policies from the perspective of entire GBA. In addition, with the recovery of industrial production and economic development in the GBA after the COVID-19 pandemic, the GBA will face more severe pressure for energy system optimization and air quality improvement in the future. Therefore, it is necessary to assess the air pollutant emission reduction benefits of energy-related clean air measures already implemented in the entire GBA. It is also important to predict the policies’ influence on future air quality and propose feasible policy paths for policymakers before drafting policies. Moreover, since no coordinated regional air quality improvement plan has been promulgated for the GBA, concerns on how to strengthen integrated clean air actions are also in need from the perspective of the entire GBA under the goal of jointly building a “Air Quality Improvement Pioneering Demonstration Area”.
To support the “Air Quality Improvement Pioneering Demonstration Area” initiative in the GBA, this research first conducts an ex-post assessment on the impact of those major clean air measures in the perspective of entire GBA during the 13th Five-Year Plan period. Then, based on the prediction of the development trends by 2025 in the GBA, three scenarios implemented with different energy-related clean air measures are set on the base of 2020 to compare the benefits of air quality improvement and the green development progress of energy system. This study also adapts the Community Multiscale Air Quality Model (CMAQ) model to simulate the change of annual average concentration of PM2.5 in the GBA. Finally, based on results from scenario analysis, the study puts forward energy-environmental strategy suggestions based on air quality improvement and green adjustment strategies of the energy system in the GBA for the middle of the 14th Five-Year Plan period and demonstrates recommendations and feasible policy paths for the building of “Air Quality Improvement Pioneering Demonstration Area” and promoting the integration of clean air action and green energy system transition in the GBA.

2. Materials and Methods

2.1. An Overview of the GBA

The GBA includes nine cities in the Pearl River Delta (PRD) as well as Hong Kong and Macao, contributing 12% of the country’s GDP and 5% of the country’s population [21]. As shown in Figure 1, from 2015 to 2020, the annual average concentration of air pollutants in the GBA for SO2, NO2, PM2.5, PM10 and CO decreased by 50%, 20%, 7%, 23%, 31% and 16%, respectively, which exhibited a discernible downward trend with a descending rate of about 1.2, 1.2, 2, 1.8 and 23.8 μg/m3 per year respectively. While for O3, the annual concentration for O3–8h showed a trend of first increasing and then slightly fluctuating downward, and the annual average concentration in the GBA for O3–8h exceeded the national the daily maximum 8 h average concentration limit (160 μg/m3) between 2017 and 2019 [22]. The change of annual average of O3–8h from 2015 to 2020 reflected that the photochemical smog problem in the GBA has not yet been resolved. It will be an urgent need for governments in the GBA to continue to implement emission reduction measures to tackle the air pollution problem and further improve the air quality in the GBA.
Governments in the PRD, Hong Kong and Macao from 2015 to 2020 had promulgated and implemented measures including optimizing energy, industrial and transportation structure, promoting clean power structure, retiring old vehicles, and promoting new energy vehicles, and so on. At the same time, more aggressive energy-saving and emission-reduction actions were taken in the PRD in the fields of phasing out outdated industrial capacities, clean energy transition for industrial sector, pollution control on industrial boilers and kilns as well as ultra-low emission transformation of the coal-power sector.

2.2. Emissions and Emission Reduction Effects Estimation

The air pollutant emissions (i.e., SO2, NOx, primary PM2.5, VOCs) in the GBA were estimated by multiplying industrial and transportation activity data by corresponding fossil fuel consumption related emission factors [23]:
E I , i = ef I , i × C k × 1 η i × κ i
E V , i = ef V , i × C k × P × V K T
where E I , i and E V , i were the amount of pollutant i emitted from energy consumption brought by industrial production or the use of vehicles, in t. ef I and ef V , i were energy-related emission factors for industrial and transportation activities, which were derived from previous regional researches [24]. C k was the value of consumption for energy i, in tce. η τ , i was the average removal efficiency of the end-of-pipe treatment technology adopted by air pollutant i in the industry, in %. κ i was the operation rate of the end-of-pipe treatment technology adopted by air pollutant i in the industry, in %. P   was the value of vehicle ownership. V K T was the average annual mileage of the vehicle, in km.
The air pollutant reduction benefits were estimated as follows:
E i , k = E i , j 0 E i , j
where E i , j denoted the reduction benefits from measure k. E i , j 0 denoted the emission of pollutant i without implementing measure j, while E i , j stated the emission of pollutant i after the implementation of measure j.
To compare the emission reduction benefits from different energy-environment policies, emission reduction sharing rate (SR) of a measure was defined as the ratio of the emission reduction produced by the measure ( E A , j ) to the total emission reduction produced by all measures ( E A , j ) [25,26]. Emission reduction sharing rate was estimated on the base of air pollutant equivalent (EA). Air pollutant equivalent was calculated as follows.
E A = α Q S O 2 + β Q N O x + γ Q P M + σ Q V O C s
SR = E A , j E A , j
where α , β , γ and σ were the conversion coefficients of air pollutant emissions to air pollutant equivalent. The equivalent coefficients value for SO2, NOx and primary PM2.5 were 0.95, 0.95 and 2.18, respectively, derived from the “Environmental Protection Tax Law of the People’s Republic of China”. Furthermore, the equivalent coefficient value for VOCs was 0.95, taken from the “Measures for the Pilot Program of Volatile Organic Compound Pollution Charges” from ministry of finance of China.

2.3. Scenario Analysis

2.3.1. Overview of Scenarios

This study assumed that the GBA will further accelerate the transition toward a cleaner and highly efficient energy system as well as continue to carry out clean air actions from both source management and end-of-pipe treatment to promote green growth of energy, industrial and transportation sectors by 2025. Based on assumptions made here, the air quality improvement target was set to reach 21 μg/m3 of PM2.5 annual average concentration in the GBA by 2025.
Targeting 2025 while taking 2020 as the base year, one baseline scenario (SBAU) and two control scenarios (adjustment scenario, SA, and optimization scenario, SO) were set to characterize the different development paths of the GBA to achieve the assumed goal mentioned above. By forecasting the base development trend of industry, transportation and energy systems under current energy-environment policies, the energy supply and demand structure for SBAU in 2025 was first estimated. SA and SO were set based on SBAU and described a moderately enhanced policy scenario and an aggressive intensified policy scenario respectively (Table 1). Then, energy-based air pollutant emissions, as well as emissions reduction from end-of-pipe measures under each condition, were calculated. This study also proposed an energy-related clean air path recommendation for the integrated development of energy and environment policies in the GBA under the goal of continuous air quality improvement after analyzing the benefits of air pollutant emission reduction, air quality improvement and clean energy development from different scenarios.

2.3.2. Forecasting Future Energy Development in the GBA

By analyzing the regional economic and social growth, the amount of exploitable energy resources, the construction period of energy projects, and the price mechanism of energy, Song et al. [27] believed that the total demand for end-use energy will exceed 300 Mtce by 2025 in the GBA. Zhang et al. [28] pointed out that the electrification process of end-use energy will further increase the scale of electricity demand in the GBA. Zhang also stated that due to the high dependence on external energy, natural gas will play a key role in optimizing regional energy system in the GBA during the 14th Five-Year Plan period, while new energy, such as hydrogen power and photovoltaic power, will usher in rapid development opportunities.
Energy consumption demand is closely related to the development trend of regional industry and transportation. The sectoral energy demand was calculated using the elastic coefficient method according to Wang et al. [29].
C s , k t = C s , k t 1 + c o e f k × R G D P , s
where C s , k t was the demand for energy k by sector s, in Mtce and c o e f k was the elasticity coefficient of energy k, representing the ratio of the average annual growth rate of power consumption to the growth rate of GDP in a defined period. According to research from Sun et al., the coefficient in the GBA during the 14th Five-Year Plan period would be 0.8 [30], and R G D P , s was the GDP growth rate in sector s.
Elastic coefficient method could be used to predict the development trends of industrial added value, product yield, and vehicle ownership by analyzing the relationship between economic activities and estimated parameters [31]. The yield of product m ( P m t ) in year t was calculated as an example:
P m t = P m , 0 × 1 + c o e f m × R G D P t b a s e   y e a r
where P m , 0 was the yield of product m in the base year, in t. c o e f i × R G D P , i was the annual growth rate of the industry for product m. c o e f m represented the elastic coefficient and R G D P was the annual GDP growth rate of the GBA in year t.
The energy demand in the industrial sector was estimated with the use of the Kaya formula to expand the regional energy consumption first, and then apply the LMDI (logarithmic mean Divisia index) method and the elasticity analysis method to decompose the industrial development trend into the change of energy consumption and predict the yield of a product.
C I n d = P m × G D P P m × G D P m G D P × C m , k t G D P m
where C I n d was the total energy consumption demand of the industrial sector, in ktce. P m was the yield of product i, in kt. G D P m G D P represented the proportion of the gross production value of product m in the regional GDP. C m , k t G D P m denoted the energy consumption intensity of the added value of product m per 10 thousand yuan.
The development of passenger and freight transport demands in the GBA was predicted by multiple linear regression analysis. For example, assuming that the freight volume was affected by multiple factors such as GDP (x1), the added value of the primary, secondary and tertiary industry (x2, x3, x4), the total import and export volume (x5), the residents’ consumption (x6) and social retail sales (x7), the multiple linear regression model of freight transport demand ( Y ) was set as follows.
Y = β 0 + β 1 x 1 + β 2 x 2 + + β 7 x 7
where β k (k = 0, 1, …, 7) was the regression coefficient for the equation.

2.4. Air Quality Simulations

The chemical transport model Model-3/CMAQ version 5.0.22 [32] was used to simulate the annual PM2.5 concentration that can be achieved under each energy-environment policy scenario studied in this study. The CMAQ model used the triple nested grid of Lambert projection for simulations with the grid resolutions of 27 km × 27 km, 9 km × 9 km, and 3 km × 3 km from outside to inside. The GBA was in the center of the innermost 3 km × 3 km simulation domain. The vertical direction of the model adopted the sigma coordinate system with a total of 14 layers. CB-05 was used as the gas phase chemical mechanism, and AERO6 was used for aerosol chemistry [33]. The meteorological driving data were obtained from the mesoscale meteorological prediction model WRF V3.9.0.1 [34] and the microphysical scheme was Morrison-2moment [35], while the boundary layer and near surface schemes were taken from ACM2 [36] and Pleim-Xiu [37], respectively. The input data of the WRF used the 6-h global meteorological reanalysis data (FNL) released by the National Center for environmental prediction (NCEP) of the US which were assimilated by the radiosonde and ground station observation data in the corresponding periods. In the three-layer nested CMAQ model, the outer and middle layers used an anthropogenic emission inventory MEICv1.3 (multi-resolution emission inventory) [38] in mainland China with a resolution of 0.25° × 0.25° and a resolution of 0.1° × 0.1°, the coupled emission inventory composed of the global anthropogenic source emission inventory [39], and the inner layer adopts the 3 km × 3 km anthropogenic source emission inventory included emissions from industries, transportation, residential livings, agriculture and biomass burning, basing on the current data of population, industrial developments and motor vehicle ownerships and localized emission factors in the GBA in 2017 [40,41]. To improve the representativeness of the simulation, the meteorological input data used in the base case simulation were all 2017 data. Note that, according to the National Bulletin of Atmospheric Environment [42], the overall national meteorological conditions in 2017 were close to the average of the past five years. The emission estimation models mentioned above were used to assess how policies would impact air pollutant emissions, the results of which were used for the modeling. When simulating each scenario in 2025, the innermost GBA region used the 2025 scenario inventory prepared in this study and other regions used the anthropogenic emission scenarios of DPEC in 2025. Scenario-based emission inventory was transformed to the model-ready format by SMOKE model. MEIC and DPEC data are available at http://meicmodel.org/ (accessed on 9 September 2022). The biogenic emission sources used in the simulations were prepared by Model of Emissions of Gases and Aerosols from Nature (MEGAN) version 2.10 [43]. The emission sources for sea salt and windblown dust are calculated by the CMAQ model online.
To assure the data quality, the simulated concentration of PM2.5 from CMAQ was compared with observation data. The simulated PM2.5 concentration was corrected by the observed concentration, as well as by the base case simulations, which would help to control the quality of predicted outputs. The formula of simulation error elevations was as follows:
C o n c i , j = O i , j × C S i C B i
where C o n c i , j   represented the predicted value of the PM2.5 concentration in city i and in simulated day j after error corrections. O i , j represented the PM2.5 observation data from the monitoring network, C B i represents the simulation value of the benchmark scenario,   C S i represented the simulation value of the development scenarios.

3. Results

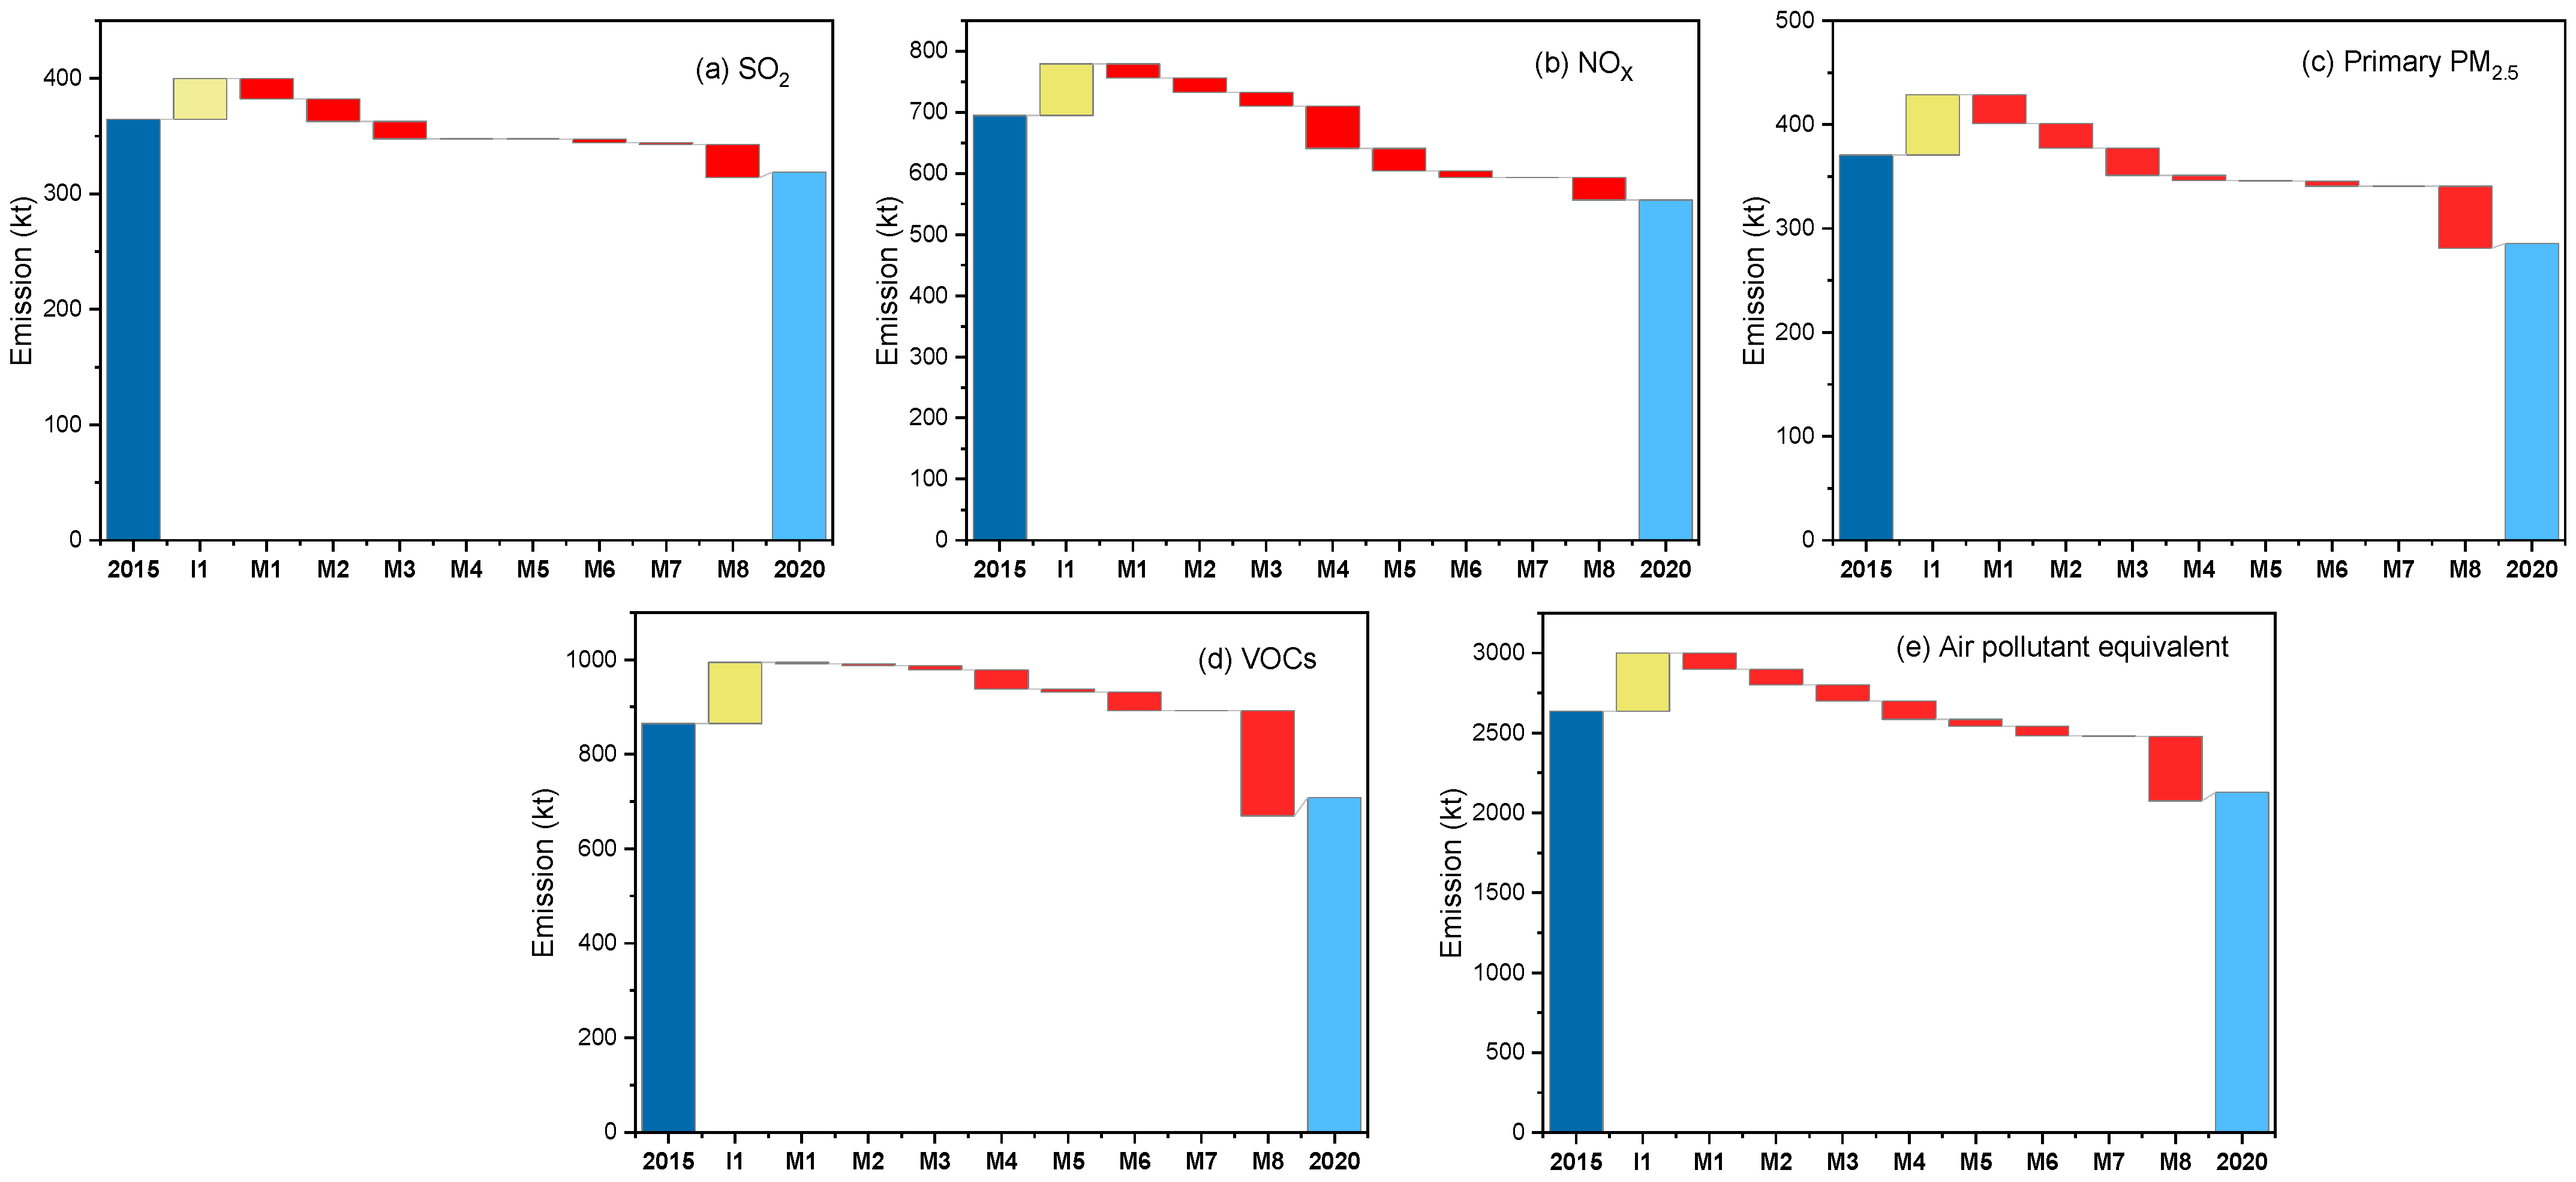
3.1. Emission Reduction Effect of Energy-Environment Policy Implemented in the GBA

The emissions of SO2, NOx, primary PM2.5 and VOCs in the GBA were 364.6, 694.9, 370.7 and 865.3 kt respectively in 2015 [44,45,46,47]. With the implementation of energy-related clean air measures, the regional emissions of SO2, NOx, primary PM2.5 and VOCs in the GBA were estimated to decline by about 23.6%, 32.1%, 39.8% and 37.6% compared with 2015, respectively. The total emission reduction volume converted to air pollutant equivalent was 923.7 kt. The air pollutant equivalent emission reduction ratios consisted of 9.3% SO2 reduction, 24.2% NOx reduction, 35.5% primary PM2.5 reduction and 31.0% VOCs reduction, denoting that emissions reduction of primary PM2.5 and VOCs contributed significant benefits to air pollution control action during the 13th Five-Year Plan period.
Economic and social development (I1) led to an increase of 35.3 kt SO2, 84.5 kt NOx, 57.5 kt primary PM2.5 and 129.3 kt VOCs emissions in the GBA from 2015 to 2020, which was offset by eight major energy-related clean air measures summarized in Figure 2 (i.e., power structure adjustment (M1), end-use energy structure adjustment in coal-intensive industries (M2), phasing out outdated industrial capacity (M3), retiring yellow-label and old vehicles (M4), promoting new energy vehicles (M5), transportation structure adjustment (M6), energy efficiency improvement of vehicles (M7), and industrial end-of-pipe control measures (M8)). Industrial end-of-pipe control measures performed a reduction of 403.7 kt air pollutant equivalent in general, with the highest air pollutant emission reduction share rate of 43.7% among all measures. Energy-related measures such as end-use energy structure adjustment in coal-intensive industries, power structure adjustment, phasing out outdated industrial capacity, retiring yellow-label and old vehicles also showed satisfactory emission reduction benefits, which contributing 96.2, 100.9, 102.2 and 114.8 kt emission reduction of air pollutant equivalent, respectively. The air pollutant emission reduction share rate of them were 10.4%, 10.9%, 11.1% and 12.4% respectively. The emission reduction benefit of promoting new energy vehicles, transportation structure adjustment and energy efficiency improvement of vehicles were not as effective as measures in the industrial and energy sectors, with a total air pollutant emission reduction share rate of 11.5% and air pollutant equivalent reduction of 41.9, 62.1 and 1.9 kt, respectively.

3.2. Scenario Analysis of Energy Consumption Development in the GBA

The in-depth implementation of energy environment policies in the GBA will successfully slow down the rapid growth rate of regional energy consumption demand by 2025. Energy demand of SBUA, SA and SO are estimated to reach about 318.9, 300.6 and 282.3 Mtce with an average annual growth rate of 4.5%, 3.1% and 1.7% respectively (Table 2). Under SO, regional energy demand will drop by nearly 6.1% compared with SA, and by almost 11.4% compared with SBAU. Continuously taking the green transformation path, the primary energy structure in the GBA by 2025 is expected to be cleaner and more sustainable than now, of which coal, oil, natural gas, and electricity will account for 7.3%, 26.6%, 7.2% and 58.0% in SBUA, 5.9%, 25.7%,7.5% and 60.9% in SA, and 5.7%, 25.5%, 7.5% and 61.3% in SO, respectively. As for regional power supply structure, it is predicted that by 2025, the power structure of SBUA will be consist of about 12.4% coal power, 30.9% natural gas power, and 56.5% from renewable energy. Under SA and SO, 11.9% and 10.6% will be supplied by coal power, 31.3% and 30% will be supplied by natural gas power, and 56.8% and 59.4% will be generated from renewable energy, respectively. In addition, the GBA will still highly rely on external electricity transmission to alleviate the growing electricity demand driven by economic development and electrification promotion measures. Under SBAU, SA, and SO, external electricity transmission will meet 46.1%, 45.9% and 44.1% of the electricity demand in the GBA by 2025, respectively.
According to released development plans and the overall positioning of the new development stage of the GBA, previous research estimated the overall GDP of the GBA will exceed 19 trillion yuan by 2025, the per capita GDP will reach about 200 thousand yuan, and the urbanization rate will exceed 90% with a population of 96 million [48]. The development of primary industry in the GBA will maintain the status quo, the energy consumption of primary industry in three scenarios thus will all be about 2.34 Mtce in 2025, less than 1% of the total energy consumption. While expecting a green and sustainable growth of industry by 2025, the energy consumption of the secondary industry of SBAU, SA and SO thus will reach 177.1, 166.8 and 157.8 Mtce, respectively, which accounting for 55.5%, 55.5% and 55.9% of their total energy consumption. Furthermore, the energy consumption of the tertiary industry, mostly in the service industry, accounts for 9.3%, 9.3% and 9.1% of total energy consumption under SBAU, SA and SO. The energy consumption of the tertiary industry is concentrated on electricity consumption, accounting for 86.5%, 89.1% and 89.6% of the energy consumption of the tertiary industry of SBAU, SA and SO respectively.
In the transportation sector, the total energy consumption in SBAU, SA and SO are assumed to be 61.9, 59.4 and 57.1 Mtce in 2025, respectively. In SBAU, 70% of diesel vehicles and natural gas vehicles below China III will be retired in the PRD by 2025, and a large proportion of diesel vehicles under China II in Hong Kong and Macao will be retired as well. In SA, the PRD will retire most of diesel and natural gas vehicles under China III and Hong Kong and Macao will promote retiring diesel and natural gas vehicles under China II, and in SO, diesel vehicles under China III and light-duty gasoline vehicles under China I will be completely retired in the GBA.

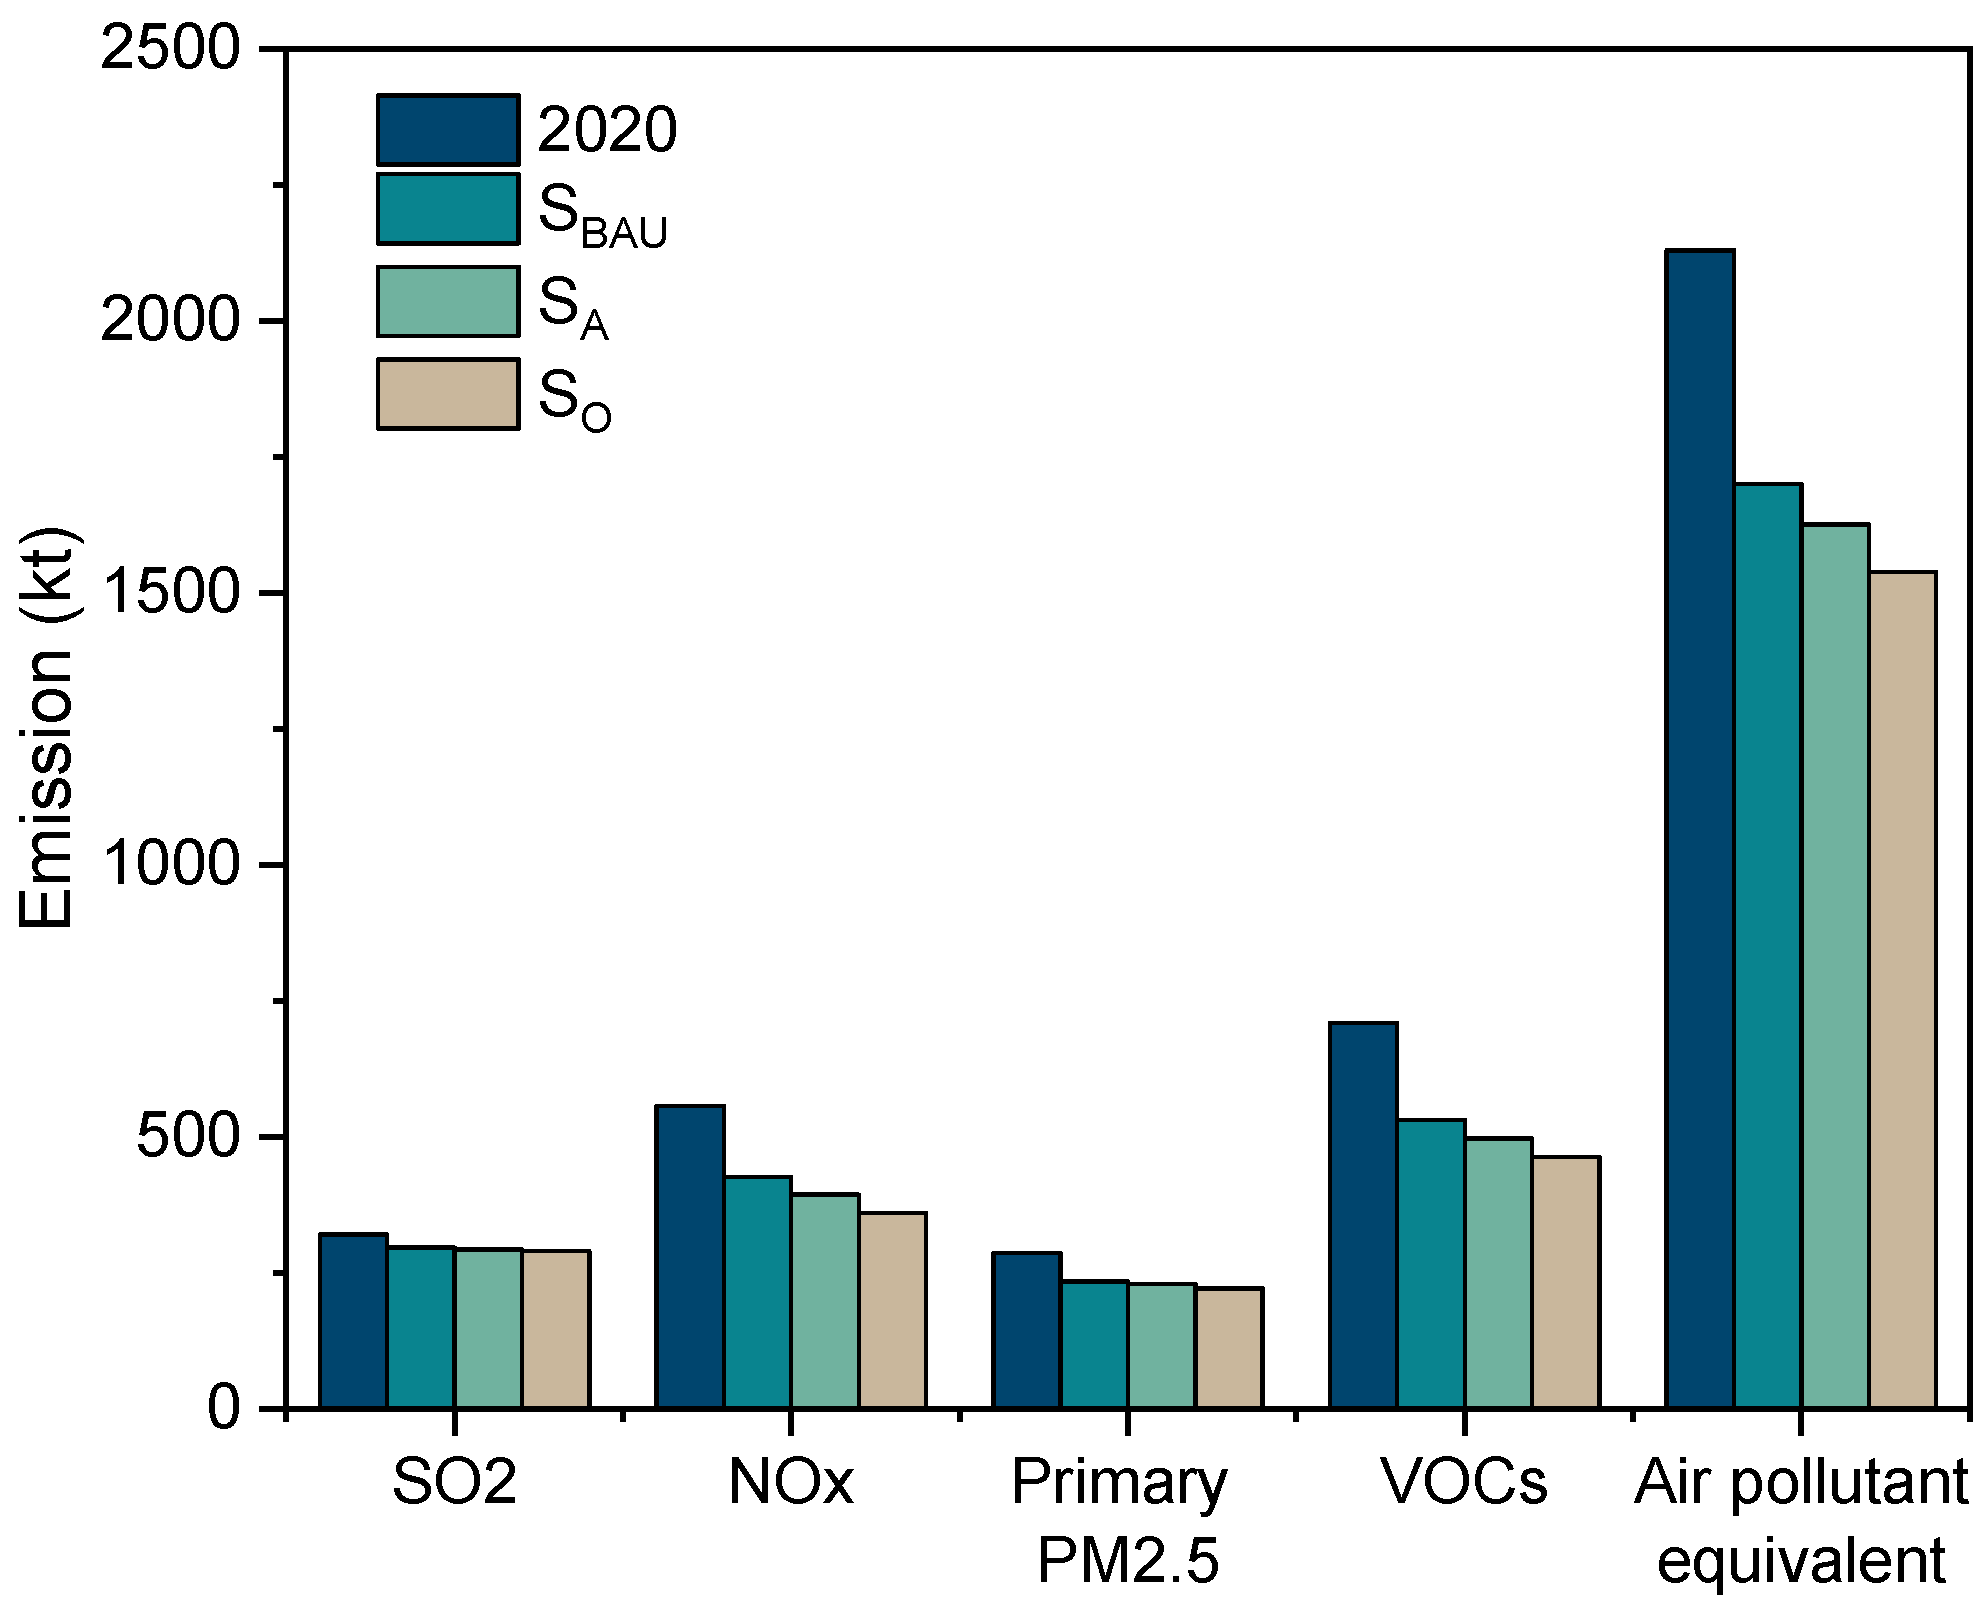
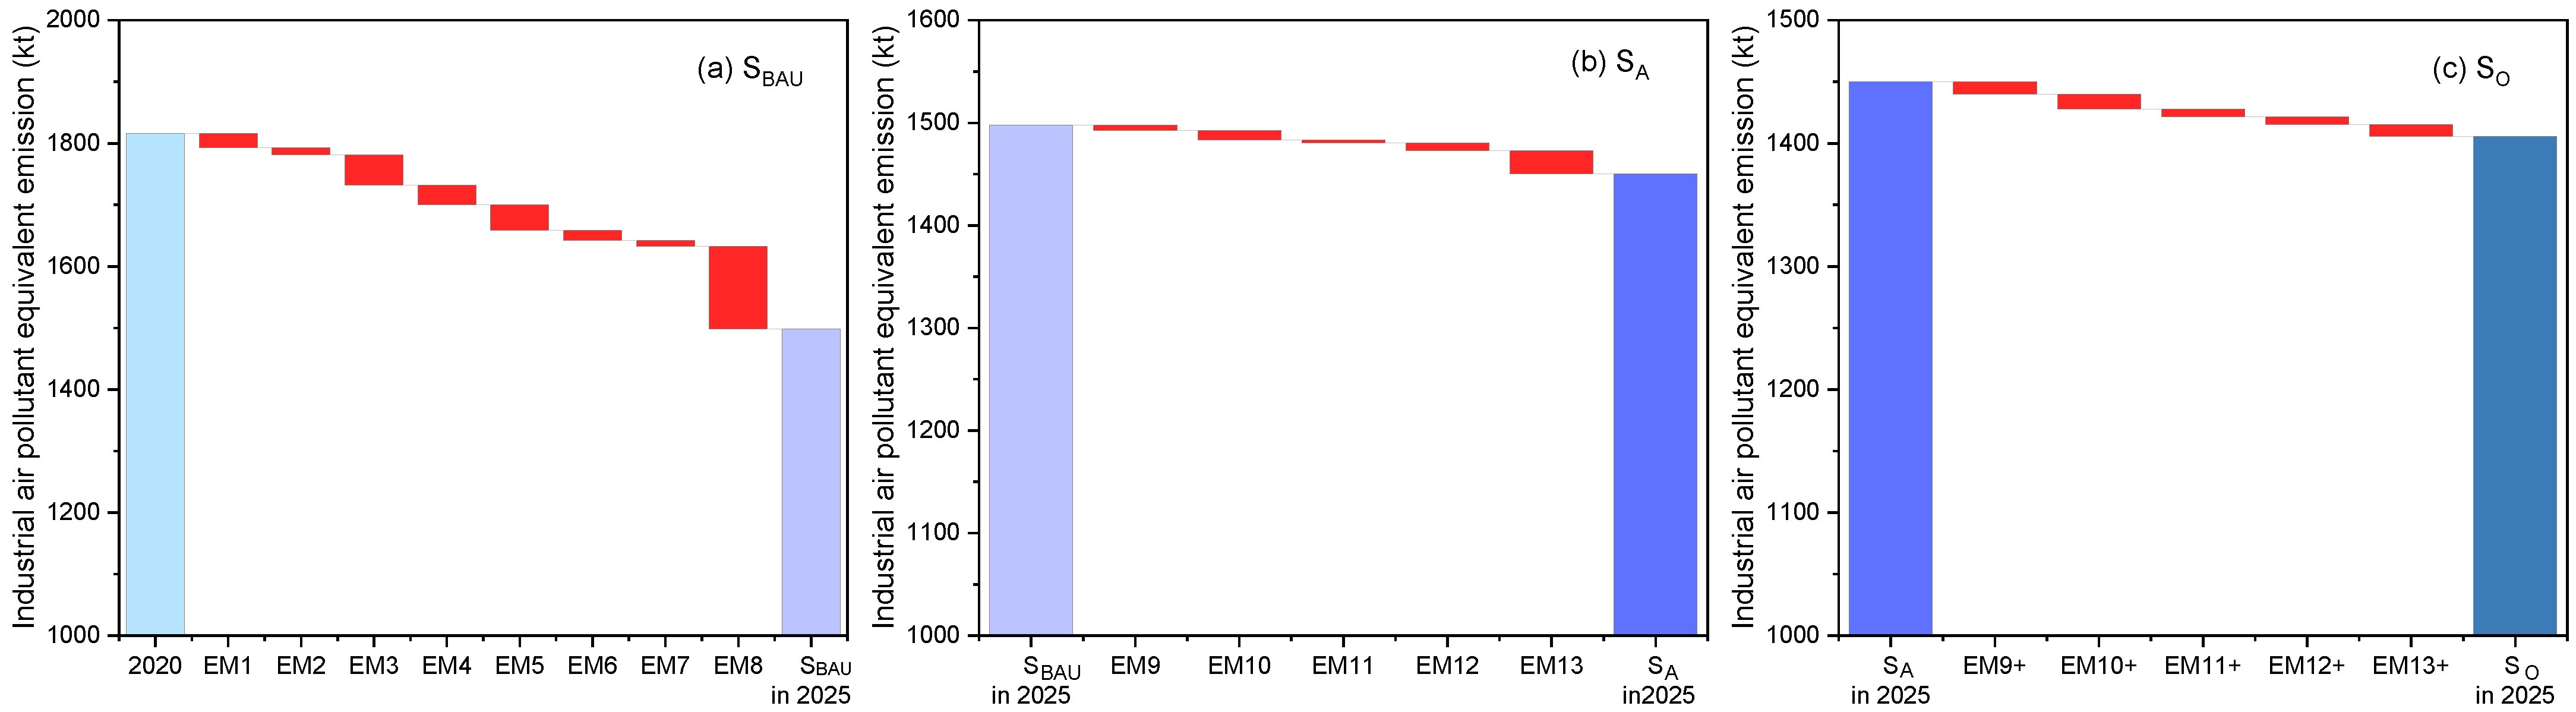
3.3. Scenario Analysis of Air Pollutant Emissions in the GBA

Under SBAU, the implementation of as usual energy-environment policies in the GBA is estimated to reduce 24 kt SO2, 131 kt NOx, 53 kt primary PM2.5 and 178 kt VOCs in 2025. The cumulative reduction of 429.7 kt of air pollutant equivalent indicates a sharp decline of air pollutant emission by 20.2% compared to the emission level in 2020. As found in Figure 3, under SA and SO, the air pollutant emissions are dramatically reduced in 2025, with emissions reduction of 26 and 30 kt SO2, 163 and 197 kt NOx, 56 and 65 kt primary PM2.5 as well as 211 and 246 kt VOCs, respectively. The cumulative reduction of SA and SO are 503.2 and 591.1 kt air pollutant equivalent, which decrease by 23.6% and 27.7% than the base year and generate an additional air pollutant equivalent reduction of 17.1% and 37.5% compared to SBAU.
Benefiting from the stringent implementation of regional energy-environment policies, the emission reduction of air pollutants achieved by SA and SO in transportation and industrial sectors are significantly higher than that achieved by SBAU in 2025. In the transportation sector, SBAU, SA and SO will reduce 92, 117 and 141 kt NOx, 3, 3 and 5 kt primary PM2.5, as well as 18, 29 and 23 kt VOCs, respectively. In industrial sector, SBAU, SA and SO will achieve 24, 26 and 30 kt SO2 reduction, 39, 46 and 56 kt NOx reduction, 49, 53 and 60 kt primary PM2.5 reduction as well as 160, 192 and 223 kt VOCs reduction, respectively. In general, SA and SO will cut down 23.1% and 50.1% additional air pollutant equivalent emissions in the transportation sector than SBAU, and SA and SO will mitigate 15.3% and 33.8% additional emission in the industrial sector than SBAU as well. Moreover, all SO2 emission reduction benefits are generated from the industrial sector, while the NOx emission reduction in the transportation sector accounts for 70.2%, 71.7% and 71.6% of the total NOx emission reduction for the three scenarios, respectively. The reductions of primary PM2.5 and VOCs are benefit from clean air actions in the industrial sector, as the clean air measured implemented in the three scenarios bring a decline in primary PM2.5 by 94.2%, 94.6% and 92.3% and in VOCs by 89.8%, 90.5% and 90.7%, respectively.
Figure 4 denotes that clean air measures such as industrial end-of-pipe measures, energy structure adjustment, industrial structure adjustment, transportation structure adjustment and retiring yellow-label and old vehicles show great reduction benefits among the three scenarios. The emission reduction share rates of energy structure adjustment (M2), industrial structure adjustment (M3), transportation structure adjustment (M6), industrial end-of-pipe measures (M1), retiring yellow-label and old vehicles (M4) and promoting new energy vehicles (M5) account for 13.7%, 8.7%, 4.3%, 44.9%, 23.8% and 4.5% under SBUA, 13.3%, 8.7%, 4.3%, 44.8%, 24.5% and 4.4% for SA, and 12.8%, 8.2%, 5.1%, 44%, 25.5% and 4.4% for SO, respectively.
In terms of industrial end-of-pipe measures in the GBA, the emission of air pollutant equivalent in the industrial field in 2020 was 1816.6 kt. As shown in Figure 5a, SBAU will achieve an emission reduction of 318.7 kt air pollutant equivalent through the implementation of energy-related end-of-pipe measures in 2025. Benefiting from more aggressive actions than SBAU, Figure 5b illustrates that the air pollutant equivalent reduction under SA will reach 366.5 kt, with 47.9 kt higher than SBAU. The strictest measures will be taken in SO, which will bring 410.9 kt air pollutant equivalent reduction in 2025, and the air pollution equivalent reduction in SO will be 44.4 kt higher than SA as pictured in Figure 5c. Under SBUA, it is estimated that the implementation of industrial boiler treatment measures such as ultra-low emission transformation or clean energy replacement of coal-fired boilers above 35 steam tons (EM1) and biomass boiler treatment (EM2), the GBA can reduce 6.9 kt SO2, 9.8 kt NOx, 8.8 kt primary PM2.5 and 0.2 kt VOCs in 2025. Industrial kiln treatment measures will reach 8 kt SO2, 12.2 kt NOx, 24.8 kt primary PM2.5 and 8.2 kt VOCs in 2025, which includes “coal-to-gas” transformation and denitrification treatment in construction ceramics and glass industries (EM3) and denitrification treatment in iron and steel industry (EM4). Through measures of industrial energy consumption structure adjustment, i.e., treatment of “scattered pollution” (EM5), retiring old coal-fired units (EM6), ultra-low emission transformation of coal-fired units (EM7), air pollutant emissions will reduce 9.8 kt SO2, 17.1 kt NOX, 15.3 kt primary PM2.5 and 10 kt VOCs by 2025, and VOCs integrated treatment measures such as “One Enterprise One Policy” treatment of VOCs key supervision enterprises (EM8) will achieve 141.6 kt VOCs reduction in the GBA. In SA, by further requiring 70% of the oil-fired, gas-fired and biomass boilers to complete ultra-low emission transformation or clean transformation (EM9), adapting ultra-low emission transformation of cement industry (EM10) and upgrading C-class industrial kilns to B-class (EM11), 2 kt SO2, 7.2 kt NOx, 4 kt primary PM2.5 will be additionally reduced on the basis of reduction effects in SBAU. Additional VOCs reduction of 32 kt based on SBAU will be generated from the implementation of improving the level of VOCs source substitution (EM12) and upgrading removal efficiency of VOCs treatment facilities (EM13). In SO, measures such as 100% complement of industrial boiler treatment measures in SA (EM9+, EM10+), 50% B-class industrial kilns to be upgraded to A-class in addition to upgrading C-class kilns (EM11+), as well as reaching higher VOCs source substitution level (EM12+) and further improvement of the removal efficiency of VOCs treatment facilities (EM13+) will present an extra air pollutant emissions reduction including 4 kt SO2, 33.8 kt NOx, 9 kt primary PM2.5, and 34 kt VOCs compared to SA.

3.4. Simulation Results of Air Quality under Different Policy Scenarios

As graphed in Figure 6a–c, the simulation results present that energy-environment policies employed in SA and SO can lead to the achievement of the preset annual PM2.5 concentration target in the GBA by 2025, while the simulated annual average PM2.5 concentration in SBAU cannot reach the preset target in this study. In Figure 6d, under SBAU, the regional annual average PM2.5 concentration is 21.7 μg/m3, and the annual average PM2.5 concentration in cities in the GBA are from 19 μg/m3 (Hong Kong) to 25.4 μg/m3 (Foshan). In SA, the annual average PM2.5 concentration in cities in the GBA are from 18.3 μg/m3 (Huizhou) to 21.5 μg/m3 (Guangzhou & Foshan), with the average value of 19.9 μg/m3 in the region. As for SO, the annual average PM2.5 concentration in cities are estimated to be from 16.1 μg/m3 (Huizhou) to 20.5 μg/m3 (Foshan), with an average regional concentration of 18.09 μg/m3 by 2025.

4. Discussion

The GBA has aggressively targeted air quality improvement through a series of air pollution control measures since 2015. Industrial end-of-pipe control measures performed the best integrated emission reduction benefits among measures taken from 2015 to 2020, due to their great VOCs emission reduction effect. Energy-related measures such as end-use energy structure adjustment in coal-intensive industries, power structure adjustment, phasing out outdated industrial capacity, retiring yellow-label and old vehicles also showed satisfactory emission reduction benefits. In addition, end-use energy structure adjustment in coal-intensive industries and power structure adjustment made significant contribution to SO2, NOx and primary PM2.5 mitigation. Retiring yellow-label and old vehicles, promoting new energy vehicles and transportation structure adjustment performed more effectively in NOx reduction, and phasing out outdated industrial capacity contributed greatly to the emission reduction of different air pollutants.
It is worthwhile to highlight that although the initial goal of industrial end-of-pipe measures focused solely on the air pollution, the air quality improvement target also functioned as a strong motivating force to the sustainable transition of energy systems and industry structure. As demonstrated from scenario analysis, energy-intensive industries such as cement, construction ceramics and glass industries will be required to implement ultra-low emission transformation or clean energy replacement. Treatments of industrial boilers and kilns effectively optimize the industrial end-use energy structure. “Scattered pollution” and outdated capacities of high energy-intensive industries will be phased out, and clean and energy-efficient factories would take the place of phased out capacities. The average energy efficiency in the GBA will thus be promoted, and the transition of energy system and industry would be accelerated as well. The energy consumption volume in the GBA in 2025 thus decline by 5.7% and 11.4% in SA and SO respectively compared to SBAU. From Lin et al. [49], the baseline energy consumption in the GBA in 2025 would be about 290 Mtce and the consumption under energy transition would be approximately 280 Mtce whereas it would be about 270 Mtce under deep energy transition. Only about 2% and 6% decline of energy consumption compared to the baseline can be achieved if merely relying on the energy transition according to Lin’s study. The estimation energy consumption volume in this study is larger than results from Lin, which might be explained by the reason that Lin did not take the rapid energy need from economic recovery after the COVID-19 pandemic into consideration when modeling the energy consumption trends by setting 2017 as the base year. Despite the discrepancy from the predicted value, it is still worth to find that integrated effects from energy-environment policies perform dramatically better than effects from measures only focusing on energy sectors.
Although the energy-related clean air measure implemented since 2015 have yielded remarkable achievements on air pollutant emissions reduction in the GBA, there will still be an urgent need for continuous efforts in air pollution control. The annual average PM2.5 concentration in SBUA cannot reach the preset goal in 2025 in the GBA, which indicates that the air quality of the GBA might have a certain gap from the goal set by the study by 2025 if only as usual energy-environment policies were adapted. Therefore, in order to ensure regional air quality improvement, it will be necessary for the GBA to further focus on energy, industrial and transportation structural adjustment measures as well as synergistic control of multiple pollutants during the middle and late 14th Five-Year Plan period.
The improvement of air quality in the GBA in the near future still needs to focus on multi-pollutant synergistic clean air measures and energy-related structural measures, considering that structural adjustment measures need a period of time to be deployed before they can be effective in reducing emissions. During the 14th Five-Year Plan period, it is essential to continuously strengthen the prevention and control of air pollution, starting from not only end-of-pipe industrial measures but also the optimization of energy structure, rational capping coal consumption, promoting the clean and efficient use of fossil energy, promoting end-use energy transition, and promoting the development of low-carbon transportation. Co-benefits of motivating the industries to optimize the energy use structure with the implementation of energy-environment policy worth to be further explored by the policymakers. Considering that the marginal emission reduction potential of air pollution end-of-pipe measures will substantially diminish, the air quality improvement path in the future should pay more attention to structural adjustment measures. The relevant structural-based emission reduction strategies and paths are thus meaningful for further in-depth study in the future.
In the process of building the “Air Quality Improvement Pioneering Demonstration Area”, it will be an interesting and novel topic for regional researchers to assess the policy’s impact on air quality improvement under the spatial scale of entire GBA region. This study first carries out an ex-post assessment to quantify the impact of those major clean air measures in the entire GBA during the 13th Five-Year Plan period on pollutant reduction. Aiming at proposing an integrated energy-related clean air path for policymakers, the study then designs a future policy scenario analysis to predict the air quality improvement potential as well as the co-benefit of accelerating energy system transition that could be reached. The results can help to predict future pollutant emission trends and can also provide feasible recommendations for the governments to further strengthen the efforts on air pollution prevention and control. On the other hand, only simulating the change of PM2.5 concentration in the GBA might not be able to reflect the change on the overall air quality since the photochemical smog problem in the GBA has not yet been solved. Studies on regional formation mechanism of O3 and policy’s impact on O3 pollution control will be carried out next. Moreover, due to the lack of regional up-to-date emission factors and coefficients, the pollutant emission reduction estimated in this study might deviate from the actual conditions. Thus, studies on updating regional air pollutant emission factors will also be necessary in the future.
The simulated annual average PM2.5 concentration in 2025 under SBUA is higher than the annual PM2.5 concentration in 2020 in the GBA, which might be associated with COVID-19 lockdown in the 2020. According to Wang’s simulation [50], the implemented lockdown measures in Guangdong from the end of January to March showed an obviously impact on reducing the average concentration of PM2.5 in cities within the GBA. The recovery of social-economic activities and the restart of industrial development after the COVID-19 pandemic will lead to the recovery of air pollutant emission at the same time. It might also be explained by the reason that the average meteorological conditions in 2020 reduced 8.9% of PM2.5 compared to 2017 [51]. The overall regional meteorological conditions were conducive to the improvement of the atmospheric environment in 2018 and 2020, and the national atmospheric pollution meteorological conditions were poorer than the average conditions, while the average meteorological conditions in 2017 were much close to the average conditions in the past five years. Despite the input of 2017 average meteorological data might lead to the PM2.5 concentration in SBAU is higher than the concentration in 2020, it points out again that current energy-environment policies may not be sufficient to support the continuously air quality improvement goal. Further efforts on developing and implementing integrated energy-environment policy will still be an urgent need for the governments in the GBA in the process of building the “Air Quality Improvement Pioneering Demonstration Area”. Considering the uncertainty of future meteorological conditions and the significant contributions of meteorology to atmospheric environment, air quality numerical simulations employed with energy-environment measures in the GBA under conducive meteorological conditions will also be an interesting topic to be further study in the future.

5. Conclusions

The study first assesses the air pollutant emission reduction effects of energy-related clean air measures in the GBA during the 13th Five-Year Plan period, with SO2, NOx, primary PM2.5 and VOCs in 2020 decreasing by about 23.6%, 32.1%, 39.8% and 37.6% compared to 2015. Then, three energy-environment development scenarios (i.e., SBAU, SA and SO) for the GBA to achieve the air quality improvement goal in 2025 are set by taking 2020 as the base year. The development of energy consumption and the implementation of energy-environment policies in 2025 for each scenario are predicted. Under SBAU, SA and SO, the air pollutant emissions in the GBA by 2025 are dramatically reduced by 24, 26 and 30 kt of SO2, 131, 163 and 197 kt of NOx, 53, 56 and 65 kt of primary PM2.5 as well as 178, 211 and 246 kt VOCs respectively compared to 2020.
This study emphasizes that continuous efforts on energy-related clean air measures can lead to air quality improvement and can also promote energy system optimization. Results from SA and SO demonstrated that with the implementation of stringent energy-related clean air measures, the annual average PM2.5 concentration in the GBA will reach 19.9 and 18.09 μg/m3 and the energy consumption volume will be controlled at 300.6 and 282.3 Mtce in 2025, respectively.
In order to achieve the goal of annual average PM2.5 concentration of 21 μg/m3 and moderate the growth rate of energy consumption in the GBA by 2025, stringent energy-environment policies and continuous efforts are needed to strengthen air quality improvement actions. It is highly recommended that governments and policymakers could make full use of the synergistic effect of energy-environment policy. The government can implement energy structure adjustment measures to promote industrial and transportation structure optimization and further promote air pollution emission reduction, and on the other hand can adapt end-of-pipe measures to force the optimization of industrial end-use energy structures and the clean transformation of energy system in the GBA at the same time. In addition, the government and policymakers can optimally choose measures that proven effective in the GBA from this study and refer to energy-environment development scenarios when making feasible air quality improvement strategy in the GBA.
This study also suggests that the government and policymakers in the GBA could seize the opportunity of the building of an “Air Quality Improvement Pioneering Demonstration Area” to propose integrated regional air quality improvement goals of the GBA and formulate a strategy path for the GBA to achieve a synergistic development of continuous air quality improvement and clean energy system. It is also recommended for the government and policymakers to promote the promulgation of integrated regional energy-environment policies and the formation of a coordinated mechanism for clean air action and clean energy transition.

Author Contributions

Conceptualization, Y.L. (Yixi Li) and L.W.; methodology, Y.L. (Yixi Li) and L.W.; software, S.C.; validation, Y.L. (Yixi Li), Z.Y. and Y.L. (Yinping Luo); formal analysis, Y.L. (Yixi Li) and L.W.; investigation, Y.L. (Yixi Li); resources, S.C., Z.Y. and Y.L. (Yinping Luo); data curation, Y.L. (Yixi Li); writing—original draft preparation, Y.L. (Yixi Li); writing—review and editing, Y.L. (Yixi Li) and C.L.; visualization, Y.L. (Yixi Li); supervision, C.L.; project administration, Y.L. (Yixi Li) and C.L.; funding acquisition, Y.L. (Yixi Li) and C.L. All authors have read and agreed to the published version of the manuscript.

Funding

This research was funded by Key-Area Research and Development Program of Guangdong Province, grant number 2020B1111360003. This work was also partially supported by project from the Energy Foundation China (G-2010-32508).

Institutional Review Board Statement

Not applicable.

Informed Consent Statement

Not applicable.

Data Availability Statement

The data in this study are available on request from the authors.

Conflicts of Interest

The authors declare no conflict of interest.

References

  1. Lin, C.Q.; Liu, G.; Lau, A.K.H.; Li, Y.; Li, C.C.; Fung, J.C.H.; Lao, X.Q. High-resolution satellite remote sensing of provincial PM2.5 trends in China from 2001 to 2015. Atmos. Environ. 2018, 180, 110–116. [Google Scholar] [CrossRef]
  2. Zhang, X.; Fung, J.; Zhang, Y.; Lau, A.; Huang, W. Assessing PM2.5 emissions in 2020: The impacts of integrated emission control policies in China. Environ. Pollut. 2020, 263, 114575. [Google Scholar] [CrossRef] [PubMed]
  3. IEA. Energy and Air Pollution; IEA: Paris, France, 2016; Available online: https://www.iea.org/reports/energy-and-air-pollution (accessed on 24 September 2022).
  4. Guangdong Provincial Bureau of Statistics. Guangdong Statistical Yearbook 2021; China Statistics Press: Beijing, China, 2021. (In Chinese) [Google Scholar]
  5. Zhang, Z.; Tao, J.; Lu, J.Q.; Wu, G.Z. Challenges facing air quality improvement in the Guangdong-Hong Kong-Macao Greater Bay Area and implications of foreign bay area experiences. Environ. Prot. 2019, 47, 61–63. [Google Scholar] [CrossRef]
  6. Sun, W.; Zhang, S.; Sun, H. Energy development status and transformation trend in Guangdong-Hong Kong-Macao Greater Bay Area. Int. Pet. Econ. 2021, 12, 33. [Google Scholar]
  7. Vasilakos, P.N.; Shen, H.; Mehdi, Q.; Wilcoxen, P.; Driscoll, C.; Fallon, K.; Burtraw, D.; Domeshek, M.; Russell, A.G. US Clean Energy Futures—Air Quality Benefits of Zero Carbon Energy Policies. Atmosphere 2022, 13, 1401. [Google Scholar] [CrossRef]
  8. Tudor, C.; Sova, R. EU Net-Zero Policy Achievement Assessment in Selected Members through Automated Forecasting Algorithms. ISPRS Int. J. Geo-Inf. 2022, 11, 232. [Google Scholar] [CrossRef]
  9. Danek, T.; Zareba, M. The Use of Public Data from Low-Cost Sensors for the Geospatial Analysis of Air Pollution from Solid Fuel Heating during the COVID-19 Pandemic Spring Period in Krakow, Poland. Sensors 2021, 21, 5208. [Google Scholar] [CrossRef]
  10. Zhang, Q.; Zheng, Y.; Tong, D.; Shao, M.; Hao, J. Drivers of improved PM2.5 air quality in China from 2013 to 2017. Proc. Natl. Acad. Sci. USA 2019, 116, 24463–24469. [Google Scholar] [CrossRef] [Green Version]
  11. Feng, Y.; Ning, M.; Lei, Y.; Sun, Y.; Liu, W.; Wang, J. Defending blue sky in China: Effectiveness of the “Air Pollution Prevention and Control Action Plan” on air quality improvements from 2013 to 2017. J. Environ. Manag. 2019, 252, 109603. [Google Scholar] [CrossRef]
  12. Hu, J.; Huang, L.; Chen, M.; He, G.; Zhang, H. Impacts of power generation on air quality in China—Part II: Future scenarios. Resour. Conserv. Recycl. 2016, 121, 115–127. [Google Scholar] [CrossRef]
  13. Lei, Y.; Yan, G. Thoughts on the Key Issues Regarding Atmospheric Environment Management in the 14th Five-Year Plan. Chin. J. Environ. Manag. 2020, 4, 35–39. [Google Scholar] [CrossRef]
  14. Tong, D.; Geng, G.; Jiang, K.; Cheng, J.; Zheng, Y.; Hong, C.; Yan, L.; Zhang, Y.; Chen, X.; Bo, Y.; et al. Energy and emission pathways towards PM2.5 air quality attainment in the Beijing-Tianjin-Hebei region by 2030. Sci. Total Environ. 2019, 692, 361–370. [Google Scholar] [CrossRef] [PubMed]
  15. Shi, Q.; Zheng, B.; Zheng, Y.; Tong, D.; Liu, Y.; Ma, H.; Hong, C.; Geng, G.; Guan, D.; He, K.; et al. Co-benefits of CO2 emission reduction from China’s clean air actions between 2013–2020. Nat. Commun. 2022, 13, 5061. [Google Scholar] [CrossRef]
  16. Zheng, B.; Tong, D.; Li, M.; Liu, F.; Hong, C.; Geng, G.; Li, H.; Li, X.; Peng, L.; Qi, J.; et al. Trends in China’s anthropogenic emissions since 2010 as the consequence of clean air actions. Atmos. Chem. Phys. 2018, 18, 14095–14111. [Google Scholar] [CrossRef] [Green Version]
  17. Liao, C.; Zhang, H.; Li, N. Strategic studies on the adjustment of industrial structure in Guangdong province to achieve PM2.5 air quality targets. Environ. Pollut. Control 2020, 42, 134–139. [Google Scholar] [CrossRef]
  18. Wang, N.; Lyu, X.P.; Deng, X.J.; Guo, H.; Deng, T.; Li, Y.; Yin, C.Q.; Li, F.; Wang, S.Q. Assessment of regional air quality resulting from emission control in the Pearl River Delta region, southern China. Sci. Total Environ. 2016, 573, 1554–1565. [Google Scholar] [CrossRef]
  19. Chen, D.; Zhang, Y.; Lang, J.; Zhou, Y.; Li, Y.; Guo, X.; Wang, W.; Liu, B. Evaluation of different control measures in 2014 to mitigate the impact of ship emissions on air quality in the Pearl River Delta, China. Atmos. Environ. 2019, 216, 116911. [Google Scholar] [CrossRef]
  20. Liu, Y.-H.; Liao, W.-Y.; Lin, X.-F.; Li, L.; Zeng, X.-L. Assessment of co-benefits of vehicle emission reduction measures for 2015–2020 in the Pearl River Delta region, China. Environ. Pollut. 2017, 223, 62–72. [Google Scholar] [CrossRef]
  21. The State Council of the People’s Republic of China. Outline Development Plan for the Guangdong-Hong Kong-Macao Greater Bay Area; The State Council of the People’s Republic of China: Beijing, China, 2019. (In Chinese) [Google Scholar]
  22. Guangdong-Hong Kong-Macao Pearl River Delta Regional Air Quality Monitoring Network. A Report of Monitoring Results in 2021; Quality Management Committee of Guangdong-Hong Kong-Macao Pearl River Delta Regional Air Quality Monitoring Network: Guangzhou, China. Available online: http://gdee.gd.gov.cn/attachment/0/493/493223/3965254.pdf (accessed on 24 September 2022).
  23. Gao, Y.; Zhang, L.; Huang, A.; Kou, W.; Bo, X.; Cai, B.; Qu, J. Unveiling the spatial and sectoral characteristics of a high-resolution emission inventory of CO2 and air pollutants in China. Sci. Total Environ. 2022, 847, 157623. [Google Scholar] [CrossRef]
  24. Pan, Y.; Li, N.; Zheng, J.; Yin, S.; Li, C.; Yang, J.; Zhong, L.; Chen, D.; Deng, S.; Wang, S.S. Emission inventory and characteristics of anthropogenic air pollutant sources in Guangdong Province. Acta Sci. Circumstantiae 2015, 35, 2655–2669. [Google Scholar] [CrossRef]
  25. Gao, Q.; Gao, W.; Ma, Z.; Tang, J.; Fu, J.; Li, Y.; Ren, J. The synergy effect assessment method and its application for air pollutants and greenhouse gases reduction. Clim. Change Res. 2021, 3, 268–278. [Google Scholar] [CrossRef]
  26. Chang, S.; Zheng, Y.; Zeng, W.; Liao, C.; Luo, Y.; Wang, L.; Zhang, Y. Strategies for PM2.5 in Guangdong province to achieve the WHO-Ⅱ air quality target from the perspective of synergistic control with CO2. Res. Environ. Sci. 2021, 34, 2105–2112. [Google Scholar] [CrossRef]
  27. Song, S.; Li, T.; Liu, P.; Li, Z. The transition pathway of energy supply systems towards carbon neutrality based on a multi-regional energy infrastructure planning approach: A case study of China. Energy 2022, 238, 122037. [Google Scholar] [CrossRef]
  28. Zhang, P.; Xu, J.; Guo, W.; Wu, W.; Zhong, C.; Wei, W. Low-Carbon Transformation of the Power System in the Guangdong-Hong Kong-Macao Greater Bay Area. J. Shanghai Jiaotong Univ. 2022, 56, 293. [Google Scholar] [CrossRef]
  29. Wang, L.; Zhang, J.; Wang, X.; Chen, X.; Song, X.; Zhou, L.; Yan, G. Pathway of Carbon Emission Peak in China′s Electric Power Industry. Res. Environ. Sci. 2022, 35, 329–338. [Google Scholar] [CrossRef]
  30. Sun, X. Interpretation of China’s Electricity Elasticity Coefficient Since 2014. China Energy News, 4 May 2015. [Google Scholar]
  31. Harel, P.; Baguant, J. A growth prediction for electrical energy consumption in Mauritius. Energy 1991, 16, 707–711. [Google Scholar] [CrossRef]
  32. Byun, D.; Schere, K.L. Review of the Governing Equations, Computational Algorithms, and Other Components of the Models-3 Community Multiscale Air Quality (CMAQ) Modeling System. Appl. Mech. Rev. 2006, 59, 51. [Google Scholar] [CrossRef]
  33. Yarwood, G.; Rao, S.; Yocke, M.; Whitten, G.Z. Updates to the Carbon Bond Chemical Mechanism: CB05. Final Report Prepared for the United States Environmental Protection Agency. Available online: http://www.camx.com/publ/pdfs/CB05_Final_Report_120805.pdf (accessed on 8 October 2022).
  34. Skamarock, W.C.; Klemp, J.B.; Dudhia, J.; Gill, D.O.; Barker, D.M.; Wang, W.; Powers, J.G. A Description of the Advanced Research WRF Version 3 (No. NCAR/TN-475+STR); University Corporation for Atmospheric Research: Boulder, CO, USA, 2008. [Google Scholar] [CrossRef]
  35. Morrison, H.; Gettelman, A. A new two-moment bulk stratiform cloud microphysics scheme in the community atmosphere model, version 3 (CAM3). Part I: Description and numerical test. J. Clim. 2008, 21, 3642–3659. [Google Scholar] [CrossRef]
  36. Pleim, J.E. A combined local and nonlocal closure model for the atmospheric boundary layer.Part I: Model description and testing. J. Appl. Meteorol. Climatol. 2007, 46, 1383–1395. [Google Scholar] [CrossRef]
  37. Xiu, A.; Pleim, J.E. Development of a land surface model. Part I: Application in a mesoscale meteorological model. J. Appl. Meteorol. 2001, 40, 192–209. [Google Scholar] [CrossRef]
  38. Sala, S.; Benini, L.; Mancini, L.; Pant, R. Integrated assessment of environmental impact of Europe in 2010: Data sources and extrapolation strategies for calculating normalisation factors. Int. J. Life Cycle Assess. 2015, 20, 1568–1585. [Google Scholar] [CrossRef] [Green Version]
  39. Zheng, B.; Zhang, Q.; Zhang, Y.; He, K.B.; Wang, K.; Zheng, G.J.; Duan, F.K.; Ma, Y.L.; Kimoto, T. Heterogeneous chemistry: A mechanism missing in current models to explain secondary inorganic aerosol formation during the January 2013 haze episode in North China. Atmos. Chem. Phys. 2015, 14, 2031–2049. [Google Scholar] [CrossRef] [Green Version]
  40. Zhong, Z.; Zheng, J.; Zhu, M.; Huang, Z.; Zhang, Z. Recent developments of anthropogenic air pollutant emission inventories in Guangdong province, China. Sci. Total Environ. 2018, 627, 1080–1092. [Google Scholar] [CrossRef] [PubMed]
  41. Cui, X.Z.; Sha, Q.E.; Li, C.; Wang, S.Z.; Wu, L.L.; Zhang, X.C.; Zhang, J.Y.; Yan, M. Assessment of emission reduction effect of major air pollution control measures in the Pearl River Delta from 2013 to 2017. Acta Sci. Circumstantiae 2021, 41, 1800–1808. [Google Scholar] [CrossRef]
  42. National Bulletin of Atmospheric Environment Meteorology from 2017–2020. Available online: http://www.cma.gov.cn/ (accessed on 8 September 2022).
  43. Guenther, A.; Jiang, X.; Heald, C.; Sakulyanontvittaya, T.; Duhl, T.; Emmons, L.; Wang, X. The model of emissions of gases and aerosols from nature version 2.1 (megan2.1): An extended and updated framework for modeling biogenic emissions. Geosci. Model Dev. 2012, 5, 1471–1492. [Google Scholar] [CrossRef] [Green Version]
  44. Yang, L.; Zeng, W.; Zhang, Y.; Liu, Y.; Liao, C.; Gan, Y.; Deng, X. Establishment of emission inventory and spatial-temporal allocation model for air pollutant sources in the Pearl River Delta region. China Environ. Sci. 2015, 35, 3521–3534. [Google Scholar]
  45. Environmental Protection Department. Hong Kong Air Pollutant Emission Inventory for 2015. Available online: www.epd.gov.hk/epd/english/environmentinhk/air/data/emission_inve.html (accessed on 8 August 2022).
  46. Environmental Protection Bureau (DSPA). Report on the State of the Environment of Macao 2015. Available online: https://www.dspa.gov.mo/StateReportHTML/2015/index_en.htm (accessed on 8 August 2022).
  47. Bian, Y. Emission Evolutions Characteristics of Air Pollutants in Guangdong Province and Their Impacts on Air Quality. Master’s Thesis, South China University of Technology, Guangzhou, China, 2018. [Google Scholar]
  48. Lin, Z.W.; Wang, P.; Ren, S.-Y.; Xu, H.-W.; Zhang, C.; Zhao, D.-Q. Economic development, energy demand, and carbon emission prospects of China’s provinces during the 14th Five-Year Plan period: Application of CMRCGE model. Adv. Clim. Change Res. 2019, 10, 165–173. [Google Scholar] [CrossRef]
  49. Lin, Z.; Wang, P.; Ren, S.; Xu, H.; Zhang, C.; Zhao, D. Assessment of economic, environmental and health benefits of the energy transition path—Take the GBA as an example. Clim. Change Res. 2021, 257, 1673–1719. [Google Scholar]
  50. Wang, S.; Zhang, Y.; Ma, J.; Zhu, S.; Shen, J.; Wang, P.; Zhang, H. Responses of decline in air pollution and recovery associated with COVID-19 lockdown in the Pearl River Delta. Sci. Total Environ. 2021, 756, 143868. [Google Scholar] [CrossRef]
  51. National Bulletin of Atmospheric Environment Meteorology in 2020. P24-38. Available online: http://www.cma.gov.cn/zfxxgk/gknr/qxbg/202104/t20210406_3052405.html (accessed on 8 August 2022).
Figure 1. Trend of rates of changes in air pollutant’s annual averages in the GBA.
Atmosphere 13 01841 g001
Figure 2. Changes in major air pollutant emissions in the GBA during the 13th Five-Year Plan period: (ae) Emission changes in SO2, NOx, primary PM2.5, VOCs and in air pollutant equivalent.
Atmosphere 13 01841 g002
Figure 3. Emission reduction benefits from different scenarios in 2025 compared to 2020.
Atmosphere 13 01841 g003
Figure 4. The contribution of different policy measures to emission reductions in 2025: (ac) Air pollutant equivalent reduction from six measures in SBAU, SA and SO.
Atmosphere 13 01841 g004
Figure 5. Industrial air pollutant emission reduction benefits in 2025: (a) Emission reductions from eight measures in SBAU; (b) Emission reductions from five additional measures in SA compared to SBAU; (c) Emission reduction from five enhanced measures in SO compared to SA.
Atmosphere 13 01841 g005
Figure 6. Spatial distributions of PM2.5 annual mean concentrations in the GBA by 2025: (a) Spatial distributions of PM2.5 annual mean concentrations in SBAU; (b) Spatial distributions of PM2.5 annual mean concentrations in SA; (c) Spatial distributions of PM2.5 annual mean concentrations in SO; (d) Annual concentration of PM2.5 in the GBA under different scenarios (GZ: Guangzhou; SZ: Shenzhen; ZH: Zhuhai; FS: Foshan; HZ: Huizhou; ZQ: Zhaoqing; DG: Dongguan; ZS: Zhongshan; JM: Jiangmen; HK: Hong Kong; MC: Macao).
Atmosphere 13 01841 g006
Table 1. Description of scenarios.
Energy-Related Clean Air MeasuresSBAUSASO
Energy supply structureThe power generation scale of thermal power and new energy will be adjusted based on the existing regional development planIncrease the capacity of gas power and new energy generation. Phase out old coal-fired power plants on schedule.Further increase the capacity of new energy power generation in the GBA. Accelerate phasing out old coal-fired power plants.
Industrial structure adjustmentConduct the industrial development plans of eleven cities in the GBA.Accelerate the development of emerging industries and accelerate phasing out outdated capacities of traditional industries.Further accelerate the development of advanced manufacturing and emerging industries and accelerate phasing out outdated traditional industries.
Energy efficiency improvements in the industriesRemain consistent with current policies.The unit energy consumption of energy-intensive industries such as cement, steel, and petrochemicals will reach the advanced level.The unit energy consumption of major industries will reach the advanced level.
Energy use caps in the industriesSlow down the growth of coal consumption, and moderately promote the de-coalization of industrial end-use energy.Promote “coal-to-gas” work in high energy-consuming industries.Accelerate the transformation of “coal-to-gas”, “coal-to-electricity” in key industries, strengthen the promotion of central heating in industrial parks, and accelerate clean energy transformation.
End-of-pipe clean air measuresRemain consistent with the period of 2015 to 2020.Adopt enhanced clean air measures and require over 70% completion rate of each task.Adopt more stringent clean air measures and require 100% completion rate of each task.
TransportationRemain consistent with current policies.The proportion of energy-saving and low-emission transportation modes should be appropriately increased.The development rate of energy-saving and low-emission transportation modes will be significantly increased.
Table 2. Energy structure development of scenarios.
ScenarioSectorEnergy Consumption
(in Mtce.)
Energy Structure (%)
CoalFuelNatural GasElectricity
SBAUPrimary industry2.34.4%23.5%072.1%
Secondary industry177.112.5%8.7%10.1%68.7%
Transportation61.9096.2%03.8%
Residential livings47.91.2%16.6%5.2%77.1%
Tertiary industry29.71.1%4.2%8.1%86.5%
Total318.97.3%26.6%7.2%59.0%
SAPrimary industry2.34.4%23.5%072.1%
Secondary industry166.810.2%8.6%10.9%70.3%
Transportation59.4095.8%04.1%
Residential livings44.31.1%10.5%4.8%83.7%
Tertiary industry27.80.7%2.7%7.5%89.1%
Total300.65.9%25.7%7.5%60.9%
SOPrimary industry2.34.4%23.5%072.1%
Secondary industry157.89.9%8.5%10.7%70.9%
Transportation57.1095.3%04.7%
Residential livings39.30.7%8.4%5.3%85.6%
Tertiary industry25.80.3%2.1%8.0%89.6%
Total282.35.7%25.5%7.5%61.3%
Publisher’s Note: MDPI stays neutral with regard to jurisdictional claims in published maps and institutional affiliations.

