Abstract
In this study, we define the value (buffer zone area centred on a meteorological station) and two inhomogeneity measurement parameters, the station domain area and station network density, for 89 weather stations in the Xinjiang region, and we construct the weight coefficient of the station network according to the station domain area. Applying the weight coefficient, we calculate the mean temperature, maximum temperature, and minimum temperature in January, April, July, October, and annually in the Xinjiang region from 1961 to 2021. The results show that the value of 200,000 km2 is suitable for determining the weight coefficient of the station network in the Xinjiang region. The two measurement parameters can quantitatively reflect the inhomogeneity of the distribution of 89 weather stations in the Xinjiang region. The spatial distribution density of the station network is positively proportional to the station network density and inversely proportional to the station domain area and weight coefficient of the stations. The equal-weighted average is lower than the spatially homogenized revised average, which underestimates the mean temperature in the Xinjiang region, and the spatially homogenized revised average better reflects the real temperature in the Xinjiang region. The annual and monthly mean temperatures, maximum and minimum temperatures calculated by the spatially homogenized revised average, and the equal-weighted average have the same upwards trend, and the mean temperature warming trend calculated by the two methods have differences, but the differences are not significant. The annual, January, April, July, and October minimum temperature warming trends according to the spatial homogenization revised average are greater than the maximum temperature warming trend and the mean temperature warming trend, and the annual minimum temperature warming trend is 3.3 times the annual maximum warming trend and two times the annual mean temperature.
1. Introduction
Currently, the global surface mean temperature has increased by 1.1 °C relative to 1850–1900, and the warming caused by human activities in the past 2000 years is unprecedented. Global surface temperatures have increased faster since 1970 than in any 50-year period in the last 2000 years. Human-influenced climate change has caused many kinds of weather and climate extremes in every region of the globe, including extreme events such as heatwaves, very heavy rainfall, droughts, and tropical storms [1]. The annual average surface temperature in China shows a significant upwards trend, with a warming trend of 0.26 °C per decade, which is higher than the global average warming level (0.15 °C per decade) during the same period [2]. The trend of the annual mean temperature in Xinjiang is higher than that in the global land and China, with an average increase of 0.30 °C per decade [3]. At present, climate change is a popular topic in atmospheric science research and is also a major issue of concern to the international community [4,5].
The observational data of weather stations are the basis for studying climate change. Long-term and high-quality climate data are essential for monitoring and studying climate variability and change [6]. Measurements are often affected by non-climatic influences such as station relocations, uneven station spatial distribution, observer changes, changes in the station environment, changes in instruments, and station maintenance. Although inhomogeneities in site observations have limited influence on the estimate of the observed temperature trend performed on a global scale [7], these can substantially affect the outcomes for local and regional scale patterns of climate change. Many exploratory studies have been performed in the field of homogenization. Many scholars have homogenized revised daily, monthly and annual scale temperature data from Canada, Australia, and other countries by methods such as the percentile-matching (PM) adjustment method [8], a similar adjustment method [9], quantile-matching (QM) adjustment method [10], and statistical methods [11]. In China, the current national meteorological information centre has created a national set of homogenized information [12] by applying the RHtests V3.0 software developed by Wang and Feng [13] that has applications in the detection and attribution of observational change for Asia and China [14,15] and even for northwest China [16]. However, most studies only revised the inhomogeneity of temperature in the time series and did not take into account spatial homogeneity. The spatial distribution of climate stations is often extremely heterogeneous, and the spatial heterogeneity of climate information also has an impact on climate change research, especially in low-density station regions.
Some researchers have proposed that the area-weighted average should be used in the calculation of spatial average [17,18]. Zhu Changhan [19] pointed out that the factor of the area represented by the site must be taken into account in the national average method of calculating factors with the data of the site. An area weight coefficient should be constructed for each site that represents the area proportional to the total area of the weight size; to calculate the ratio of the area of each province and region to the total area of China, the calculation stations of each province and region is divided to find the area weight coefficient; Wang Panxing et al. [20] defined the station domain area and station network density of 160 stations in China, which reflected the inhomogeneity of the stations’ network distribution, and constructed the weight coefficient of 160 stations in a network using station domain area. These 160 stations were used to obtain the national climatic average and average square deviation of temperature in January, April, July, and October in China, and the revised results were shown to be reasonable. Although this method is troublesome in the process of determining the coefficients, once the weighting coefficients of the meteorological stations are determined it is easy to apply them in meteorological operations, and the application also shows that the homogenized revised scheme is concise, the analysis results obtained with the revised information are theoretically reasonable, and the actual analysis results are improved compared with the original. The disadvantage of this method is that once the area is changed, the weighting coefficients of the original meteorological stations must be recalculated. The above scholars’ research can solve the problem of the uneven spatial distribution of meteorological stations, but they only homogenized and revised the whole network of China and did not consider smaller regional networks.
Xinjiang is in northwestern China and occupies one-sixth of the national area. Its regional climate is very sensitive to global climate change, meanwhile, extreme precipitation and temperature events have been high and recurring in recent years [21,22]. Some scholars have used meteorological station data to study climate change in Xinjiang [23,24,25,26] and its impact on water resources, the forestry and fruit industry, diseases and insect pests, flood disasters, and the agricultural economy in the region [27,28,29,30,31,32,33] and have obtained valuable results. However, the above scholars adopted the equal-weight average method to calculate the regional average of the long time series of the temperature, without considering the heterogeneity of the meteorological stations’ spatial distribution, i.e., only considering the uniformity in the time domain and not considering the uniformity in the space domain. The spatially homogenized and revised meteorological elements obtained from weather stations not only reflect the objective facts of climate change in the study area, but also this work can help better identify and capture precipitation and temperature extremes. There are 89 weather stations in Xinjiang, and although it is obvious that the distribution of meteorological stations is extremely uneven, there are no indicators to quantify the unevenness of the distribution. In addition, how to homogenize the adjustment of the weather stations in Xinjiang to obtain more objective regional average temperature data is an urgent problem that needs to be addressed. This study determines two parameter values (station domain area and station network density) of inhomogeneity stations in Xinjiang and then constructs the weight coefficient of the station network of the Xinjiang region by station domain area. We structured it as follows: the data description is in Section 2, the methods are in Section 3, and the results are presented in Section 4, with the last part about discussions and conclusions in Section 4.
2. Materials and Methods
2.1. Materials
2.1.1. Study Area
Xinjiang is in arid and semiarid areas in northwest China (Figure 1). it is the largest provincial administrative region in China in terms of land area, with a total area of one-sixth of China’s land area (1.66 million square km).
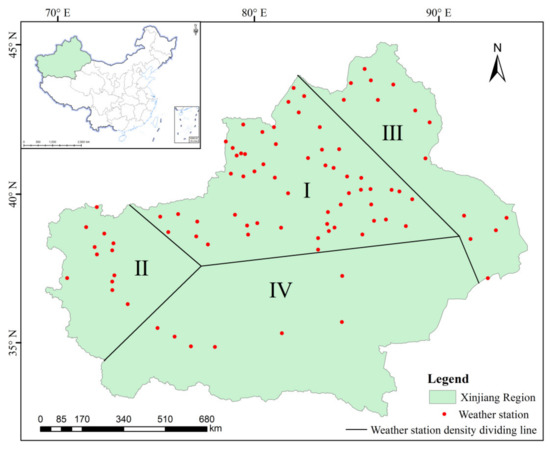
Figure 1.
The 89 weather stations distributed in Xinjiang region.
There are 89 weather stations in Xinjiang (Starting in 1961). The distribution of weather station networks is extremely uneven in Xinjiang. Figure 1 shows that the region I station network is the most densely distributed, the region II station network is more densely distributed, and region III and IV station networks are sparse. There are only 7 stations in region IV. If calculating the regional mean temperature only uses the equal-weight average method, the average value may be biased to the value in the dense region I of the network, which leads to the distortion of the calculated result and is unfavourable to the study of climate change in Xinjiang. Therefore, it is important to revise the spatial homogenization of this regional weather station in Xinjiang.
2.1.2. Dataset
From the Xinjiang Climate Centre, the longitude and latitude data of the 89 climate stations and the mean, maximum, and minimum temperature data for annual, January, April, July, and October of the 89 stations in the Xinjiang region from 1961 to 2021 were obtained. There are 105 national meteorological stations in Xinjiang, and only 89 national meteorological stations are currently available with complete data due to relocation, missing intermediate observations, short construction time, and withdrawal of stations. For example, the Kekodara meteorological station had a difference of approximately 100 km following relocation, resulting in a large difference between the data gathered before and after its relocation. Hence, the station data cannot be connected to the long time series data; the Tazhong meteorological station was built in the 1990s, which was too late to form long time series data. Therefore, these stations were excluded from this study. Xinjiang meteorological stations are divided into three categories: national basic meteorological stations, national benchmark meteorological stations, and national meteorological observation stations. In this study, 37 national basic meteorological stations, 22 national benchmark meteorological stations, and 30 national meteorological observation stations were selected. The data from the above meteorological stations passed strict quality control.
In this study, the data are used to calculate the mean temperature in Xinjiang by two methods: one is to calculate the average temperature by the spatial homogenization revised average of the network comprising 89 weather stations in the Xinjiang region, and the other is to calculate the average temperature of these stations by the equal-weighted average method.
2.2. Methods
2.2.1. Calculation of Daily, Monthly, and Annual Time-Scale Temperatures for a Single Station at Meteorological Stations
A daily mean temperature is calculated by averaging four 6-hourly observations in a day. The monthly mean temperature is averaged over the daily mean temperature for the month. The annual mean temperature is averaged from the mean temperature of the 12 months in the year. Minimum (maximum) temperature is the minimum (maximum) temperature at a certain moment in the daily, monthly and annual time scales; that is, the daily minimum (maximum) temperature is the minimum (maximum) temperature recorded at a certain moment in the day, the monthly minimum (maximum) temperature is the minimum (maximum) temperature at a certain moment in the month, and the annual minimum (maximum) temperature is the minimum (maximum) temperature at a certain moment in the year.
2.2.2. Spatial Homogenization Adjustment of the Xinjiang Weather Data Station Network
In this study, the station network spatial homogenization adjustment of climate data by Wang Panxing et al. [20,34] was adopted to determine the station domain area and station network density of the Xinjiang regional weather stations and to construct the weight coefficients of the 89 station network in the Xinjiang region based on the station domain area, which were applied to the calculation of the annual mean temperature and the mean temperature in January, April, July, and October in the Xinjiang region from 1961 to 2021. The specific parameters are calculated as follows:
- (1)
- value selection
is the buffer zone area centred on the meteorological station point, and is a prerequisite for determining the station domain area. Wang et al. [20] corrected the homogenization of China’s climatic data stations in the process, and the value of is 50 × 104 km2. Due to the homogenized revised network of national climatological data stations, the scope is large, and it may be larger if this value is applied in the Xinjiang region. Given this situation, based on previous studies, was assigned 50 × 104 km2, 30 × 104 km2, 20 × 104 km2, 15 × 104 km2, and 10 × 104 km2. Through the application results of 5 groups of data, the value suitable for the Xinjiang region was determined.
- (2)
- is taken as different areas, corresponding to the coverage in Xinjiang
In the ArcGIS10.0 software platform, we overlaid the Xinjiang vector boundary map and 89 weather sites. Taking 89 meteorological stations in Xinjiang as the centre, we made buffer areas of 50 × 104 km2, 30 × 104 km2, 20 × 104 km2, 15 × 104 km2, and 10 × 104 km2, and the spatial coverage with different values centred on 89 meteorological stations in Xinjiang was obtained. Using the ArcGIS10.0 software analysis tool, the spatial distribution profile of the area covered by different values in the Xinjiang region was obtained. On this basis, the area of different values in the Xinjiang region can be counted in the attribute table of the obtained data. Finally, the total area covered by values was divided by the total area of Xinjiang to obtain the coverage rates of different values in the Xinjiang region.
- (3)
- Station domain area
Taking the 89 weather station network of the Xinjiang region as an example, station as the centre, the area of the is , the area of Xinjiang on is , and the number of stations belonging to this network on is . The area of Xinjiang represented by station is defined as:
is the station domain area of station .
The extraction of : The 89 weather stations of the Xinjiang region are loaded into the ArcGIS10.0 interface, and a buffer zone with the area is established at the centre of the station, extracting the area of each buffer zone within the Xinjiang region by the analysis tool, denoted as .
The extraction of : The 89 weather stations of the Xinjiang region and of each station are loaded into ArcGIS10.0, correlating their attributes, and extracting the number of weather stations in range , denoted as .
- (4)
- Station network density
Among Xinjiang’s 89 weather stations, when , for inland stations; when , for boundary stations. The distribution of the inland and border station numbers depends on the value of . The larger the value of is, the more border stations there are, and the fewer inland stations there are. There is no comparability between sites near the boundary and inland sites, so the correction coefficient is , and was revised in the Xinjiang region.
where is the station network density; when is the unit area, and are reciprocal.
- (5)
- Construction of weighting coefficients for meteorological stations and calculation of spatially homogenized temperature averages
To calculate the average value of the temperature field of in the region covered by the network of 89 Xinjiang regional weather stations in a year, the area weight coefficient of the station domain area of the 89 Xinjiang regional weather station network is constructed as follows:
Based on the weighting coefficients, the spatially homogenized temperature average is calculated as follows:
where is the number of meteorological stations, is the weight coefficient of station , is the temperature value of station in year , and is the spatially homogenized revised average temperature in year .
Formula (3) is used to calculate the weight coefficient of the 89 Xinjiang regional weather station network. Formula (4) calculates the monthly and annual scale minimum, maximum, and mean temperatures in the Xinjiang region. The method calculated by Formula (4) is called the spatially homogenized revised average. In this study, is 89, i.e., 89 meteorological stations in the Xinjiang region.
2.2.3. The Equal-weighted Average of the Xinjiang Region Temperature Data
When calculating the spatial average temperature in the Xinjiang region, the 89 weather stations are considered to represent the same weight in space, and the temperature data from these meteorological stations on a certain time scale are arithmetically averaged, i.e., equal-weight average, calculated as follows:
where is the equal-weighted average temperature in year . Formula (5) (the equal-weighted average) calculates the monthly and annual scale minimum, maximum, and mean temperatures in the Xinjiang region. This result is analysed in comparison with the spatially homogenized revised average result.
3. Results
3.1. Determination Area
Figure 2 is the spatial coverage distribution diagram when takes different values. When an area is 500,000 square kilometres and 300,000 square kilometres, all areas are covered except for a few areas in the southeast (Figure 2d,e), and the coverage rate reached 99.9% and 99.0% (Table 1, respectively. Although the coverage rate is high, due to the large value of , the range of becomes larger, the number of sites in increases, and it appears to have a low correlation compared with site , decreasing the overall representation of the whole site. When is 100,000 square kilometres and 150,000 square kilometres, although the correlation between each station on and station is relatively high, we can see from Figure 2a,b that does not cover the whole Xinjiang region, and the coverage rate is not high. In particular, when is 100,000 square kilometres, the coverage of the whole Xinjiang area is only 73.0%. In the belly of the Taklimakan Desert and the eastern part of Bazhou, a large area appears to be uncovered, and the results of the Xinjiang regional factors cannot reflect the real situation of the region. When is 200,000 square kilometres, only parts of the area along the southeast border are not covered, and the rest of the area is covered (Figure 2c and Figure 3), and coverage reaches 96.0%. It is above 100,000 square km and 150,000 square km. The correlation between each station in and station is higher than when is 500,000 square km and 300,000 square km. Based on the above analysis, is more representative, with 200,000 square kilometres in the Xinjiang region.
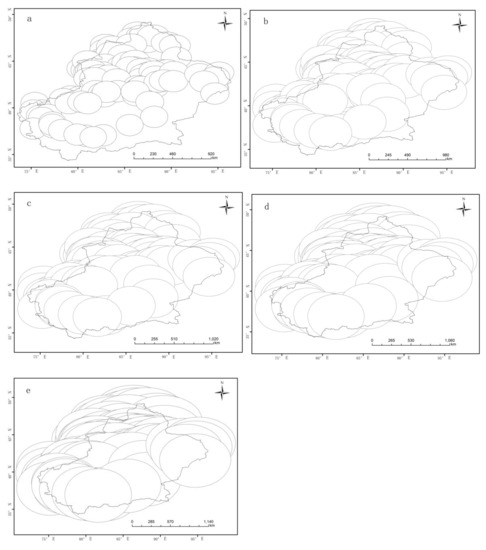
Figure 2.
Weather station (89 stations) network coverage area schematic diagram in Xinjiang regionaa (a): km2; (b): km2; (c): km2; (d): km2; (e): km2).

Table 1.
Area coverage under different assignments of .
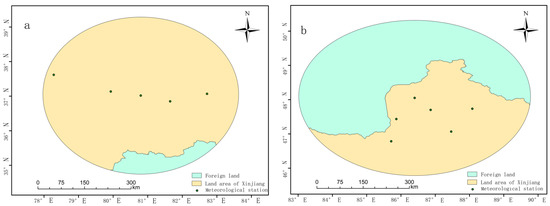
Figure 3.
value of 200,000 km2 measuring station schematic diagram of parameter value estimation (elliptic line boundary, (a): Cele station; (b): Habahe station).
3.2. Station Network Density and Station Domain Area Analysis
As shown in Figure 4, the station network density () of the 89 Xinjiang weather stations is large on the northern and southern slopes of the Tianshan Mountains and their vicinity and decreases in the north, east, and southeast directions. The minimum value is in the southern part of Bazhou; the station network density () is opposite to the spatial distribution of the station domain area (). The maximum value of occurred in Wenquan (39 stations/20 × 104 km2), followed by Khorgos (34 stations/20 × 104 km2), correspondingly is 0.026 (20 × 104 km2/ station) and 0.029 (20 × 104 km2/ station), respectively; the minimum value of appeared in Qiemo (2 stations/20 × 104 km2), followed by Ruoqiang (3 stations/20 × 104 km2), correspondingly is 0.495 (20 × 104 km2/ station) and 0.326 (20 × 104 km2/ station), respectively. The comparison with Figure 1 shows that the more densely distributed the stations are, the greater the station network density () and the smaller the station domain area (). It can be concluded that the two measurement parameters of station network density and station domain area can quantitatively reflect the uneven distribution of the 89-weather station network in the Xinjiang region. For the station domain area () and the station network density () of the 89 Xinjiang regional weather stations, please refer to the Appendix A.
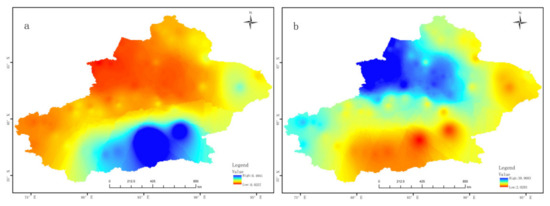
Figure 4.
The station network of the Xinjiang regional 89 weather stations inhomogeneity measurement parameters distribution (a): Station domain area (unit: 20 × 104km2/station); (b): Station network density (unit: station/20 × 104 km2)).
3.3. Distribution of Weighting Coefficients of 89 Meteorological Stations in the Xinjiang Region
Figure 5 shows that the weight coefficients of each station on the northern and southern slopes of Tianshan Mountain and its vicinity are all small, and the weight coefficient of Wenquan station is the lowest, at only 0.0037. The weight coefficient of meteorological stations is relatively large in northern Xinjiang, eastern Xinjiang, Hotan, and southern Bazhou; in particular, the weight coefficient of Qiemo station in southern Bazhou is the largest, at 0.07. Compared with Figure 4, it can be seen that the spatial distribution change in the weight coefficient of the 89 weather stations in the Xinjiang region is consistent with the change in the station domain area but contrary to the change in the station network density. Compared with Figure 1, it can be seen that the size of the weight coefficient is related to the density of the site distribution; the more densely distributed the sites are, the smaller the weight coefficient. See the Appendix A for the weight coefficient of the 89 Xinjiang regional weather stations.
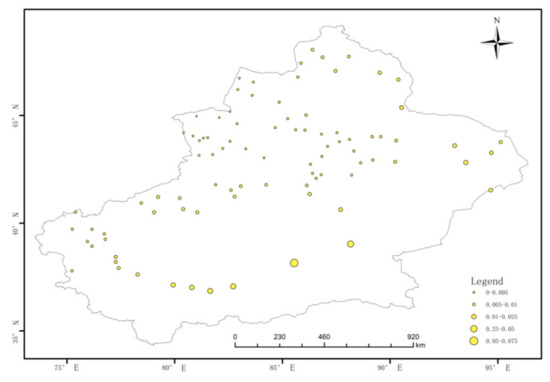
Figure 5.
Weight coefficients distribution of the 89 stations in Xinjiang region.
3.4. Analysis of the Temperature Change Characteristics in Xinjiang
3.4.1. Analysis of the Mean Temperature in Xinjiang
The average annual, January, April, July, and October temperatures of the 89 weather stations are calculated by Formula (4) (spatially homogenized revised average) and Formula (5) (equal-weight average) in the Xinjiang region from 1961 to 2021 (Figure 6). It can be seen from the curves in the figure that the spatially homogenized revised average temperature curve and equal-weight average temperature curve have roughly the same change trend, but the numerical results of the spatially homogenized revised average temperature curve are significantly higher than the equal-weight average. During the study period, the annual, January, April, July, and October mean temperature by the spatially homogenized revised average were 8.85 °C, −10.19 °C, 12.54 °C, 23.89 °C, and 8.92 °C, respectively, and the annual, January, April, July, and October mean temperature by the equal-weight average were 8.07 °C, −11.09 °C, 11.66 °C, 23.22 °C, and 8.36 °C, respectively. The annual, January, April, July, and October mean temperature, the spatially homogenized revised average were 0.78 °C, 0.90 °C, 0.88 °C, 0.67 °C and 0.56 °C higher than the equal-weight average, respectively. Again, the maximum and minimum temperatures were calculated for annual, January, April, July, and October from 1961 to 2021 at 89 weather stations in the Xinjiang region, respectively, by Formulas (4) and (5) (Figure 7). It can be seen that the annual, January, April, July, and October maximum and minimum temperatures for the spatially homogenized revised average are higher than the equal-weighted average, a finding that is consistent with the mean temperature. During the study period, the annual, January, April, July, and October mean maximum temperature by the spatially homogenized revised average were 37.15 °C, 3.67 °C, 28.32 °C, 36.49 °C, and 24.78 °C, respectively, and the annual, January, April, July, and October mean temperature by the equal-weighted average were 36.5 °C, 2.64 °C, 27.38 °C, 35.78 °C, and 24.12 °C, respectively. The annual, January, April, July, and October mean maximum temperature by the spatially homogenized revised average were 0.65 °C (annual), 1.03 °C (January), 0.94 °C (April), 0.71 °C (July), and 0.66 °C (October) higher than the equal-weighted average, a finding that is consistent with the mean temperature; During the study period, the annual, January, April, July, and October mean minimum temperature by the spatially homogenized revised average were −23.20 °C, −21.90 °C, −2.19 °C, 11.91 °C, and −4.37 °C, respectively, and the annual, January, April, July, and October mean temperature by the equal-weighted average were −24.65 °C, −23.13 °C, −2.84 °C, 11.41°C, and −4.64 °C, respectively. The annual, January, April, July, and October mean minimum temperature by the spatially homogenized revised average were 1.45 °C (annual), 1.23 °C (January), 0.65 °C (April), 0.50 °C (July), and 0.27 °C (October) higher than the equal-weighted average, a finding that is consistent with the mean temperature.
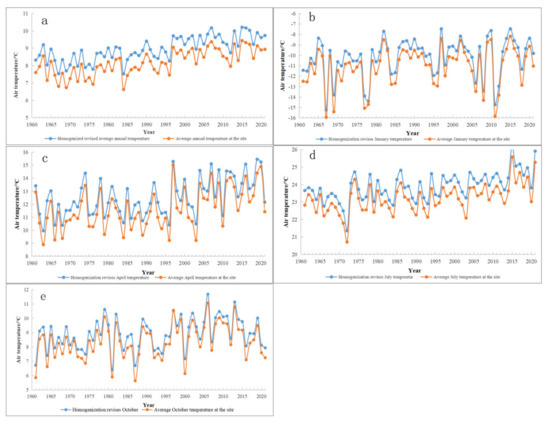
Figure 6.
The annual temperatures of the spatially homogenized revised average and equal-weighted average in Xinjiang, 1961−2021(a): Annual; (b): January; (c): April; (d): July; (e): October).
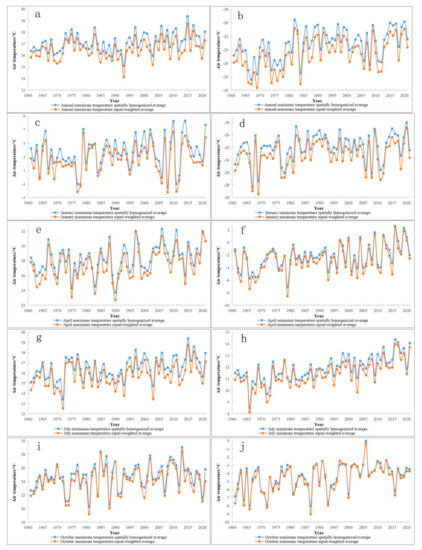
Figure 7.
The maximum and minimum temperatures of the spatial homogenization revised average and equal-weighted average in Xinjiang, 1961−2021 (a): Annual maximum temperature; (b): Annual minimum temperature; (c): January maximum temperature; (d): January minimum temperature; (e): April maximum temperature; (f): April minimum temperature; (g): July maximum temperature; (h): July minimum temperature; (i): October maximum temperature; (j): October minimum temperature.
3.4.2. Analysis of the Temperature Change Characteristics in the Xinjiang Region
We can see from Figure 6 that the overall trend of the mean annual, January, April, July, and October temperatures are warming regardless of the spatially homogenized revised average or the equal-weighted average calculation. Although the mean temperature warming trend calculated by the two methods differed, the differences were not significant, mostly within 0.03 °C per decade. From the spatially homogenized revised average data, it can be concluded that the annual mean temperature increases by 0.30 °C per decade, the most obvious warming is in April, with an average increase of 0.41 °C per decade, and the warming is relatively slow in October, with an average increase of 0.21 °C per decade. The warming in January and July is 0.24 °C and 0.27 °C per decade, respectively. The baseline period values (the mean temperature during 1961–1990) in annual, January, April, July, and October are 8.4 °C, −10.5 °C, 11.9 °C, 23.5 °C, and 8.6 °C, respectively. The warmest years of annual mean temperature occurred in 2007, 2015, and 2016, which were 10.1 °C, and 1.7 °C higher than the baseline period values. The coldest years occurred in 1967 and 1984, which were 7.4 °C, 1.0 °C below the baseline period values. The warmest January mean temperature was −7.5 °C in 1997 and 2015; the warmest April, July and October mean temperatures were 15.5 °C, 26.2 °C and 11.7 °C in 2019, 2015, and 2006, which were 3.0 °C, 3.6 °C, 2.7 °C and 3.1 °C higher than the baseline period values, respectively; the coldest years in January, April, July and October were −15.2 °C, 10.0 °C, 21.4 °C and 6.4 °C in 1967, 1963, 1972 and 1981, which were 4.7 °C, 1.9 °C, 2.1 °C, and 2.2 °C lower than the baseline period values, respectively.
The spatially homogenized revised average and the equal-weighted average calculated annual, January, April, July, and October maximum temperature trends are consistent with an increasing trend (Figure 7), which is consistent with the mean temperature trend. The difference between the maximum temperature warming trend calculated by the two methods is not significant, with a difference of 0.04–0.07 °C per decade. From the average data of the spatial homogenization revised average, it can be concluded that the annual maximum temperature increased by 0.18 °C per decade, with the most significant warming in April, averaging an increase of 0.41 °C per decade, and relatively slow warming in January, averaging an increase of 0.26 °C per decade. The baseline period values of the maximum annual, January, April, July, and October temperatures were 36.9 °C, 3.3 °C, 27.6 °C, 36.0 °C and 24.4 °C, respectively. The maximum value of annual maximum temperature occurred in 2015, at 39.4 °C, 2.5 °C higher than the baseline period values, and the minimum value of annual maximum temperature occurred in 1993, at 35.1 °C, 1.8 °C lower than the baseline period values.
The spatially homogenized revised average and the equal-weighted average calculated annual, January, April, July, and October minimum temperature trends are consistent with an increasing trend (Figure 7), which is consistent with the annual mean and maximum temperature trends. The difference in the warming trend of the minimum temperature calculated by the two methods is not significant, with a difference of 0.02–0.06 °C per decade. From the spatially homogenized revised average data, it can be concluded that the annual minimum temperature increased by 0.60 °C per decade, with the most pronounced warming in April, averaging an increase of 0.54 °C per decade, and relatively slow warming in January, averaging an increase of 0.31 °C per decade. The baseline period values of the minimum annual, January, April, July, and October temperatures were −24.1 °C, −22.3 °C, −3.0 °C, 11.2 °C and −5.0 °C, respectively. The maximum value of annual minimum temperature occurred in 1982, at −19.5 °C, 4.6 °C higher than the baseline period values, and the minimum value of annual minimum temperature occurred in 1967, at −28.5 °C, 4.4 °C lower than the baseline period values.
As seen from the interdecadal map of Xinjiang (Figure 8), the annual mean temperature, annual maximum temperature and annual minimum temperature in Xinjiang from 1961 to 2020 show an increasing trend from one decade to another. The annual mean temperature and annual minimum temperature were lower than the baseline period values before the 1980s but higher than the baseline period values after the 1980s and increased by 1.3 °C and 3.0 °C, respectively, in the 2010s compared with the 1960s, with increases of 15% and 11.9%, respectively. The annual maximum temperature was lower than the baseline period values in the 1990s and 1980s, while all other periods were higher than the base period mean values and increased by 1.1 °C in the 2010s compared with the 1960s, with an increase of 3.0%.

Figure 8.
Interdecadal variation of the mean temperature in Xinjiang during 1961–2020.
3.4.3. Analysis of Mutation Temperature in the Xinjiang Region
The M-K mutation test was used to analyse the mutation of the spatially homogenized revised and equally weighted average revised mean temperatures in the Xinjiang region, and the results showed that during the study period, the mutation point of the annual mean temperature in the Xinjiang region calculated by the spatially homogenized revision occurred during 1997−1998 (Figure 9a), while the mutation point by the equally weighted average occurred during 1996−1997 (Figure 9b), and the spatially homogenized revision lagged behind the equally weighted average mutation by one year.
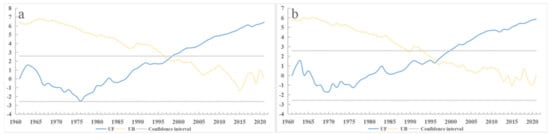
Figure 9.
The mutation temperature change curve in Xinjiang, 1961–2021 ((a) the spatially homogenized revised average; (b) the equal-weighted average).
4. Conclusions and Discussion
This study obtained results for the mean temperature of Xinjiang that are reasonable according to the spatially homogenized revised average, and this method is suitable for the calculation of the spatially mean temperature of the Xinjiang region. The conclusions are as follows:
assigns km2, km2, km2, km2 and km2. Through comparative analysis, a value of 200,000 km2 is suitable for determining the weight coefficient of the 89 weather station network in the Xinjiang region. is km2 for a homogenized and revised network of national climatological data stations [20], the value of for Xinjiang is smaller than the national average, which is mainly due to the inconsistency of the spatial scale and the number of meteorological stations between the two studies, and verifies that the previously mentioned assigns km2 is too large in Xinjiang and is not suitable for Xinjiang. Although the value of 200,000 km2 is more suitable for Xinjiang than the other four groups of data, it does not necessarily meet the requirement that all the stations in have a high correlation with station . In addition, the local microclimate also leads to poor correlation between some stations in , and all these factors will lead to errors between the calculated results of the average value of regional temperature and the objective facts. When the value is 200,000 km2, some regions along the southeastern boundary are not covered, and the calculation results of the average value of regional temperature will also produce errors. In the future, we can try to include the stations in neighboring provinces to compensate for the lack of coverage in the southeastern boundary region of Xinjiang and reduce the error of the calculation results of the average value of regional temperature in Xinjiang.
The denser the spatial distribution of the station network is, the larger the density of the station network, the smaller the area of the station domain, and the smaller the weight coefficient of the station. Xinjiang regional meteorological stations are densely distributed in Zone I, the values of station network density are large, the values of station domain area are small, and the calculated station weight coefficients are small, while the results in the sparsely distributed meteorological stations of the region IV are the opposite. From a qualitative perspective, we can see that the distribution of stations around the Wenquan meteorological station is the densest, and from a quantitative perspective, the value of the station network density of the Wenquan meteorological station is the largest among the 89 meteorological stations in Xinjiang, with a value of 39 (stations/20 104 km2) and a minimum station domain area value of 0.026 (20 104 km2/station); similarly, from a qualitative perspective, we can see that the distribution of stations around the Qiemo meteorological station is the sparsest, and from a quantitative perspective, the value of the station network density of the Qiemo meteorological station is the smallest among the 89 meteorological stations in Xinjiang, with a value of 2 (stations/20 104 km2) and a maximum station domain area value of 0.495 (20 104 km2/station). Therefore, the distribution of station domain area and station network density can quantitatively reflect the uneven distribution of the Xinjiang 89 weather station network.
The spatially homogenized revised mean temperature is higher than the equal-weighted mean temperature in the Xinjiang region. However, the homogenization of 160 stations was revised in China as follows: the spatially homogenized revised average result is significantly lower than the equal-weighted average [4], contrary to the conclusion of this study. This is because the stations are densely distributed in southeast China, so in this region, the weight of stations in the national average is reduced in the homogenization revision, and the mean temperature is higher than other stations in China, hence, the homogenization revision result of 160 stations is significantly lower than the equal-weight average in China. For the Xinjiang region, the spatial distribution of the meteorological stations in Xinjiang is extremely uneven, with a relatively dense distribution in Zone I and a sparse distribution in Zone IV. The temperature at all time scales in Zone I with a dense station distribution is lower than that in Zone IV with sparse stations, and the results calculated by the equal-weighted average will be biased towards the dense station area and lower than the true temperature. Therefore, the equal-weighted average calculation result will underestimate the regional mean temperature in Xinjiang. With the spatially homogenized revision of the Xinjiang regional meteorological stations, the sparsely stationed Zone IV stations obtained relatively large weighting coefficients, the densely stationed Zone I stations obtained relatively small weighting coefficients, and the spatially homogenized revised average Xinjiang regional mean temperature was higher than the equal-weighted mean temperature and closer to the real temperature. Therefore, the homogenized adjustment of the meteorological stations in Xinjiang is necessary, and the obtained results are reasonable.
The annual, January, April, July, and October average, maximum, and minimum temperatures calculated by the spatially homogenized revised average and the equal-weighted average have the same trend of increasing, and the mean temperature warming trend calculated by the two methods are different, but the differences are not significant. The two methods yielded approximately the same year of mutation in the temperature sequence. The two methods can respond well to the trend of temperature change in Xinjiang. The annual, January, April, July, and October minimum temperature warming trends by the spatial homogenization revised average are greater than the maximum temperature warming trend and the mean temperature warming trend, and the annual minimum temperature warming trend is 3.3 times the annual maximum warming trend and two times the annual mean temperature. The temperature trend in Xinjiang, obtained by the spatially homogenized revised average, remains one of the most sensitive regions for global climate change.
Xinjiang regional weather station network homogenization revisions can be applied to Xinjiang regional mean temperature, although the results obtained are more objective and reasonable compared with the equal-weighted average. at present, only the factor of station representative area is considered. For Xinjiang, with its rugged terrain and staggering altitude, different altitudes also greatly impact regional meteorological elements. In response to this situation, future work will attempt to take altitude, topography, and other imaging factors into account and further revise the unevenness of the Xinjiang regional weather station network to improve its monitoring capability.
Author Contributions
Conceptualization, L.Z. and W.M.; methodology, L.Z. and W.M.; validation, T.Z. and G.J.; formal analysis, L.Z. and W.M.; data curation, L.Z. and J.S.; writing—original draft preparation, L.Z.; writing—review and editing, L.Z., J.S. and S.D; supervision, S.D. and W.M. All authors have read and agreed to the published version of the manuscript.
Funding
This research was funded by the Xinjiang Meteorological Science and Technology Innovation Development Fund Project (Grant No. MS202207), Natural Science Foundation of Xinjiang Uygur Autonomous Region (Grant No. 2021D01B83), The Third Xinjiang Scientific Expedition Program (Grant No. SQ2021xjkk01601), Anhui Meteorological Bureau Innovation Development Special Project (Grant No. CXM202110).
Institutional Review Board Statement
Not applicable.
Informed Consent Statement
Not applicable.
Data Availability Statement
The datasets generated and analysed during the current study are not publicly available but are available from the corresponding author upon reasonable request.
Acknowledgments
Xinjiang Climate Centre based on the support of meteorological data, Wang Shengli senior engineer to give meteorological observation data interpretation and guidance, and Han Xueyun senior engineer to give meteorological data extraction and processing.
Conflicts of Interest
The authors declare no conflict of interest.
Appendix A
| Order Number | Weather Site | Station Domain Area /(20 × 104km2/station) | Station Network Density /(station/20 × 104 km2) | Weight Coefficient |
| 1 | Haba River | 0.07977 | 12.54 | 0.01137 |
| 2 | Jeminay | 0.06241 | 16.02 | 0.008892 |
| 3 | Bulzin | 0.08398 | 11.91 | 0.01197 |
| 4 | Fuhai | 0.08592 | 11.64 | 0.01224 |
| 5 | Altay | 0.07347 | 13.61 | 0.01047 |
| 6 | Fuyun | 0.1012 | 9.880 | 0.01442 |
| 7 | Tacheng | 0.03665 | 27.29 | 0.005221 |
| 8 | Yumin | 0.04270 | 23.42 | 0.006084 |
| 9 | Emin | 0.04384 | 22.81 | 0.006247 |
| 10 | Hobukesar | 0.05825 | 17.17 | 0.008299 |
| 11 | Qinghe | 0.1056 | 9.468 | 0.01505 |
| 12 | Alataw Pass | 0.03403 | 29.38 | 0.004849 |
| 13 | Bole | 0.03018 | 33.14 | 0.004290 |
| 14 | Toli | 0.04038 | 24.77 | 0.005753 |
| 15 | Karamay | 0.05290 | 18.90 | 0.007537 |
| 16 | Baytik Mountain | 0.1228 | 8.142 | 0.01750 |
| 17 | Khorgos | 0.02935 | 34.07 | 0.004182 |
| 18 | Huocheng | 0.03618 | 27.64 | 0.005155 |
| 19 | Wenquan | 0.02563 | 39.02 | 0.003651 |
| 20 | Jinghe | 0.03520 | 28.41 | 0.005015 |
| 21 | Wusu | 0.04469 | 22.38 | 0.006367 |
| 22 | Battery | 0.04484 | 22.30 | 0.006388 |
| 23 | Moso bay | 0.06601 | 15.15 | 0.009406 |
| 24 | Shihezi | 0.04987 | 20.05 | 0.007106 |
| 25 | Shawan | 0.04750 | 21.05 | 0.006767 |
| 26 | Caijiahu | 0.04534 | 22.06 | 0.006460 |
| 27 | Hutubi | 0.04337 | 23.06 | 0.006179 |
| 28 | Jimsar | 0.06077 | 16.45 | 0.008659 |
| 29 | Qitai | 0.06375 | 15.69 | 0.009082 |
| 30 | Qapqal | 0.03916 | 25.54 | 0.005579 |
| 31 | Yining | 0.03792 | 26.37 | 0.005403 |
| 32 | Nilka | 0.03832 | 26.10 | 0.005460 |
| 33 | Yining County | 0.04007 | 24.96 | 0.005709 |
| 34 | Gongliu | 0.04107 | 24.35 | 0.005852 |
| 35 | Xinyuan | 0.04025 | 24.85 | 0.005735 |
| 36 | Zhaosu | 0.03794 | 26.36 | 0.005406 |
| 37 | Takes | 0.04103 | 24.38 | 0.005845 |
| 38 | Urumqi | 0.04337 | 23.06 | 0.006179 |
| 39 | Small canal | 0.04337 | 23.06 | 0.006179 |
| 40 | Balguntay | 0.04534 | 22.06 | 0.006460 |
| 41 | Daxigou | 0.04156 | 24.06 | 0.005921 |
| 42 | Tianchi | 0.04750 | 21.05 | 0.006767 |
| 43 | Dabancheng | 0.04987 | 20.05 | 0.007106 |
| 44 | Mori | 0.07215 | 13.86 | 0.01028 |
| 45 | ümüx | 0.04750 | 21.05 | 0.006767 |
| 46 | Bayanbulak | 0.03836 | 26.07 | 0.005466 |
| 47 | Hejing | 0.04750 | 21.05 | 0.006767 |
| 48 | Yanqi | 0.04987 | 20.05 | 0.007106 |
| 49 | Hoxud | 0.04750 | 21.05 | 0.006767 |
| 50 | Toksun | 0.05250 | 19.05 | 0.007480 |
| 51 | Turpan | 0.05541 | 18.05 | 0.007895 |
| 52 | Shanshan | 0.09067 | 11.03 | 0.01292 |
| 53 | Wushi | 0.09514 | 10.51 | 0.01356 |
| 54 | Aksu | 0.07182 | 13.92 | 0.01023 |
| 55 | Baicheng | 0.05007 | 19.97 | 0.007134 |
| 56 | Xinhe | 0.06988 | 14.31 | 0.009957 |
| 57 | Sanga | 0.09044 | 11.06 | 0.01289 |
| 58 | Luntai | 0.07124 | 14.04 | 0.01015 |
| 59 | Kuqa | 0.07652 | 13.07 | 0.01090 |
| 60 | Yuli | 0.09974 | 10.03 | 0.01421 |
| 61 | Korla | 0.07672 | 13.03 | 0.01093 |
| 62 | torugart | 0.06122 | 16.33 | 0.008723 |
| 63 | Atux | 0.05662 | 17.66 | 0.008067 |
| 64 | Wuqia | 0.05191 | 19.26 | 0.007396 |
| 65 | Jiashi | 0.05753 | 17.38 | 0.008196 |
| 66 | Aktao | 0.06560 | 15.24 | 0.009347 |
| 67 | Aheqi | 0.07020 | 14.25 | 0.01000 |
| 68 | Yopurga | 0.06084 | 16.44 | 0.008668 |
| 69 | Keping | 0.09802 | 10.20 | 0.01397 |
| 70 | Awat | 0.09841 | 10.16 | 0.01402 |
| 71 | Alar | 0.09539 | 10.48 | 0.01359 |
| 72 | Tikanlilk | 0.1247 | 8.021 | 0.01776 |
| 73 | Ruoqiang | 0.3264 | 3.064 | 0.04650 |
| 74 | Yingjisha | 0.06563 | 15.24 | 0.009351 |
| 75 | Tashkurgan | 0.05708 | 17.52 | 0.008133 |
| 76 | Shache | 0.08703 | 11.49 | 0.01240 |
| 77 | Yecheng | 0.08581 | 11.65 | 0.01223 |
| 78 | Zepu | 0.08619 | 11.60 | 0.01228 |
| 79 | Pishan | 0.1101 | 9.085 | 0.01568 |
| 80 | Cele | 0.1857 | 5.386 | 0.02645 |
| 81 | Hotan | 0.1622 | 6.165 | 0.02311 |
| 82 | Minfeng | 0.2274 | 4.397 | 0.03240 |
| 83 | Qiemo | 0.4945 | 2.022 | 0.07045 |
| 84 | Yutian | 0.2197 | 4.552 | 0.03130 |
| 85 | Barkol | 0.1340 | 7.461 | 0.01910 |
| 86 | Nom | 0.09446 | 10.59 | 0.01346 |
| 87 | Yiwu | 0.1162 | 8.605 | 0.01656 |
| 88 | Hami | 0.1657 | 6.035 | 0.02361 |
| 89 | Red willow river | 0.1237 | 8.081 | 0.01763 |
References
- Masson-Delmotte, V.; Zhai, P.; Pirani, A.; Connors, S.L.; Péan, C.; Berger, S.; Caud, N.; Chen, Y.; Goldfarb, L.; Gomis, M.I.; et al. Summary for Policy-makers. In Climate Change 2021: The Physical Science Basis. Contribution of Working Group I to the Sixth Assessment Report of the Intergovernmental Panel on Climate Change; Cambridge University Press: Cambridge, MA, USA, 2021. [Google Scholar]
- CMA. CMA 2022: China Climate Bulletin 2017. China Meteorological Administration. Available online: www.cma.gov.cn/root7/auto13139/201801/t20180117_460484.html (accessed on 10 August 2021).
- XCC. Xinjiang Climate Change Monitoring Bulletin; Xinjiang Climate Center: Xinjiang, China, 2022. [Google Scholar]
- Luo, X. Study on Station Network Homogeneity Adjustment for Climate Data of China and Its Application; Nanjing Information Engineering University: Nanjing, China, 2011. [Google Scholar]
- Ma, P.L.; Yang, J.H.; Lu, G.Y.; Zhu, B.; Liu, W. The Transitional Change of Climate in the East of Northwest China. Plateau Meteorol. 2020, 39, 840–850. [Google Scholar] [CrossRef]
- Gubler, S.; Hunziker, S.; Begert, M.; Croci-Maspoli, M.; Konzelmann, T.; Brönnimann, S.; Schwierz, C.; Oria, C.; Rosas, G. The influence of station density on climate data homogenization. Int. J. Climatol. 2017, 37, 4670–4683. [Google Scholar] [CrossRef]
- Jones, P.D.; Wigley, T.M.L. Estimation of global temperature trends: What’s important and what isn’t. Clim. Change 2010, 100, 59–69. [Google Scholar] [CrossRef]
- Trewin, B.C.; Trevitt, A.C.F. The development of composite temperature records. Int. Climatol. 1996, 16, 1227–1242. [Google Scholar] [CrossRef]
- Della-Marta, P.M.; Wanner, H. A method of homogenizing the extremes and mean of daily temperature measurements. J. Clim. 2006, 19, 4179–4197. [Google Scholar] [CrossRef]
- Vincent, L.A.; Wang, X.L.; Milewska, E.J.; Wan, H.; Feng, Y.; Swail, V. A second generation of homogenized Canadian monthly surface air temperature for climate trend analysis. J. Geophys. Res. 2012, 117, D18110. [Google Scholar] [CrossRef]
- Trewin, B.C. A daily homogenized temperature data set for Australia. Int. J. Climatol. 2013, 33, 1510–1529. [Google Scholar] [CrossRef]
- Cao, L.; Zhu, Y.; Tang, G.; Yuan, F.; Yan, Z. Climatic warming in China according to a homogenized data set from 2419 stations. Int. J. Climatol. 2016, 36, 4384–4392. [Google Scholar] [CrossRef]
- Wang, X.L.; Feng, Y. RHtestsV3 User Manual. Climate Research Division, Atmospheric Science and Technology Directorate, Science and Technology Branch; Environment Canada: Toronto, ON, Canada, 2010. [Google Scholar]
- Dong, S.; Sun, Y.; Aguilar, E.; Zhang, X.; Peterson, T.C.; Song, L.; Zhang, Y. Observed changes in temperature extremes over Asia and their attribution. Clim. Dyn. 2018, 51, 339–353. [Google Scholar] [CrossRef]
- Hu, T.; Sun, Y. Anthropogenic influence on extreme temperatures in China based on CMIP6 models. Int. J. Climatol. 2022, 42, 2981–2995. [Google Scholar] [CrossRef]
- Wang, Y.; Sun, Y.; Hu, T.; Qin, D.; Song, L. Attribution of temperature changes in Western China. Int. J. Climatol. 2018, 38, 742–750. [Google Scholar] [CrossRef]
- Jones, P.D.; Hulme, M. Calculating regional climatic time series for temperature and precipitation: Methods and illustrations. Int. J. Climatol. 1996, 16, 361–377. [Google Scholar] [CrossRef]
- Chung, C.; Nigam, S. The weighting of geophysical data in Principal Component Analysis. J. Geophys. Res. 1999, 104, 16925–16928. [Google Scholar] [CrossRef]
- Zhu, C. A diagnostic method of the air temperature change trending in China. Q. J. Appl. Meteorol. 1992, S1, 114–118. [Google Scholar]
- Wang, P.; Luo, X.; Li, L.; Zhou, G.; Xie, Y. A scheme and its application of network homogeneity adjustment for climatic data of China. Trans. Atmos. Sci. 2011, 34, 8–13. [Google Scholar]
- Wang, Q.; Zhai, P.M.; Qin, D.H. New perspectives on ‘warming-wetting’ trend in Xinjiang, China. Adv. Clim. Change Res. 2020, 11, 252–260. [Google Scholar] [CrossRef]
- Yao, J.; Chen, Y.; Guan, X.; Zhao, Y.; Chen, J.; Mao, W. Recent climate and hydrological changes in a mountain–basin system in Xinjiang, China. Earth-Sci. Rev. 2022, 226, 103957. [Google Scholar] [CrossRef]
- Wu, Z.; Zhang, H.; Krause, C.M.; Cobb, N.S. Climate change and human activities: A case study in Xinjiang, China. Clim. Change 2010, 99, 457–472. [Google Scholar] [CrossRef]
- Kang, L.; Batur, B.; Luo, N.; Xue, Y.; Wang, M. Spatial-temporal Variations of Temperature and Precipitation in Xinjiang from 1961 to 2013. Xinjiang Agric. Sci. 2018, 55, 123–133. [Google Scholar] [CrossRef]
- Zhang, Y.; Chu, X.; Yang, S.; Guo, C. Climate Change in North Xinjiang in Recent 56 Years. Arid. Zone Res. 2019, 36, 212–219. [Google Scholar] [CrossRef]
- Zhang, Y.; Tuerxunbai, G.; Su, L.; Li, Q. Spatial and temporal characteristics of climate change at different altitudes in Xinjiang in the past 60 years. Arid. Land Geogr. 2019, 42, 822–829. [Google Scholar] [CrossRef]
- Li, P.; Lin, J.; Maidi, K. Effects of future climate change on potential geographic distribution of Calliptamus italics (L.) in Xinjiang. Plant Prot. 2017, 43, 90–96. [Google Scholar] [CrossRef]
- Li, Z.; Cheng, Z.; Zhang, L.; Lu, B. Variation characteristics and prediction of hydrological factors in Xinjiang under the influence of climate changes. Water Sci. Eng. Technol. 2018, 6, 1–6. [Google Scholar]
- Zhao, L.; Li, W.; Umiti, G.; Lv, N. Effects of climate change on cotton planting layout and growth in Xinjiang. Xinjiang Farm Res. Sci. Technol. 2018, 41, 7–10. [Google Scholar]
- Zhang, S.; Pu, Z.; Li, X.; Ji, C. Impact of climate change on apple-planting climatic suitability in Xinjiang. Chin. J. Agric. Resour. Reg. Plan. 2018, 39, 255–264. [Google Scholar] [CrossRef]
- Chang, H.; Liu, W. Dynamic Effect Analysis of Meteorological Disasters on Agricultural Economy in Xinjiang Production and Construction Corps under the Background of Climate Change. Ecol. Econ. 2019, 35, 125–129. [Google Scholar]
- Guo, C.; Chu, X.; Zhang, Y.; Luan, Y.; Xu, C. Climate Change and Response to Drought and Flood Disasters in Northern Xinjiang. Southwest China J. Agric. Sci. 2019, 32, 929–935. [Google Scholar] [CrossRef]
- Zhao, P.; Chen, T.; Wang, Q.; Ruide, Y.U. Quantitative analysis of the impact of climate change and human activities on grassland ecosystem NPP in Xinjiang. J. Univ. Chin. Acad. Sci. 2020, 37, 51–62. [Google Scholar] [CrossRef]
- Zhou, G.; Wang, P.; Luo, X.; Xie, Y. Characteristics of Surface Air Temperature Anomalies in China Based on Observations at 160 Stations. J. Appl. Meteorol. Sci. 2011, 22, 283–291. [Google Scholar]


Publisher’s Note: MDPI stays neutral with regard to jurisdictional claims in published maps and institutional affiliations. |
© 2022 by the authors. Licensee MDPI, Basel, Switzerland. This article is an open access article distributed under the terms and conditions of the Creative Commons Attribution (CC BY) license (https://creativecommons.org/licenses/by/4.0/).