Article

Fractional Vegetation Cover and Spatiotemporal Variations of PM2.5 Concentrations in the Beijing-Tianjin-Hebei Region of China

College of Resource Environment and Tourism, Capital Normal University, Beijing 100048, China
*
Author to whom correspondence should be addressed.
Atmosphere 2022, 13(11), 1850; https://doi.org/10.3390/atmos13111850
Submission received: 27 September 2022 / Revised: 18 October 2022 / Accepted: 2 November 2022 / Published: 7 November 2022
(This article belongs to the Section Air Quality)

Abstract

:
The Beijing-Tianjin-Hebei region (BTH) of China maintains high-pollution levels of particulate matter ≥2.5 μm (PM2.5). Accordingly, understanding the spatiotemporal distributions of PM2.5 and their relationship with fractional vegetation cover in this region is of great significance for effective air pollution treatment. In the present study, ground-based PM2.5 monitoring, MODIS-NDVI satellite data, spatial interpolation, dimidiate pixel model, and Spearman’s rank correlation analyses were used to explore this relationship in the years 2018 and 2019. The results indicated the following: (1) In the BTH, the average annual PM2.5 mass concentration was 50 μg·m−3 in 2019, a 9.2% decrease from 2018, but still in excess of China’s second-level environmental air quality standards (35 µg·m−3). (2) PM2.5 concentrations in the BTH were temporally distributed, exhibiting a roughly U-shaped pattern within a year, peaking in the winter, followed by the spring and autumn, and reaching its minimum in the summer. (3) Spatially, distributions of PM2.5 mass concentrations in the BTH were significantly lower in the north and higher in the south. PM2.5 in the central and southern areas displayed concentrated and continuous distribution trends. (4) PM2.5 concentrations were negatively correlated with fractional vegetation cover in the BTH, and the effect of fractional vegetation cover on PM2.5 mass concentration was more significant in the winter than in other seasons. According to the results of this study, improving vegetation cover and increasing vegetation area have a positive effect on PM2.5 deposition in the Beijing-Tianjin-Hebei region. Therefore, the author suggests that the ability of urban green spaces to mitigate PM2.5 pollution in the Beijing-Tianjin-Hebei region can be improved in the future by controlling the vegetation coverage of urban green spaces to a suitable extent, especially in winter. This study provides an important scientific basis for the quantitative analysis of the effect of vegetation cover on PM2.5 concentration distribution and air pollution control and environmental protection in the Beijing-Tianjin-Hebei region.

1. Introduction

With the acceleration of industrialization, urbanization, and the social economy in China over recent years, energy consumption and vehicle ownership have increased continuously. Heavy air pollution and frequent haze events across the country have significant negative impacts on the environment, human health, and sustainable urban development [1]. Fine particles, with an aerodynamic diameter ≤2.5 μm (PM2.5), are the most dominant component of atmospheric composite pollution and the primary air particulate pollutant in China [2]. Studies have demonstrated that high PM2.5 concentrations can substantially reduce atmospheric visibility, have important impacts on the atmosphere and global climate change [3,4,5,6], and increase respiratory morbidity and mortality [7,8]. PM2.5 is one of the major bottlenecks for improving ambient air quality in China and has attracted widespread attention from both science and society. In recent years, the spatial and temporal distribution characteristics of PM2.5 and its influencing factors have become a central research topic in academia. Lim et al. [9] showed that, globally, China and India were in the PM2.5 high risk area, whilst Europe, Australia and North America were in the PM2.5 reduction area. Developed countries have undergone urban expansion, while maintaining greenness and still reducing PM2.5 emissions. In contrast, greenness in developing countries have tended to decrease as PM2.5 concentration rise. Zhang et al. [10] found that the successful implementation of PM2.5 pollution control measures, such as energy conservation and emission reduction, was the most important reason for the improvement of PM2.5 pollution in China from 2013–2017. Dai et al. [11] proposed a hybrid model, combining XGBoost, four GARCH models and a MLP model (XGBoost-GARCH-MLP), to predict PM2.5 concentration values and volatility. The experimental research results showed that the volatility forecasting model proposed in this study had a good performance in the long-term forecasting process. Dai et al. [12] established a deep learning model for an atmospheric pollutant memory network (LSTM) by both applying the one-dimensional multiscale convolution kernel (ODMSCNN) and a long-short-term memory network (LSTM) on the basis of temporal and spatial characteristics. The results found that the air pollutant concentration prediction model based on ODMSCNN-LSTM showed a better prediction effect compared with multi-layer perceptron (MLP), CNN, and LSTM models.
The Beijing-Tianjin-Hebei (BTH) urban agglomeration is the densely populated, political and cultural center of China, and an important core area of the northern economy, with strongly developed agriculture and industry. In recent years, rapid economic development, a drastic increase in population, along with geographic location, topography, and adverse meteorological conditions (among other factors), have beset a plague of pollution upon the Beijing-Tianjin-Hebei region (hereafter referred to as “BTH”) [13,14,15]. Heavy air pollution events, dominated by PM2.5, are common in the boreal autumn and winter [16,17], and research on the spatiotemporal distribution patterns of PM2.5 across the BTH have gradually gained focus in the field of atmospheric science [18,19,20]. Using spatial autocorrelation analyses, Yan et al. [21] examined the spatiotemporal patterning of PM2.5 in the BTH for 2016, and revealed that regional concentrations were increasing, from late autumn to early winter, with distributions expanding from the southeast to northwest. Further, concentrations dropped rapidly from late winter to early spring, with distributions expanding from the northwest to southeast. Deng et al. [22] found that average annual PM2.5 concentrations in the BTH decreased between 2014 and 2016, and then gradually increased from northwest to southeast, with significant differences in spatial patterns between north and south.
With this ongoing research, the purifying effect of vegetation on PM2.5 pollution has gradually attracted the attention of scholars, both at home and abroad. Vegetation can be both a natural and artificial component of urban systems, and plays an irreplaceable role in improving air quality and mitigating the effects of PM2.5 pollution [23,24]. The leaves, branch surfaces, and stems of vegetation can actively adsorb and remove airborne PM, help create a stable microclimate, and accelerate the deposition process of PM2.5 [25,26,27]. Vegetation can also cut off PM2.5 by covering the surface of point sources [26]. Mitchell et al. [28] showed that leaf surface morphology is the primary factor affecting the deposition rate of PM on leaf surfaces, with ridged and pubescent leaves maintaining the maximum deposition rate, and establishing a theoretical basis for the types of urban environmental vegetation to be planted. Tong et al. [29] found that PM2.5 concentrations were higher in grasslands than in grasslands co-cropped with shrubs and trees; however, simply planting more trees did not reduce PM2.5, and Tong et al. concluded that the analyses must be location-specific. Jeanjean et al. [30] concluded that trees and grasses have a much greater deposition capacity for fine PM than buildings. Matsuda et al. [31] studied the sedimentation rate of PM2.5 over broad-leaved forests and the impact of vegetation on high-altitude PM2.5 in central Japan; whereas Hwang et al. [32] studied the effect of five different plant leaves on the mechanisms of PM2.5 adsorption by plants from a microscopic perspective. Zhang et al. [33] found that the seasonal cycle of vegetation was more significant for PM2.5 reduction in the densely vegetated southern region of China. Lee et al. [34] showed that the PM2.5 concentrations in woodlands in Seoul were lower than the PM2.5 concentrations in urban areas, demonstrating that urban forests might be a potential way to improve urban air quality. Lu et al. [35] analyzed the effects of land use and landscape pattern on PM2.5 pollution in the Yangtze River Delta, and the results showed that two land use types with higher vegetation cover, woodland and grassland, were significantly and negatively correlated with PM2.5 concentrations.
Native plants and green belt plantation projects have also contributed to the reduction in the annual rates of particulate matter, by 68.4%, in western parts of Asia [36]. Long periods of drought could also increase air pollutants; this was indicated in the lower pollen content within pollen traps in the year 2010–2011, compared to 2009–2010, by 9.9% [36]. The long drought periods, water scarcity, and the huge precipitation variations are enhancing aeolian activities as part of pollutants on the regional scale in Iran [37], Kuwait [36], and Iraq [38], as well as in China and east Asia. The study found that PM2.5 pollution in Beijing was higher in the south and lower in the north. In contrast, the vegetation coverage was lower in the south and higher in the north [39]. This showed that vegetation cover and PM2.5 concentration were closely related. In the BTH, however, the present studies of PM2.5 have primarily focused on source apportionment [40,41], transmission mechanisms [42], spatiotemporal distributions, and model predictions [43,44]. There are few comprehensive studies on the relationship between vegetation cover and spatiotemporal distributions of PM2.5. Therefore, the quantitative study of the relationship between the two is important for air pollution control in the Beijing-Tianjin-Hebei region. Accordingly, the present study analyzed the spatiotemporal trends of PM2.5 in the BTH, with respect to the urban fractional vegetation cover (FVC) data from 2018 to 2019, for the purpose of providing a quantitative basis for the future management of PM2.5 and the construction of urban green spaces.

2. Materials and Methods

2.1. Study Area

The BTH is located in the North China Plain, between 36°01′ N–42°37′ N and 113°04′ E–119°53′ E (Figure 1). The region encompasses two municipalities, Beijing and Tianjin, and a province, Hebei. The BTH is one of the three major urban agglomerations in China, and is the largest and most economically dynamic area in northern China. The elevation is higher in the northwest of the region, surrounded by the Taihang and Yan Mountains to the west, north, and northwest. The southeastern area is primarily plains, forming an overall U-shaped terrain, opening to the southeast. The BTH covers ~218,000 km2, accounting for 2.27% of the total terrestrial area of China. Its climate is defined as warm temperate continental monsoon, and the prevailing wind directions are northwest in the winter and southeast in summer. The region shows four distinct seasons annually, with hot, rainy summers and cold, dry winters. The annual mean temperature and precipitation are 10.4–11.9 °C and 375.5–684.7 mm, respectively, and the area’s vegetation is primarily temperate deciduous broad-leaved forest. The monsoon climate and topography of the region make it unfavorable for the dispersion of atmospheric pollutants, leading to severe air pollution issues. Furthermore, air pollution in North China shows trends of area extension, transfer, and composite aggregation along the piedmont of the Taihang Mountains [45,46].

2.2. Data Sources

2.2.1. PM2.5 Mass Concentration

In the present study, PM2.5 concentrations were monitored continuously, from 2018 to 2019, and across 102 effective ambient air quality monitoring sites in the BTH (Figure 1). Hourly PM2.5 concentrations from 35 ambient air quality monitoring sites across Beijing city were collected from the Beijing Municipal Environmental Protection Monitoring Center (http://www.china-jcw.cn/, accessed on 1 February 2021), and 24-h PM2.5 mass concentrations from 67 monitoring sites (with complete observation data) in Tianjin City and Hebei Province were obtained from the National Air Quality Real-time Publishing Platform of the China National Environmental Monitoring Center (http://www.moc.cma.gov.cn/, accessed on 16 February 2021).

2.2.2. Fractional Vegetation Cover

FVC, defined as the percentage of vegetation projected vertically per unit land area, is a comprehensive parameter and an important metric of land surface vegetation cover [47]. Based on the normalized difference vegetation index (NDVI), an improved dimidiate pixel model was used to estimate the FVC in the present study. The 16-day composite NDVI dataset at 250 m resolution was obtained from the Moderate Resolution Imaging Spectroradiometer (MODIS) of NASA’s Terra satellite for 2018–2019 (MOD13Q1, Collection 6, https://modis.gsfc.nasa.gov/, accessed on 26 September 2022). This dataset has been partially processed for noise, such as water vapor, clouds, and aerosols, and has been widely used in global vegetation research.

2.3. Data Processing

2.3.1. PM2.5 Concentration

To ensure PM2.5 data quality, outliers and missing values were excluded. Hourly data were obtained from the 102 air quality monitoring stations in the BTH from 2018–2019, and scaled up to daily, monthly, seasonal, and annual averages, in succession. Trends in PM2.5 mass concentrations at different time scales were calculated and analyzed using Microsoft Excel and Origin software. Kriging spatial interpolation was used to analyze the distribution characteristics of PM2.5 across the BTH, as environmental monitoring sites were mostly concentrated in urban centers.

2.3.2. NDVI and Fractional Vegetation Cover

Pixel-level NDVI values range between [−1,1], and likely contain both vegetated and unvegetated components. Accordingly, an improved dimidiate pixel model [48] was used for calculating the FVC (Equation (1)):
FVC = (NDVI − NDVImin)/(NDVImax − NDVImin)
where NDVImin is the NDVI value of bare soil, desert, or areas without vegetation; and
  • NDVImax is the NDVI value for an area covered with surface vegetation. More specifically,
  • NDVImax correlates to a cumulative frequency of 95% NDVI for each scene image, whereas
  • NDVImin correlates to a cumulative frequency of 5%. The 16-day FVC dataset for the BTH was obtained based on these values.

2.3.3. Correlation Analysis between PM2.5 and Fractional Vegetation Cover

Using the regional statistical method, FVC raster data, within a 1 km buffer of each monitoring site (considered the concentration influence range), were averaged and used to represent the corresponding site’s FVC. This buffer range was selected to ensure that the FVC would neither lose data representativeness because of close proximity, nor introduce external interference factors.

2.4. Rank Correlation Analysis

The relationship between PM2.5 mass concentrations and FVC in the BTH was then investigated using a rank correlation analysis. The rank correlation coefficient (i.e., the order-correlation coefficient) is a statistical indicator describing the strength of the statistical correlation between two variable factors. In contrast to the commonly used Pearson correlation coefficient, it is a quantitative and non-parametric rank statistical parameter analysis method, independent of sample distribution [49].
The specific calculation processes of the rank correlation coefficient are as follows:
It was hypothesized that there were n pairs of samples of the two elements x and y, where R1 represents the rank of element x, R2 represents the rank of element y, and di2 = (R1I − R2I)2 represents the square difference in rank for the same set of samples of elements x and y. Then, the rank correlation coefficient (r) between elements x and y was defined according to Equation (2):
r xy   =   1 ( 6 i = 1 n d i 2 ) / ( n 3 n )
where x is the mass concentration of PM2.5, and y is the corresponding FVC. The closer the absolute value of rxy is to 1, the stronger the correlation between the two elements, and a significance test was carried out by consulting the critical value table of the rank correlation coefficient test [49].

3. Results and Discussion

3.1. Temporal and Spatial Variation of PM2.5

3.1.1. Temporal Variation of PM2.5

Analyses of the average monthly PM2.5 mass concentrations in the BTH for 2018 revealed that levels increased from January to March, decreased from April to September (remaining relatively stationary in June and July), and first increased, then decreased from October to December (Figure 2). This phenomenon is likely related to the increasing winds, surface temperatures, and flush surface vegetation from spring onward. The patterns of standard-exceeded rate of daily averaged PM2.5 concentrations (average daily concentration limit, 75 µg·m−3) were similar to the variation characteristics of monthly averaged PM2.5. From January to March, the average monthly concentrations of PM2.5 were between 56–86 μg·m−3, the minimum monthly average observed was 15 µg·m−3, the maximum was 236 µg·m−3, and the average daily standard-exceeded rate ranged from 25.8–54.8%. From April to September, the average monthly concentrations of PM2.5 were between 30–59 μg·m−3, with an observed minimum of 9 µg·m−3, maximum of 172 µg·m−3, and the average daily standard-exceeded rate ranged from 0–33.3%. Excellent weather was primarily concentrated in this period, and 100% average daily PM2.5 concentrations in July and August were below the concentration limit. From October to December, the average monthly concentration of PM2.5 fell between 46–80 μg·m−3, the minimum was 11 µg·m−3, maximum was 226 µg·m−3, and the average daily standard-exceeded rate ranged from 19.4–43.3%.
The changes in average monthly PM2.5 mass concentrations for 2019 revealed a descending trend from January to April, rising from August to December, with levels remaining stable from May to July (Figure 3). The average daily standard-exceeded rate for each month displayed similar characteristics to the monthly variations of average PM2.5 mass concentrations. From January to April, the mean PM2.5 mass concentration was 47–76 μg·m−3, with a minimum observed monthly average of 10 µg·m−3, a maximum in January reaching 241 µg·m−3, and a standard-exceeded rate of average daily PM2.5 concentrations from 20–39.3%. From May to July, the mean PM2.5 mass concentration fell between 35–38 μg·m−3, with a minimum of 9 μg·m−3, maximum of 61 μg·m−3, and a standard-exceeded rate ranging from 0–6.5% (i.e., good air quality, and 100% of days in June and July falling at or below the limit). From August to December, the mean PM2.5 mass concentrations were between 25–57 μg·m−3, with a minimum of 7 μg·m−3, maximum of 159 μg·m−3, and a standard-exceeded rate ranging from 0–35.5% (with 100% of days in August and September falling at or below the limit). The lower PM2.5 concentrations from May to September are mainly due to weather conditions that are more conducive to pollutant dispersion. In addition, strong precipitation in summer has good wet removal effect on respirable particulates. Therefore PM2.5 will remain in a relatively low range, indicating good air quality in summer and autumn. This suggests that precipitation has a significant inhibitory effect on PM2.5 concentrations, while drought exacerbates air pollution. This is consistent with the findings of Al-Dousari et al. [36].
In the present study, spring, summer, autumn, and winter were defined as MAM, JJA, SOM, and DJA, respectively, and the seasonal PM2.5 concentrations in the BTH are illustrated in Figure 4. The PM2.5 concentrations for all cities analyzed met China’s national grade 2 criterion (concentration limit < 75 µg·m−3) in the spring, summer, and autumn. In the spring, the PM2.5 pollution in Shijiazhuang was the most severe (seasonal average, 61 µg·m−3), and the air quality was the best in Zhangjiakou and Chengde (seasonal averages, 34 µg·m−3). In the summer, the seasonal average concentration of PM2.5 peaked at 42 µg·m−3 in Tangshan, and reached its minimum of 23 µg·m−3 in Chengde. In autumn, the seasonal average reached its maximum of 59 µg·m−3 in Baoding, and minimum of 25 µg·m−3 in Zhangjiakou. PM2.5 pollution was most severe in winter, generally caused by coal-fired pollutant emissions during the heating season overlaid with unfavorable weather conditions for dispersion, with the seasonal average PM2.5 concentrations in Handan, Xingtai, Shijiazhuang, Baoding, Hengshui, and Cangzhou exceeding the national grade 2 criterion, and a maximum seasonal average value of 117 µg·m−3 in Handan, and minimum of 31 µg·m−3 in Zhangjiakou, likely because of the prevailing northerly winds during the boreal winter. Therefore, winter in the Beijing-Tianjin-Hebei region has become a critical period for heavy pollution control. Overall, severe pollution levels were observed in most cities (with the exception of Zhangjiakou and Chengde), because they are characterized by the urban core functional area in the central region of the BTH, the coastal development area in the eastern cities, and the urban functional extension area in the southern cities, all maintaining higher pollutant emissions due to the developed industries, dense populations, and higher traffic volumes.
Average annual concentration changes of PM2.5 for the cities of the BTH between 2018 and 2019 are shown in Figure 5. The mean annual concentration of PM2.5 in the BTH was 50 μg·m−3 in 2019, 9.2% lower than that in 2018, and indicating a slight improvement in air quality over the region, although still making it one of the most air-polluted regions in China. The average annual mass concentrations of PM2.5 in Zhangjiakou and Chengde satisfied China’s second-level environmental air quality standards in 2018 (annual average concentration limit, 35 µg·m−3). These two cities represented the minimum PM2.5 pollution areas of the BTH, with the lowest PM2.5 concentration recorded in Zhangjiakou (31 µg·m−3); however, the annual average mass concentration of PM2.5 exceeded the national standard for all other cities observed. The most heavily polluted region was Handan, where the average annual concentration reached 70 μg·m−3.
Similarly, the annual average concentration of PM2.5 fell at or within the national standard only in Zhangjiakou and Chengde in 2019, with the minimum value recorded in Zhangjiakou (26 μg·m−3). Average annual national standard levels were exceeded in all remaining cities, with the most heavily polluted region located in Handan (67 μg·m−3). The consistent areas of low concentrations across both years, Zhangjiakou and Chengde, are likely due to the blocking effect of the Taihang and Yanshan Mountains. Moreover, these montane cities are less industrially developed, and are therefore the site of less industrial waste gas pollution. Chengde has fewer industrial pollution sources and lower PM2.5 mass concentration. Beijing, Tianjin and Tangshan, Langfang and Cangzhou, in the eastern part of the Hebei Province, will lead to more pollution sources due to the large population and the steel in Tangshan, coal chemical in Cangzhou and cement industry in Langfang. In addition, located in the south-central region along the Taihang Mountains, Shijiazhuang, Baoding, Xingtai, Handan and Hengshui, there are a large number of heavy polluting industries. The highest PM2.5 concentrations in both years were clustered in Handan in the southern part of the BTH, a highly industrial area. Coal combustion and the large amount of sewage discharged from steel factories are major contributors to the heavy atmospheric pollution. Elsewhere, the air diffusion conditions of the cities on the coast of Bohai Bay were good, and these pollutants were transported downwards and condensed in the southern cities. From this, it can be seen that each of these locations should establish a long-term and effective mechanism to improve environmental efficiency according to its own geographical location, economic development level, industrial structure and energy structure. Under the unified coordination of Beijing, Tianjin and Hebei, the local environmental efficiency will be continuously improved to achieve the synergistic development of the region.

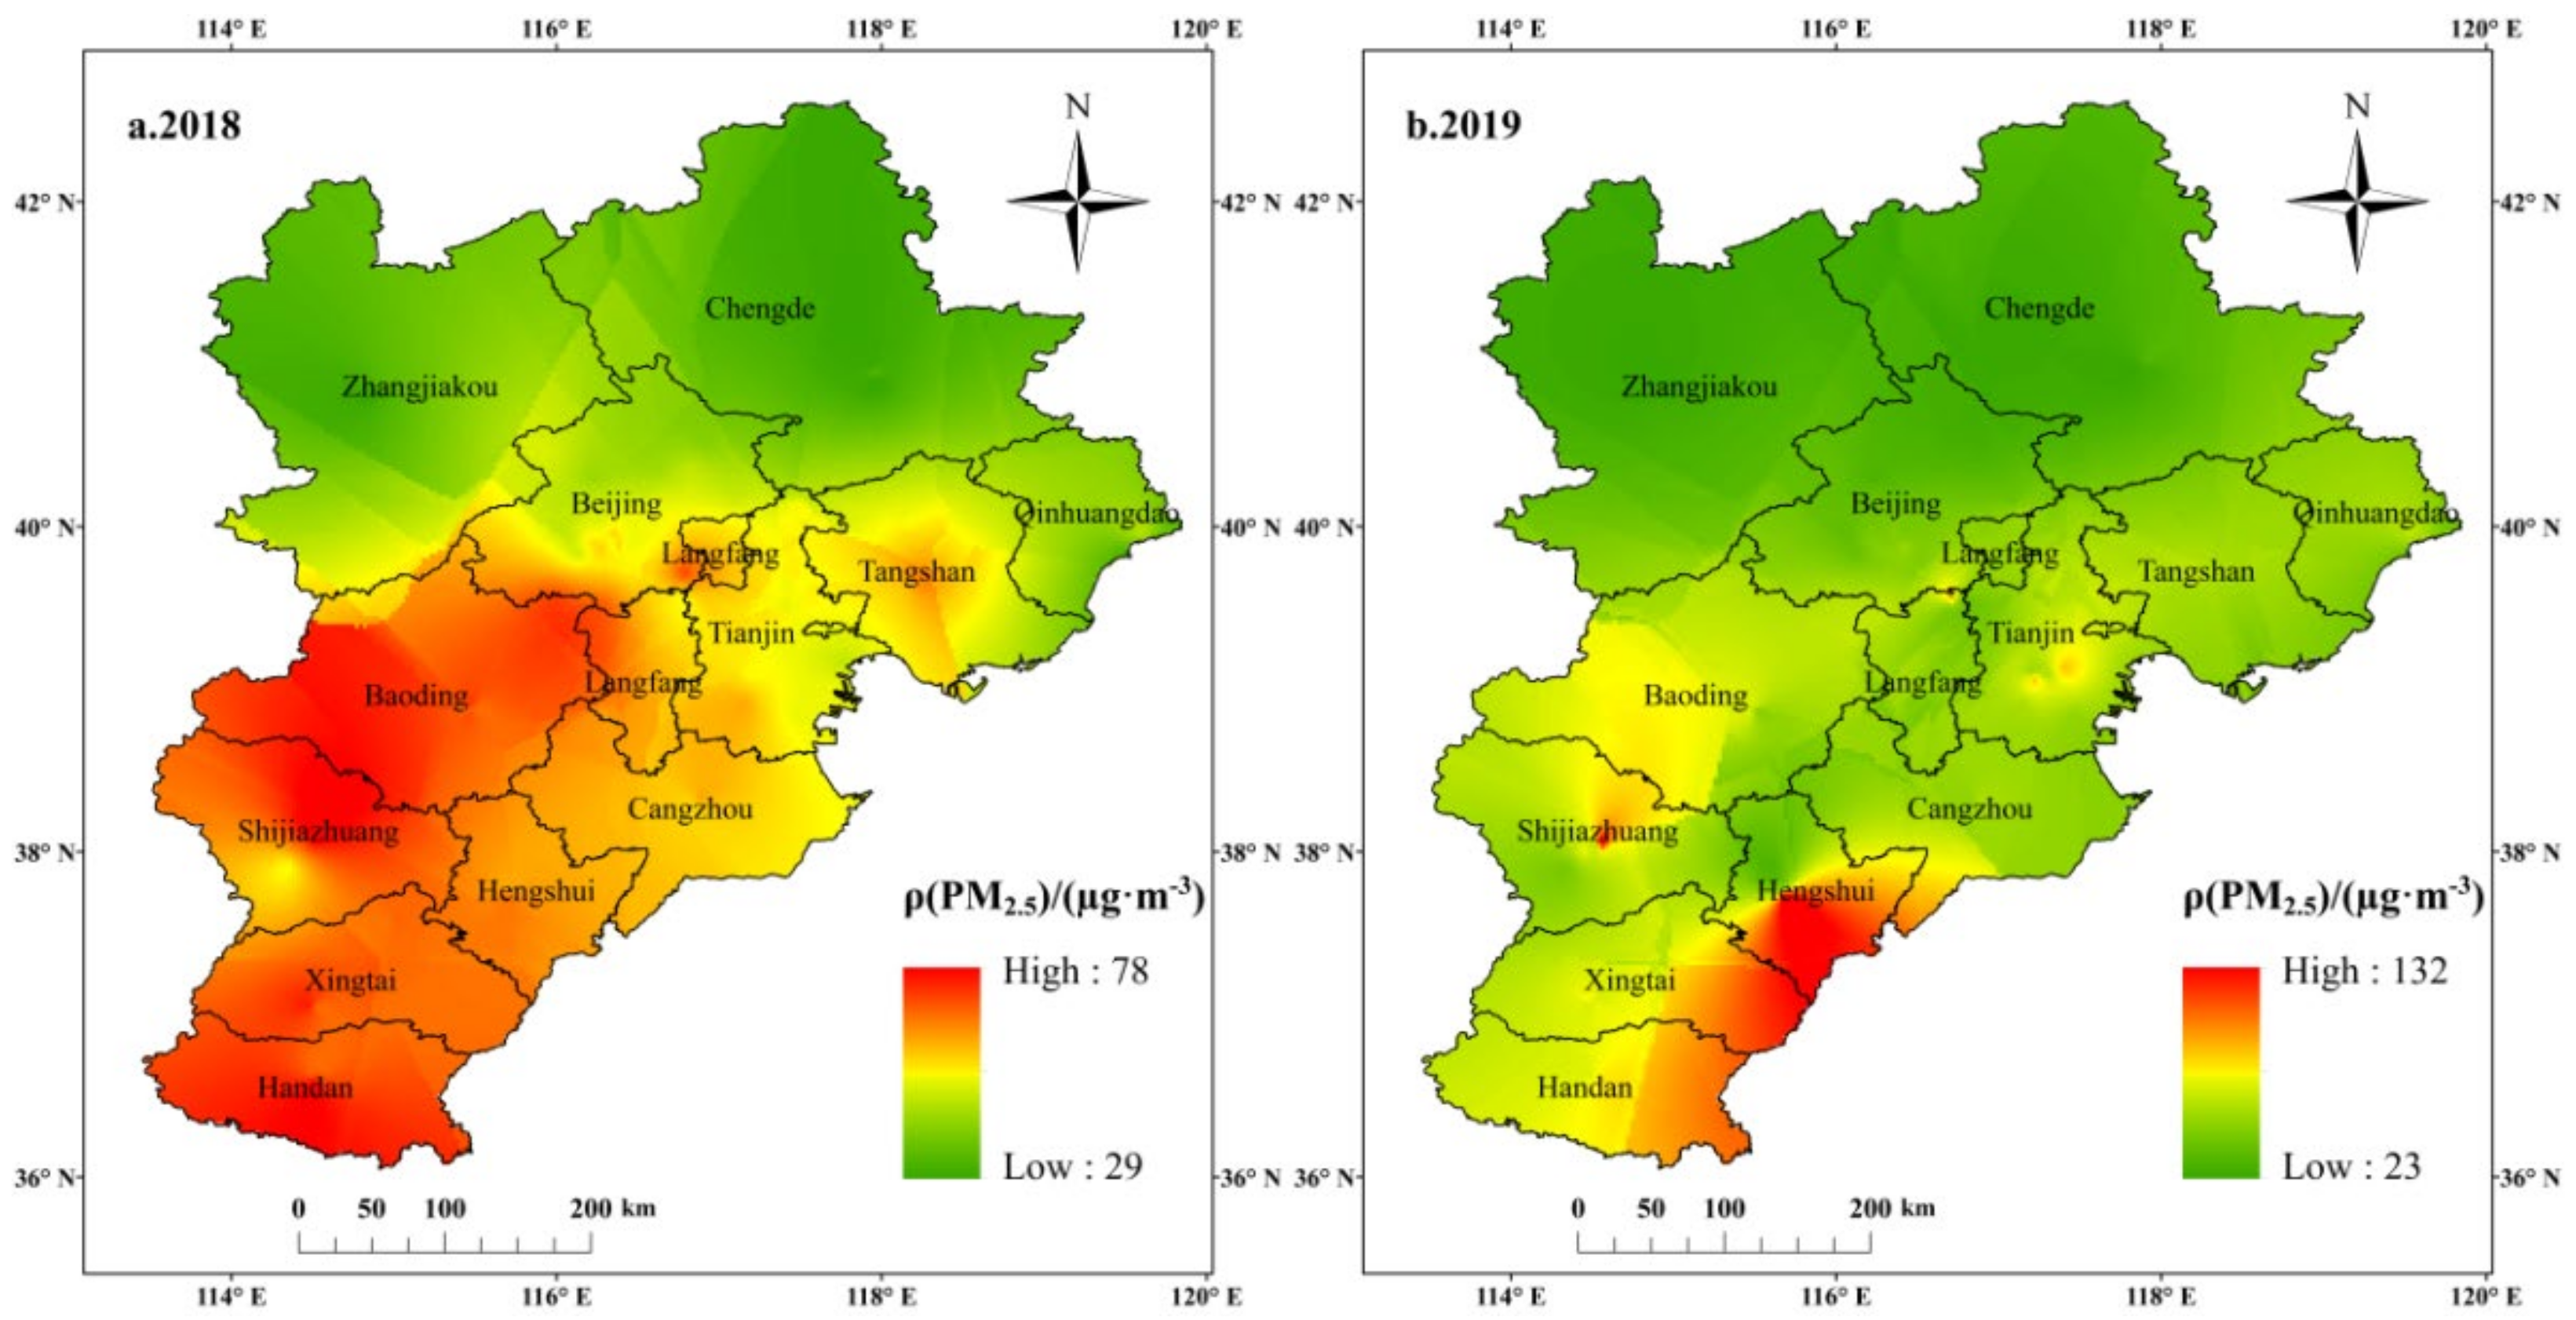
3.1.2. Spatial Variation of PM2.5

The seasonal spatial distribution of PM2.5 across the BTH is shown in Figure 6. Across all seasons, concentrations decreased gradually from south to north, ultimately resulting in significant differences between the two extremes. PM2.5 concentrations for each city were within the national second-level standards for the spring, summer, and autumn, with summer air quality generally being the best, owing to a reduction in anthropogenic emissions and biomass burning. Moreover, the photochemical reaction and atmospheric convection were strong enough to prevent the occurrence of temperature inversions, and autumnal rain weather is frequent in the summer. At the site-level, the PM2.5 concentrations were relatively higher in Beijing in the spring and summer. Overall, PM2.5 pollution was the most severe in winter, showing the spatial distribution characteristics of large-scale, contiguous pollution in the southern and central BTH. PM2.5 concentrations were within the national second-level standard only in the northern sections of the BTH, such as Zhangjiakou, Chengde, Beijing, Langfang, Tianjin, Tangshan, and Qinhuangdao, owing to airborne PM2.5 being unable to settle during to the cold and dry winters. Therefore, PM2.5 accumulated in the atmosphere, causing increasing concentrations. The south-central plain’s flat terrain is not conducive to air diffusion, and the booming industries of the economically developed region release abundant amounts of exhaust. As the suburbs maintained underdeveloped levels of industry, the gas emissions were relatively weak. Furthermore, the suburbs are also separated by mountains, forming a similar natural protective barrier and decreased pollution levels.
A kriging interpolation method was used to estimate the average annual PM2.5 concentrations across the entire BTH (Figure 7). The air quality of the northern plateau was significantly superior to that of the south-central plain area, in both 2018 and 2019. In 2018, the mean annual concentrations of PM2.5 reached their minimum in the north, <50 μg·m−3 in each of Zhangjiakou, Chengde, and Qinhuangdao. Mean annual concentrations in the southern and central locations—Handan, Xingtai, Hengshui, Shijiazhuang, and Baoding—ranged from 62–70 µg·m−3, with the most heavily polluted values reported in Handan. The mean annual concentrations in the southeastern part—Cangzhou, Langfang, and Tangshan—varied between 53–60 µg·m−3, and the measured concentrations in Beijing and Tianjin were 52 and 53 µg·m−3, respectively. With the exception of Zhangjiakou and Chengde, the mean annual concentrations of PM2.5 of the cities exceeded China’s national grade 2 criterion.
In 2019, the mean annual concentrations of PM2.5 reached their minimum in Beijing, the northern, and central parts—Zhangjiakou, Chengde, and Qinhuangdao—<50 µg·m−3. The mean annual concentrations in the southern and central parts—Handan, Xingtai, Hengshui, Shijiazhuang, and Baoding—ranged from 56–67 µg·m−3, with a similar maximum observed in Handan. Mean annual concentrations in the southeastern part—Cangzhou, Langfang, Tianjin, and Tangshan—were between 47–54 µg·m−3. Similar to 2018, all cities, except for Zhangjiakou and Chengde, exceeded China’s national grade 2 criterion. Overall, the mean annual concentration of PM2.5 decreased from 2018 to 2019 in the BTH, marking an improvement in air quality. Regionally, distributions of PM2.5 appeared closely related to topography, industrial structure, energy structure, economic development, and climatic conditions. The high value range distribution area was mainly clustered in the southern plain area, while the low value range was mainly distributed in the cities in the northern Taihang Mountains. This spatial pattern was primarily due to the fact that the southern cities were dominated by heavy industry, which generated industrial waste gas and a large amount of dust near construction sites, resulting in high PM2.5 concentrations. At the same time, the road network was dense, the traffic flow was large, and the air was blocked by the western mountains, making it difficult to circulate, leading to the accumulation of pollutants. The Beijing-Tianjin-Hebei region forms a C-shaped encircling mountain group, which facilitates the downward transfer of fine particulate matter for coalescence, exacerbating fine particulate matter pollution in southern cities. The low concentration area is formed by the Taihang Mountain System and the Yanshan Mountain System to form the Yan-Tai screen, and the air pollution is isolated by the Yanshan and Taihang Mountain Systems. In addition, the mountainous cities are relatively backward in industrial development, with less anthropogenic pollutant emissions, so they are less affected by fine particulate matter.

3.2. Fractional Vegetation Cover and PM2.5

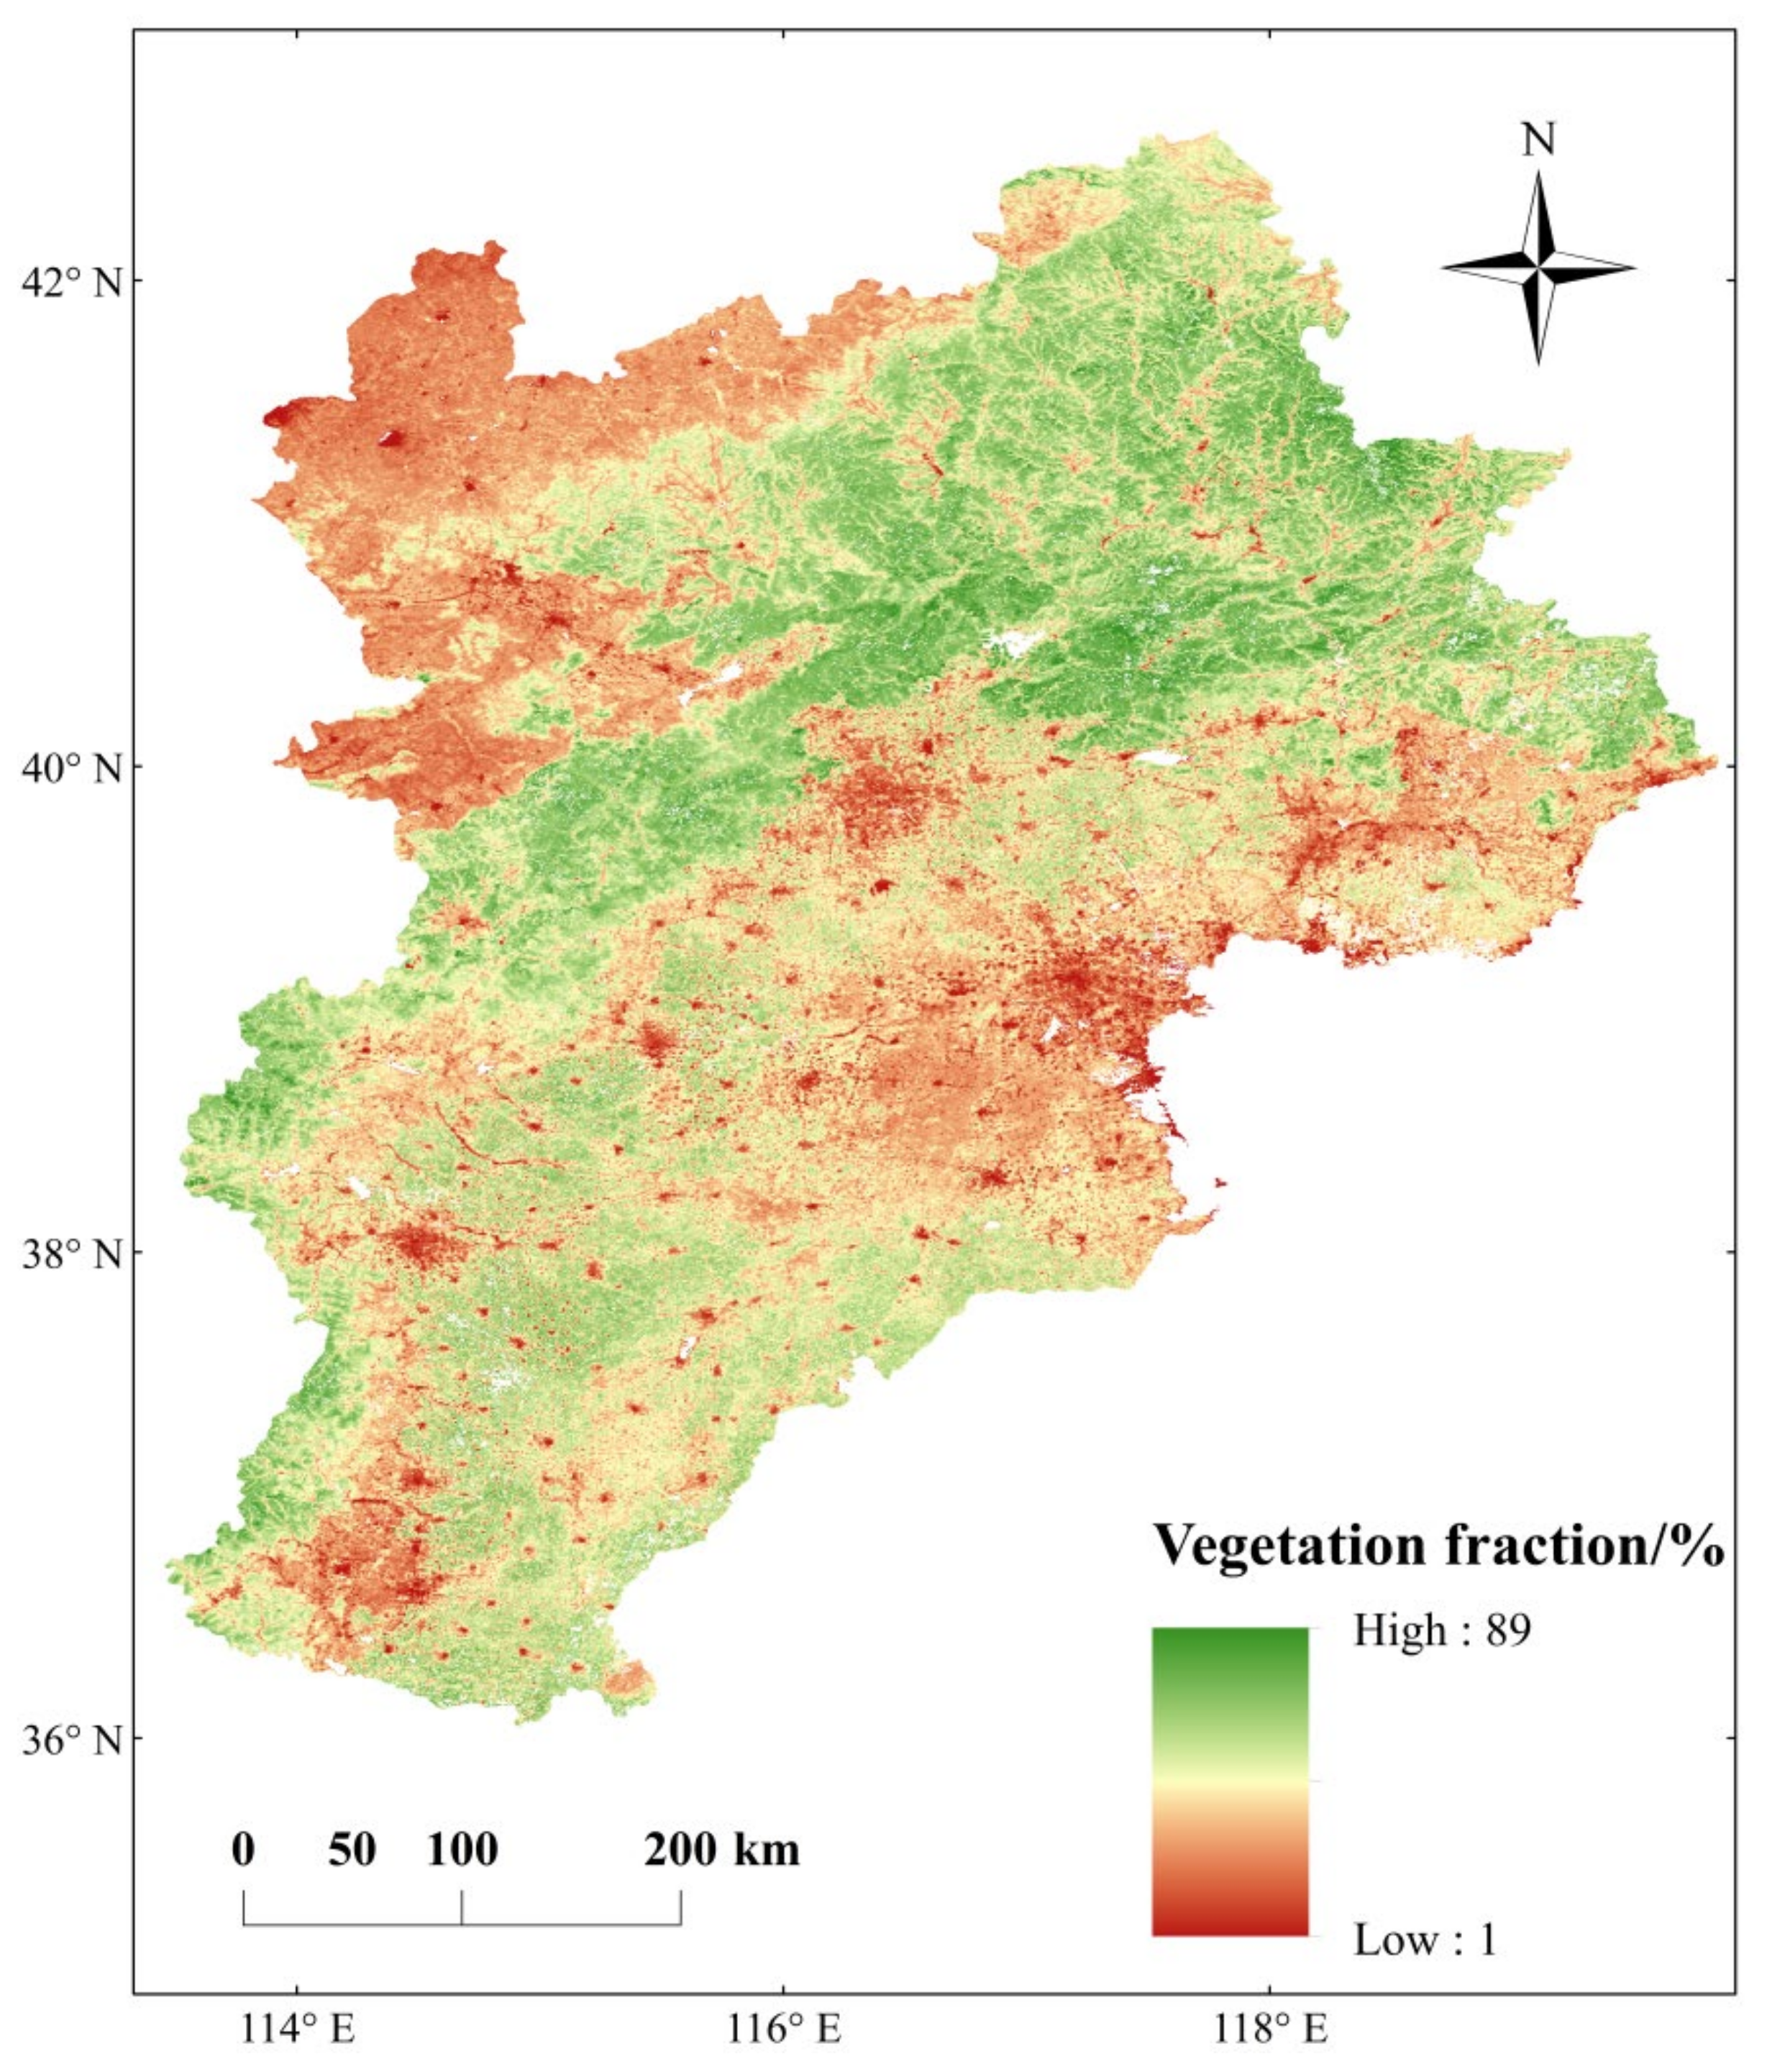
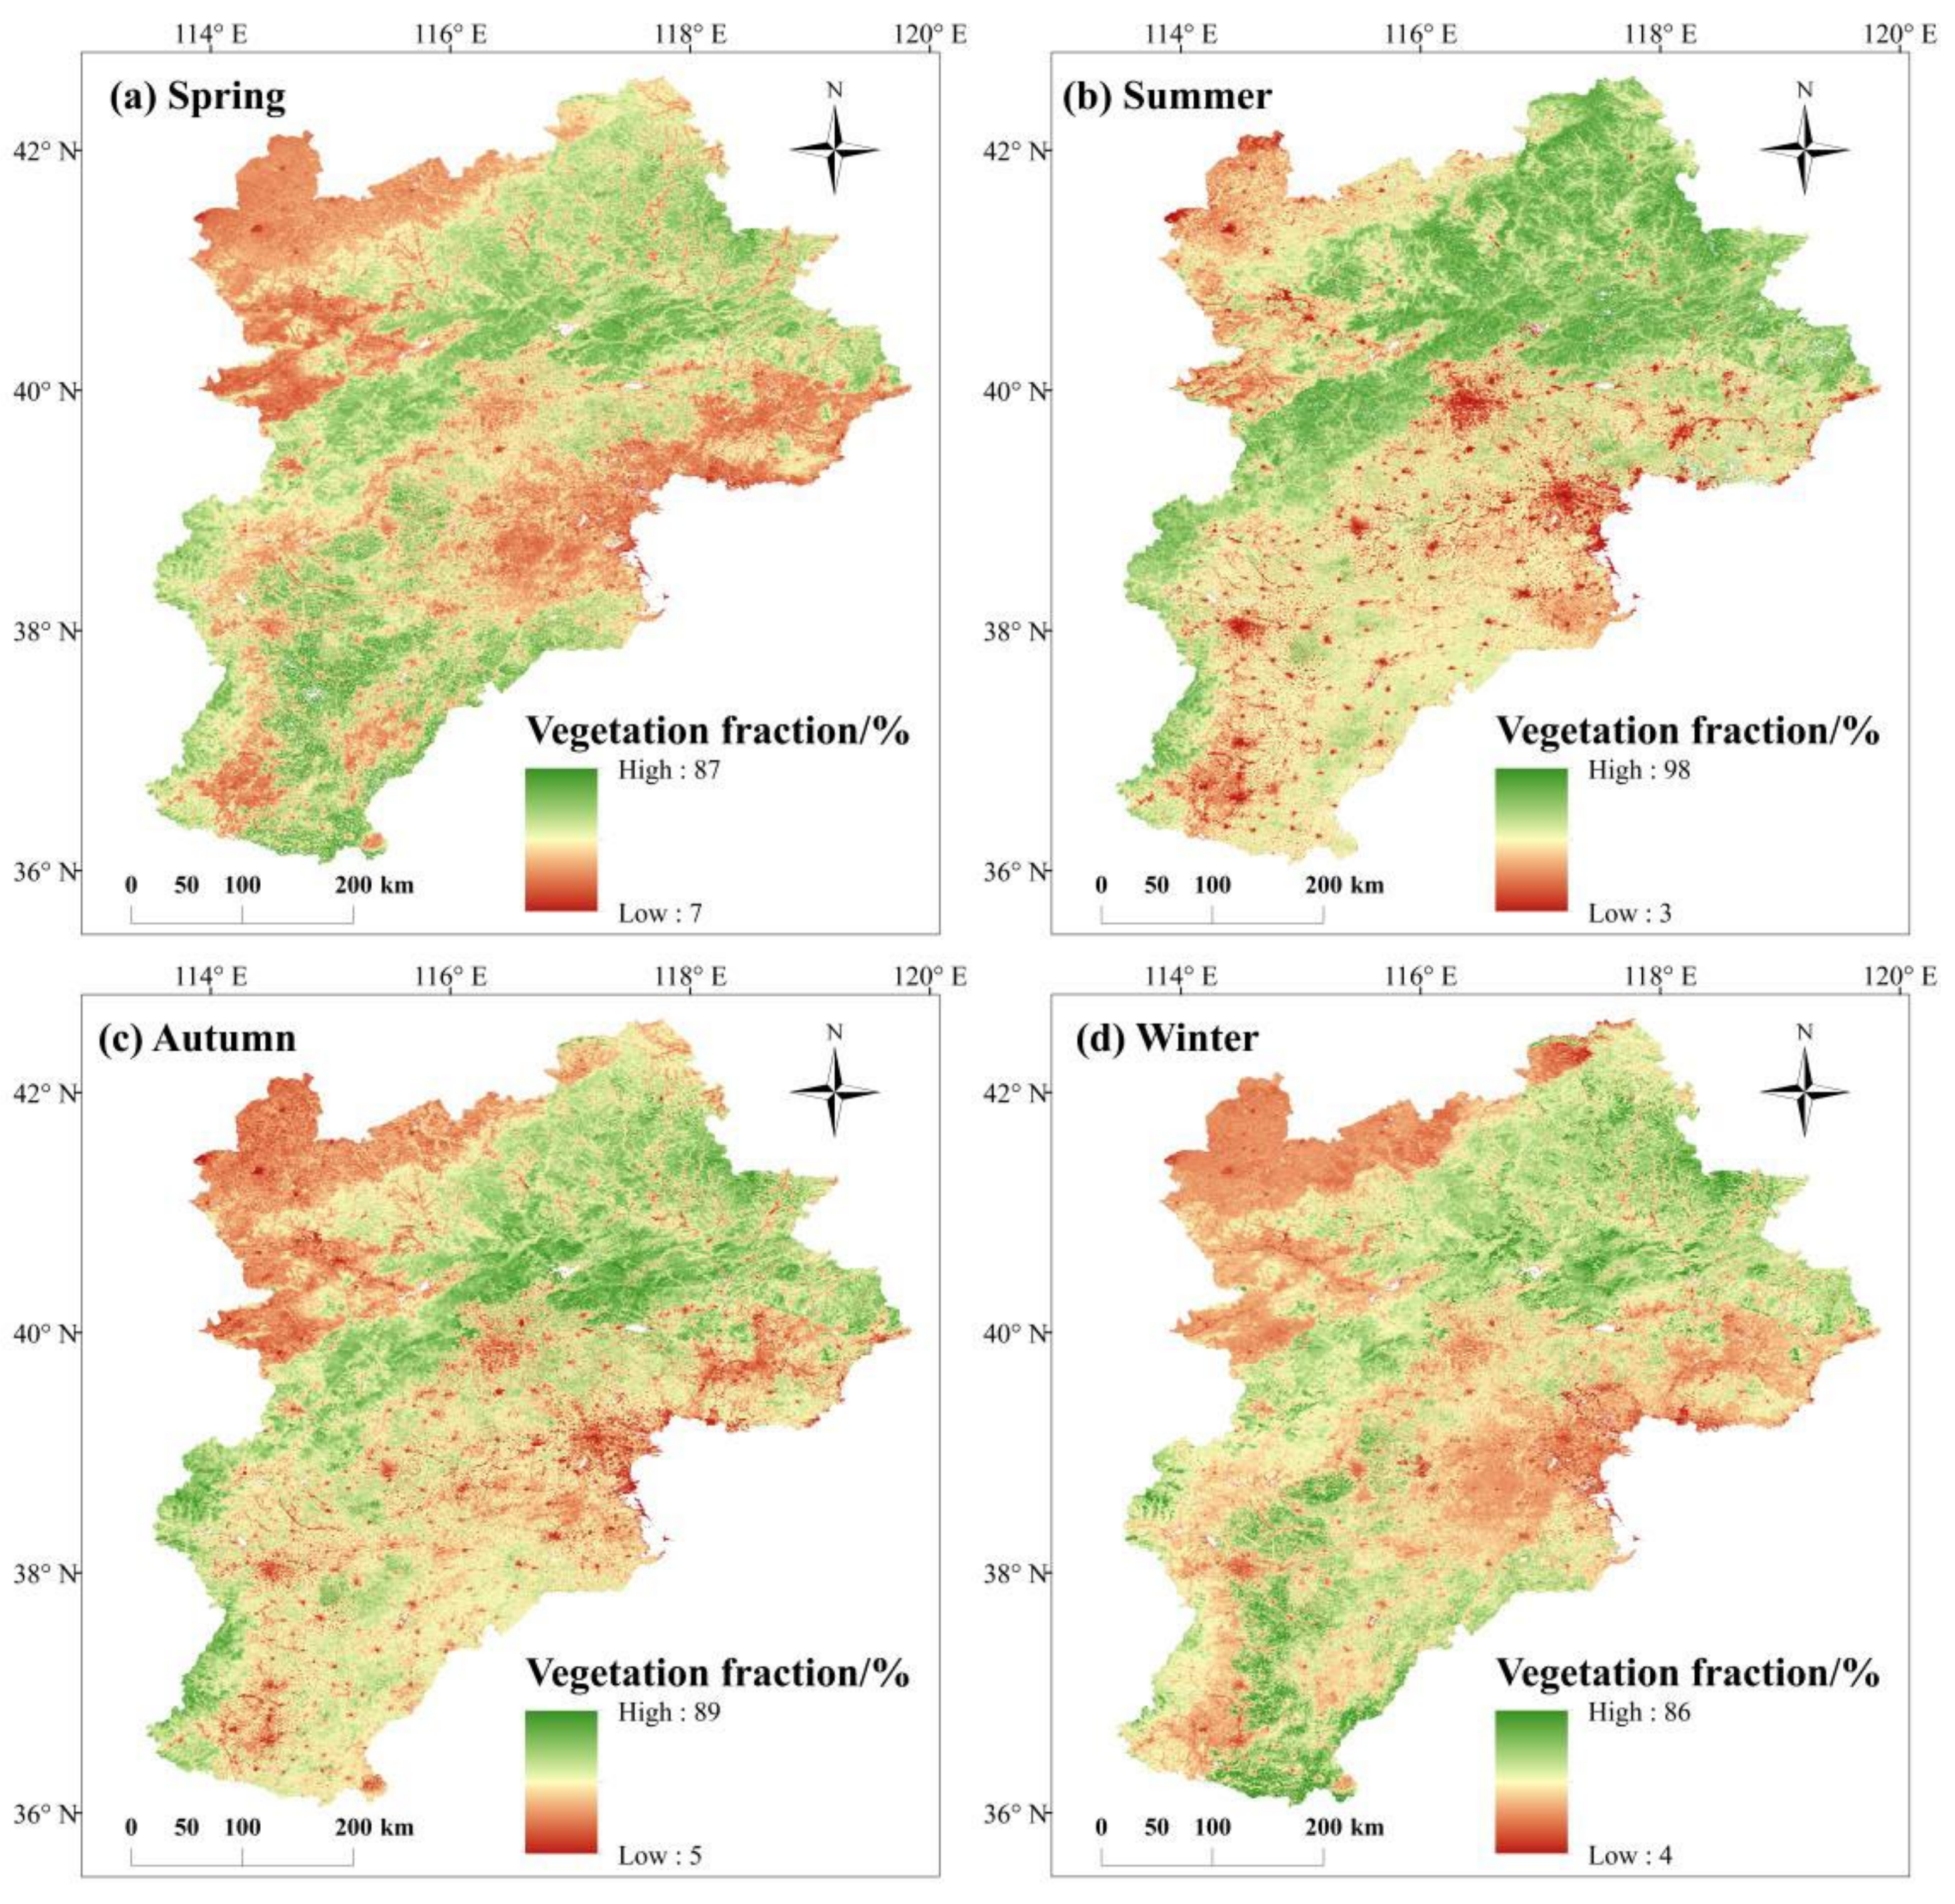
3.2.1. Vegetation Coverage in the Beijing-Tianjin-Hebei Region

The spatial distribution of FVC in the BTH varied significantly, owing largely to geographic location and climatic conditions (Figure 8). Overall, vegetation cover increased from the southeast to northwest, where the landforms were dominated by mountains. Natural conditions, such as topography, limited man-made development in the area; therefore, the vegetation was in good condition and formed a natural protection barrier. Forested ecosystems are distributed mostly in the northern and northwestern regions, including Chengde, Beijing, Qinhuangdao, and Baoding, maintaining relatively high FVC levels throughout the year. Minimum FVC areas were mainly distributed in the southeastern plains and the northern part of Zhangjiakou, where the land use type is predominantly agriculture, with frequent farming activities and shorter crop growing periods than trees. Abandonment and autumnal phenomenon are also more common in these regions. Coupled with the effects of urbanization, the vegetation cover was relatively low.
Figure 9 shows the spatial distribution of the mean vegetation cover in the Beijing-Tianjin-Hebei region, across four seasons, from which it can be seen that the vegetation cover was better in summer and worse in winter. This was primarily due to the high vegetation cover in summer, when the vegetation growth was at its peak. In contrast, the chlorophyll content of trees decreased in winter, resulting in a gradual decrease in vegetation cover. It can also be seen from the figure that the high vegetation cover areas were mainly concentrated in the northern areas of Beijing-Tianjin-Hebei region, such as Chengde. The low vegetation cover area was mainly concentrated in the southeast region. This was basically consistent with the spatial distribution of the annual average concentration of vegetation cover. The spatial distribution of seasonal mean PM2.5 concentrations was also compared with that of BTH, and it was found that the change trends of the two were exactly opposite. The PM2.5 concentration was lower in areas with high vegetation cover, while it was relatively higher in areas with low vegetation cover. This further confirmed the inhibitory effect of high vegetation cover on PM2.5 pollution and provided a theoretical basis for future PM2.5 pollution management in the Beijing-Tianjin-Hebei region.
The 16-day average FVC values of the BTH in 2018 and 2019 showed wave-shaped distributions (Figure 10). The growing season, from March to November, was marked by a gradual increase, until its first peak at the beginning of May. A central high FVC (>0.6) appeared in June and ended at the close of September. FVC reached its peak value in August (2018, 0.81; 2019, 0.79). The chlorophyll content of trees progressively decreased after October, with the corresponding FVC also gradually decreasing. Thus, changes related to the vegetation growing season drove the seasonal changes in FVC. Overall, the FVC peaked in the summer, and reached a winter minimum. Annually, the FVC of the BTH remained almost stationary from 2018 to 2019. Ultimately, vegetation management and protection work should be strengthened, and efficient planting and logging systems should be developed in light of the FVC patterns in the BTH revealed here.

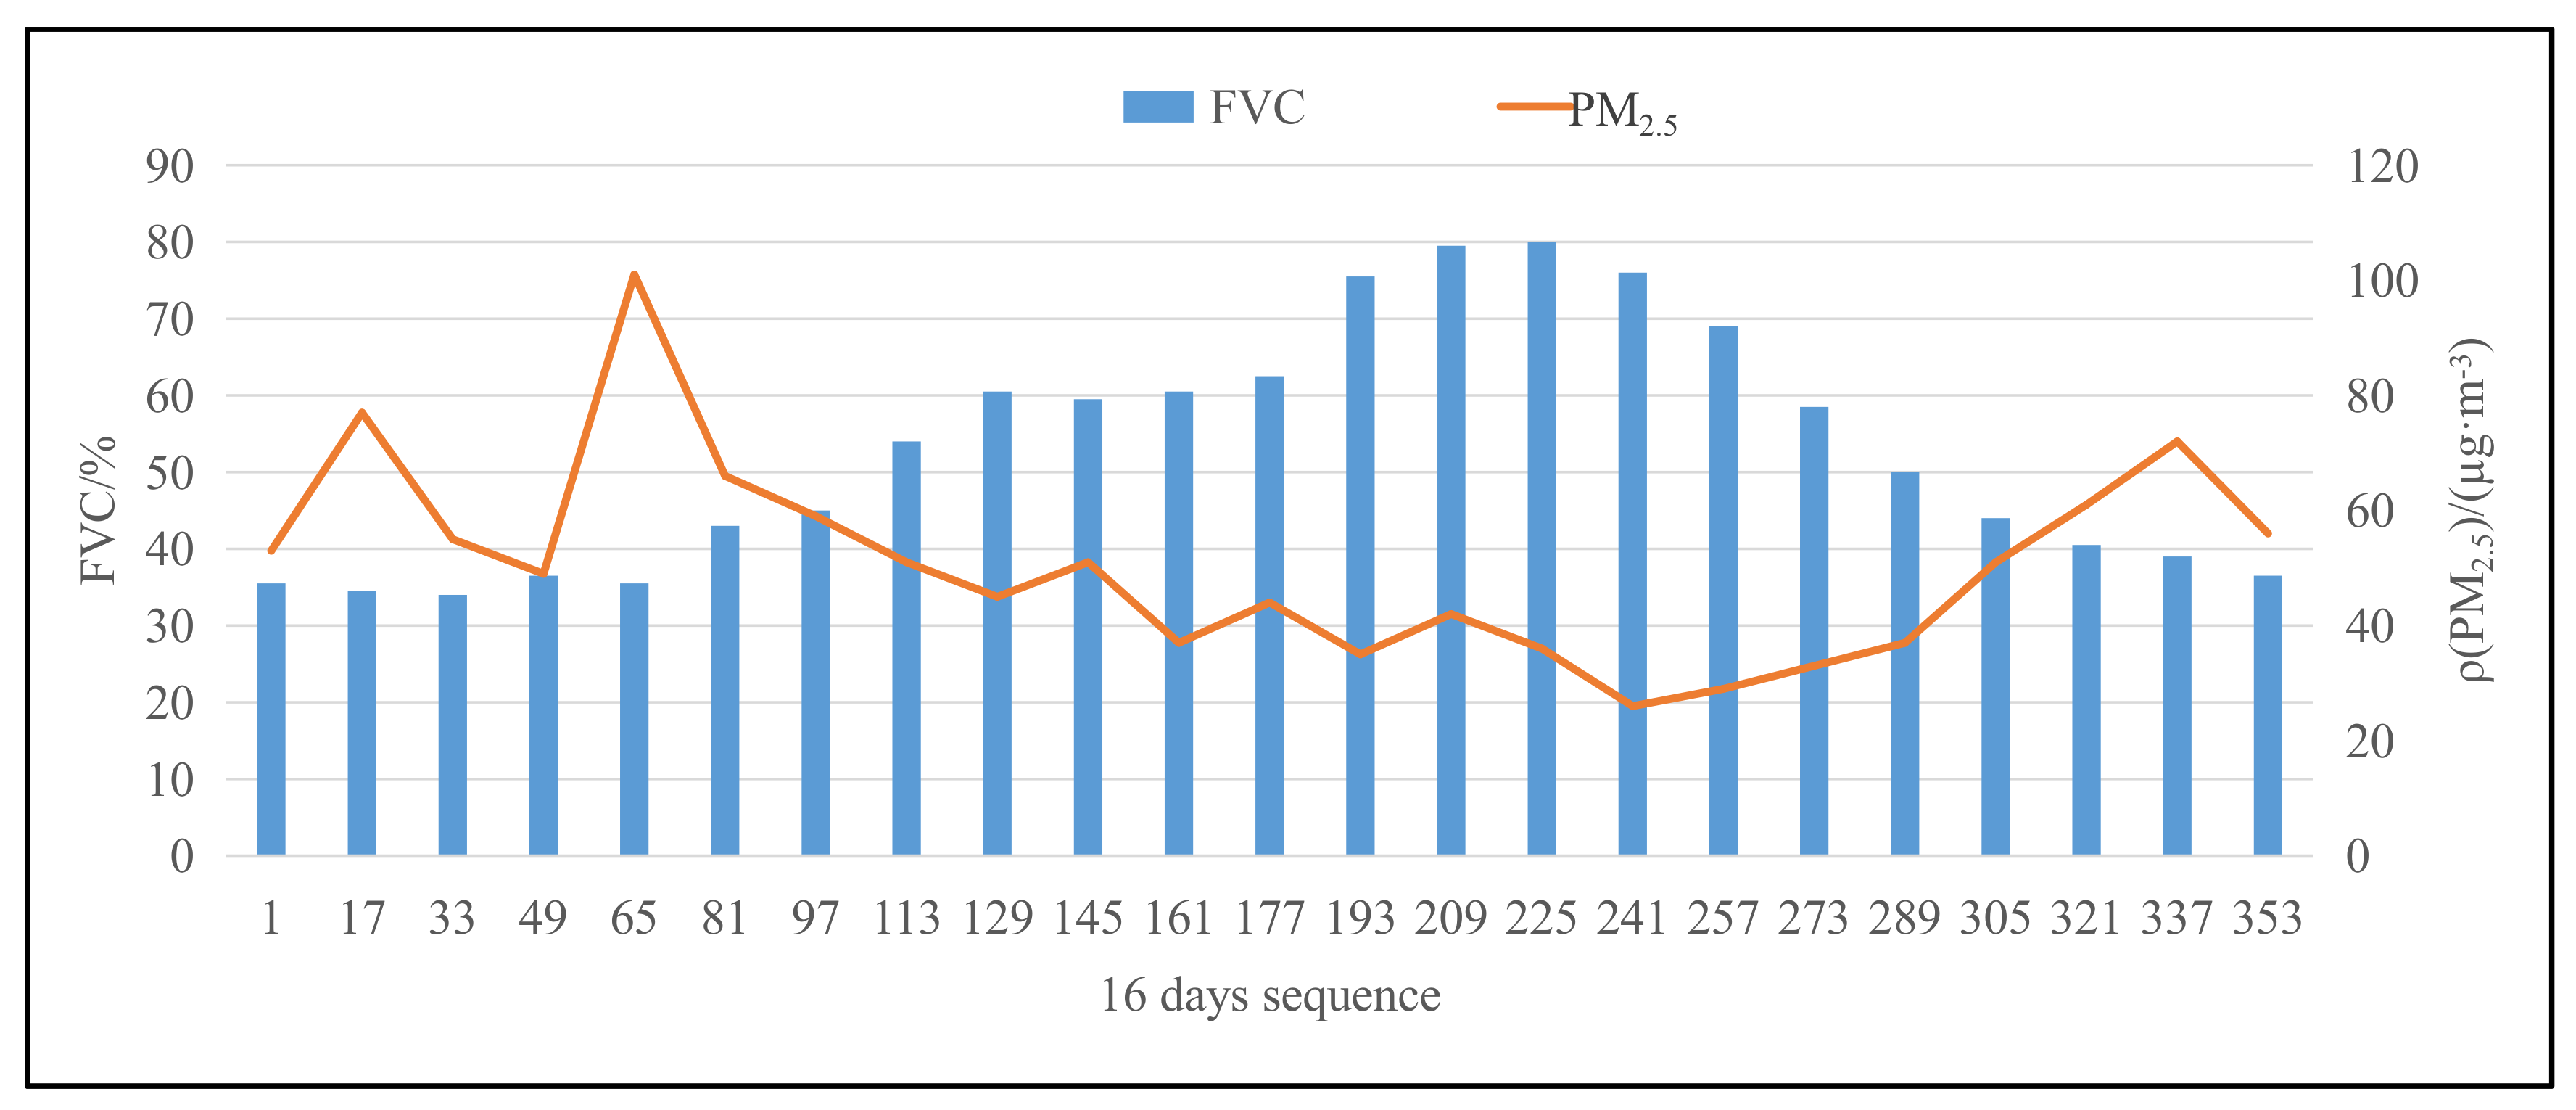
3.2.2. Correlation Analysis

The PM2.5 mass concentration was closely related to FVC over the BTH. Plants can fix a part of the atmospheric particulate matter through the waxy layer on the leaf surface, and additional adsorption is possible for leaves containing a large number of tomentose hairs; however, different FVC values maintain different PM-retention abilities [50].
The results of the rank correlation analysis, between the 2018–2019 seasonal PM2.5 concentrations and FVC for the BTH, can be seen in Table 1, and indicate a strong negative correlation among the seasons: the correlations of winter > autumn > summer > spring. Thus, the winter decrease in FVC across the BTH significantly reduced the vegetational retention ability of PM2.5. Across the entire year, the Spearman rank correlation coefficient was −0.346, supporting the significant negative correlation (α = 0.01).
Vegetation had an apparent scavenging effect on PM2.5, where opposite trend of FVC with PM2.5 was the strongest in summer and winter (Figure 11). When the BTH was under moderate vegetation cover (0.3 ≤ FVC ≤ 0.6), PM2.5 mass concentrations were between 33–101 µg·m−3; whereas under high vegetation cover (FVC > 0.6), PM2.5 concentrations were between 26–45 µg·m−3.

4. Conclusions

Research on the 2018–2019 PM2.5 concentrations and fractional vegetation cover over the Beijing-Tianjin-Hebei region revealed the following conclusions:
(1)
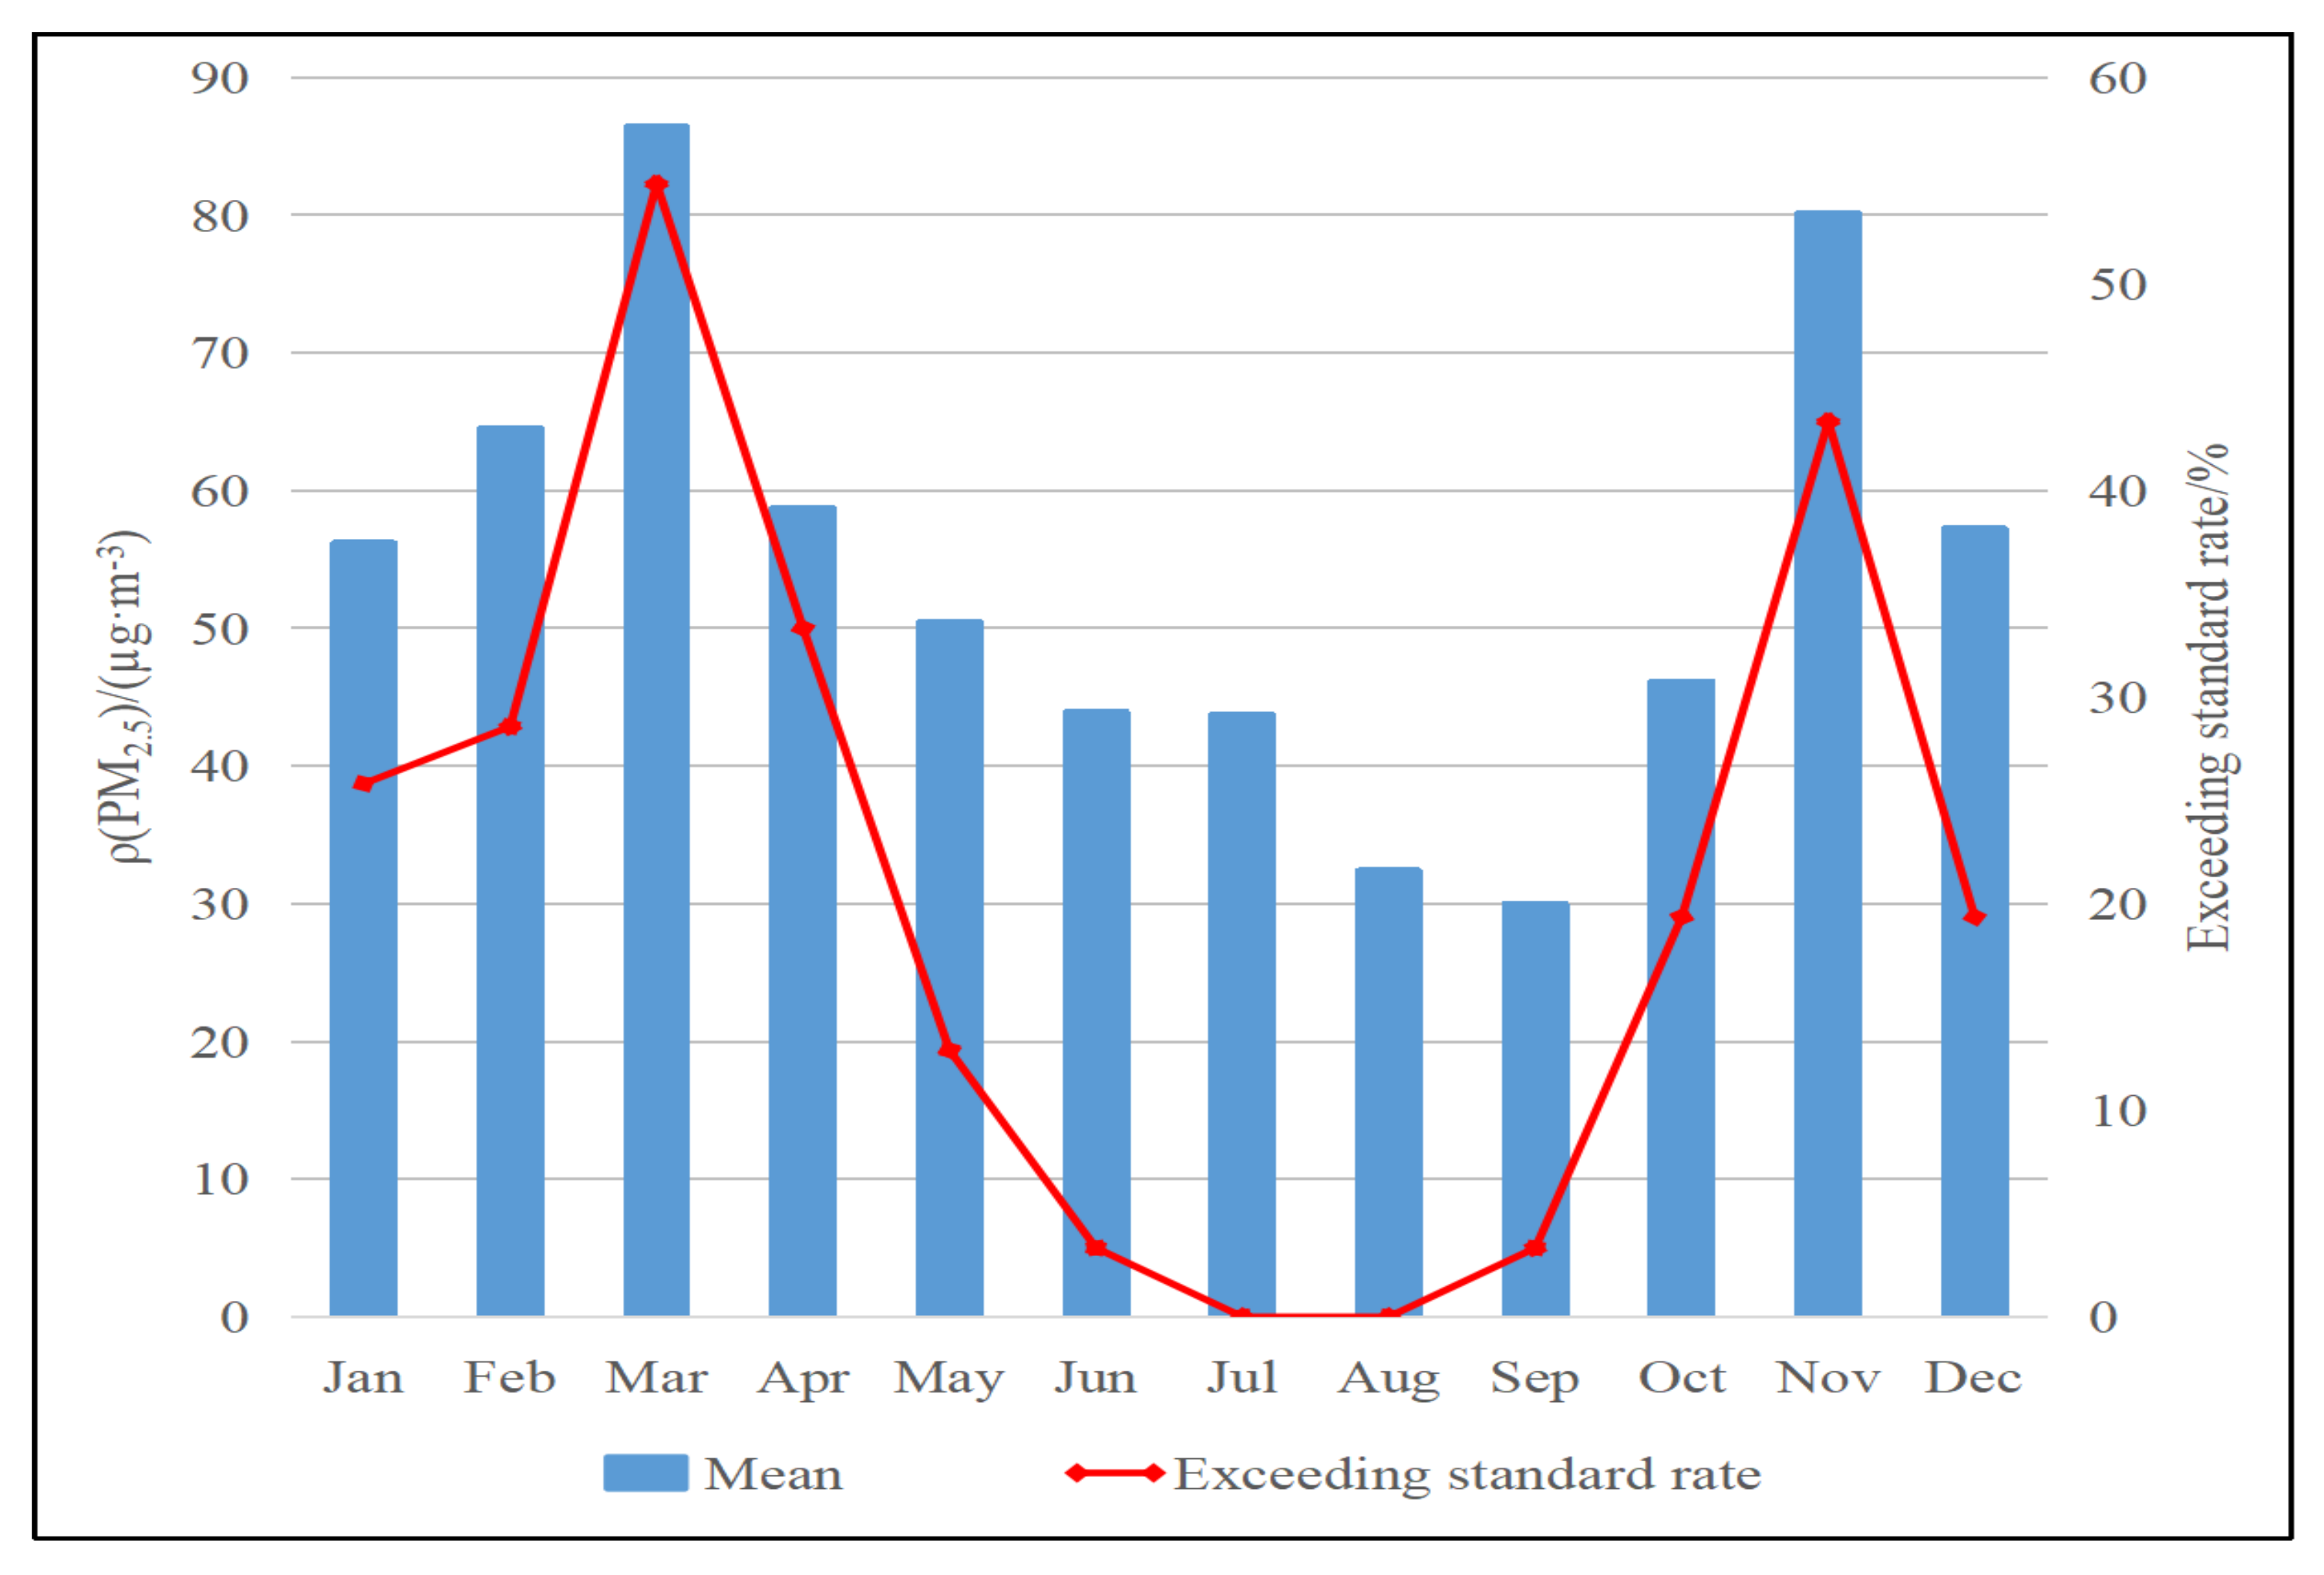
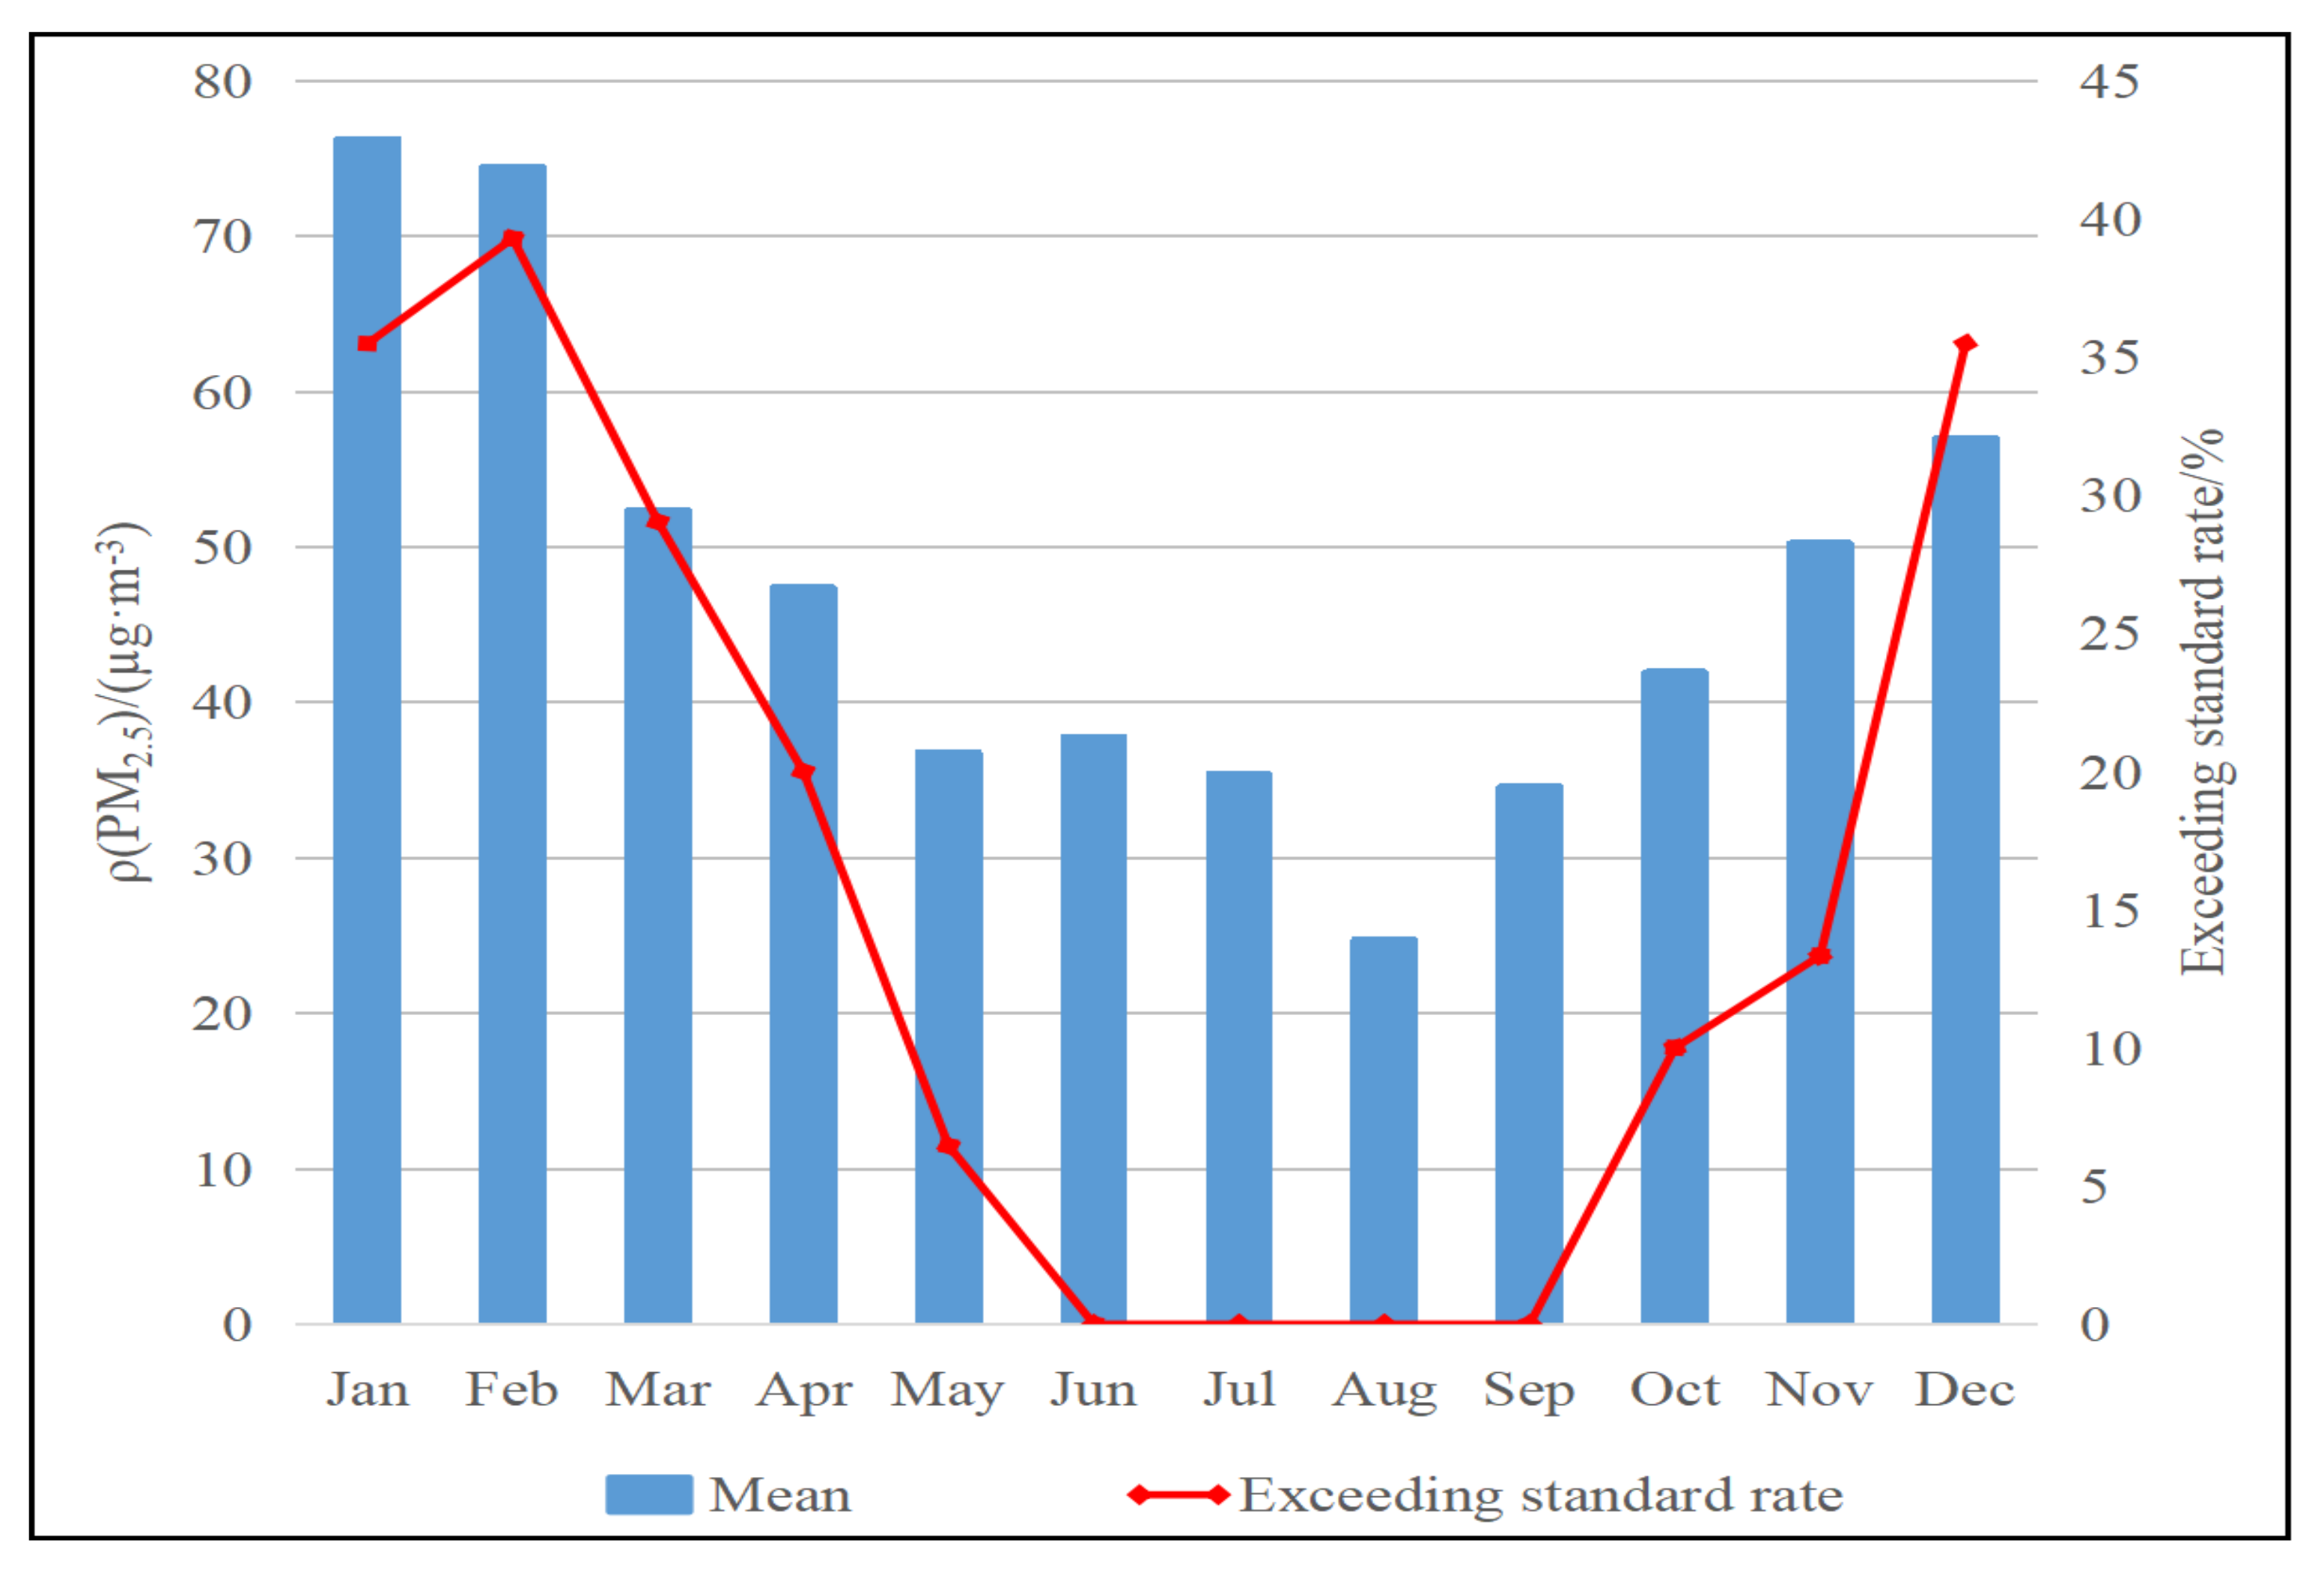
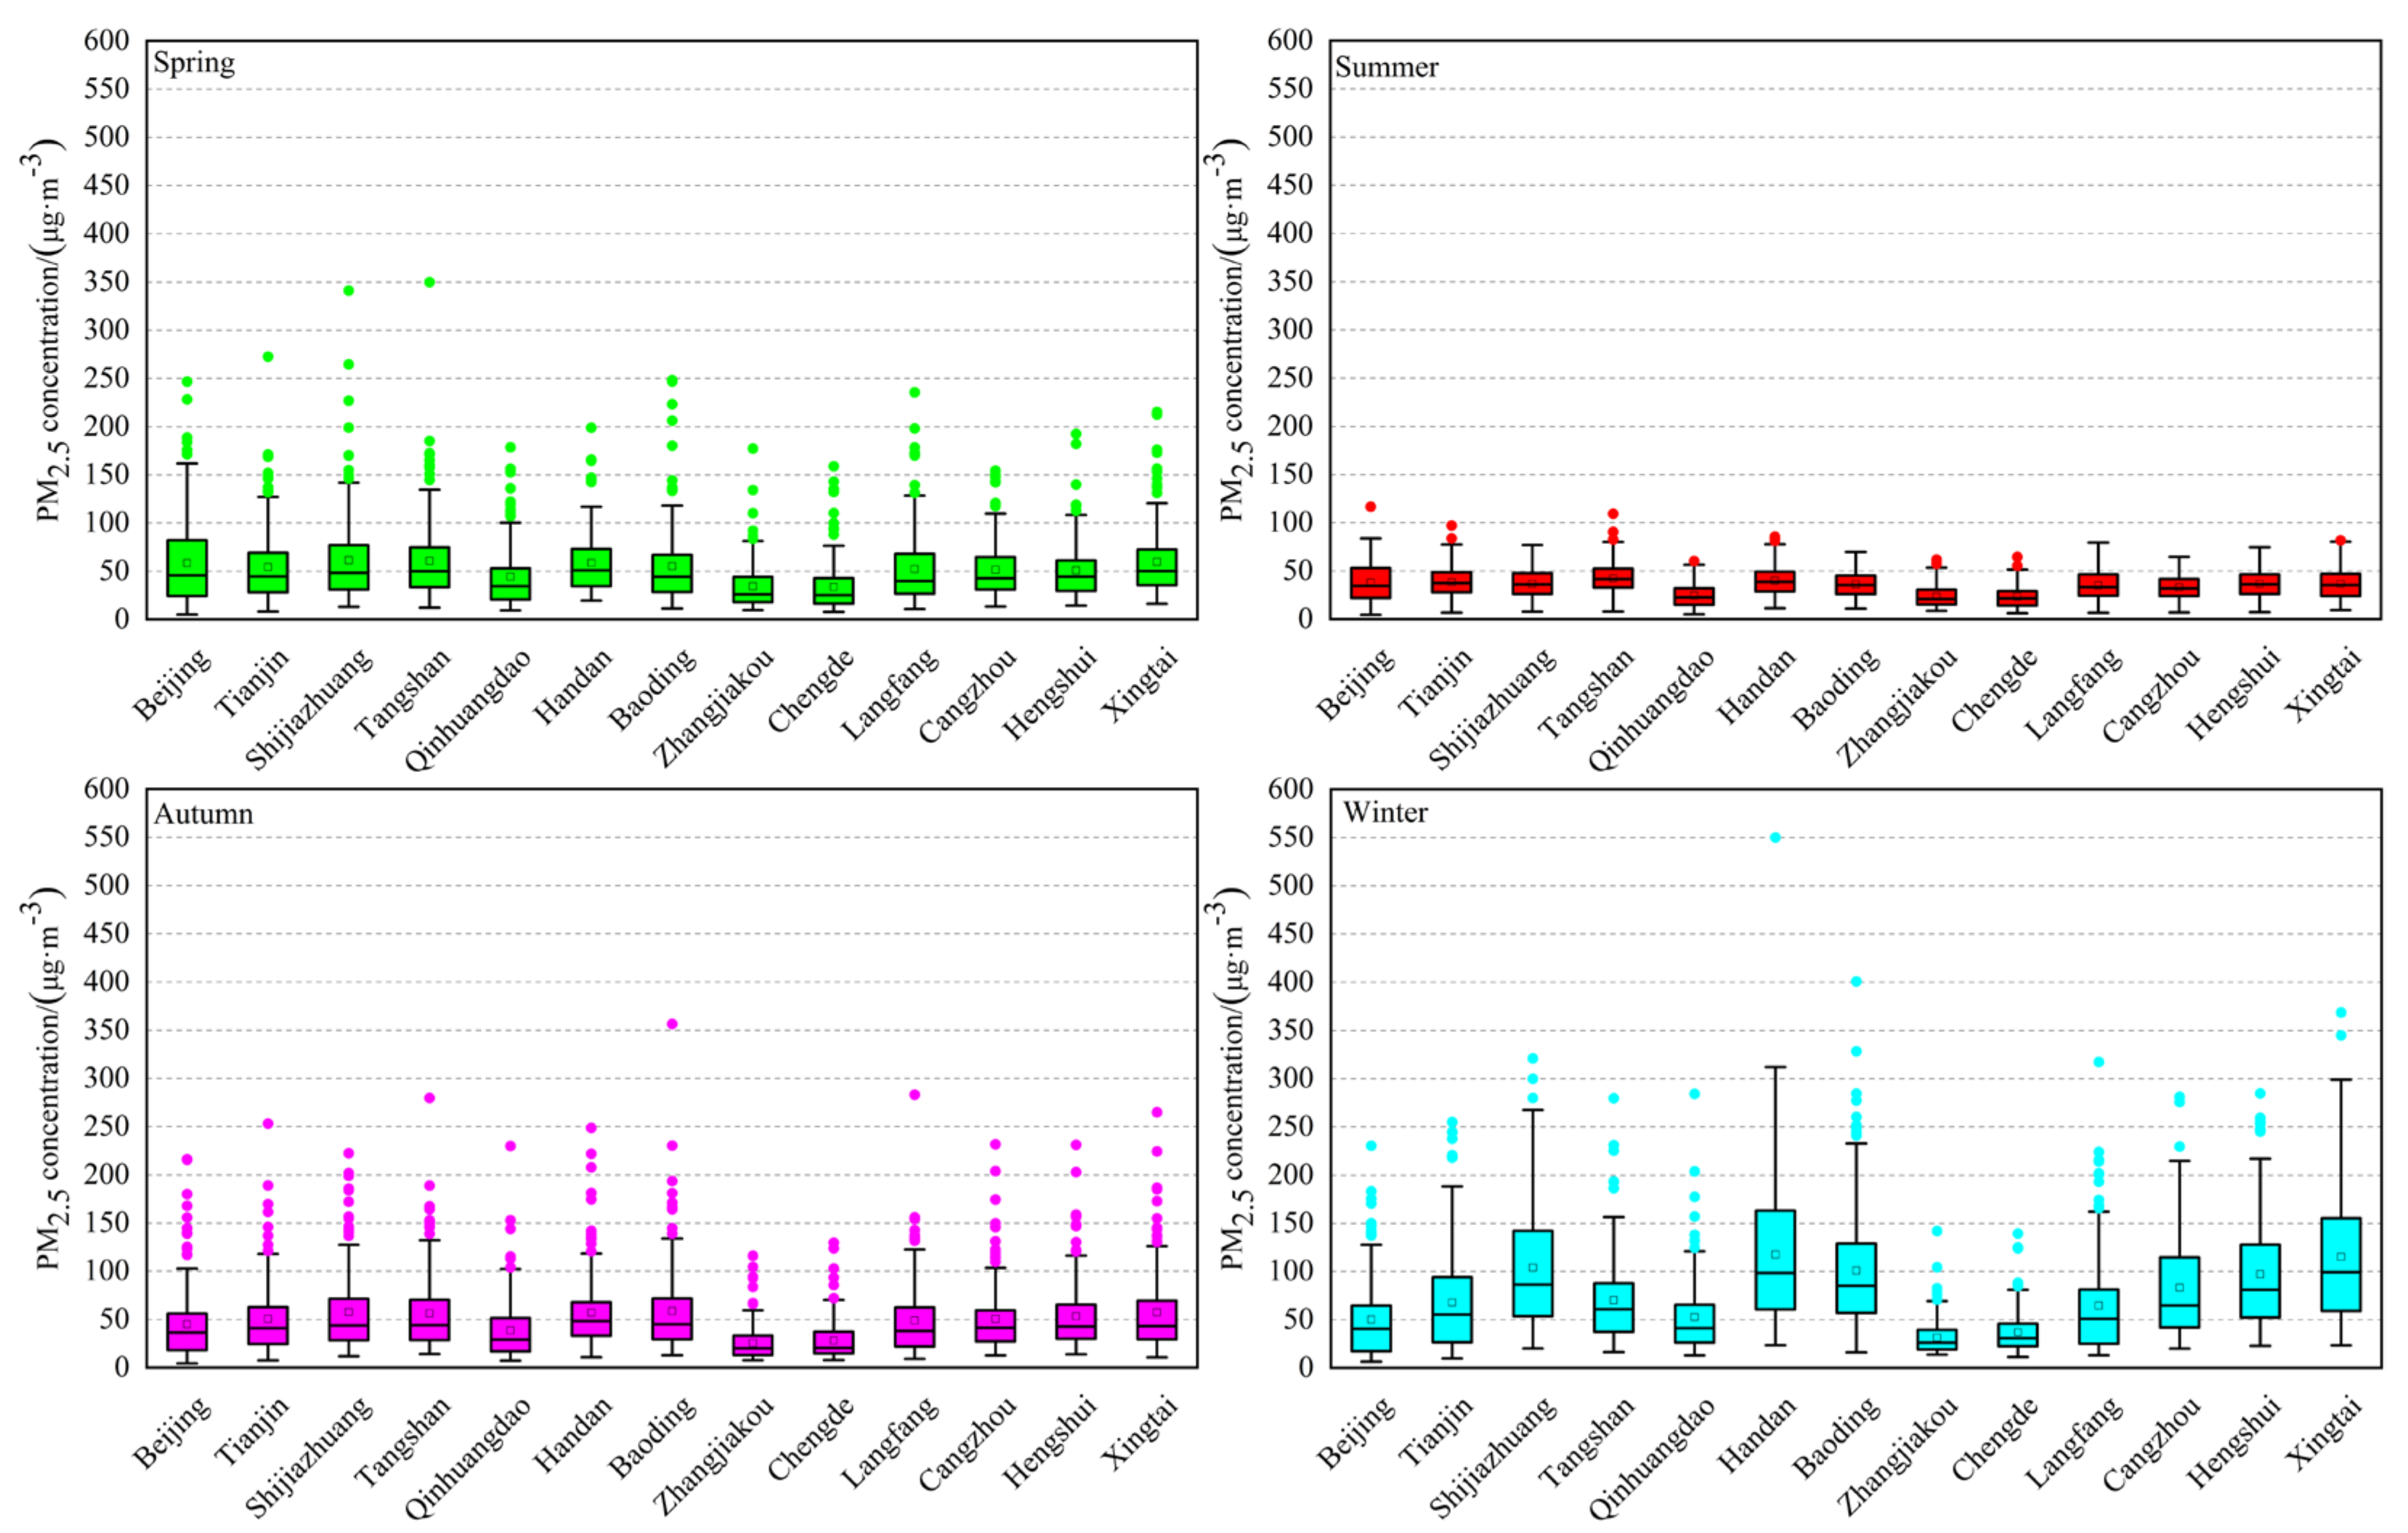
Seasonal patterns of PM2.5 concentrations were obvious over the BTH, with a maximum and minimum observed in the winter and summer, respectively. The PM2.5 mass concentrations of spring and autumn were similar. The monthly mean PM2.5 concentrations were roughly distributed in a U-shape, where 2018 levels peaked in March and reached a minimum in September, and 2019 levels peaked in January and reached a minimum in August.
(2)
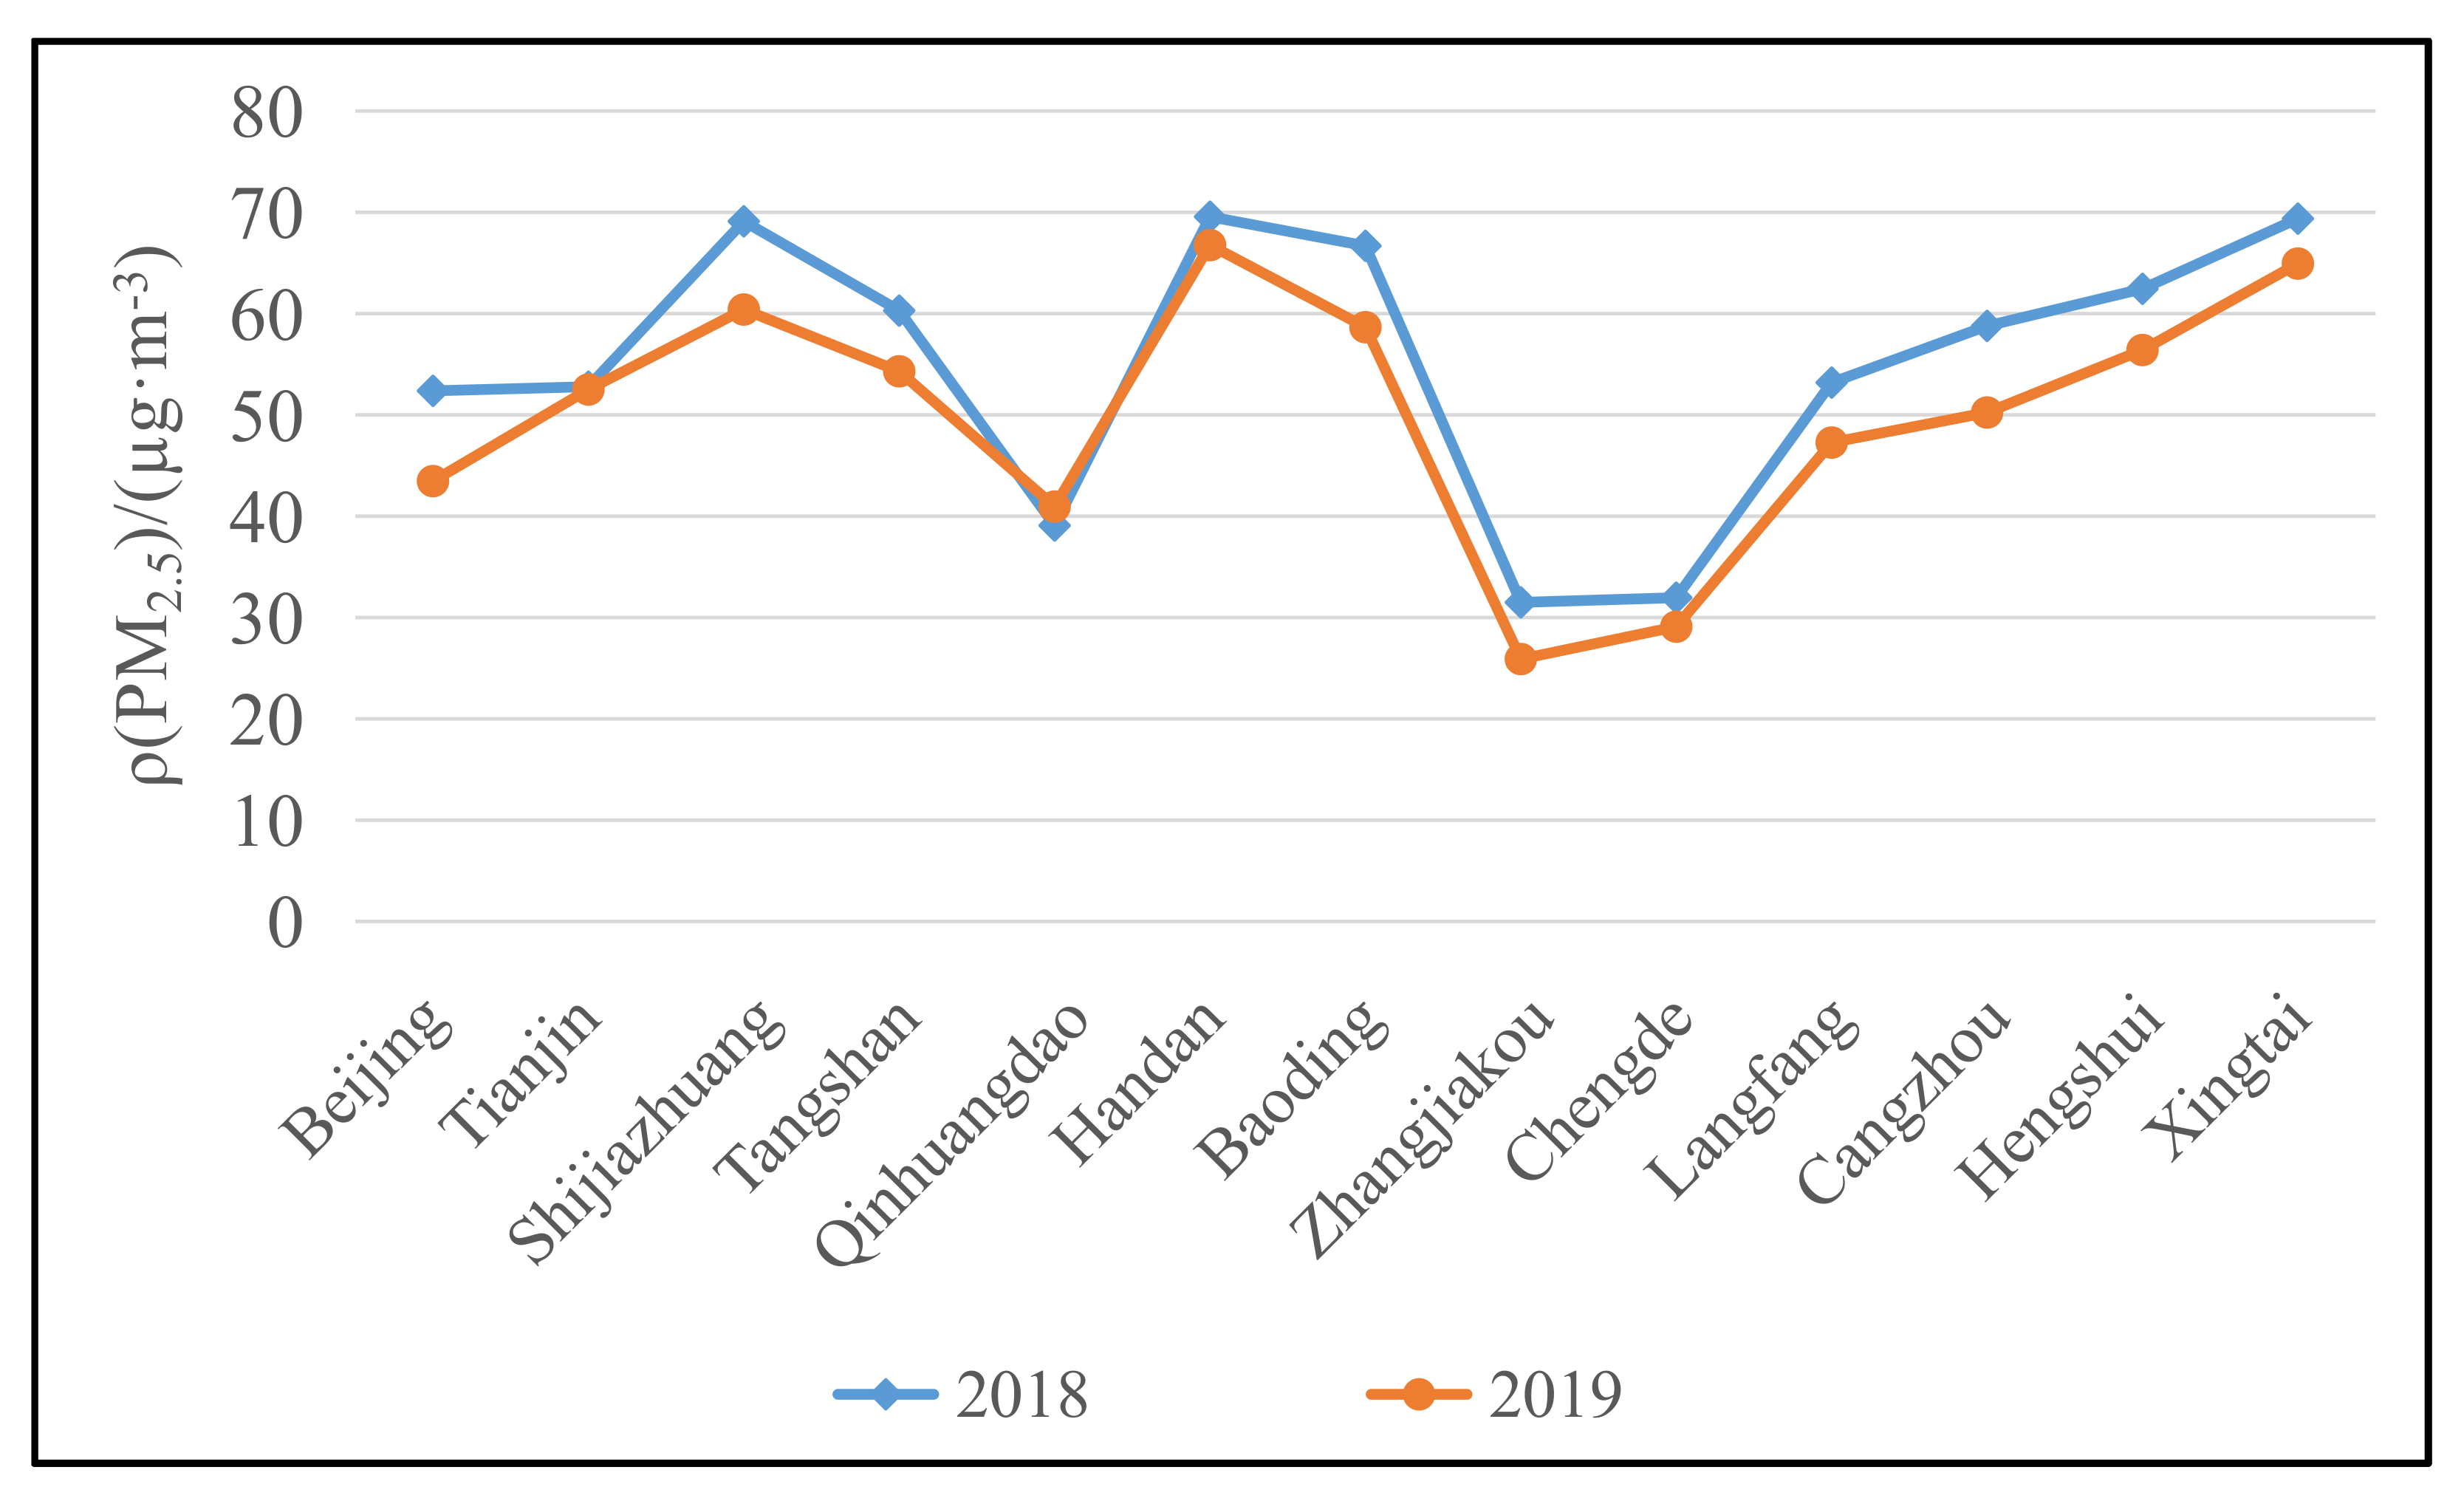
Spatially, the distribution of PM2.5 concentrations differed significantly across the BTH, with low values in the north and high values in the south. The north represented the lowest PM2.5-polluted region, with the majority of excellent weather; whereas the southern region suffered from severe PM2.5 pollution levels and showed a concentrated and continuous distribution trend. The contamination range was the widest during the boreal winter.
(3)
Overall, PM2.5 concentrations were negatively correlated with FVC in the BTH, with the strongest correlation observed during the winter. As the present study aimed to explore the relationship between FVC and the mass concentration of PM2.5 in the BTH, future studies should incorporate meteorological factors, such as humidity, wind speed and rainfall, for a more comprehensive understanding.
The author suggests that the ability of urban green spaces to mitigate PM2.5 pollution in the Beijing-Tianjin-Hebei region can be improved in the future by controlling the vegetation coverage of urban green spaces to a suitable extent, especially in winter. Future studies should use vegetation cover in combination with other information, such as ground-based meteorological data and aerosol indices. Long-term continuous monitoring data are used to further analyze the processes and mechanisms of the changes and to improve the accuracy of monitoring changes in PM2.5 spatial distribution.

Author Contributions

Conceptualization, J.J. and S.L.; methodology, J.J. and W.Z.; software, J.J.; validation, L.W.; formal analysis, S.W.; investigation, J.J., S.L., L.W. and S.W.; resources, J.J.; data curation, J.J. and L.W.; writing—original draft preparation, J.J.; writing—review and editing, J.J. and W.Z.; visualization, J.J.; supervision, W.Z.; funding acquisition, J.J. and W.Z. All authors have read and agreed to the published version of the manuscript.

Funding

This research was funded by the National Key R&D Program of China (Grant Number 2018YFC0706004, 2018YFC0706000) and the National Natural Science Foundation of China (Grant Number 42071422).

Institutional Review Board Statement

Not applicable.

Informed Consent Statement

Not applicable.

Data Availability Statement

Not applicable.

Acknowledgments

We would like to thank the Beijing Municipal Environmental Protection Monitoring Center and the National Air Quality Real-time Publishing Platform of the China National Environmental Monitoring Center for providing data.

Conflicts of Interest

The authors declare no conflict of interest.

References

  1. Zhang, Y.; Chen, X.; Mao, Y.; Shuai, C.; Jiao, L.; Wu, Y. Analysis of resource allocation and PM2.5 pollution control efficiency: Evidence from 112 Chinese cities. Ecol. Indic. 2021, 127, 107705. [Google Scholar] [CrossRef]
  2. Huang, Y.; Ji, Y.; Zhu, Z.; Zhang, T.; Gong, W.; Xia, X.; Sun, H.; Zhong, X.; Zhou, X.; Chen, D. Satellite-based spatiotemporal trends of ambient PM2.5 concentrations and influential factors in Hubei, Central China. Atmos. Res. 2020, 241, 104929. [Google Scholar] [CrossRef]
  3. Sun, X.; Zhao, T.; Liu, D.; Gong, S.; Xu, J.; Ma, X. Quantifying the Influences of PM2.5 and Relative Humidity on Change of Atmospheric Visibility over Recent Winters in an Urban Area of East China. Atmosphere 2020, 11, 461. [Google Scholar] [CrossRef]
  4. Wang, X.; Zhang, R.; Yu, W. The Effects of PM2.5 Concentrations and Relative Humidity on Atmospheric Visibility in Beijing. J. Geophys. Res. Atmos. 2019, 124, 2235–2259. [Google Scholar] [CrossRef]
  5. Chen, X.; Wang, L.; Niu, Z.; Zhang, M.; Li, C.a.; Li, J. The effects of projected climate change and extreme climate on maize and rice in the Yangtze River Basin, China. Agric. For. Meteorol. 2020, 282, 107867. [Google Scholar] [CrossRef]
  6. Nguyen, G.T.H.; Shimadera, H.; Uranishi, K.; Matsuo, T.; Kondo, A. Numerical assessment of PM2.5 and O3 air quality in Continental Southeast Asia: Impacts of potential future climate change. Atmos. Environ. 2019, 215, 470–479. [Google Scholar] [CrossRef]
  7. Chi, R.; Li, H.; Wang, Q.; Zhai, Q.; Wang, D.; Wu, M.; Liu, Q.; Wu, S.; Ma, Q.; Deng, F.; et al. Association of emergency room visits for respiratory diseases with sources of ambient PM2.5. J. Environ. Sci. 2019, 86, 154–163. [Google Scholar] [CrossRef]
  8. Zhao, H.; Li, X.; Zhang, Q.; Jiang, X.; Lin, J.; Peters, G.P.; Li, M.; Geng, G.; Zheng, B.; Huo, H.; et al. Effects of atmospheric transport and trade on air pollution mortality in China. Atmos. Chem. Phys. 2017, 17, 10367–10381. [Google Scholar] [CrossRef] [Green Version]
  9. Lim, C.-H.; Ryu, J.; Choi, Y.; Jeon, S.W.; Lee, W.-K. Understanding global PM2. 5 concentrations and their drivers in recent decades (1998–2016). Environ. Int. 2020, 144, 106011. [Google Scholar] [CrossRef]
  10. Zhang, Q.; Zheng, Y.; Tong, D.; Shao, M.; Wang, S.; Zhang, Y.; Xu, X.; Wang, J.; He, H.; Liu, W. Drivers of improved PM2. 5 air quality in China from 2013 to 2017. Proc. Natl. Acad. Sci. USA 2019, 116, 24463–24469. [Google Scholar] [CrossRef]
  11. Dai, H.; Huang, G.; Zeng, H.; Zhou, F. PM2. 5 volatility prediction by XGBoost-MLP based on GARCH models. J. Clean. Prod. 2022, 356, 131898. [Google Scholar] [CrossRef]
  12. Dai, H.; Huang, G.; Wang, J.; Zeng, H.; Zhou, F. Prediction of Air Pollutant Concentration Based on One-Dimensional Multi-Scale CNN-LSTM Considering Spatial-Temporal Characteristics: A Case Study of Xi’an, China. Atmosphere 2021, 12, 1626. [Google Scholar] [CrossRef]
  13. Bei, N.; Zhao, L.; Wu, J.; Li, X.; Feng, T.; Li, G. Impacts of sea-land and mountain-valley circulations on the air pollution in Beijing-Tianjin-Hebei (BTH): A case study. Environ. Pollut. 2018, 234, 429–438. [Google Scholar] [CrossRef]
  14. Ge, B.; Wang, Z.; Lin, W.; Xu, X.; Li, J.; Ji, D.; Ma, Z. Air pollution over the North China Plain and its implication of regional transport: A new sight from the observed evidences. Environ. Pollut. 2018, 234, 29–38. [Google Scholar] [CrossRef]
  15. An, Z.; Huang, R.J.; Zhang, R.; Tie, X.; Li, G.; Cao, J.; Zhou, W.; Shi, Z.; Han, Y.; Gu, Z.; et al. Severe haze in northern China: A synergy of anthropogenic emissions and atmospheric processes. Proc. Natl. Acad. Sci. USA 2019, 116, 8657–8666. [Google Scholar] [CrossRef] [Green Version]
  16. Gao, L.; Wang, T.; Ren, X.; Zhuang, B.; Li, S.; Yao, R.; Yang, X.-Q. Impact of atmospheric quasi-biweekly oscillation on the persistent heavy PM2.5 pollution over Beijing-Tianjin-Hebei region, China during winter. Atmos. Res. 2020, 242, 105017. [Google Scholar] [CrossRef]
  17. Chang, X.; Wang, S.; Zhao, B.; Xing, J.; Liu, X.; Wei, L.; Song, Y.; Wu, W.; Cai, S.; Zheng, H.; et al. Contributions of inter-city and regional transport to PM2.5 concentrations in the Beijing-Tianjin-Hebei region and its implications on regional joint air pollution control. Sci. Total Environ. 2019, 660, 1191–1200. [Google Scholar] [CrossRef]
  18. Wang, Z.B.; Fang, C.L. Spatial-temporal characteristics and determinants of PM2.5 in the Bohai Rim Urban Agglomeration. Chemosphere 2016, 148, 148–162. [Google Scholar] [CrossRef]
  19. Lv, B.; Hu, Y.; Chang, H.H.; Russell, A.G.; Cai, J.; Xu, B.; Bai, Y. Daily estimation of ground-level PM2.5 concentrations at 4km resolution over Beijing-Tianjin-Hebei by fusing MODIS AOD and ground observations. Sci. Total Environ. 2017, 580, 235–244. [Google Scholar] [CrossRef]
  20. Wang, L.; Xiong, Q.; Wu, G.; Gautam, A.; Jiang, J.; Liu, S.; Zhao, W.; Guan, H. Spatio-Temporal Variation Characteristics of PM2.5 in the Beijing-Tianjin-Hebei Region, China, from 2013 to 2018. Int. J. Environ. Res. Public Health 2019, 16, 4276. [Google Scholar] [CrossRef]
  21. Yan, D.; Lei, Y.; Shi, Y.; Zhu, Q.; Li, L.; Zhang, Z. Evolution of the spatiotemporal pattern of PM2.5 concentrations in China–A case study from the Beijing-Tianjin-Hebei region. Atmos. Environ. 2018, 183, 225–233. [Google Scholar] [CrossRef] [Green Version]
  22. Deng, Q.; Yang, K.; Luo, Y. Spatiotemporal patterns of PM2.5 in the Beijing–Tianjin–Hebei region during 2013–2016. Geol. Ecol. Landsc. 2017, 1, 95–103. [Google Scholar] [CrossRef]
  23. Nguyen, T.; Yu, X.; Zhang, Z.; Liu, M.; Liu, X. Relationship between types of urban forest and PM2.5 capture at three growth stages of leaves. J. Environ. Sci. 2015, 27, 33–41. [Google Scholar] [CrossRef] [PubMed]
  24. Lu, S.; Yang, X.; Li, S.; Chen, B.; Jiang, Y.; Wang, D.; Xu, L. Effects of plant leaf surface and different pollution levels on PM2.5 adsorption capacity. Urban For. Urban Green. 2018, 34, 64–70. [Google Scholar] [CrossRef]
  25. Zhang, X.; Du, J.; Huang, T.; Zhang, L.; Gao, H.; Zhao, Y.; Ma, J. Atmospheric removal of PM2.5 by man-made Three Northern Regions Shelter Forest in Northern China estimated using satellite retrieved PM2.5 concentration. Sci. Total Environ. 2017, 593–594, 713–721. [Google Scholar] [CrossRef]
  26. Fan, S.; Li, X.; Dong, L. Field assessment of the effects of land-cover type and pattern on PM10 and PM2.5 concentrations in a microscale environment. Environ. Sci. Pollut. Res. Int. 2019, 26, 2314–2327. [Google Scholar] [CrossRef]
  27. Liang, D.; Ma, C.; Wang, Y.Q.; Wang, Y.J.; Chen-Xi, Z. Quantifying PM2.5 capture capability of greening trees based on leaf factors analyzing. Environ. Sci. Pollut. Res. Int. 2016, 23, 21176–21186. [Google Scholar] [CrossRef] [Green Version]
  28. Mitchell, R.; Maher, B.A.; Kinnersley, R. Rates of particulate pollution deposition onto leaf surfaces: Temporal and inter-species magnetic analyses. Environ. Pollut. 2010, 158, 1472–1478. [Google Scholar] [CrossRef]
  29. Tong, Z.; Whitlow, T.H.; MacRae, P.F.; Landers, A.J.; Harada, Y. Quantifying the effect of vegetation on near-road air quality using brief campaigns. Environ. Pollut. 2015, 201, 141–149. [Google Scholar] [CrossRef]
  30. Jeanjean, A.P.R.; Monks, P.S.; Leigh, R.J. Modelling the effectiveness of urban trees and grass on PM2.5 reduction via dispersion and deposition at a city scale. Atmos. Environ. 2016, 147, 1–10. [Google Scholar] [CrossRef]
  31. Matsuda, K.; Fujimura, Y.; Hayashi, K.; Takahashi, A.; Nakaya, K. Deposition velocity of PM2.5 sulfate in the summer above a deciduous forest in central Japan. Atmos. Environ. 2010, 44, 4582–4587. [Google Scholar] [CrossRef]
  32. Hwang, H.-J.; Yook, S.-J.; Ahn, K.-H. Experimental investigation of submicron and ultrafine soot particle removal by tree leaves. Atmos. Environ. 2011, 45, 6987–6994. [Google Scholar] [CrossRef]
  33. Zhang, L.; He, J.; Gong, S.; Guo, X.; Zhao, T.; Zhou, C.; Wang, H.; Mo, J.; Gui, K.; Zheng, Y. Effect of vegetation seasonal cycle alterations to aerosol dry deposition on PM2. 5 concentrations in China. Sci. Total Environ. 2022, 828, 154211. [Google Scholar] [CrossRef]
  34. Lee, A.; Jeong, S.; Joo, J.; Park, C.-R.; Kim, J.; Kim, S. Potential role of urban forest in removing PM2. 5: A case study in Seoul by deep learning with satellite data. Urban Clim. 2021, 36, 100795. [Google Scholar] [CrossRef]
  35. Lu, D.; Mao, W.; Yang, D.; Zhao, J.; Xu, J. Effects of land use and landscape pattern on PM2. 5 in Yangtze River Delta, China. Atmos. Pollut. Res. 2018, 9, 705–713. [Google Scholar] [CrossRef]
  36. Al-Dousari, A.; Ibrahim, M.; Al-Dousari, N.; Ahmed, M.; Al-Awadhi, S. Pollen in aeolian dust with relation to allergy and asthma in Kuwait. Aerobiologia 2018, 34, 325–336. [Google Scholar] [CrossRef]
  37. Doronzo, D.M.; Al-Dousari, A.; Folch, A.; Dagsson-Waldhauserova, P. Preface to the dust topical collection. Arab. J. Geosci. 2016, 9, 468. [Google Scholar] [CrossRef] [Green Version]
  38. Subramaniam, N.; Al-Sudairawi, M.; Al-Dousari, A.; Al-Dousari, N. Probability distribution and extreme value analysis of total suspended particulate matter in Kuwait. Arab. J. Geosci. 2015, 8, 11329–11344. [Google Scholar] [CrossRef]
  39. Jiang, M.; Tian, S.; Zheng, Z.; Zhan, Q.; He, Y. Human activity influences on vegetation cover changes in Beijing, China, from 2000 to 2015. Remote Sens. 2017, 9, 271. [Google Scholar] [CrossRef] [Green Version]
  40. Qi, M.; Jiang, L.; Liu, Y.; Xiong, Q.; Sun, C.; Li, X.; Zhao, W.; Yang, X. Analysis of the Characteristics and Sources of Carbonaceous Aerosols in PM2.5 in the Beijing, Tianjin, and Langfang Region, China. Int. J. Environ. Res. Public Health 2018, 15, 1483. [Google Scholar] [CrossRef]
  41. Zheng, X.; Zhao, W.; Yan, X.; Shu, T.; Xiong, Q.; Chen, F. Pollution Characteristics and Health Risk Assessment of Airborne Heavy Metals Collected from Beijing Bus Stations. Int. J. Environ. Res. Public Health 2015, 12, 9658–9671. [Google Scholar] [CrossRef] [PubMed] [Green Version]
  42. Jiang, L.; He, S.; Zhou, H. Spatio-temporal characteristics and convergence trends of PM2.5 pollution: A case study of cities of air pollution transmission channel in Beijing-Tianjin-Hebei region, China. J. Clean. Prod. 2020, 256, 120631. [Google Scholar] [CrossRef]
  43. Su, X.; Wang, Q.; Li, Z.; Calvello, M.; Esposito, F.; Pavese, G.; Lin, M.; Cao, J.; Zhou, C.; Li, D.; et al. Regional transport of anthropogenic pollution and dust aerosols in spring to Tianjin-A coastal megacity in China. Sci. Total Environ. 2017, 584–585, 381–392. [Google Scholar] [CrossRef] [PubMed]
  44. Wang, G.; Cheng, S.; Wei, W.; Yang, X.; Wang, X.; Jia, J.; Lang, J.; Lv, Z. Characteristics and emission-reduction measures evaluation of PM2.5 during the two major events: APEC and Parade. Sci. Total Environ. 2017, 595, 81–92. [Google Scholar] [CrossRef] [PubMed]
  45. Zhang, X.; Gu, X.; Cheng, C.; Yang, D. Spatiotemporal heterogeneity of PM2.5 and its relationship with urbanization in North China from 2000 to 2017. Sci. Total Environ. 2020, 744, 140925. [Google Scholar] [CrossRef]
  46. Jin, X.; Cai, X.; Yu, M.; Song, Y.; Wang, X.; Kang, L.; Zhang, H. Diagnostic analysis of wintertime PM2.5 pollution in the North China Plain: The impacts of regional transport and atmospheric boundary layer variation. Atmos. Environ. 2020, 224, 117346. [Google Scholar] [CrossRef]
  47. Mu, B.; Zhao, X.; Wu, D.; Wang, X.; Zhao, J.; Wang, H.; Zhou, Q.; Du, X.; Liu, N. Vegetation Cover Change and Its Attribution in China from 2001 to 2018. Remote Sens. 2021, 13, 496. [Google Scholar] [CrossRef]
  48. Li, F.; Chen, W.; Zeng, Y.; Zhao, Q.; Wu, B. Improving Estimates of Grassland Fractional Vegetation Cover Based on a Pixel Dichotomy Model: A Case Study in Inner Mongolia, China. Remote Sens. 2014, 6, 4705–4722. [Google Scholar] [CrossRef] [Green Version]
  49. Zar, J.H. Significance Testing of the Spearman Rank Correlation Coefficient. J. Am. Stat. Assoc. 1972, 67, 578–580. [Google Scholar] [CrossRef]
  50. Dzierzanowski, K.; Popek, R.; Gawronska, H.; Saebo, A.; Gawronski, S.W. Deposition of particulate matter of different size fractions on leaf surfaces and in waxes of urban forest species. Int. J. Phytoremediation 2011, 13, 1037–1046. [Google Scholar] [CrossRef]
Figure 1. Distribution of PM2.5 monitoring stations over the Beijing-Tianjin-Hebei region.
Atmosphere 13 01850 g001
Figure 2. Mean, maximum, and minimum monthly PM2.5 concentrations, as well as the percent of days exceeding standards, for the Beijing-Tianjin-Hebei region in 2018.
Atmosphere 13 01850 g002
Figure 3. Mean, maximum, and minimum monthly PM2.5 concentrations, as well as the percent of days exceeding standards, for the Beijing-Tianjin-Hebei region in 2019.
Atmosphere 13 01850 g003
Figure 4. Box and whisker plots of seasonally averaged PM2.5 concentrations in the Beijing-Tianjin-Hebei region over 2018.
Atmosphere 13 01850 g004
Figure 5. Average annual PM2.5 concentrations for the major cities of the BTH in 2018 and 2019.
Atmosphere 13 01850 g005
Figure 6. Seasonal PM2.5 distributions across the Beijing-Tianjin-Hebei region from 2018 to 2019. (The (AD) diagram represents the spatial distribution of PM2.5 in spring, summer, autumn and winter respectively).
Atmosphere 13 01850 g006
Figure 7. Spatial distributions of the average annual PM2.5 concentrations across the Beijing-Tianjin-Hebei region in (a) 2018 and (b) 2019.
Atmosphere 13 01850 g007
Figure 8. Average spatial distribution of fractional vegetation cover in the Beijing-Tianjin-Hebei region in 2018 and 2019.
Atmosphere 13 01850 g008
Figure 9. Spatial distribution of the average values of vegetation cover in the Beijing-Tianjin-Hebei region in all seasons. (The (ad) diagram represents the spatial distribution of the average values of vegetation cover in spring, summer, autumn and winter respectively).
Atmosphere 13 01850 g009
Figure 10. Seasonal variation of the fractional vegetation cover (FVC) of the Beijing-Tianjin-Hebei region in 2018 and 2019.
Atmosphere 13 01850 g010
Figure 11. Average 2018–2019 fractional vegetation cover (FVC) and PM2.5 mass concentration for each 16-day sequence across the Beijing-Tianjin-Hebei region.
Atmosphere 13 01850 g011
Table 1. Seasonal and annual Spearman correlation coefficient values between PM2.5 and fractional vegetation cover over the Beijing-Tianjin-Hebei region (2018–2019).
Time IntervalCorrelation Coefficient
Spring−0.269 **
Summer−0.287 **
Autumn−0.347 **
Winter−0.358 **
Annual−0.346 **
** passed the confidence test at α = 0.01, n = 92.
Publisher’s Note: MDPI stays neutral with regard to jurisdictional claims in published maps and institutional affiliations.

