Article

A Climatological Study of Successive Tropical Cyclone Events in North Atlantic

Department of Marine, Earth and Atmospheric Sciences, North Carolina State University, Box 8208, Raleigh, NC 27695-8208, USA
*
Author to whom correspondence should be addressed.
Atmosphere 2022, 13(11), 1909; https://doi.org/10.3390/atmos13111909
Submission received: 26 September 2022 / Revised: 6 November 2022 / Accepted: 12 November 2022 / Published: 16 November 2022
(This article belongs to the Special Issue Advances in Tropical Cyclone Climate Research)

Abstract

:
This study presents the climatological characteristics and key environmental features that are conducive to the development of successive tropical cyclone events (STCs) over the North Atlantic Ocean. Composite analyses were conducted to analyze the temporal, spatial, and mean characteristics of the environmental conditions associated with historical STC events during the study period of 1950–2020. The results show that the tropical cyclone (TC)-induced Rossby waves could explain a majority of Atlantic STCs when newly formed TCs develop to the east of the pre-existing TC during the study period. The remaining STCs which could not be explained by the Rossby wave dispersion theory were likely the result of favorable environmental conditions conducive to the occurrence of the successive development of TCs. The composite analysis of the environmental conditions at various time scales reveals that the low-frequency variability of the environmental conditions likely plays a significant role in modulating the STCs over the North Atlantic Ocean.

1. Introduction

Tropical cyclones (TC) are extreme weather systems which occur on Earth that have far-reaching adverse impacts on human societies [1,2,3], and they are the costliest natural disasters in the United States [4]. The destructive wind and heavy rainfall that accompany their passages could give rise to catastrophic economic, social and ecological impacts. Hurricane Katrina, which was the most destructive and costliest storm impacting the United States that is on the record, caused 1833 deaths [5], $125 billion in damages in 2005 and approximately cost $161 billion with inflation adjustments [6]. In addition, as it was the most extreme hurricane season before 2020, the most active concurrence of multiple tropical cyclones occurred in 2005. The strikes from multiple concurrent or successive hurricanes further complicated the disaster prevention and mitigation measures.
Through the analysis of hurricane observations, Gray [7,8] noticed that TCs within a basin tend to cluster in a temporal and spatial context. During the hurricane season, the TC cluster occurrence is concentrated within 1~2 weeks, and it is separated by 2~3 weeks of relatively weak activity. Such a phenomenon coincides with the frequency of the large-scale general circulation changes in the tropical atmosphere, which occur on time scales from 10 to 20 days [8]. Krouse and Sobel [9] introduced the concept of multiple cyclone events (MCEs), and they summarized the statistics of the events where one (daughter) TC forms to the east of another existing (mother) TC during its lifetime. They found that easterly vertical shear and cyclonic low-level horizontal shear play an important role on the formation of the daughter cyclone. Gao and Li [10,11] carried out a series of investigations based on a similar concept of MCEs over the western North Pacific, but they covered more cases by defining the event as two or more TCs forming within a relatively short period. They revealed the favorable large-scale conditions for the genesis of multiple TCs through a composite analysis, including positive low-level (negative upper-level) vorticity anomalies, enhanced convection activity and mid-tropospheric relative humidity. Moreover, mixed Rossby-gravity waves [12,13] and convectively active Kelvin waves [14] have also been shown to be associated with such group events.
In fact, most of the prior studies are focused on the conducive conditions for western North Pacific MCEs. Despite various studies that interpret the relationship between the large-scale oscillations and active TC seasons, there is a lack of systematic climatological studies of the MCEs over the Atlantic Basin. Schenkel [15,16] intercompared the characteristics of multiple TC events among the global TC basins. His findings indicated that there were similarities in the spatial and temporal characteristics of multiple TC events among the basins, which is quite unusual considering the significant differences in the environmental and TC characteristics in each basin.
Since a substantial number of TCs occur within a multiple TC event (~34%) for the Atlantic Basin [15], and such a trend has been more frequently observed in recent years, a systematical summary of its statistical characteristic is provided in our analysis which builds upon prior studies. Through the composite analyses of the active and inactive seasons with regard to multiple TCs, we intend to explore whether there exists a set of large-scale circulation features in the tropics which regulate the group activity of the TCs. Such an examination would shed a light on the introduction of novel predictors to improve the preseason hurricane forecasts through a better description of the TC group activities. The concept of STC events that are referred to in this study and the data and methods that are used in this study are summarized in Section 2. Section 3 discusses the climatology of multiple TCs over the Atlantic Basin, which is followed by the results of a composite analysis examining the environmental fields. The discussions and conclusions are presented in Section 5.

2. Concept, Data and Methods

2.1. Successive Tropical Cyclone (STC)

Krouse and Sobel [9] proposed the concept of a “multiple cyclone event” (MCE) in the Pacific Ocean. Their study focuses on the events where one TC forms to the east of another pre-existing TC during its lifetime and their relationship is defined as a “mother-daughter” pair. In a similar study that was conducted by Gao and Li [10], a multiple tropical cyclone (MTC) event is defined as an occasion in which more than one TC forms in a relatively short period. They discussed the characteristics of multicyclone events based on the detected cases during the summer (from June to September). Later, they further modified the concept by introducing a distance constraint and included more cases which occurred in October [11]. They limited the mean spatial distances between multiple TCs within 4000 km considering the physical mechanisms behind the TC events. For the study of the Atlantic counterparts, Schenkel [15,16] used the same concept that was proposed by Krouse and Sobel [9], but they mainly focused on the initial 6 h of the occurrence of the multiple tropical cyclone events, i.e., the genesis of the newly formed TCs.
In this study, we introduce the concept of “successive tropical cyclone events” (STCs), which are defined as events where multiple tropical cyclones occur successively within a short, continuous period of time over the North Atlantic Ocean during the Atlantic hurricane season (from June to November). Although the concept of STCs that is defined here shares some commonality with the aforementioned concepts of the MCE and the MTC, the STC is a more general term where no spatial/temporal limitations have been set. Therefore, a successive tropical cyclogenesis in a STC event does not need to be the energy dispersion of a preexisting TC, thus, allowing for the inclusion of triggering scenarios by other synoptic perturbations either to the west or east of the pre-existing TC. In this study, we will examine the statistical and physical characteristics of the atmospheric and oceanic environment in the Atlantic basin that are associated with active or inactive periods of STCs.

2.2. Data

To systematically examine the climatological characteristics of the STCs, the HURDAT2 dataset [17] was used. It documents the official assessments of every Atlantic tropical cyclone’s history at a 6-h interval, including the genesis dates, best track paths, sizes, maximum winds, and central pressures. However, there are substantial uncertainties related to the tropical cyclones which were underestimated and underreported in the early decades prior to 1950. Therefore, only the records of the tropical cyclones with a storm and hurricane intensity from 1950 to 2020 were used in the current study.
For the composite analysis, the National Centers for Environmental Prediction (NCEP) and the National Center for Atmospheric Research (NCAR) Reanalysis 6 hourly data was used [18]. This dataset represents a reliable basis for the background circulation analysis of the data from the last decades [19,20]. It covers 2.5° × 2.5° global grids for the study period. The outgoing longwave radiation (OLR) is compiled daily, and it is only available from 1974 onwards.

2.3. Methods

The Lanczos band pass filter was applied to extract the atmospheric signals in association with the activity of the STCs. It is commonly used in assessing the oscillations of various times scales [10,21,22,23]. The anomalous fields of the outgoing longwave radiation (OLR) were obtained by applying band-pass time filters to the fields of OLR with a frequency response of 20–70 days for the intra-seasonal oscillation (ISO), 10–20 days for biweekly oscillation (BWO) and 3–10 days for the synoptic scale signals. Given the cut-off frequencies, a simple sensitivity experiment was conducted to determine the optimal number of filter weights for each extracted signal. Figure 1 shows the response function of the bandpass filter for ISO and BWO, and a total of 5 weights were applied to the entire daily time series of the OLR, spanning 1974–2020. The response function indicates the minimum Gibbs oscillation near the cut-in and cut-out frequencies. The black curves show the ideal band-pass response function with the cut-off frequency. We refer the readers to Duchon [21] for a more detailed description of this. Considering the usual caveat that a greater loss of data is accompanied with more weights, 241 weights were applied to extract the ISO component, and 121 weights were used to extract the biweekly and synoptic signals.
In this study, the Pearson linear correlation coefficient was applied to determine if they were statistically significantly different from zero at a 95% confidence level using a two-tailed Student t test. For the composite analysis, due to the small sample size, bootstrapping with replacements (N = 1000) as applied to estimate the means, and a 95% confidence level of the composite anomalies was used to further determine if the differences were statistically significantly different from zero.
As we revisited the role of TC-induced Rossby wave radiation in the development of Atlantic STCs, the zonal wavelengths of the TC-induced stationary Rossby waves derived from linear shallow water equation were computed. Additionally, they were compared to the observed zonal distances between the TCs at the time when the second TC appeared to the east of the existing TC using the HURDAT2 dataset. Under the linear shallow water equation, the zonal wavelength of a stationary Rossby wave radiated by a TC is:
λ = 2 π R e q 1 c / U 2 n + 1  
where λ is the zonal wavelength of the TC-induced stationary Rossby wave, the value of n is the meridional integer wavenumber, and it being 0, 1, and 2 corresponds to the mixed-gravity Rossby waves, whereby the first or second equatorial wave at which Rossby wave energy is radiated. c is the gravity wave phrase speed and it is equal to g H 0 , where g is the gravitational constant and H 0 is the equivalent depth with a value of 250 m. R e q is the equatorial Rossby radius of the deformation and it is derived from c β 0 . β 0 is the meridional gradient of planetary vorticity, which is averaged within a box that is centered at each genesis location of the newly formed TC (“daughter” TC). U is the TC-relative environmental zonal steering flow of the TC-induced stationary Rossby waves. With regard to the calculation of U , we followed the method that has been discussed by Krouse and Sobel [9]. Specifically, U is computed by averaging the zonal wind at 850 hPa within the box that is centered at the genesis location of the new TC during the two days prior to the genesis of the new TC. The zonal steering flow of the existing TC is assumed to be equal to the zonal propagation speed of the mother TC itself. Therefore, by subtracting the zonal motion of the pre-existing TC which has been averaged over the two days prior to the new TC, U is converted to the TC-relative value. As for the size of the box, we used a square box (1000 km × 1000 km) as Krouse and Sobel did [9] and a rectangle region (2500 km longitudinal × 1000 km latitudinal) which is determined by the mean relative position between the pre-existing and successively formed TCs. The results are insensitive to the box size or the location of the box, which is either centered on the new TC genesis location or located to the southeast of the pre-existing TC.
The derived zonal wavelength is multiplied by an integer value so that the result is closest to the observed zonal distance between the TCs in a pair, and then, it is compared with the observed zonal distance. The integer value represents the number of Rossby wavelengths between the newly formed and pre-existing TC as Rossby wave radiation can trigger several sets of troughs and ridges [15,24]. The discussion of this is presented in the next section. However, it is worth noting that there are requirements under the Rossby wave radiation scenario. The involved TCs in the STCs must satisfy the following three criteria: (a) for each TC pair, the existing TC is located to the west of the newly formed TC; (b) with that being said, the TC-relative environmental zonal steering flow must be easterly; (c) Equation (1) must have a real solution, i.e., U < c 2 n + 1 .

3. Temporal and Spatial Characteristics of STCs

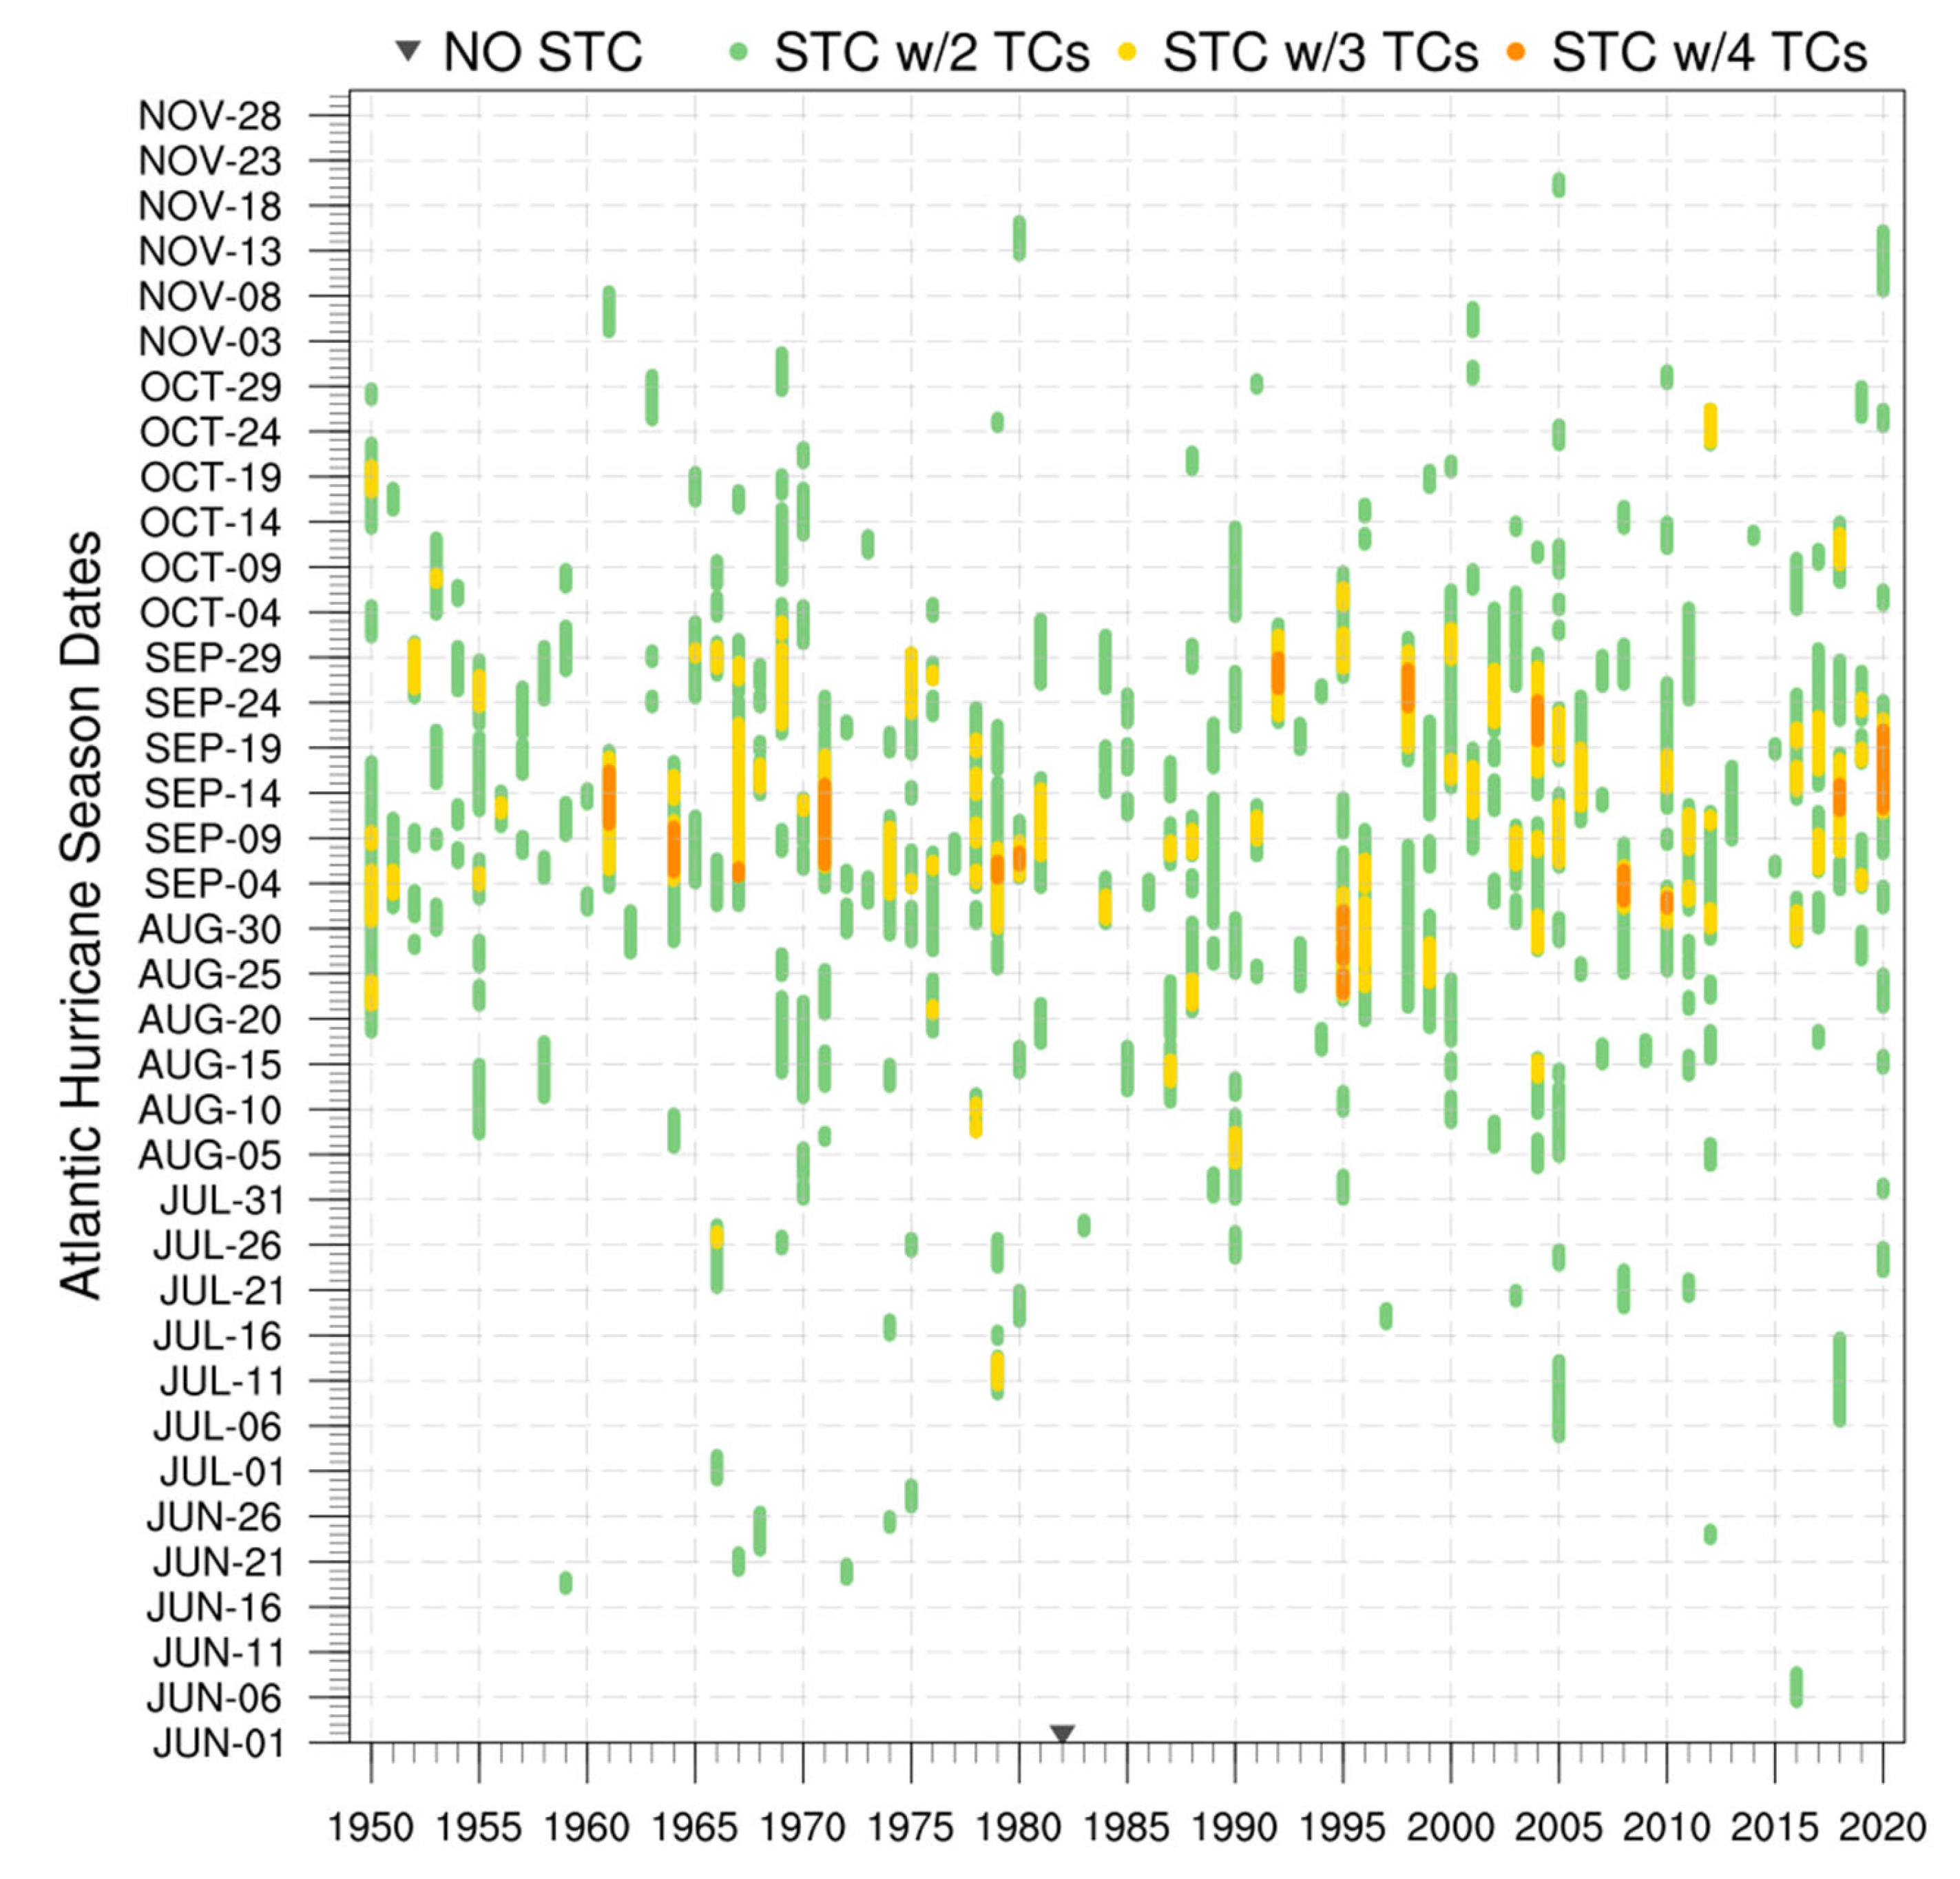
We first examine the lifecycles of each TC at a six-hour time step within the Atlantic hurricane season from June to November. The counts of the STCs are manually determined if at any point, two or more TCs were present for each year during the study period of 1950–2020. The occurrence of STCs occurred in all of the hurricane seasons except for in 1982. There are 274 cases over the entire Atlantic Basin for the 71-year study period from 1950 to 2020 (Figure 2). The lifetime of an Atlantic STC event can reach up to the life cyclone of four TCs. Specifically, Table 1 gives the number of STCs per season. Among them, the 2005 hurricane season is the most active Atlantic hurricane season in the record with it having the highest number of STCs (10) until 2020, which is ranked as being second on the list of most frequent occurrence of STCs. By requiring that the activity of a STC event must exceed two days, we ruled out 37 possible short-lived STCs.
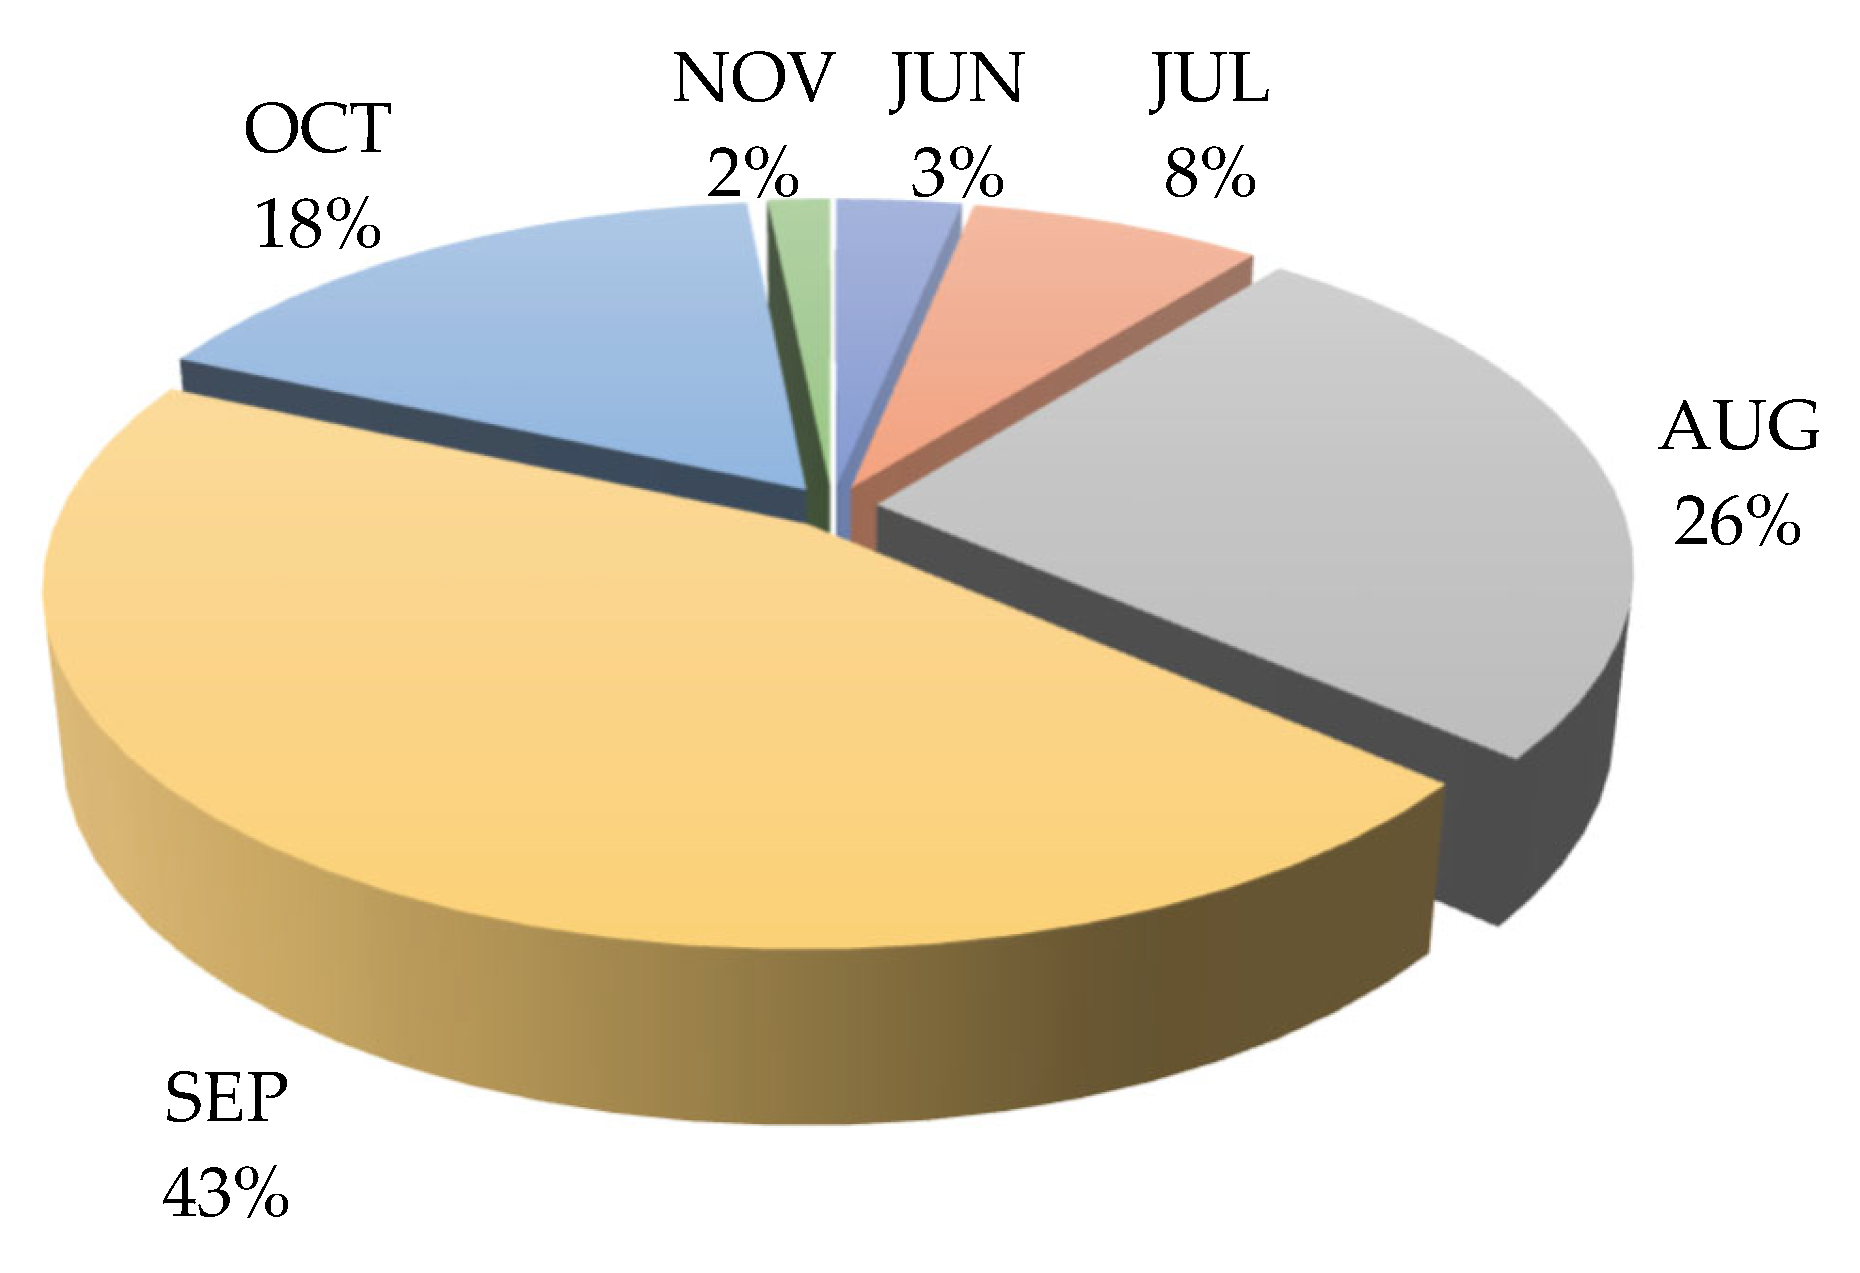
By examining its relationship between the STCs and the corresponding total named tropical cyclone count in each season, there is a statistically significant correlation of 0.79, which exceeds a 95% confidence level. The percentage of STCs in each month (Figure 3) suggests another similarity between the total count of the named TCs and STCs which both peak in September within the Atlantic Basin. It indicates that the likelihood of an STC occurrence increases as TC count increases.
Next, we examined the relative positions and temporal interval between the pre-existing and the newly formed TCs. Since some of the STCs include more than two TCs, we analyzed each STC event and identified the TC pairs. If at any point during the lifetime of a TC, a second TC appears, then they are identified as a TC pair. If more than one new TC is found to have occurred at the time, then two or more pairs are composed with the pre-existing TC. Among the 587 pairs that were detected, the locations of the newly formed TCs relative to the position of pre-existing TC were mapped onto a 500 km × 500 km grids (Figure 4). Within each grid box, the number of second TCs is color-coded. Most of the second TCs (59.1%, about 347 pairs) are located to the east of the first TC. Approximately 70.2% of the newly formed TCs appear in the lower latitudes. There are 11.9% of the pairs in which the second TC is located to the northeast of the first one, and 47.2%, 23.0% and 17.9% of them are in the southeast, southwest and northeast quadrants, respectively. The average latitudinal distance in a pair is 1314.2 km, and 2929.1 km is the mean longitudinal distance. In addition, the mean temporal interval is 4.8 days, meaning that it normally takes an average of 4.8 days for the second TC to develop.
As mentioned earlier, only when the newly formed TC is located to the east of the pre-existing storm, might their relationship be related to the TC-induced Rossby wave dispersion. Thus, a subset of 347 TC pairs was included to investigate the existence of the TC-induced Rossby waves. However, the number of TC pairs is way fewer than 347 when all of the three requirements are met. Figure 5 depicts the scatterplot of the predicted zonal wavelength which was computed from the shallow water Equation (1) and the observed zonal distances between the TCs in a pair. A box size of 1000 km in both the zonal and meridional directions was used to calculate the meridional gradient of the planetary vorticity ( β 0 ) and the TC-relative environmental zonal steering flow ( U ). The colored dots indicate the number of the Rossby wavelengths separating the pre-existing and the newly formed TCs.
As shown, the second TC usually forms one or two Rossby wavelength(s) away from the first one in the majority of the TC pairs. Only one pair is observed with six Rossby wavelengths. The number of detected TC pairs is 52, 48 and 43 with the value of N being 0, 1 and 2, respectively. The Pearson correlation coefficients between the predicted and observed zonal distances are 0.78, 0.71 and 0.65, respectively, and they are statistically significantly different from zero at a 95% confidence level ( p 0.01 ) in all three cases. These results are in keeping with the findings in [15,16], although, our study included more cases of Atlantic TC pairs, and the definition of the STCs are somewhat different from the multi-TC events that were introduced in their studies. The strong agreement between shallow-water Rossby wavelength and the zonal distances between the TCs emphasizes again the crucial role of the Rossby wave dispersion during the genesis of successive TCs in the Atlantic basin. It suggests that the Rossby wave radiated from the pre-existing TC can explain the majority of the occurrences of the Atlantic STCs.

4. Composite Analysis of Favorable Factors for STC Occurrence

In Section 3, the potential impact of a preexisting TC on successive TCs occurring to the east of the pre-existing TC by TC-induced Rossby waves dispersion is discussed. In this section, we will focus on the STC cases which could not be explained by the TC-induced Rossby wave dispersion, and we shed light on the following question: what environmental factors might affect the formation of STCs? The annual number of Atlantic STCs is listed in Table 1, and the average number is 3.3 per year with a standard deviation (STD) of 1.8. Therefore, we set the threshold values, defining the active/inactive STC years using the positive and negative STD of the mean values. In an active STC year, there would be more than 5.1 events per season. In contrast, fewer than 1.5 events would be expected in an inactive STC year. Considering the availability of the OLR dataset, the composite analyses in this section were limited to the active and inactive years between 1974 and 2020. Therefore, a total 18 years were selected to calculate the composite anomalies, with the active years being: 1975, 1990, 2004, 2005, 2010, 2011, 2012, 2017 and 2020, and the inactive years being: 1977, 1982, 1983, 1986, 1992, 1997, 2009, 2013 and 2014.

4.1. Mean Circulation Patterns

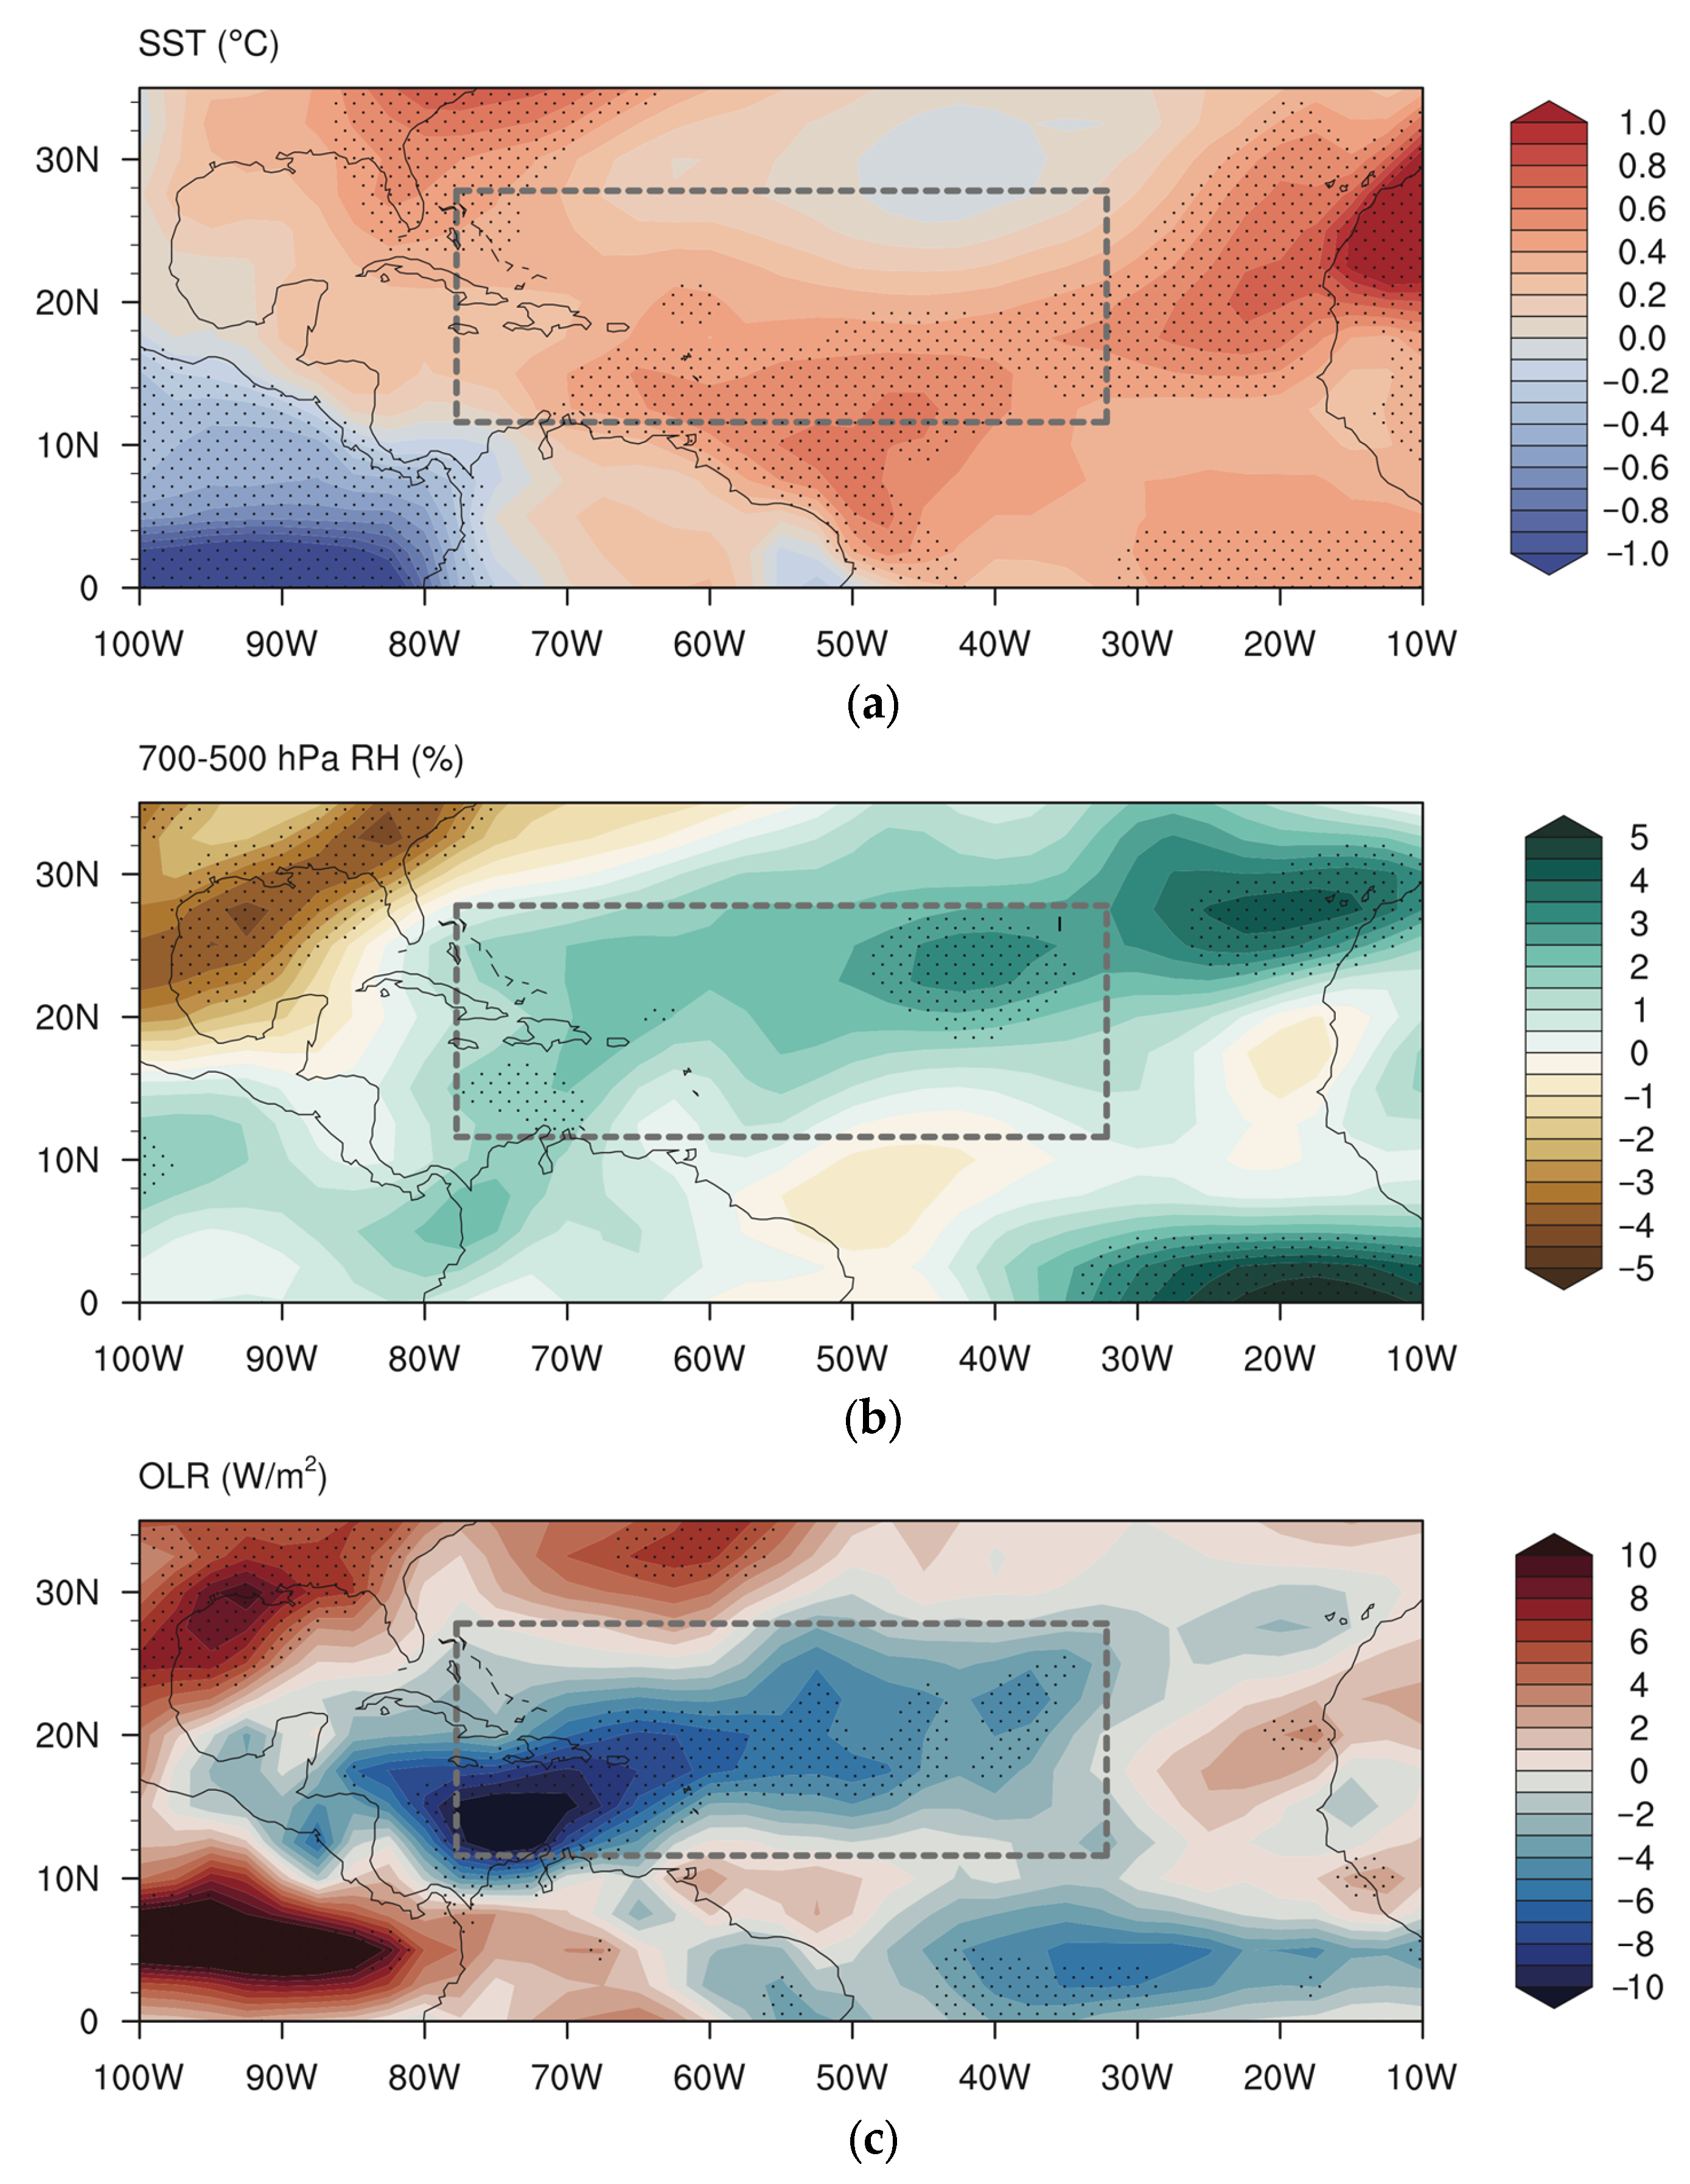
Figure 6 shows the composite map of the difference fields of sea surface temperature (SST), mid-level relative humidity (RH) and outgoing longwave radiation between the active and inactive STC seasons. The fields were extracted with a low-pass filter (90-day or longer) and they were superimposed with the potential genesis area of the new TCs that was obtained from the mean latitude and longitude considering all of the selected STCs. Since more than 80% of the STCs occur in August, September and October, the anomalies that are shown here were analyzed for these three peak months. Compared to the conventional main development region (MDR) which covers the area from 10° N to 20° N and 80° W to 20° W, the region of new TCs tends to shift to the north. The dotted areas indicate that this shift is statistically significantly different from zero at a 95% confidence level.
When they were compared to the inactive STC years, warmer SST and increased mid-level moisture levels are clearly favorable for the occurrence of STCs. However, the opposite trends of the RH can be observed in the Gulf of Mexico, where concurrent TCs are rare. The OLR is often used as a proxy for convection in the tropics and subtropics. The difference field of the OLR shows the enhanced convective activities in association with the active STC years within the potential genesis area of the new TCs. The other negative OLR area spans from the Equator to 10° N to the east at 60° W. The environmental conditions that are favorable for the STCs also show the characteristics that are favorable for tropical cyclogenesis, in general.
The low-level and upper-level divergence and vorticity anomalies are presented in Figure 7. Consistent with the enhanced convection that is shown in the OLR anomalies, in the lower level (850 hPa), the positive vorticity anomalies dominate the region from 10° N to 25° N, indicating a cyclonic environmental circulation. Correspondingly, there is an anti-cyclonic circulation in the upper level (200 hPa). The low-level convergence significantly intensifies along with divergence at the higher level in the region from 10° N to 20° N, which is consistent with the genesis area of the new TCs in the active and inactive years.

4.2. Signals at Different Time Scales

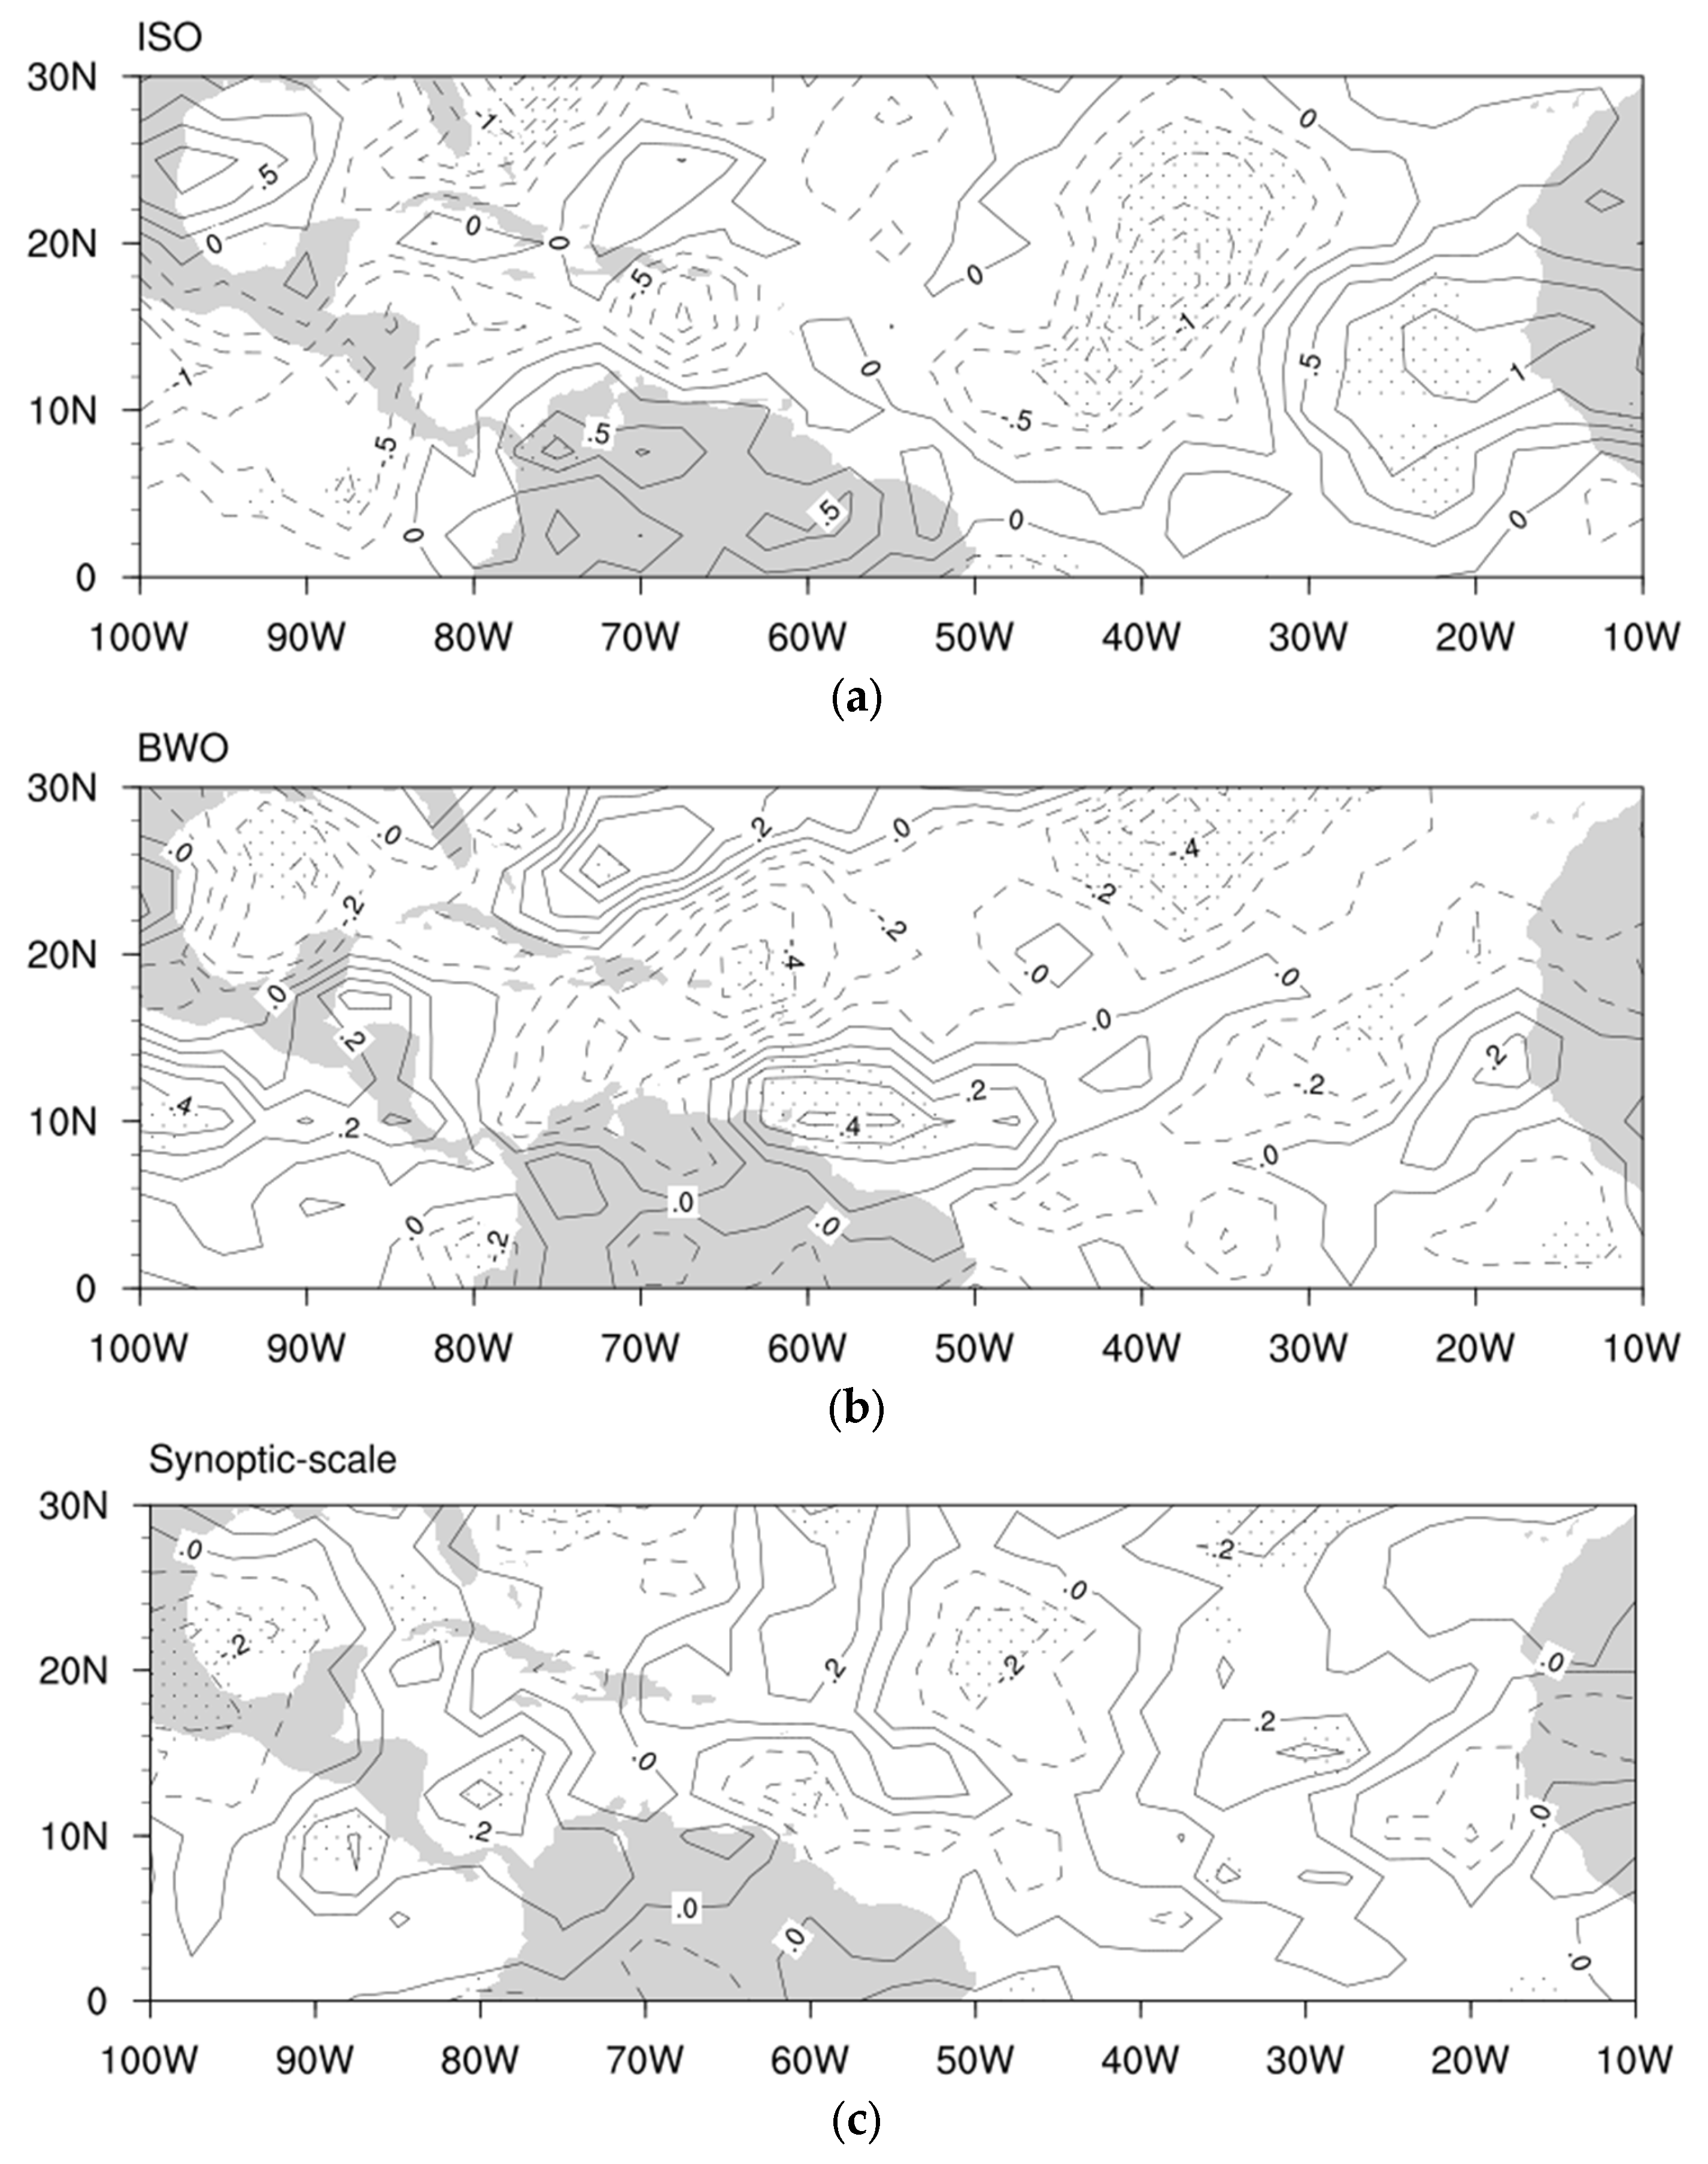
The OLR fields in the active and inactive STC years were extracted with a bandpass filter at the intra-seasonal (ISO, 20–70-day) and biweekly (BWO, 10–20-day) time scales. Their differences are given in Figure 8. The majority of the Atlantic Ocean and the Caribbean Sea is dominated by the negative OLR ISO signals. In the areas to the east of 30° W, between 80° W and 50° W and to the south of 10° N, there are positive anomalies in the OLR ISO signals. Moreover, negative ISO values are observed in the OLR fields in the active STC years (the figures are not shown), with a stronger intensity over the Caribbean Sea and along the southeast coastal regions. Together, the spatial patterns suggest that at intra-seasonal time scales, the negative phase of the OLR tends to be associated with enhanced convections during the activity of STC events. The dotted areas indicate that the anomaly fields are statistically significantly different from zero, which are mainly related to areas of large negative ISO signals.
The spatial pattern of the BWO OLR anomalies (Figure 8b) shows an obvious northeast–southwest pattern. Such a pattern is consistent with the BWO signals of multiple tropical cyclone events over the western North Pacific region [10,11]. Additionally, this is reasonable since the wavelength of the BWO is relatively short when it is compared to that of the ISO [25]. The differences exceed the 95% confidence level only in a few areas, and most of these areas are related to the negative anomalies. At the 90% confidence level, the areas with significant differences were expanded, but they were still mostly associated with negative anomalies (not shown here).
The life span of TCs lasts from a few days to more than a week, thus, they are normally assumed to be synoptic-scale phenomena. With the bandpass filter, the synoptic-scale signals that are related to the active and inactive STC years are extracted as well. However, their anomaly field (Figure 8c) does not show a significant difference between the active and inactive phases. The composite values of the synoptic-scale OLR are much smaller in contrast to that of the low-frequency and intra-seasonal OLR, and they are also weaker than the signals of the BWO OLR. The comparisons of the OLR at different time scales suggest that it is likely the low-frequency environmental conditions that played a crucial role in favoring and modulating the occurrence of Atlantic STCs that were not caused by Rossby waves dispersion which is associated with preexisting TCs.

5. Discussions and Conclusions

The grouped breakout of the TCs in the Atlantic Basin is frequently observed. The concept of successive TC events (STC) is introduced to describe such a phenomenon. Atlantic STCs can be divided into two types: one that is associated with a pre-existing TC to the west, and the other that is not clearly associated with a pre-existing TC. The majority of the occurrence of Atlantic STCs are affected by the Rossby waves radiated from the pre-existing TC. They accounted for roughly 59% of the cases in this study. However, such a mechanism is limited to TC pairs when the newly formed TC appears to the east of the pre-existing TC. The composite analysis shows that a conducive large-scale environmental condition that is defined by a warmer than normal sea surface temperature, an increased mid-tropospheric humidity, and an enhanced convective activity is closely associated with active STC seasons in the Atlantic Basin. In addition, compared to the oscillations at the intra-seasonal or shorter time scales, it is likely that the low-frequency variability of environmental conditions plays a more crucial role in modulating the Atlantic STCs. However, if there is a decadal or multi-decadal variability in the STCs over the Atlantic Ocean, then the drivers of this variability are important concepts which warrant further studies.

Author Contributions

Conceptualization, L.X. Methodology, L.X.; Software, X.S.; Validation, all; Formal Analysis, all; Investigation, all; Resources, L.X.; Data Curation, X.S.; Writing—Original Draft Preparation, all; Writing—Review and Editing, L.X.; Visualization, X.S.; Supervision, L.X.; Project Administration, L.X.; Funding Acquisition, L.X. All authors have read and agreed to the published version of the manuscript.

Funding

This study was funded by the National Science Foundation’s Center for Accelerated Real-Time Analytics (CARTA) via Grant#2020-2096.

Institutional Review Board Statement

Not applicable.

Informed Consent Statement

Not applicable.

Data Availability Statement

Data and software are available upon request.

Acknowledgments

We appreciate the support from CARTA center management.

Conflicts of Interest

The authors declare no conflict of interest.

References

  1. Grinsted, A.; Ditlevsen, P.; Christensen, J.H. Normalized US hurricane damage estimates using area of total destruction, 1900–2018. Proc. Natl. Acad. Sci. USA 2019, 116, 23942–23946. [Google Scholar] [CrossRef] [PubMed]
  2. Doocy, S.; Dick, A.; Daniels, A.; Kirsch, T.D. The human impact of tropical cyclones: A historical review of events 1980-2009 and systematic literature review. PLoS Curr. Disasters 2013, 5, 1–39. [Google Scholar] [CrossRef] [PubMed]
  3. Vecchi, G.A.; Landsea, C.; Zhang, W.; Villarini, G.; Knutson, T. Changes in Atlantic major hurricane frequency since the late-19th century. Nat. Commun. 2021, 12, 4054. [Google Scholar] [CrossRef]
  4. Smith, A.B.; Katz, R.W. US billion-dollar weather and climate disasters: Data sources, trends, accuracy and biases. Nat. Hazards 2013, 67, 387–410. [Google Scholar] [CrossRef]
  5. Knabb, R.D.; Rhome, J.R.; Brown, D.P. Tropical Cyclone Report: Hurricane Katrina. Available online: https://www.nhc.noaa.gov/data/tcr/AL122005_Katrina.pdf (accessed on 22 September 2022).
  6. Blake, E.B.; Gibney, E.J.; Brown, D.P.; Mainelli, M.; Franklin, J.L.; Kimberlain, T.B. Tropical Cyclones of the Eastern North Pacific Ocean, 1949–2006; Hammer, G.R., Ed.; Historical Climatology Series; National Hurricane Center: Miami, FL, USA; National Climatic Data Center: Asheville, NC, USA, 2008; Volume 6-2. [Google Scholar]
  7. Gray, W.M. Tropical cyclone genesis in the Western North Pacific. J. Meteorol. Soc. Jpn. 1977, 55, 465–482. [Google Scholar] [CrossRef] [Green Version]
  8. Gray, W.M. Hurricanes: Their formation, structure and likely role in the tropical circulation. Meteorol. Over Trop. Ocean. 1979, 77, 155–218. [Google Scholar]
  9. Krouse, K.D.; Sobel, A.H. An observational study of multiple tropical cyclone events in the western north Pacific. Tellus A 2010, 62, 256–265. [Google Scholar] [CrossRef]
  10. Gao, J.; Li, T. Factors Controlling Multiple Tropical Cyclone Events in the Western North Pacific. Mon. Weather. Rev. 2011, 139, 885–894. [Google Scholar] [CrossRef] [Green Version]
  11. Gao, J.Y.; Li, T. Interannual variation of multiple tropical cyclone events in the western North Pacific. Adv. Atmos. Sci. 2012, 29, 1279–1291. [Google Scholar] [CrossRef]
  12. Aiyyer, A.; Molinari, J. MJO and tropical cyclogenesis in the Gulf of Mexico and eastern Pacific: Case study and idealized numerical modeling. J. Atmos. Sci. 2008, 65, 2691–2704. [Google Scholar] [CrossRef] [Green Version]
  13. Ventrice, M.J.; Thorncroft, C.D.; Roundy, P.E. The Madden–Julian oscillation’s influence on African easterly waves and downstream tropical cyclogenesis. Mon. Wea. Rev. 2011, 139, 2704–2722. [Google Scholar] [CrossRef]
  14. Schreck, C.; Molinari, J. Tropical cyclogenesis associated with Kelvin waves and the Madden–Julian oscillation. Mon. Weather Rev. 2011, 139, 2723–2734. [Google Scholar] [CrossRef]
  15. Schenkel, B.A. A Climatology of Multiple Tropical Cyclone Events. J. Clim. 2016, 29, 4861–4883. [Google Scholar] [CrossRef]
  16. Schenkel, B.A. Are Multiple Tropical Cyclone Events Similar among Basins? J. Clim. 2017, 30, 5805–5813. [Google Scholar] [CrossRef]
  17. Landsea, C.W.; Franklin, J.L. Atlantic Hurricane Database Uncertainty and Presentation of a New Database Format. Mon. Weather Rev. 2013, 141, 3576–3592. [Google Scholar] [CrossRef]
  18. Kalnay, E.; Kanamitsu, M.; Kistler, R.; Collins, W.; Deaven, D.; Gandin, L.; Iredell, M.; Saha, S.; White, G.; Woollen, J.; et al. The NCEP/NCAR 40-year reanalysis project. Bull. Amer. Meteor. Soc. 1996, 77, 437–470. [Google Scholar] [CrossRef]
  19. Rudeva, I.; Gulev, S.K. Composite analysis of North Atlantic Extratropical cyclones in NCEP-NCAR Reanalysis data. Mon. Weather Rev. 2011, 139, 1419–1446. [Google Scholar] [CrossRef] [Green Version]
  20. Athanasiadis, P.J.; Yeager, S.; Kwon, Y.O.; Bellucci, A.; Smith, D.W.; Tibaldi, S. Decadal predictability of North Atlantic blocking and the NAO. npj Clim. Atmos. Sci. 2020, 3, 20. [Google Scholar] [CrossRef]
  21. Duchon, C.E. Lanczos filter in one and two dimensions. J. Appl. Meteor. 1979, 18, 1016–1022. [Google Scholar] [CrossRef]
  22. Slingo, J.; Palmer, T. Uncertainty in weather and climate prediction. Phil. Trans. R. Soc. A 2011, 369, 3694751–3694767. [Google Scholar] [CrossRef]
  23. Jones, C.; Waliser, D.E.; Gautier, C. The Influence of the Madden–Julian Oscillation on Ocean Surface Heat Fluxes and Sea Surface Temperature. J. Clim. 1998, 11, 1057–1072. [Google Scholar] [CrossRef]
  24. Krouse, K.D.; Sobel, A.H.; Polvani, L. On the wavelength of the Rossby waves radiated by tropical cyclones. J. Atmos. Sci. 2008, 65, 644–654. [Google Scholar] [CrossRef]
  25. Wen, M.; Li, T.; Zhang, R.; Qi, Y. Structure and origin of the quasi-biweekly oscillation over the tropical Indian Ocean in boreal spring. J. Atmos. Sci. 2010, 67, 1965–1982. [Google Scholar] [CrossRef]
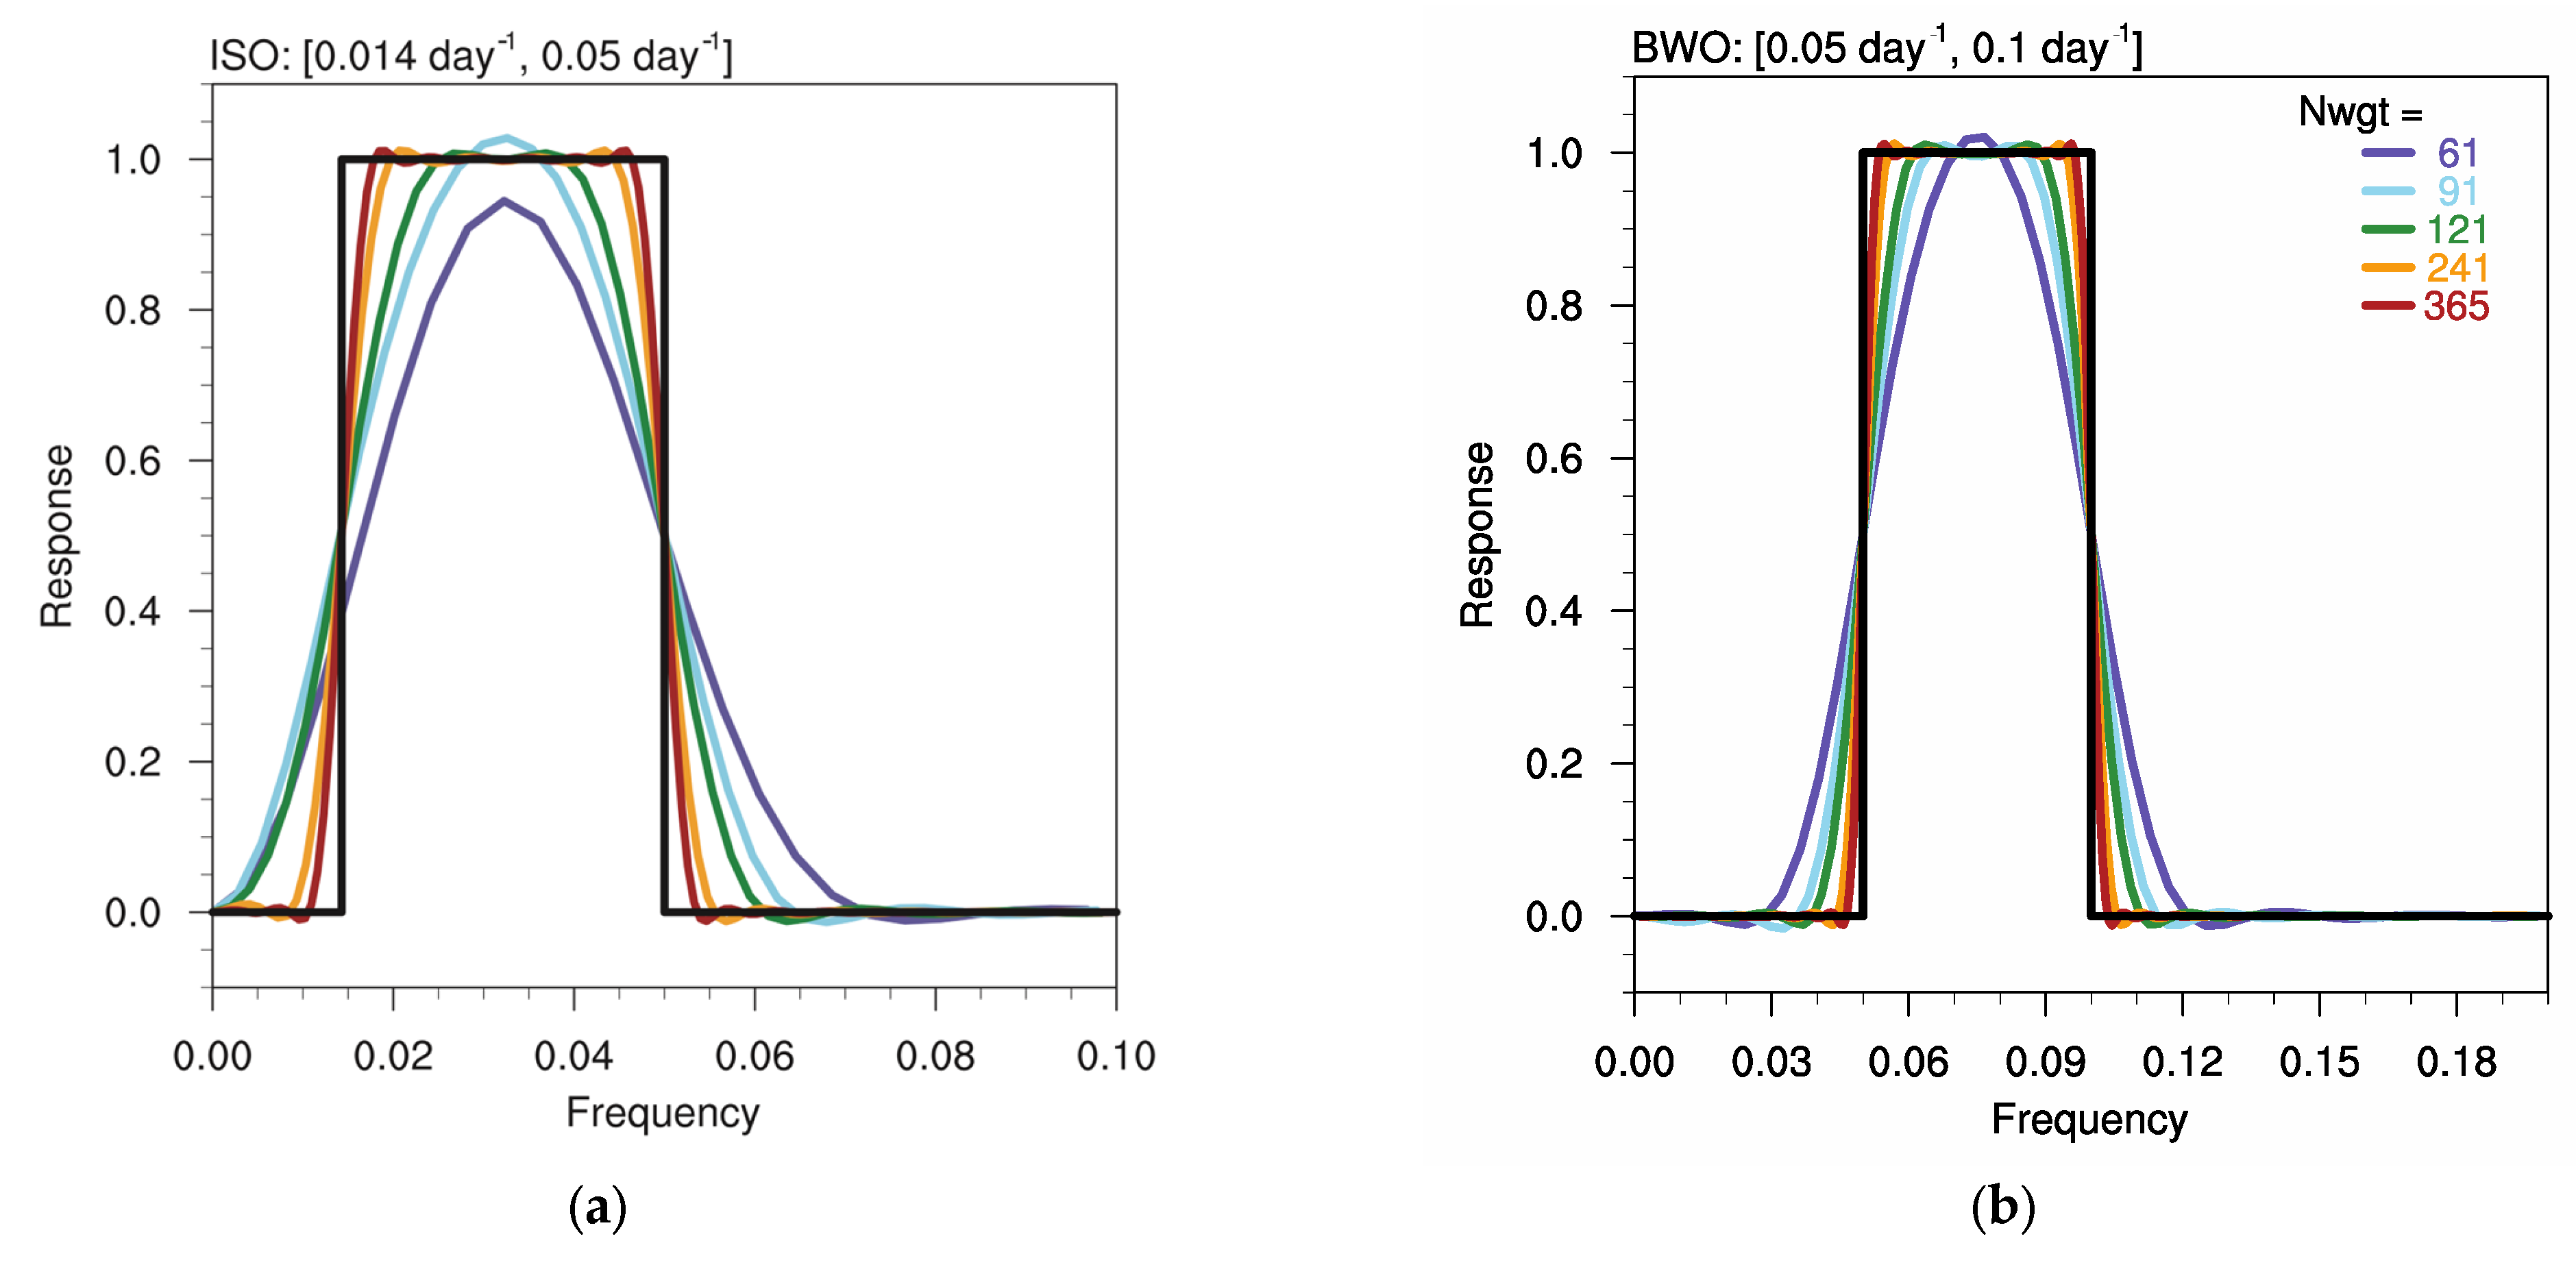
Figure 1. Response function of Lanczos bandpass filter. The cut-in and cut-out frequencies are equal to 0.014 and 0.05 day−1 for (a) ISO oscillation and 0.05 and 0.1 day−1 for (b) BWO oscillation. Total five filter weights are compared: 61, 91, 121, 241 and 365. Black curves give the ideal band-pass response function with the cut-off frequency.
Atmosphere 13 01909 g001
Figure 2. Distributions of STCs with up to four TCs involved. No STC was observed during season in 1982 (labeled in grey inverted triangle). The number of TCs involved in each event is colored.
Atmosphere 13 01909 g002
Figure 3. Percentage of Atlantic STCs in each month during the hurricane season of 1950–2020.
Atmosphere 13 01909 g003
Figure 4. Relative distances (units: km) between the pre-existing and newly formed TCs in a pair. The red hurricane symbol indicates the pre-exiting TC, and black ones give the relative positions of the new TCs. The number of new TCs within a 500 km × 500 km grid is color coded.
Atmosphere 13 01909 g004
Figure 5. Scatterplot of the observed zonal distances between TCs in the detected pairs and the predicted zonal wavelength of TC-induced Rossby waves computed from the shallow-water equation.
Atmosphere 13 01909 g005
Figure 6. Composite differences of (a) sea surface temperature, (b) mid-tropospheric relative humidity, and (c) outgoing longwave radiation between the STC-active and -inactive years. Dotted areas indicate the differences are statistically significant at a 95% confidence level constructed which were by the 1000-sample bootstrap. Dashed lines indicate the potential genesis areas of the new TCs associated with the STC events between average ensemble with top 3 models and that with all 9 models.
Atmosphere 13 01909 g006
Figure 7. Similar to Figure 6, but for the (a) 850 hPa and (b) 200 hPa vorticity (unit: 10 6   s 1 ), (c) 925 hPa divergence (unit: 10 6   s 1 ) fields.
Atmosphere 13 01909 g007
Figure 8. Anomaly fields at (a) 20–70 days, (b) 10–20 days and (c) 3–10 days bandpass-filtered OLR groups (unit: Wm−2) which are composed of STC active and inactive years. The solid lines and dashed lines represent positive and negative anomalies, respectively. Dotted areas on the anomaly fields indicate the differences exceed the 95% confidence intervals which were constructed by a 1000-sample bootstrap.
Atmosphere 13 01909 g008
Table 1. Annual number of STCs in the Atlantic Basin.
1950
4
1951
2
1952
4
1953
4
1954
4
1955
4
1956
1
1957
2
1958
3
1959
4
1960
2
1961
2
1962
1
1963
3
1964
2
1965
3
1966
5
1967
3
1968
3
1969
7
1970
6
1971
4
1972
3
1973
2
1974
5
1975
5
1976
4
1977
1
1978
2
1979
4
1980
4
1981
3
1982
0
1983
1
1984
3
1985
4
1986
1
1987
3
1988
4
1989
3
1990
5
1991
3
1992
1
1993
2
1994
2
1995
4
1996
2
1997
1
1998
2
1999
4
2000
4
2001
4
2002
3
2003
4
2004
5
2005
10
2006
2
2007
3
2008
4
2009
1
2010
5
2011
6
2012
6
2013
1
2014
1
2015
2
2016
4
2017
5
2018
4
2019
4
2020
8
Publisher’s Note: MDPI stays neutral with regard to jurisdictional claims in published maps and institutional affiliations.