1. Introduction
Distinct pressure waves propagate in a tunnel or a station when a high-speed train passes through. These waves travel down the tunnel at the speed of sound and interact with the tunnel walls, train carriages and the platform screen doors (PSDs). The interfering pressures give rise to aerodynamic phenomena, such as the wind pressure loads, pedestrian thermal and pressure comfort micropressure waves, particle diffusion and even safety issues [
1,
2].
PSDs, including the half-height automatic platform screen doors and platform edge doors, are popular in metro stations. They not only isolate passengers from the trains but also improve passengers’ thermal comfort and indoor air quality in the metro station partially or even entirely [
3,
4,
5]. The PSD is a relatively new addition to many metro systems around China, reinforcing the safety measures in train stations. However, the train-induced piston wind-induced effects on these doors require further studies [
6,
7,
8].
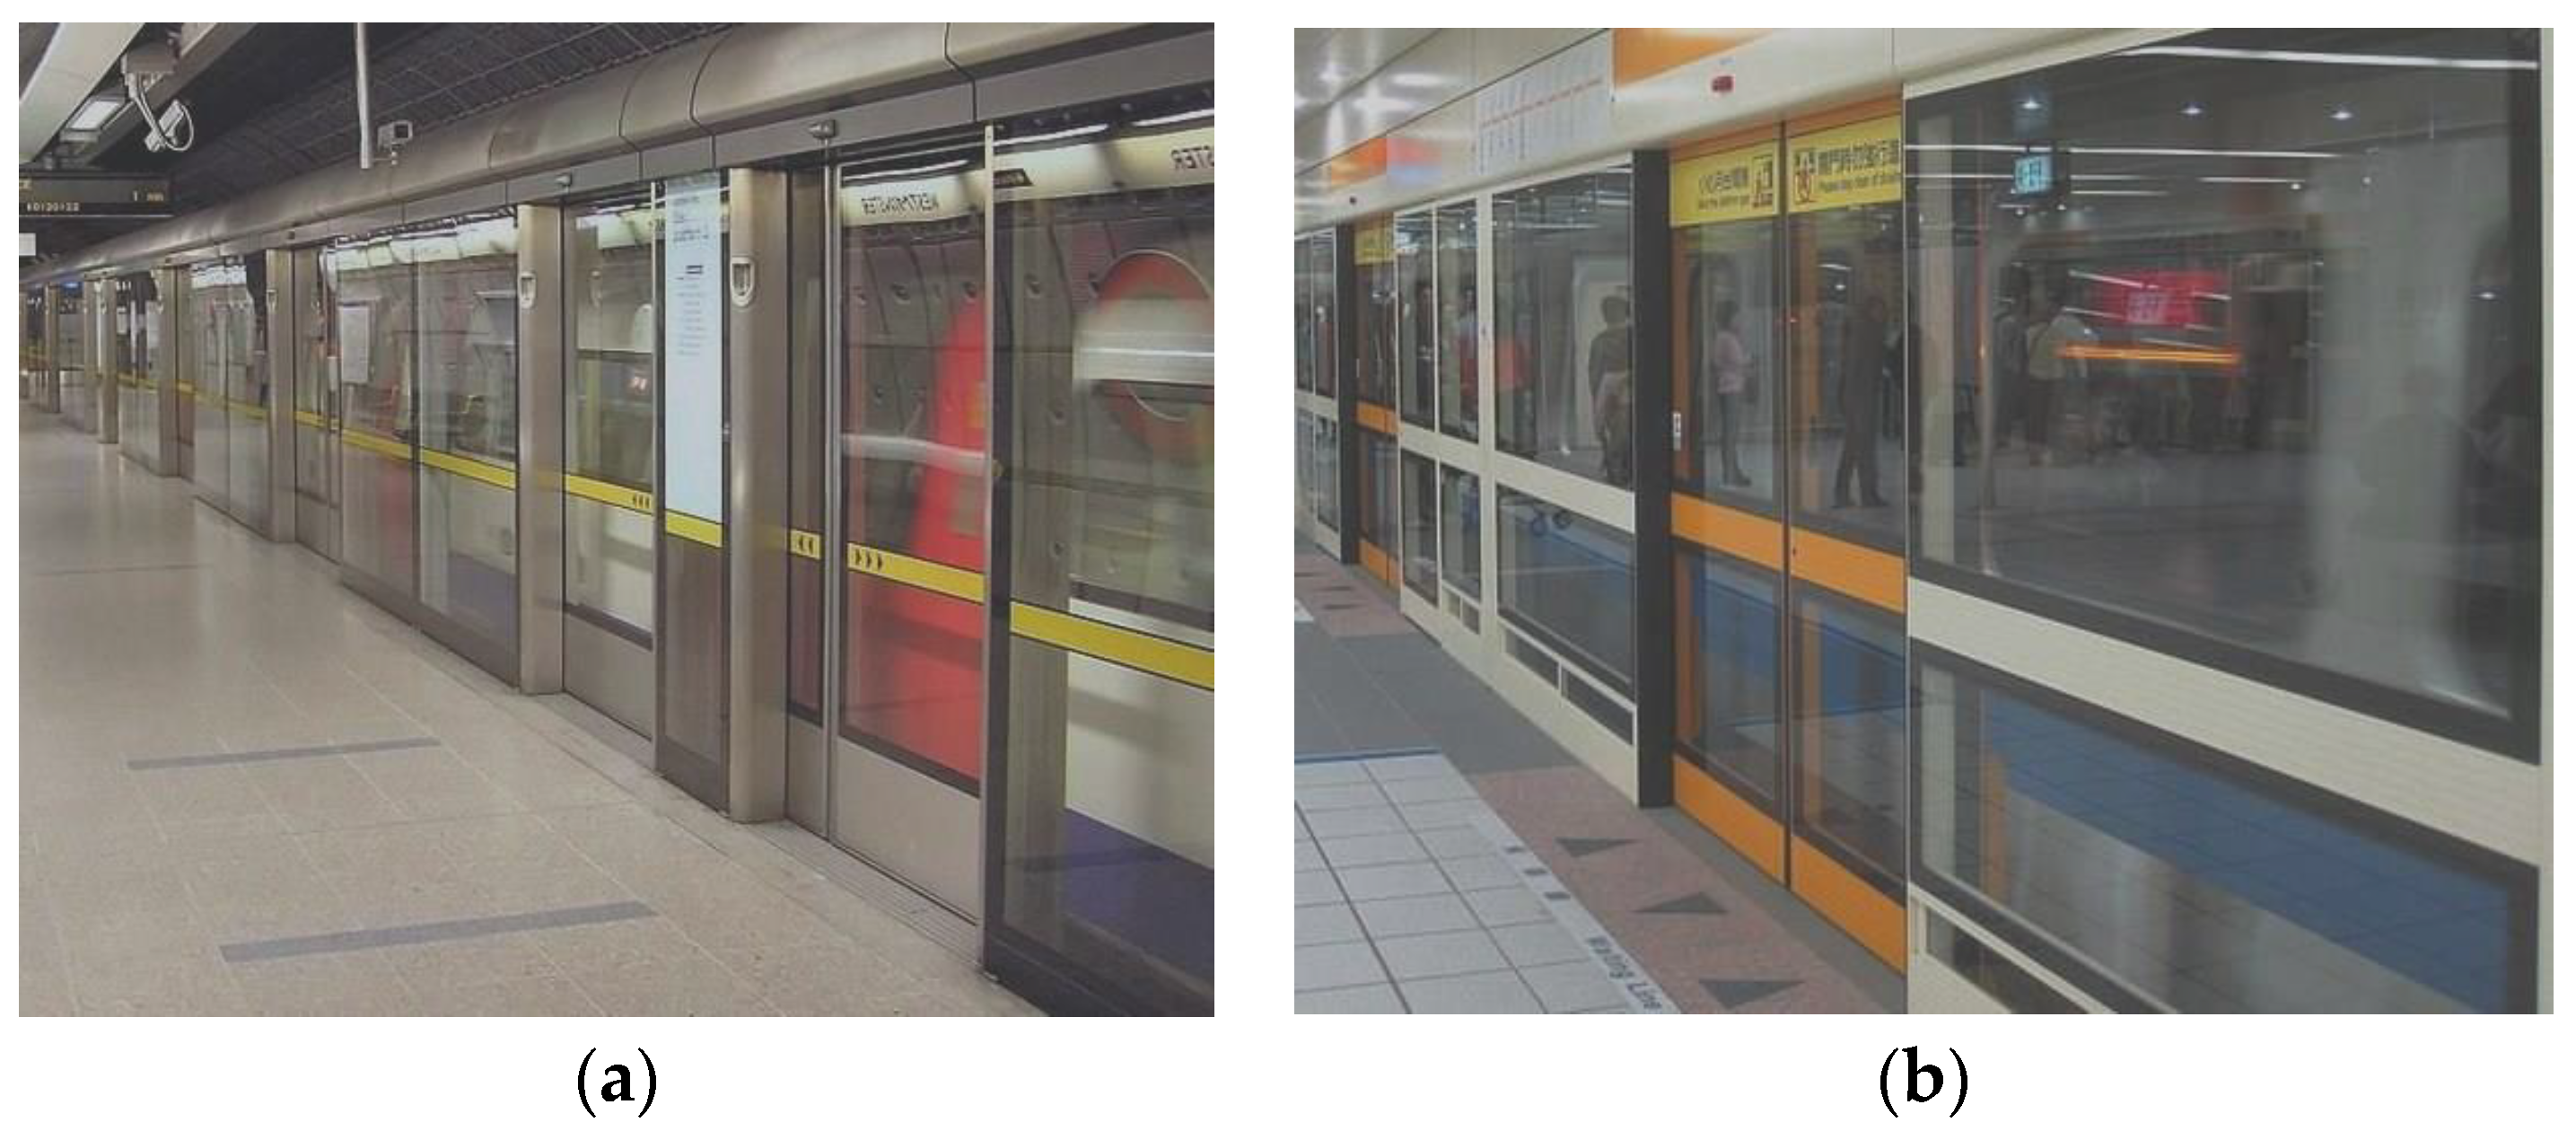
Screen doors are kept closed when nonstop and high-speed trains pass through the station. The micropressure waves would produce significant wind loadings on the PSDs on both sides of the platform. When a train is traveling through the station, the PSDs cannot be opened due to the high wind pressure exerted on the doors. Since the train-induced wind pressure in subways tends to change with train speed, the geometrical parameters of the tunnel section, gaps of PSDs and the induced wind loadings should be estimated for a safe design of the PSDs. On the other hand, there is an exchange of air mass in the tunnel and platform through the tiny gaps between the doors (
Figure 1). The amount of air exchanged can be determined from the pressure difference between the frontal and rear PSD areas [
9,
10]. A combination of the tunnel ventilation, train-induced piston wind, micropositive pressure around platform, ambient wind and other factors may lead to very complicated wind loading and air flow around the PSDs and platform [
11,
12]. Therefore, an investigation on the train-induced air flow in a subway station is essential for optimizing the design of both structural and ventilation systems [
13,
14].
There have been some field studies on the pressure and air flow variations in subway stations [
15], scaled-model wind tunnel tests [
16,
17] and numerical simulations [
18,
19]. With the development of CFD methods and advancement in computer power, it has become possible to use CFD technology to analyze aerodynamic industrial problems in subways [
20,
21,
22,
23]. The CFD community mainly focused on the development of numerical schemes for simulating train-induced air flow in a subway tunnel. They made use of the Reynolds Averaging Navier-Stokes (RANS) method, which consists of the continuity equation, the momentum equation, the energy equation, if necessary, and the turbulence modeling equations, to analyze the flow characteristics. It is generally more suitable for three-dimensional simulation of subway train movements to study the train-induced air flow and temperature distribution under different initial and boundary conditions [
24]. Meanwhile, there are also many studies on the mechanism of the piston wind effects [
25]. Most studies used CFD methods to determine the variation of the piston wind velocity, the pressure and the air volume of the tunnel and the station, with single train or double trains passing each other with various working conditions [
26]. The piston wind effects also have great influences on the air-conditioning system, which is directly related to passenger comfort, air quality and energy cost [
27,
28,
29]. It may be concluded that maximum (positive) and minimum (negative) pressures exist around the PSDs. However, the leakage air flow rate induced by gaps around the PSD have always been ignored in most existing research [
30,
31,
32].
In this study, high-speed-train-induced wind pressure distributions and air leakage effects on the PSDs are evaluated numerically. A full-scale PSD model with a constant gap width is adopted to calculate the air flow field under five different approaching velocities. The corresponding results are used to evaluate the relationship between the air velocity and the pressure difference around the PSDs based on Darcy–Forchheimer’s Law. This relationship is curve-fitted to evaluate the air leakage effects with the porous media method for a wide range of incoming-train speeds. Finally, an equivalent expression is proposed to estimate the pressure difference in the rear PSD area.
2. CFD Methodology
The simulations are carried out by Fluent package 16.1. Three-dimensional, fully turbulent and incompressible flow is chosen as the basic assumptions for the CFD simulation. The calculations are performed by the finite volume method (FVM) approach, and the semi-implicit method for pressure-linked equations (SIMPLE) is adopted for the velocity-pressure coupling algorithm. The spatial flow quantities are discretized by the second-order upwind scheme. The specific governing equations required are given in this Section.
2.1. Turbulence Models
The mean wind effects are considered in this study. The air is assumed to be incompressible ideal gas. The standard
turbulence model is adopted in the turbulence-simulation method. The governing equations of mass, momentum, turbulence and energy are presented as [
32]:
All fluid properties are functions of space coordinates and time, and they are written as , , and (), with ,= for the air density, pressure, temperature and the velocities, respectively. Variables , , and are the internal energy, internal energy dissipation function, turbulence kinetic energy and turbulence kinetic energy dissipation, respectively. u is
2.2. Numerical Model and Boundary Conditions
Many PSD gaps exist in the structural connection parts of PSDs. When air flows penetrate through these gaps, they always experience a sudden compression, resulting in local pressure loss. The PSD gaps are usually very small and distributed around the PSDs, as shown in the
Figure 2, and are therefore difficult to measure directly. Several millimeters of the PSD gaps are set in field measurement. To avoid the train-induced vibration of the PSDs and practical installation errors, we adopted 0.0043 m (along x-direction) as the gap width w, which is uniform along the sliding PSD’s edges.
The other dimensions of a practical numerical PSD model are also given in
Figure 2. The height (along the y direction, H) and width (along the z direction, W) of the model are 1.871 m and 3.005 m, respectively. Additionally, the thickness is 0.1 m (along the x-direction,
). The length of the frontal and rear PSD areas are named L1 and L2 individually, and they are both taken as 10 times the H value to ensure a clear region of the air leakage effects. The atmospheric conditions surrounding the PSD are assumed to be uniform with constant air pressure. Air, which is allowed to pass through the PSD gaps, is also assumed to obey the perfect gas equation of state. The whole computational domain is a three-dimensional rectangular enclosure of size 37.4 m (length of the domain, L) × 1.871 m (H) × 3.005 m (W), as depicted in
Figure 3a.
The boundary conditions of the flow domain are listed as
Table 1. The pressure-inlet boundary condition is used to define the inflow mass air and turbulence quantities at the inflow position, as shown in
Figure 3b. The four boundary surfaces of the flow domain are named the top, side (left and right) and ground wall separately, and they are modeled with slip-boundary conditions. The pressure-outlet boundary conditions are adopted for the outflow of the domain separately. The no-slip boundary condition is used at the PSD walls. Accurate calculations in the near-wall region with very high flow gradients are paramount to the success of the simulation. Wall functions utilize the predictable dimensionless boundary layer profile when the centroid of the wall-adjacent mesh cell is located in the log-layer. Wall functions usually have a 30 < y+ < 300. In this simulation, the y+ value is about 45.1, where the velocity is set to 0 m/s and turbulence quantity values are set at the first node adjacent to the surface using the standard wall functions.
2.3. Grid Independence
Three structured grid plans, namely, the meshes G1, G2 and G3 as listed in
Table 2 with different resolutions, are analyzed to examine the grid independence property of the problem studied. An O-type hexahedron-structured grid is applied in the above three mesh schemes, as shown in
Figure 4. Attention is focused on the grid size along the PSD gap width and length directions (Δy and Δz). Therefore, the domain is divided uniformly into 400 grid points for all the three meshes in the x direction. The gap between the walls and PSDs is discretized into Ny × Nz = 82 × 6, 120 × 10 and 210 × 10 grid points, respectively, for G1, G2 and G3 schemes. The first layer grid distance Δx equals 4 × 10
−4 m for G1 and 1 × 10
−3 m for G2 and G3, which is smaller than the empirical limiting value of
.
The grid sensitivity analysis results are shown in terms of wind velocity in the rear PSD area. It is noted that the air leakage effects caused by the PSD gaps are almost insensitive to the different mesh schemes. Therefore, the G2 mesh scheme shown in
Figure 4 is chosen to study the effect of large gradients of the flow quantities that are expected to occur around the gaps.
3. Porous Media Models
The porous media method, taking a form of a source of mass forces, is added to the source term of momentum Equation (1) to express additional flow resistance. This source term can be described by Darcy’s law, which corresponds to momentum losses due to fluid viscosity, or by Forchheimer’s law, which considers momentum losses due to fluid viscosity and inertia simultaneously [
33].
The PSD with gaps can be treated as one kind of porous medium. The mass flow rate (air velocity) passing through a vertical plate with penetrated gaps was calculated, and this study has been extended to a variety of porous media cases. The porous media theory adds a momentum source term
SM to the governing Equation (1) as:
where
, denoting source of forces, is the source term for the
(
= x, y or z) momentum equation. This source term is composed of two terms. The first one on the right-hand side of Equation (2) is the viscous loss term, and the other one is the inertial loss term.
is the
jth component of velocity [m/s].
is the velocity magnitude.
and
are the coefficient matrices of viscous loss and inertial loss terms, respectively.
is the thickness of the porous media.
is the dynamic viscosity coefficient [kg/(m.s)].
In this study, simple homogeneity is assumed for the porous medium, and Equation (2) can be simplified as [
34]:
where
is the permeability of the medium and
is the pressure-jump coefficient. Both of them are adopted to replace
and
, respectively.
is the thickness of the PSD with gaps, which is treated as a porous media.
PSDs always have a constant finite thickness, over which the pressure difference can be defined by a combination of Darcy–Forchheimer’s Law and an additional inertial loss term according to Equation (3) along the streamwise direction, as:
where
is the velocity normal to the porous medium surface.
In the porous media model, pressure p and velocity u are calculated independently, whereas p comes from Equation (1) only and u is derived from Equation (4). The corresponding averaged flow quantities are achieved using the source term scheme.
When the PSD gap dimensions are known beforehand, the coefficients and can be determined by curve-fitting the pressure–velocity data obtained from the CFD analysis under different approaching inflow conditions, as discussed in the following section.
4. Results and Discussions
The full-scale models described above are subjected to various inflow conditions to obtain the relation between the pressure differences and velocities via CFD simulation.
4.1. Prediction of Pressure Distribution and Wind Field around PSDs with the Full-Scale Model
The cases studied are given in
Table 3, with the wind pressure-inflow conditions of 30 Pa, 40 Pa, 50 Pa, 60 Pa and 70 Pa, which are named cases CF1, CF2, CF3, CF4 and CF5, respectively. The pressure distributions on the PSDs are shown in terms of the pressure coefficient
as:
where
is the static pressure on the surface of the PSD,
is a reference pressure and
ue is the area-averaged wind velocity at the PSD gaps. The CFD results in
Figure 5 show that the coefficient
on the windward surface has a peak at the middle of the surface and decreases gradually and slowly. Different inflow conditions seem not to have a significant effect on the pressure distributions on the PSDs.
Experimental and numerical investigations [
22] have revealed that the entrance losses and compressibility effects can be neglected when
, where
is the pressure in the frontal area and
Pr is the pressure in the rear area. Both of them are shown in
Figure 6. The pressure distributions are similar for the five different inflow conditions. The only difference is in the frontal area, where the pressure magnitude varies from about 91 Pa to 130 Pa. The corresponding pressure difference generated around the PSD gaps are from about −137 Pa to about −174 Pa, as given in
Table 3.
It can be clearly noted that air is pulled into the platform through the PSD gaps, with positive pressure occurring in the frontal PSD area, while negative pressure occurs in the rear area. This pressure difference generates a positive pressure gradient, accelerating the air flow in the form of a jet flow projecting from the frontal PSD area into the rear area after passage of the train. That means the surrounding air is sucked into the platform through the PSD gaps, accompanied by a slow increase in the size of the jet flow domain. A high-velocity region around the gaps is therefore formed in the rear PSD area.
The flow fields arising from several inflow boundary conditions are discussed below. A sample region of the flow field is given in
Figure 7, showing contours of the wind velocity and streamlines near the PSD gap region of the flow domain. The leakage air velocity of the full-scale model ranges from −8.81 m/s to −10.11 m/s, as given in
Table 3. Several recirculating bubble-type separation regions are generated, which reattach to both the frontal and rear areas of the PSDs. The recirculation region in the rear PSD area becomes larger as the inflow increases. This is because there exist complicated interactions between the vortex in the frontal PSD area and the recirculation flow generated in the rear area. The recirculation area in the rear PSD area extends toward the outflow boundary surface with increasing inflow conditions. It can be seen clearly that the flow fields do not vary significantly with the five different inflow conditions. The maximum velocity occurs in the rear PSD area within the recirculation bubbles.
4.2. Prediction of Pressure Distribution and Wind Field around PSDs with the Porous Media Model
The coefficient
and
in Equation (3) are fitted by the CFD results of the full-scale PSD gap model as:
By introducing the above coefficients into Equation (3), the pressure difference between the frontal and rear PSD area, which have constant thickness and width of the PSD gaps, can be calculated. The leakage air velocity of the porous media model ranges from −6.49 m/s to −8.03 m/s, as given in
Table 4. The corresponding pressure difference generated around the PSD gaps are from about −70.0 Pa to about −107.7 Pa, as given in
Table 4, which are named cases CP1, CP2, CP3, CP4 and CP5, respectively.
To prove the accuracy of this porous media model, a curve-fitting expression from the data of the full-scale model and the data from the full-scale model are compared with the data from the porous media model and are presented in
Figure 8. Additionally, they are shown in black, red and blue lines, respectively. It can be seen that the maximum pressure difference between the porous media model and the full-scale model is around 9.8%. It can be concluded that the prediction from the porous media model may be considered accurate enough compared to that from the full-scale model.
The turbulent kinetic energy (TKE) distributions from the porous media model in the frontal and rear PSD areas are shown in
Figure 9. The TKE distributions are also similar to each other under the five inflow conditions. The TKE in the rear area varies from about 8.2 m
2/s
2 to 9.8 m
2/s
2, with a trend similar to that of the pressure distribution.
Figure 9 also shows that the TKE gradually increases with the inflow velocity.
4.3. Prediction of Pressure Difference around PSD Gaps with the Equivalent Model
Substituting coefficients
and
C2 into Equation (3), the equivalent model of PSD with gaps is given as:
This model can be used to estimate the pressure difference in the frontal and rear PSD area. It is noted from Equation (7) that the inertial forces contribute much more than the viscous forces. That means the pressure difference is strongly dependent on the inertial effects due to the air leakage velocity at the PSD gaps when
. The pressure difference expression can then be approximated as:
Equation (8) provides an equivalent expression to predict the pressure drop in the frontal and rear PSD areas when train-induced air leakage happens. CFD simulations also give the leakage air velocity from −8.81 m/s to −10.11 m/s. The corresponding pressure differences generated around the PSDs are given in
Figure 10. The curve-fitting expression from the data of the full-scale model matches the porous media model well, indicating that the viscosity force can be neglected.
5. Conclusions
Both the pressure distributions on PSDs and the air flow through the PSD gaps are examined. Two different, but related, models are studied, i.e., a full-scale model of the leakage mass flow rate through the gaps and the porous media model which can be used to predict air leakage effects simply and accurately. The following observations are noted:
Detailed distributions of the time-averaged velocities, streamlines and pressure coefficients around and on the PSDs under different inflow conditions were developed with the CFD method. When a train approaches PSDs on the platform, air is pushed out of the tunnel through the PSD gaps. The air flow is driven directly onto the PSDs, and the thin jet flow through the gaps is changed into the suction flow. The mass flow rate of air is pulled into the platform, with the maximum amount in the pedestrian area. Two pairs of recirculation vortexes are formed in both of the train area and pedestrian area, with the peak wind velocity and pressure located in the region near the doors.
Generally, the steady RANS CFD simulation matches well with the velocity and pressure around the PSDs from the full-scale model. The coefficients of the porous media model are obtained from the CFD results of the full-scale model, of which the maximum deviation of pressure difference compared to the full-scale PSD gap model is quite small. Moreover, five other calculation cases show that modeling air leakage effects by the porous media model is a simple and high-precise method. The maximum difference of fitting function is also less than 10%. Moreover, it is found that in the porous media model, the inertia forces dominate compared to the viscosity forces. Therefore, an equivalent expression can be proposed, considering only the inertial forces to evaluate the pressure difference in the rear PSD area.
Darcy–Forchheimer’s law gives better results for the whole range of flow through PSDs. When the Reynolds number is large, the contribution of the nonlinear term becomes significant. However, with decreases in the Reynolds number, linear models could be successfully applied. To achieve reliable pressure-drop values, it is imperative to conduct enough field measurements of different penetration velocities through the gaps. It is obvious that the longest possible measurement time period could result in accurate pressure-drop values. It is also essential to carefully measure pressures, which could give great emphasis on permeability coefficients. Future work will focus on the development of more field experiments combined with various gap dimensions and verify the permeability coefficients of the proposed model.
Author Contributions
Conceptualization, Q.Y. and Q.L.; methodology, J.Z.; simulation, J.W.; validation, J.Z. and Q.Y.;formal analysis, Q.L.; writing—original draft preparation, J.Z.; writing—review and editing, Q.Y.and Q.L.; funding acquisition, J.Z. All authors have read and agreed to the published version of the manuscript.
Funding
The work was funded by the National Natural Science Foundation of China (51578059) and the 111 project (B13002).
Institutional Review Board Statement
Not applicable.
Informed Consent Statement
Not applicable.
Data Availability Statement
Not applicable.
Acknowledgments
The comments and efforts made by Professor S.S. Law in improving the paper are well acknowledged.
Conflicts of Interest
The authors declare no conflict of interest.
References
- Cardillo, L.; Corsini, A.; Delibra, G.; Rispoli, F.; Sheard, A.G. A Numerical Investigation into the Aerodynamic Effect of Pressure Pulses on a Tunnel Ventilation Fan. Proc. Inst. Mech. Eng. Part A J. Power Energy 2014, 228, 285–299. [Google Scholar] [CrossRef]
- Anderson, D. Improving Safety of the Platform-Train-Interface through Operational and Technical Mitigation Strategies. Master’s Thesis, Oregon State University, Corvallis, OR, USA, 2015. [Google Scholar]
- Yin, K.C. Research on the Impact of the Automatic Sliding Door and Platform Screen Door with Vents Upon the Station Environment in the Side-Platform Station. Master’s Thesis, Tianjin University, Tianjin, China, 2008. [Google Scholar]
- Zhang, Y.; Li, X. Research on Airflow and Energy Performance in PBD, PSD and PBD-PSD-Combined Environment Control Systems in Subway. Sustain. Cities Soc. 2018, 42, 434–443. [Google Scholar] [CrossRef]
- Dong, S.Y. Piston Effect on the Subway Station and Its Utilization in the North of China. Master’s Thesis, Tianjin University, Tianjin, China, 2008. [Google Scholar]
- Wang, L.H. The Piston Action Wind and the Subway Energy Saving. Master’s Thesis, Tongji University, Shanghai, China, 2007. [Google Scholar]
- Liu, S.; Luo, Z.; Zhang, K.; Hang, J. Natural Ventilation of a Small-Scale Road Tunnel by Wind Catchers: A CFD Simulation Study. Atmosphere 2018, 9, 411. [Google Scholar] [CrossRef] [Green Version]
- Teodosiu, C.I.; Kubinyecz, V.F. Numerical Study on the Impact of Platform Screen Doors in a Subway Station with a Train on Fire. Appl. Sci. 2022, 12, 8296. [Google Scholar] [CrossRef]
- Zhou, D.; Tian, H.; Zhang, J.; Yang, M. Pressure Transients Induced by a High-Speed Train Passing through a Station. J. Wind Eng. Ind. Aerodyn. 2014, 135, 1–9. [Google Scholar] [CrossRef]
- Connor, P. A Review of Platform/Train Interface Protection Systems on Railways. Railway Technical Web Pages. Available online: www.railway-technical.com/Infopaper%201%20Platform%20Protection%20Systems%20v3.pdf (accessed on 27 June 2015).
- Zhang, L.; Yang, M.; Liang, X.; Zhang, J. Oblique Tunnel Portal Effects on Train and Tunnel Aerodynamics Based on Moving Model Tests. J. Wind Eng. Ind. Aerodyn. 2017, 167, 128–139. [Google Scholar] [CrossRef]
- Hur, N.; Kim, S.-R.; Kim, W.; Lee, S. Wind Pressure Transients in the Tunnel inside a Station Caused by a Passing High Speed Train. KSME Int. J. 2004, 18, 1614–1622. [Google Scholar] [CrossRef]
- Wang, C.; Li, Q. Numerical Simulation of Air Distribution of Different Ventilation Strategy Designed for Environmental Control of Metro Station. China Railw. Sci. 2007, 28, 93–98. [Google Scholar]
- Saarinen, P.; Kalliomaki, P.; Koskela, H.; Tang, J.W. Large-Eddy Simulation of the Containment Failure in Isolation Rooms with a Sliding Door—An Experimental and Modelling Study. Build. Simul. 2018, 11, 585–596. [Google Scholar] [CrossRef] [PubMed]
- De Ana Rodríguez, G.; Seriani, S.; Holloway, C. Impact of platform edge doors on passengers’ boarding and alighting time and platform behavior. Transp. Res. Rec. 2016, 2540, 102–110. [Google Scholar] [CrossRef]
- Gai, G.; Cancelliere, P. Design of a Pressurized Smokeproof Enclosure: CFD Analysis and Experimental Tests. Safety 2017, 3, 13. [Google Scholar] [CrossRef]
- Ke, M.-T.; Cheng, T.-C.; Wang, W.-P. Numerical Simulation for Optimizing the Design of Subway Environmental Control System. Build. Environ. 2002, 37, 1139–1152. [Google Scholar] [CrossRef]
- Faramehr, S. Aerodynamic of the Trains in Tunnels. Master’s Thesis, University of Birmingham, Birmingham, UK, 2014. [Google Scholar]
- Kim, J.Y.; Kim, K.Y. Experimental and Numerical Analyses of Train-Induced Unsteady Tunnel Flow in Subway. Tunn. Undergr. Sp. Technol. 2007, 22, 166–172. [Google Scholar] [CrossRef]
- Kim, J.Y.; Kim, K.Y. Effects of Vent Shaft Location on the Ventilation Performance in a Subway Tunnel. J. Wind Eng. Ind. Aerodyn. 2009, 97, 174–179. [Google Scholar] [CrossRef]
- Belleudy, C.; Kayello, A.; Woloszyn, M.; Ge, H. Experimental and Numerical Investigations of the Effects of Air Leakage on Temperature and Moisture Fields in Porous Insulation. Build. Environ. 2015, 94, 457–466. [Google Scholar] [CrossRef]
- Khayrullina, A.; Blocken, B.; Janssen, W.; Straathof, J. CFD Simulation of Train Aerodynamics: Train-Induced Wind Conditions at an Underground Railroad Passenger Platform. J. Wind Eng. Ind. Aerodyn. 2015, 139, 100–110. [Google Scholar] [CrossRef]
- Yan, X.; Tao, L.; Peng, J.; Zeng, Y.; Fang, Y.; Bai, Y. Behavior of piston wind induced by braking train in a tunnel. Energies 2020, 13, 6420. [Google Scholar] [CrossRef]
- Pflitsch, A.; Brüne, M.; Steiling, B.; Killing-Heinze, M.; Agnew, B.; Irving, M.; Lockhart, J. Air Flow Measurements in the Underground Section of a UK Light Rail System. Appl. Therm. Eng. 2012, 32, 22–30. [Google Scholar] [CrossRef]
- Gilbert, T.; Baker, C.; Quinn, A. Aerodynamic pressures around high-speed trains: The transition from unconfined to enclosed spaces. Proc. Inst. Mech. Eng. F J. Rail Rapid Transit. 2013, 227, 609–622. [Google Scholar] [CrossRef]
- Ding, L.X.; Huang, H.J.; Zeng, X.J. Analysis of Indoor Air Parameter Index for Air-Conditioning Passenger Subway Train. Urban Mass Transit 2003, 6, 61–64. [Google Scholar]
- Krasyuk, A.M. Calculation of Tunnel Ventilation in Shallow Subways. J. Min. Sci. 2005, 41, 261–267. [Google Scholar] [CrossRef]
- Juraeva, M.; Lee, J.; Song, D.-J. A Computational Analysis of the Train-Wind to Identify the Best Position for the Air-Curtain Installation. J. Wind Eng. Ind. Aerodyn. 2011, 99, 554–559. [Google Scholar] [CrossRef]
- Li, J.; Peng, H.; Li, S.J. Numerical Simulation of Flow Characteristics in Bi-Directional Subway Tunnel. J. Therm. Sci. Technol. 2006, 5, 331–334. [Google Scholar]
- Bopp, R.; Hagenah, B. Aerodynamics, Ventilation and Tunnel Safety for High Speed Rail Tunnels. In Workshop Tunnels Technical; FEUP: Porto, Portugal, 2009. [Google Scholar]
- Eckford, D.C.; Pope, C.W.; Owoeye, A.; Henson, D.H. The Ventilation of Metro Systems with and without Full Height Platform Screen Doors. In Proceedings of the Eleventh International Symposium on the Aerodynamics and Ventilation of Vehicle Tunnels, Luzern, Switzerland; 2003; pp. 701–713. [Google Scholar]
- Versteeg, H.K.; Malalasekera, W. An Introduction to Computational Fluid Dynamics, 2nd ed.; Pearson Education Limited: Edinburgh Gate, UK, 2007; p. 50. [Google Scholar]
- Jambhekar, V.A. Forchheimer Porous-Media Flow Models-Numerical Investigation and Comparison with Experimental Data. Master’s Thesis, Stuttgart University, Stuttgart, Germany, 2011. [Google Scholar]
- Winter, R.; Valsamidou, A.; Class, H. A Study on Darcy versus Forchheimer Models for Flow through Heterogeneous Landfills including Macropores. Water 2022, 14, 546. [Google Scholar] [CrossRef]
| Publisher’s Note: MDPI stays neutral with regard to jurisdictional claims in published maps and institutional affiliations. |
© 2022 by the authors. Licensee MDPI, Basel, Switzerland. This article is an open access article distributed under the terms and conditions of the Creative Commons Attribution (CC BY) license (https://creativecommons.org/licenses/by/4.0/).


