Article

Physical and Chemical Characteristics of Dew and Rain in North-West Africa with Focus on Morocco: Mapping Past and Future Evolution (2005–2100)

1
Paolitech Engineering School, Università di Corsica Pasquale Paoli, Avenue du 9 Septembre, BP 52, 20250 Corte, France
2
OPUR, Organisation pour l’Utilisation de la Rosée, 2 rue Verderet, 75016 Paris, France
3
Department of Geography, Université du Québec à Montréal, Montréal, QC H3C 3P8, Canada
4
Physique et Mécanique des Milieux Hétérogènes, CNRS, ESPCI Paris-PSL University, Sorbonne Université, Sorbonne Paris Cité, 10 rue Vauquelin, 75005 Paris, France
*
Author to whom correspondence should be addressed.
Atmosphere 2022, 13(12), 1974; https://doi.org/10.3390/atmos13121974
Submission received: 17 October 2022 / Revised: 16 November 2022 / Accepted: 20 November 2022 / Published: 25 November 2022
(This article belongs to the Section Climatology)

Abstract

:
In the context of global warming and a reduction in fresh water availability, this study presents the evolution of dew, rain and evapotranspiration in the North-West (NW) of Africa. This study is followed by a chemical analysis of dew and rain data in a representative site. The time periods are concerned with the years 2005–2020 using existing data, and years 2020–2100 using the low and high emissions representative concentration pathway scenarios RCP 2.6/8.5 from the coordinated regional climate downscaling experiment database. A continuous decrease in rain precipitation is observed, on the order of −14 mm·decade−1 for the more credible scenario RCP 8.5. The amplitude is maximum on the coast and on the foothills of Atlas. A clear decrease in dew yields (up to 7%) is also observed along a NW/SE axis. It is strongly correlated with a corresponding decrease in relative humidity. Chemical dew and rain data in the representative site of Mirleft correspond to the major cations of Na+ > Ca2+ > Mg2+ > K+, similar to local spring water. The concentrations in rain are about two times less than in dew water. Ionic concentrations are compatible with the World Health Organization standards. The seasonal variations of the ionic concentrations in dew and rain follow a volume dilution dependence. In the future, the expected diminution in dew and rain volumes according to the RCPs 2.6 and 8.5 should increase the dew and rain ionic concentrations.

Graphical Abstract

1. Introduction

North Africa is considered a hot spot for climate change. Northwest Africa (Morocco, the Canary Islands, West Algeria) is an area highly vulnerable to extreme precipitation events [1]. Schilling et al. [2] demonstrated the vulnerability of this part of the world with regard to proven climate change. The combination of climate change and strong population growth is very likely to further aggravate the already scarce water situation. In Morocco, Schilling et al. [3] show that the precipitations are likely to decrease between 10 and 20% by 2050 while temperatures are likely to rise between 2 and 3 °C. Terink et al. [4] considered this part of Africa as the most water-scarce region of the World. With nine global circulation models, they investigated two meteorological future periods up to 2050 by comparison with the current climate. The simulations exhibited a large decrease of yearly precipitation (15–20%) for the majority of the country. Tahiri et al. [5] have demonstrated the first impacts of climate change on rainfall in Morocco. Based on past meteorological data, the length of the rainy season was significantly reduced, with a belated beginning in October and an early end around the beginning of March. Less rainfall in spring has been analyzed by Chergui et al. [6] as a contributor to increased wildfire occurrences. Choukri et al. [7] estimated the impacts of climate and land use changes on water availability for a water supply reservoir in Northern Morocco. The combination of climate and land uses scenarios should lead to a reduction in annual water availability of −37% to −24%. They demonstrated that water shortages will increase in the coming decades. Using both Representative Concentration Pathways scenarios RCP2.6 and 6.0, Seif-Ennasr et al. [8] found a precipitation reduction for Morocco, 10 to 30% for the period 2030–2049 and up to 60% for 2080–2099. The simulation results indicated that water deficit at a basin level will likely triple towards 2050 due to increase in water demand and decrease in aquifer recharge and dam storage.
Concerning the Mediterranean Basin, which includes the Northern part of Morocco, Lefebvre et al. [9] reported that the water deficit will increase heterogeneously across the basin. Moreover, the authors concluded that wetland degradation is expected to concern 73% of localities in 2100 under RCP8.5. In other works by Tramblay et al. [10] about drought in the Mediterranean region, model experiments were developed on future climate; increased frequency and severity of droughts in these regions were confirmed. According to Maras et al. [11], the Mediterranean Basin will know a general decrease of mean precipitation. Values up to 25% are seen at a yearly scale in South-West Sardinia. Following this study, such changes affect the hydrologic cycle with a decrease of mean stream flow ranging from −18% to −25% and runoff deceasing from −12% to −18%, except in spring, when runoff is projected to increase by 20–30%.
Using RCP 2.6 and 6.0 for Europe, Grillakis [12] showed that Europe and the Mediterranean regions will be affected by severe and extreme soil moisture droughts under climate change. Using a K-Means clustering analysis on a long-term future (2081–2100), Carvalho et al. [13] concluded to a systematic and significant decrease in precipitation and regions such as northern Africa and Europe, with, however, Greenland showing an increase.
Morocco receives a yearly rainfall of 140 billion m3 over its whole territory. The potential of water resources is estimated to be 22 billion m3 (18 billion m3 from surface water and 4 billion m3 from groundwater). This volume corresponds to around 700 m3/inhabitant/year, which places Morocco in a situation of structural water stress [13]. According to Werz et al. [14], climate change and water resource scarcity can lead to population conflicts or migration in Northwest Africa in the near future. This region presents a particular challenge [15] with regards to transboundary—or cascading—climate risks, particularly given its high level of water stress and the importance of water in several key sectors and systems in the region.
In contrast, dew water exhibits a frequent occurrence in many geographical locations. It is indeed less constrained by specific climatological and geographic conditions than other meteorological phenomena such as fog [16]. It is mostly dependent on certain common atmospheric conditions frequently found in Morocco during night, such as high relative humidity, low wind speed and little cloud cover facilitating efficient radiative cooling of the earth surface and the adjacent air (see, e.g., [16]). The first studies concerning dew (with rain and fog) were carried out in Morocco by Lekouch et al. [17]. Collection systems were implemented in the southwestern Morocco (Mirleft and Id Ouasskssou), a representative site of arid environment, for one year (1 May 2007 to 30 April 2008). The interest of passive radiative cooling to extract water from the atmospheric air was demonstrated. The dew potential resource was extrapolated in several cities throughout Morocco during the dry season (May–October 2008). The authors also carried out in the representative site of Mirleft the first chemical and biological study of dew and rain samples. They concluded to a large concentration of total dissolved solids in dew samples due to the deposition of marine salts and aerosols.
In view of the probable decrease in rainwater resources in the next decades, it becomes essential to precisely evaluate the potential evolution of all atmospheric water resources. In this context, it is the object of this paper to map the past and future evolution of dew, rain and evapotranspiration over this century. For this purpose, meteo data are used for rain and evapotranspiration. Dew was calculated from a formulation [16,18] which needs only a small amount of meteo data. The study deals firstly with the past period 2005–2020 using meteo data recorded on several sites and secondly with the period 2020–2100 with data from two RCP scenarios, RCP 2.6 and RCP 8.5 [19,20,21,22]. They correspond to climate simulations from the Météo-France model CM5-ALADIN63 (CM5: Coupled Model Intercomparison Project phase 5; ALADIN: Aire Limitée Adaptation Dynamique Développement InterNational) of the CNRM (Centre National de Recherches Météorologiques). The files are downloaded from the Coordinated Regional Climate Downscaling Experiment (Cordex) database [23].
Chemical data of the representative site of Mirleft (Morocco) are also reported to serve as a reference for future studies dealing with the evolution of the chemical properties of dew and rain. Data were already obtained by Lekouch et al. [24], but they are here analyzed differently in view of their future evolution within the RCP predictive models. For instance, one analyzes the air flux backward trajectories and the seasonal variations.
The paper is organized as follows. One first details the methods used for evaluating the past and future rain, dew and evapotranspiration. Next, the results are presented and discussed with maps giving the volume and the frequency of dew and rain events. Evapotranspiration is also analyzed together with its evolution. A specific section is then devoted to dew and rain chemistry.

2. Meteorological Data and Methods

2.1. Studied Area

The study area (NW of Africa; Figure 1) is characterized by Morocco and a part of desert and coastal Algeria. It represents about 710 × 850 km2 between 20° to 36° north latitude and 0° to 17° for west longitude. According to Beck et al. [25], the country exhibits 8 different climates according to the Köppen-Geiger classification (Figure 1). Both prevalent climates are arid hot desert (BWh) and temperate (Csa) with dry and hot summer. BWh climate is mainly located in the south-west and east of the country (Sahara Desert) while the Csa climate is located mainly in the north and north-west of Morocco. Next comes the cold desert (BWk) on the highlands close to the border with Algeria and the hot arid steppe (BSh) near the Atlantic Ocean coast in the middle of the country. The Atlas Mountains are mainly marked by a cold dry and warm (Dsh) or cold (Dsc) summer. Finally, polar tundra (ET) is found at a very high elevation.
The climate is characterized by pronounced spatial and temporal differences in day and nighttime temperatures, humidity or rainfall. The plains in the north Atlantic experience a Mediterranean climate with oceanic influence. Summer is dry and sunny, but this does not prevent the existence of dew at night, quite frequent during this period. The cumulative yearly precipitation ranges between 450 mm (Casablanca) to 810 mm (Tanger).
From Safi to the south of Agadir (Doukkala plain, Essaouira coast and the Souss basin), the climate is characterized by an increasing aridity when going south, due to the Sahara influence. The mean yearly cumulative rainfall is 400 mm in Safi, 300 mm in Essaouira and 270 mm in Agadir. The rainy period is less than six months and is mainly concentrated between November and March. On the North Atlantic coast, morning fogs and nightly dews are frequent. The number of clear, sunny days (200 per year in Agadir) is exceptionally high.
The highlands area forms a crescent stretching from Fez in the northeast to Marrakech in the southwest. It includes the plains and plateaus of Saïss, Chaouia, Abda and Haouz. The climate is essentially a degradation of the two previous climates with a relatively marked continentality. This area could be divided in two parts, a semi-arid region in the south and a more humid area in the north. Fès and Meknes receive between 500 and 600 mm of rain per year; this quantity drops drastically, below 350 mm, in south of Settat with in particular 280 mm in Marrakech. The continentality of this region has two consequences: Low air humidity and important daily and yearly thermal amplitudes.
The Mediterranean coast and the Rif (with elevation over 2000 m asl) exhibits typically a Mediterranean climate on the coast with a mild winter (9–12 °C), moderately watered, coupled with a hot, dry summer (24–26 °C). In the hinterland reliefs, precipitations can reach a maximum of over 1500 mm per year with snow and cold temperatures in winter.
The Middle and High Atlas form a mountain range oriented south-west north-east, with elevation ranging from 2500 m to 4165 m. The highest point is Jebel Toubkal (4165 m), the highest peak in North Africa. It forms a barrier between a Mediterranean Morocco and a Morocco-Algeria desert. The climate is mountainous in the central part of the chain. If the Middle Atlas receives between 1000 and 1500 mm of precipitation on average per year, the High Atlas receives only 600 to 900 mm, or even less on the slopes (400–500 mm).
The climate is desert in the foothills of the Sahara of the Middle Atlas and the High Atlas, with mountain influences given the elevation, as well as in the Anti-Atlas, which is the northernmost diversion of the Moroccan Atlas. The area receives between 100 and 200 mm of precipitation (120 mm in Ouarzazate). The average temperatures are much contrasted, between 6 and 11 °C in winter and 27 to 32 °C in summer. In Ouarzazate the minimum and maximum average temperatures are 1 °C and 17 °C, respectively, during the coldest winter month and 21 °C and 40 °C during the hottest summer months.
The Sahara Desert is located in the south of the Atlas Mountains. The climate is typically arid desert, with very rare precipitation, long and torrid summers, mild and pleasant winters. Rainfall is almost absent all year round, with much less than 100 mm per year (61 mm in Zagora, 59 mm in Merzouga, 33 mm in Dakhla). The average minimum and maximum temperatures are 3.8 °C and 20.8 °C, respectively, during the coldest month of winter and 25.7 °C and 44.3 °C during the hottest month of summer in Zagora, whose elevation is almost 700 m asl.

2.2. Data Extraction

2.2.1. Measured Data (Years 2005–2020)

All weather stations used in this study are installed at international or national airports. Typical meteorological parameters are systematically measured according to the standards of the World Meteorological Organization. Air temperature (Ta, °C), relative humidity (RH, %), and atmospheric pressure (p, Pa) are measured in a meteorological shelter, 1.5 m from the ground. Wind speed (V, km·h−1, to be transformed in m·s−1) and direction (sectors or degrees) are measured at 10 m from the ground.
The wind speed can be extrapolated at any height z above the ground by the classical logarithmic variation (see, e.g., [27]),
V z = V 10 ln ( z / z c ) / ln ( 10 / z c )
where V10 is wind speed at 10 m and zc is the roughness length where V = 0 (generally zc = 0.1 m in flat areas such as airports). Available data on 14 sites were extracted from the online database “Weather Underground” [28] during the period 2005–2020 (Table 1).
Dew yields have been computed from Equations (2) and (3) in Section 2.3 with time period ∆t = 0.5 h. for all sites except in Al-Hoceima/Béchar/Tindouf (1 h.) and Fès/Oujda where two time-steps are available (0.5 and 1 h.). The wind directions are obtained from the wind sectors (N, NE, NNE, etc.). A law of proportionality is used with 0° for North and 180° for South as references. Cloud cover in oktas was computed from the observation of sky cover using the correspondence listed in Table 2 from national weather service glossary [29], as used in a previous work [30]. The rainfall data, available on a daily time-step, are extracted from the meteorological data base [31] at the stations reported in Table 1.

2.2.2. Climate Model Data CNRM-CM5/ALADIN63 (Years 2006–2100)

Regional climate models (RCM) data are provided by the Cordex/Copernicus database [23]. Meteorological data are computed from a single level (earth surface). The high resolution CNRM-ALADIN 63 regional climate model coupled with the global climate model of CNRM-CERFACS-CM5 (CERFACS: Centre Européen de Recherche et de Formation Avancée en Calcul Scientifique) provides climate change information on regional and local scales in relatively fine detail. Gridded data present a 0.11° × 0.11° horizontal resolution (12.5 × 12.5 km2). Net network Common Data Form (CDF4) files with air temperature and relative humidity at 2 m from the ground, wind speed at 10 m from the ground, mean precipitation flux (Hr, kg·m−2·s−1), orography (m), surface solar radiation downwards (W·m−2) and total cloud cover (% of cloudy sky) are registered all 5 years (2006, 2010, 2015, …, 2100) with a 3 h. time step. The CORDEX climate projection uses RCP (Representative Concentration Pathways) forcing scenarios. The RCP hypothesis corresponds to a variation in the radiative balance (difference between incoming and outgoing radiation) at the top of the troposphere (located between 10 and 16 km elevation), due to a change in one of the factors of climate change such as the concentration of greenhouse gases. In this study are considered RCP 2.6 (~3 W·m−2, 490 ppm Equation CO2) and RCP 8.5 (>8.5 W·m−2, >1370 ppm Equation CO2) extreme scenarios, thus providing two different pathways of the future climate forcing [20,21].

2.3. Dew Yield Estimation

In order to investigate the dew resource, one uses an energy balance model [18]. This model allows for daily or hourly dew yields to be computed from only a small amount of classical meteorological data without adjustable parameters. The air temperature (Ta, °C), dew point temperature (Td, °C), cloud cover (N, oktas), and wind speed at 10 m from the ground are discussed (V, m·s−1). The results are concerned with the dew yield Δ h (in mm) per unit time Δ t (in h.), h ˙ = Δ h / Δ t . The time Δ t corresponds to the period of the analyzed data. It is assumed that the substrate is planar, tilted 30° from horizontal and thermally insulated from below. Its emissivity is assumed to be unity (which is close to the emissivity ≈0.98 of a wet substrate during dew condensation [32]). The details of the formulation are as follows:
h ˙ = ( Δ t 12 ) ( H L + R E )
The data for h ˙ > 0 correspond to condensation and h ˙ < 0 to evaporation; the latter have to be discarded. The measurement period of the data in the present study is Δ t = 0.5, 1, 3, 4 or 5 h. The quantity HL represents the convective heat losses between air and condenser, with a cut-off for wind speed V > V0 = 4.4 m·s−1 where condensation vanishes:
h ˙ = { ( Δ t 12 ) [ 0.06 ( T d T a ) + R E ]           if   V < V 0   0                                                                                                         if   V > V 0
The quantity RE is the available radiative energy, which depends on air water content (measured by Td), site elevation H (in km) and cloud cover N:
R E = 0.37 ( 1 + 0.204323 H 0.0238893 H 2 ( 18.0132 1.04963 H + 0.21891 H 2 ) × 10 3 T d ) ( T d + 273.15 285 ) 4 ( 1 N 8 )
The calculated daily yields and their cumulated values can be readily obtained by filtering the data without rain or fog events and integrating the time series on a daily time-step corresponding to h ˙ > 0. When comparing the calculated values with the measurements, the agreement is better than 20–30% [18,30], the deviation being mainly due to the unavoidable local differences in air flow geometries, which modify the convective heat exchange condenser/air and then the energy balance.

2.4. Kriging Maps

Kriging methodologies are mostly used for mapping spatial distribution of a given variable. The classical algorithm is presented in Appendix A. Tomaszkiewicz et al. [33] used ordinary Kriging to develop dew maps integrating projected climate changes in the Mediterranean basin. Martinez et al. [34] presented median polish Kriging (MPK) for space-time analysis of monthly precipitation in Colombia. Pue et al. [35] introduced a Kriging-based Gaussian process for the prediction of soil water retention in tropical and temperate climates. Muselli and Beysens [36] used Kriging to study the biocrust sustainability with dew and rain availability in southern Africa. Other studies combine Kriging models for the estimation of rainfall with Lagrangian approaches [37] or Bayesian [38].

2.5. Monthly Evapotranspiration

Potential evapotranspiration PET is the water vapor flux under ideal conditions of complete ground cover by plants, uniform plant height and leaf coverage, along with suitable water supply. In order to estimate PET (mm·month−1) for the studied area, the classical Turc’s formulae were used [39]:
P E T = { P E T R H 50 % = 0.013   J   ( R g + 50 ) ( T T + 15 ) P E T R H < 50 % = P E T R H 50 % ( 1 + 50 R H 70 )
Here, for the considered month, J corresponds to the number of days, T is the mean ambient temperature of the month (°C), RH is the relative humidity and Rg is the mean daily horizontal solar radiation (cal.cm−2·day−1).
Actual evapotranspiration (ET) is the sum of water evaporation and transpiration to the atmosphere from a surface area. Evaporation and transpiration occur simultaneously and there is no easy way of distinguishing between the two processes. Apart from the water availability in the top soil, the evaporation from a cropped soil is mainly determined by the fraction of the solar radiation reaching the soil surface. This fraction decreases over the growing period as the crop develops and the crop canopy shades more and more of the ground area. When the crop is of small size, the water is predominately lost by soil evaporation. Once the crop is well developed and completely covers the soil, transpiration becomes the main process.
In order to determine ET, one needs to define at the beginning of the year the useful reserve of the soil ( U R b a s e , mm). UR varies each month; one thus needs a reference or base value taken the first month of the year. The latter is obtained by the classical equations of Rawls [40]:
U R b a s e = ( W 330 W 15000 ) × H g
Here, Hg is the prospecting soil horizon thickness. The quantity W330 is defined as the water content in mm·m−1 for the predefined soil suction −330 hPa and W15000 is the water content for −15,000 hPa. With a relatively low coarse element content, i.e., 49.5% sand (Sa, %), 1.2% of organic material (MO, %) and with a fine element of 17% clay (Ar, %), the equations are:
{ W 330 = 257.6 ( 2 S a ) + ( 3.6 A r ) + ( 29.9 M O ) W 15000 = 26 + ( 5 A r ) + ( 15.8 M O )
Taking into account Hg = 0.4 m for the horizon thickness in Equation (6), one considers a presumed URbase ~ 50 mm. This ground UR value corresponds to the scale chosen by El Mansouri [41] to determine a rational management of irrigation water in Morocco. The value 50 mm corresponds to “stratified” floors, between fersiallitic (54 to 65 mm) and hydromorphic (≈0 mm), shallow to superficial, and poor in organic matter [42].
For a given year, the monthly ETi for each month i (i = 1, 2, …, 12) is computed as follows. Using the monthly rain H r , i yield (mm·month−1), the water stock W S T i   (mm·month−1) for the month i is obtained by:
W S T i = U R i + H r , i
For W S T i   P E T i , the evapotranspiration (mm·month−1) is:
E T i = P E T i
corresponding to U R i = U R b a s e . This is the case when the soil (having a water reserve) can compensate for evapotranspiration. Consequently, both the useful reserve of the previous month plus the rain of the studied month compensate the PET and maintain the reserve to its base value, as calculated at the beginning of the evaluation. The volume of infiltrated water (mm·month−1) is deduced from,
W I N F i = W S T i P E T i U R b a s e
When W S T i < P E T i , the evapotranspiration is,
E T i = W S T i
With,
U R i = 0   and   W I N F i = 0
One notes from Equations (9)–(12) that E T P E T because the soil reserve cannot provide the water needs for PET.

3. Results and Discussion

3.1. Past Evolution (2005–2020)

Monthly dew or rain yields, noted H d / r , i (mean, min., max. values, in mm·mth−1), are computed for each site by summing the daily data. Dew data are denoted with subscript d, and rain data with subscript r. Yearly dew or rain yields, noted H d / r , y (mm·yr−1), are deduced by adding the monthly H d / r , i :
H d / r , y = i = 1 12 H d / r , i
In order to estimate the dew or rain evolution, monthly and yearly yields are fitted to a linear regression on the measured period:
{ H d / r , i ( t ) = α d / r , i t + H d / r , i 0 H d / r , y ( t ) = α d / r , y t + H d / r , y 0
When t is in month or year, the corresponding coefficients α d / r , i or α d / r , y represent the monthly or yearly evolution rate. The corresponding initial values are H d / r , i 0 (monthly values) or H d / r , y 0 (yearly values).

3.1.1. Dew Yield

Mean, minimum and maximum dew yields are calculated on monthly and yearly time bases and reported in Table 3. The calculated yearly dew yields exhibit significant variations depending on the sites studied (Figure 2 and Table 3) as discussed in the following.
The Atlantic ocean coast of Morocco (Agadir, Casablanca, Rabat) exhibit high dew yields (>28 mm·yr−1), due to a high humidity related to the vicinity of the sea. The same behavior is observed for the coastal sites of the Mediterranean sea in Algeria (Oran, Tlemcen) with large yearly dew yields (respectively, 31.7 and 33.4 mm·yr−1). More than 70% of dewy days are yearly observed at these sites (min: 71.7% in Tlemcen; max: 80.7% in Agadir). The further from the sea, the less the dew yield, due the decrease of relative humidity. As a matter of fact, mean dew yields in the range 14.9–25.6 mm·yr−1 are obtained in Al-Hoceima, Fès, Marrakech, Oujda and Tanger. For two stations, dewy days are present between 55.8% of the year (Tanger) and 70.0% (Al-Hoceima).
In contrast, the stations established in the interior of the country (Béchar, Tindouf) or located on Spanish islands (Fuerte Ventura, Gran Canaria) suffer from very low yearly dew yield (<7 mm·yr−1). For example, Tindouf and Béchar, respectively, located at about 275 and 393 km from the sea, exhibit yearly dew yields of 1 mm and 6.4 mm. For Spanish islands, the yearly dew yields do not exceed 3.7 mm with a minimum of 1.3 mm at Gran Canaria. In these locations (the two islands, Béchar, Tindouf), daily dew yields are very weak with a mean of 0.1–0.5 mm and a monthly maximum of up to 6.5 mm. Only 8–38% of the days are dewy (min = 8.3% at Tindouf and max = 37.9% at Fuerte Ventura). The reason is due to the presence in the Canary Islands of predominant trade winds, which blow from the continent with low RH. The observed dew events correspond to other wind directions (west) with larger RH.
Table 3 shows that the yearly (and monthly) trend on the period 2005–2020 is positive for 50% of the sites, with mean arithmetic value α ¯ d , y = 0.65   ±   0.32   mm · yr 1 . The increase in dew yield is mainly concerned with the sites located in the north of the country (Al-Hoceima, Casablanca, Oran, Oujda) and to a lesser extent the Canary Islands (Gran Canaria and Fuerte Ventura). In contrast, the inland sites show a weak decrease ( α ¯ d , y = 0.30   ±   0.11   mm · yr 1 ), with is strongly correlated with a decrease in RH as can be seen in Figure 2d.
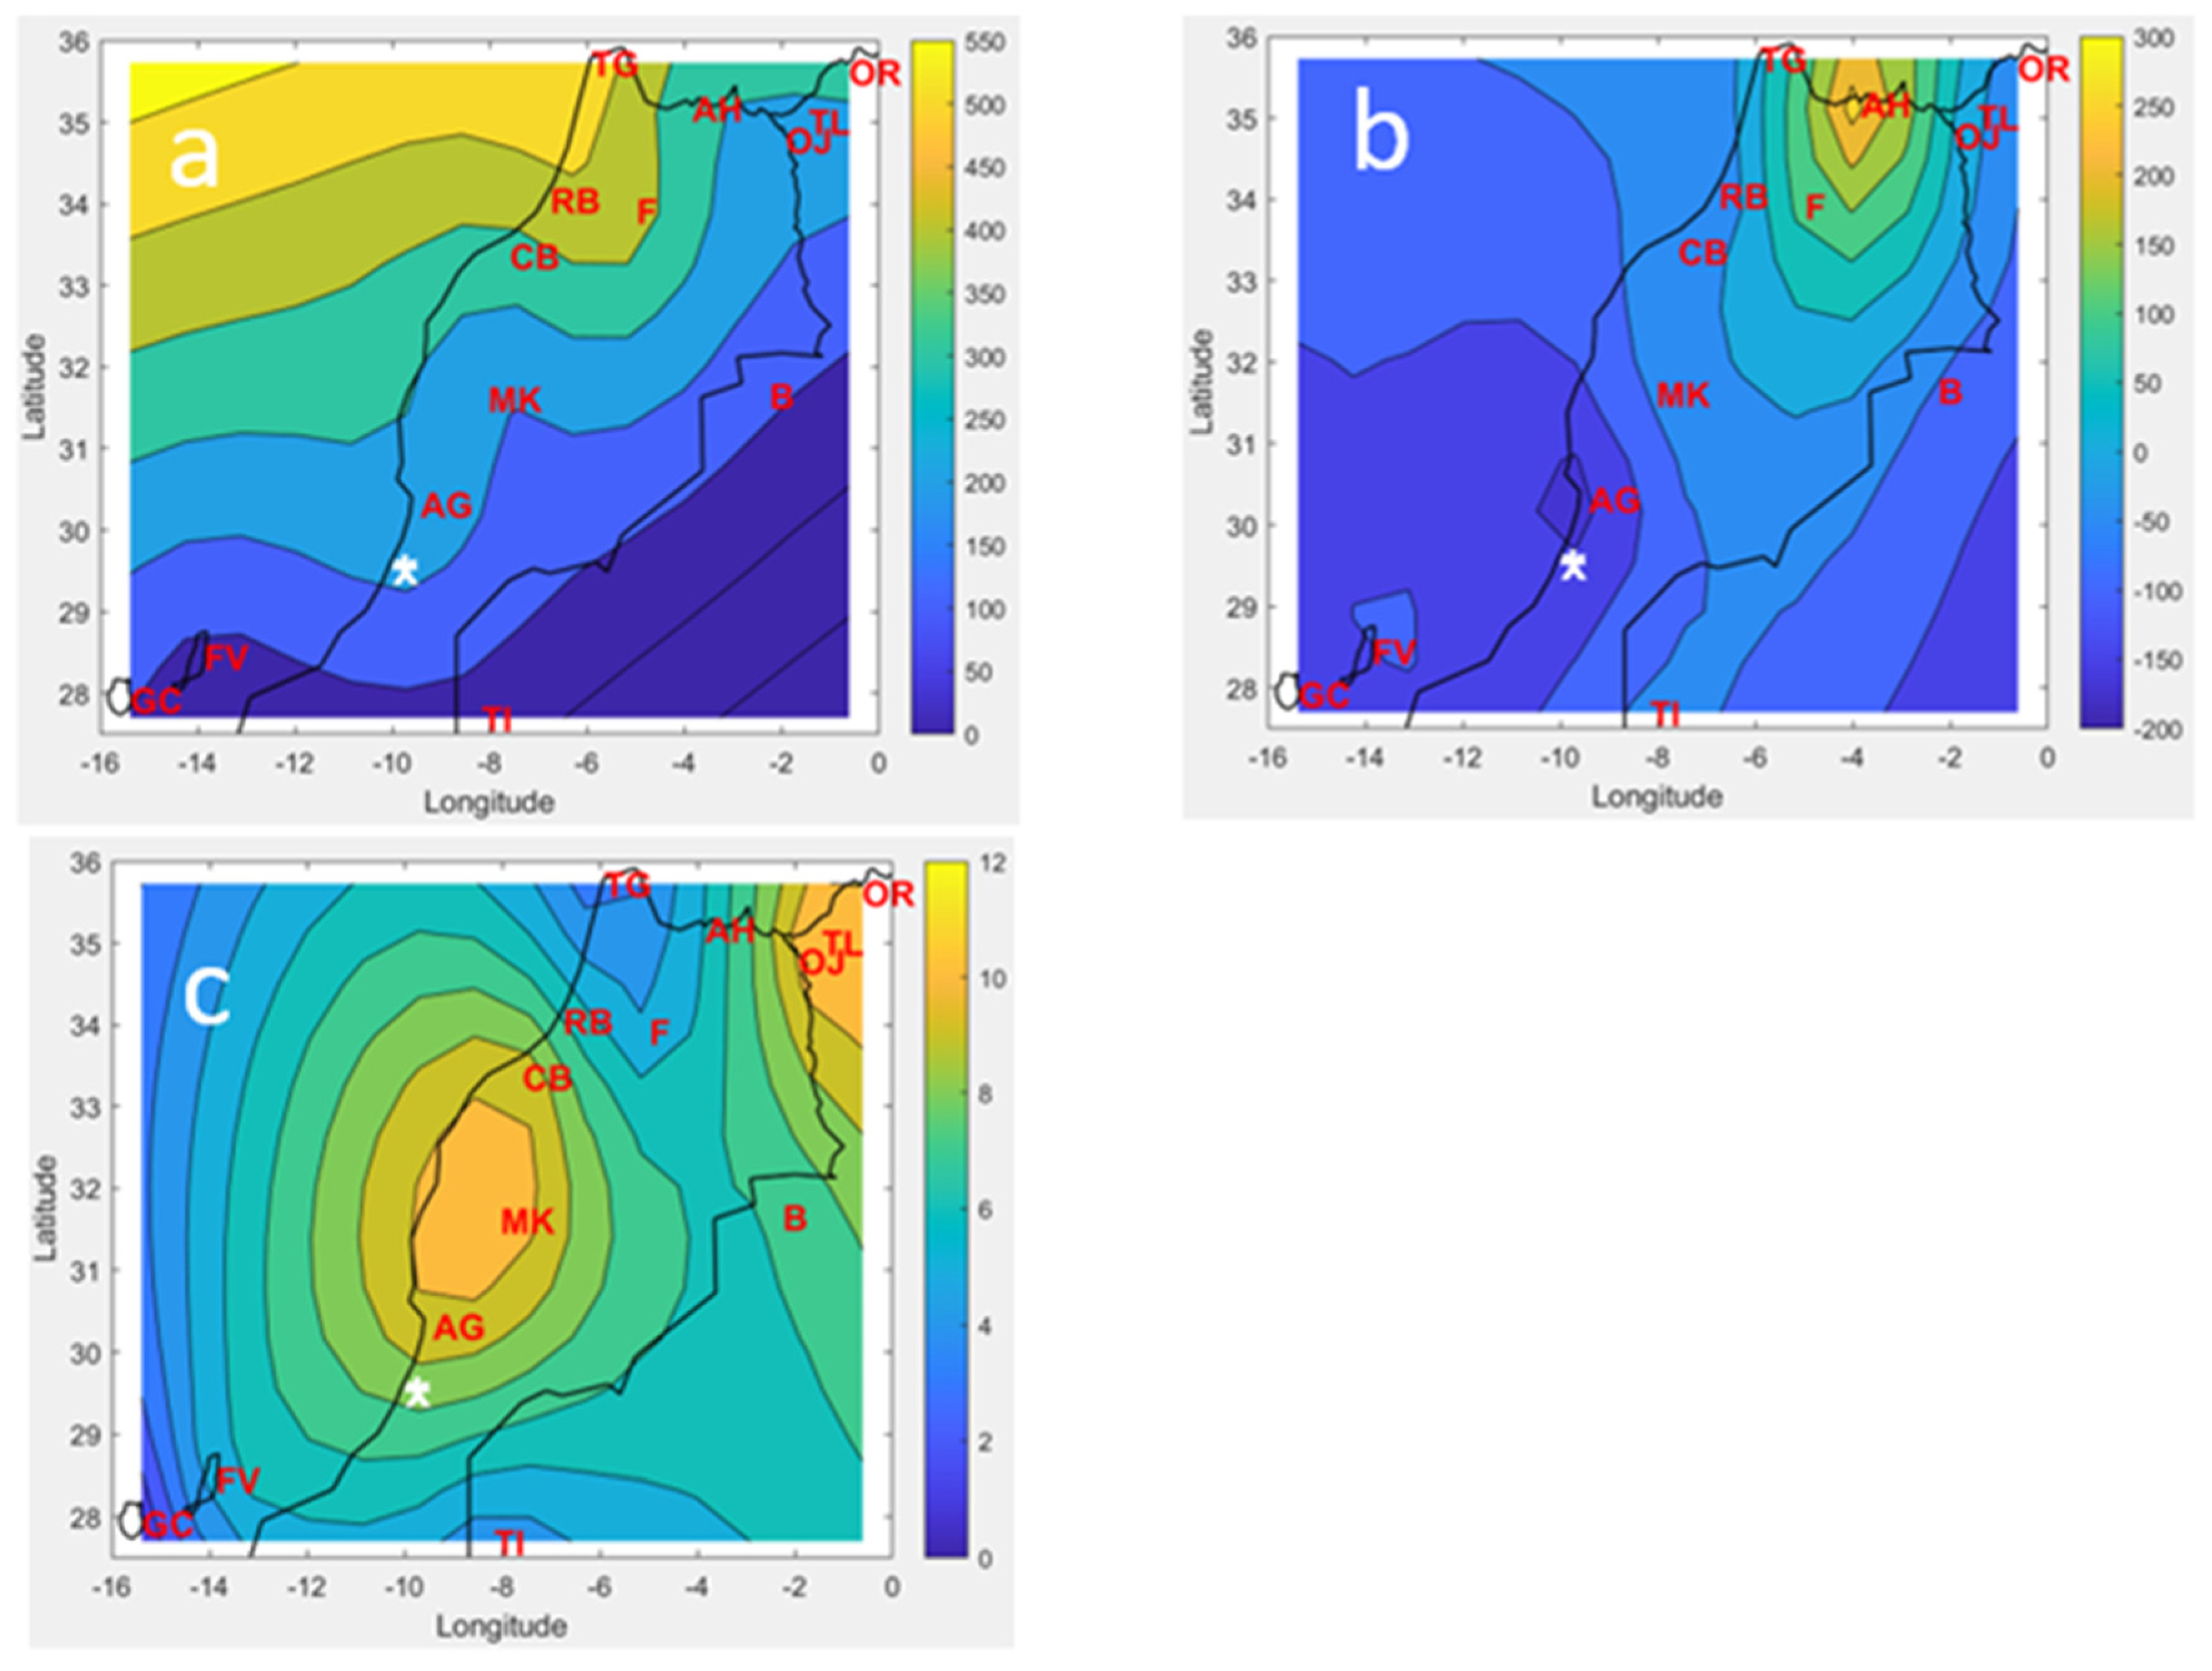
The spatial distribution of dew yields was determined by Kriging (Figure 2). Map of mean yearly dew yields are presented in Figure 2a. As expected and described by Tomaszkiewicz et al. [33], dew exhibits the highest yields along the coasts of Atlantic Ocean and Mediterranean Sea. Due to the spatial repartition of RH (Figure 2b), the Atlas Mountains delineate a meteorological limit, with the higher yields in the North-West and the lower yields in the South-East of Morocco. The maps of Figure 2 are in close agreement with the trends determined above from the mean evolution factor α ¯ y . As a consequence one observes between 2005 and 2020 a clear decrease in dew yields along a northwest/southeast axis, exceeding 10 mm·year−1 in some places (Figure 2c). This decrease is strongly correlated with the corresponding decrease in RH (up to 7%, see Figure 2d). The areas from the Atlantic coast to the Sahara Desert are gradually impacted by this decrease.
Let us consider more specifically the Sahara Desert, which represents about 8.6 million of km2 and extends over ten countries (Morocco, Algeria, Tunisia, Libya, Egypt, Sudan, Chad, Niger, Mali, Mauritania). In the spatial area considered in this study, the fraction of Sahara Desert stretches over about 386,000 km2 (2/5 in Morocco and 3/5 in Algeria). One also clearly observes in Sahara a decrease in dew yields, especially from the highlands (Atlas Mountains) towards south-west. However, one notes that in these areas, the monthly dew yields can reach mean and maximal values up to 2.4–6.5 mm and 0.09–1.4 mm, respectively (Béchar and Tindouf, see Table 3). In general, there is a tendency to see a decrease in dew yield with increasing distance from the sea, located W and N. A clear decrease in nocturnal RH from north-west to south-east is obvious (Figure 2b), with the largest dew yields (Figure 2a) corresponding to the regions of highest RH (80% to 90% on Atlantic and Mediterranean coasts but only 70% in the Sahara Desert). The tendency over the years 2005–2020 is a weak decrease, with a decrease of 0.43 mm·yr−1 (Béchar) and 0.09 mm·yr−1 (Tindouf).

3.1.2. Comparison with Direct Dew Yield Measurements

The calculated dew yields can be compared with previous measurements carried out in [17] in two neighboring sites of S-Morocco, Mirleft (right cross in maps) and Id-Ouakssou (inclined cross in maps). These authors reported dew and rainfall measurements from weather stations located on the Atlantic Ocean coast of southwestern Morocco (Mirleft: 29°35′17″ N, 10°02′20″ W, 43 m asl, 200 m from the coast; Id-Ouakssou: 29°34′03″ N, 9°59′51″ W, 240 m asl, 8 km from Mirleft in the E direction). Mirleft and Id-Ouakssou are about 100 km SSW from Agadir.
During the studied period (May 2007–April 2008) the yearly percentage of dew days in Mirleft was 48.6%, with a mean dew amount of 18.9 mm as measured in [17] with the N-oriented condenser. The estimation from Equation (3) for the same period is 31.9 mm in Agadir. When comparing for the same time period (May 2007–April 2008) the Mirleft data with the closest kriging grid point (29°33′00″ N, 9°42′14″ W, 27 km apart), the calculated mean dew yield is 23.9 mm, about 25% more than the measurements. Between 2005 and 2020, the mean is 20.8 mm.
According to [31], rainfall was 119.8 mm at Agadir during the period May 2007–April 2008, to be compared with a cumulative rainfall of 48.7 mm measured at Mirleft during the same period ([17]). At the nearest kriging grid point, the value is 86.0 mm between May 2007 and April 2008, considerably larger than measured in Mirleft. The fact that rain volume was measured on the dew collector instead of using a standard rain gauge might explain the discrepancy.
In Mirleft, the cumulated amount of the ratio dew/rain, calculated from the data in [17], is ( H ¯ d , y / H ¯ r , y ) m e a s . = 38.8 % . The present kriging study gives a value ( H ¯ d , y / H ¯ r , y ) c a l c . = 28 % , then in reasonable agreement with the measurements.
The second site, Id Ouasskssou, was studied between 1 July and 30 September 2007. 50 dew events (54.3% of the period) are observed giving a total of 7.1 ± 0.3 mm. There was no rain collection at Id Ouasskssou and the rain data were taken from the Mirleft site. Six rainy events were reported (15.6 ± 2 mm, 6.5% frequency for the period). Located between two grid points, the results for Id Ouasskssou are interpolated. On the period July-Sept 2007, the kriging methodology allows 5.5 mm to be obtained for dew and 14.4 mm for rain. The agreement with the measured rainfall is good (measured: 15.6 mm); the dew yield obtained by kriging presents an acceptable error of 23%, compatible with the model uncertainty [18].
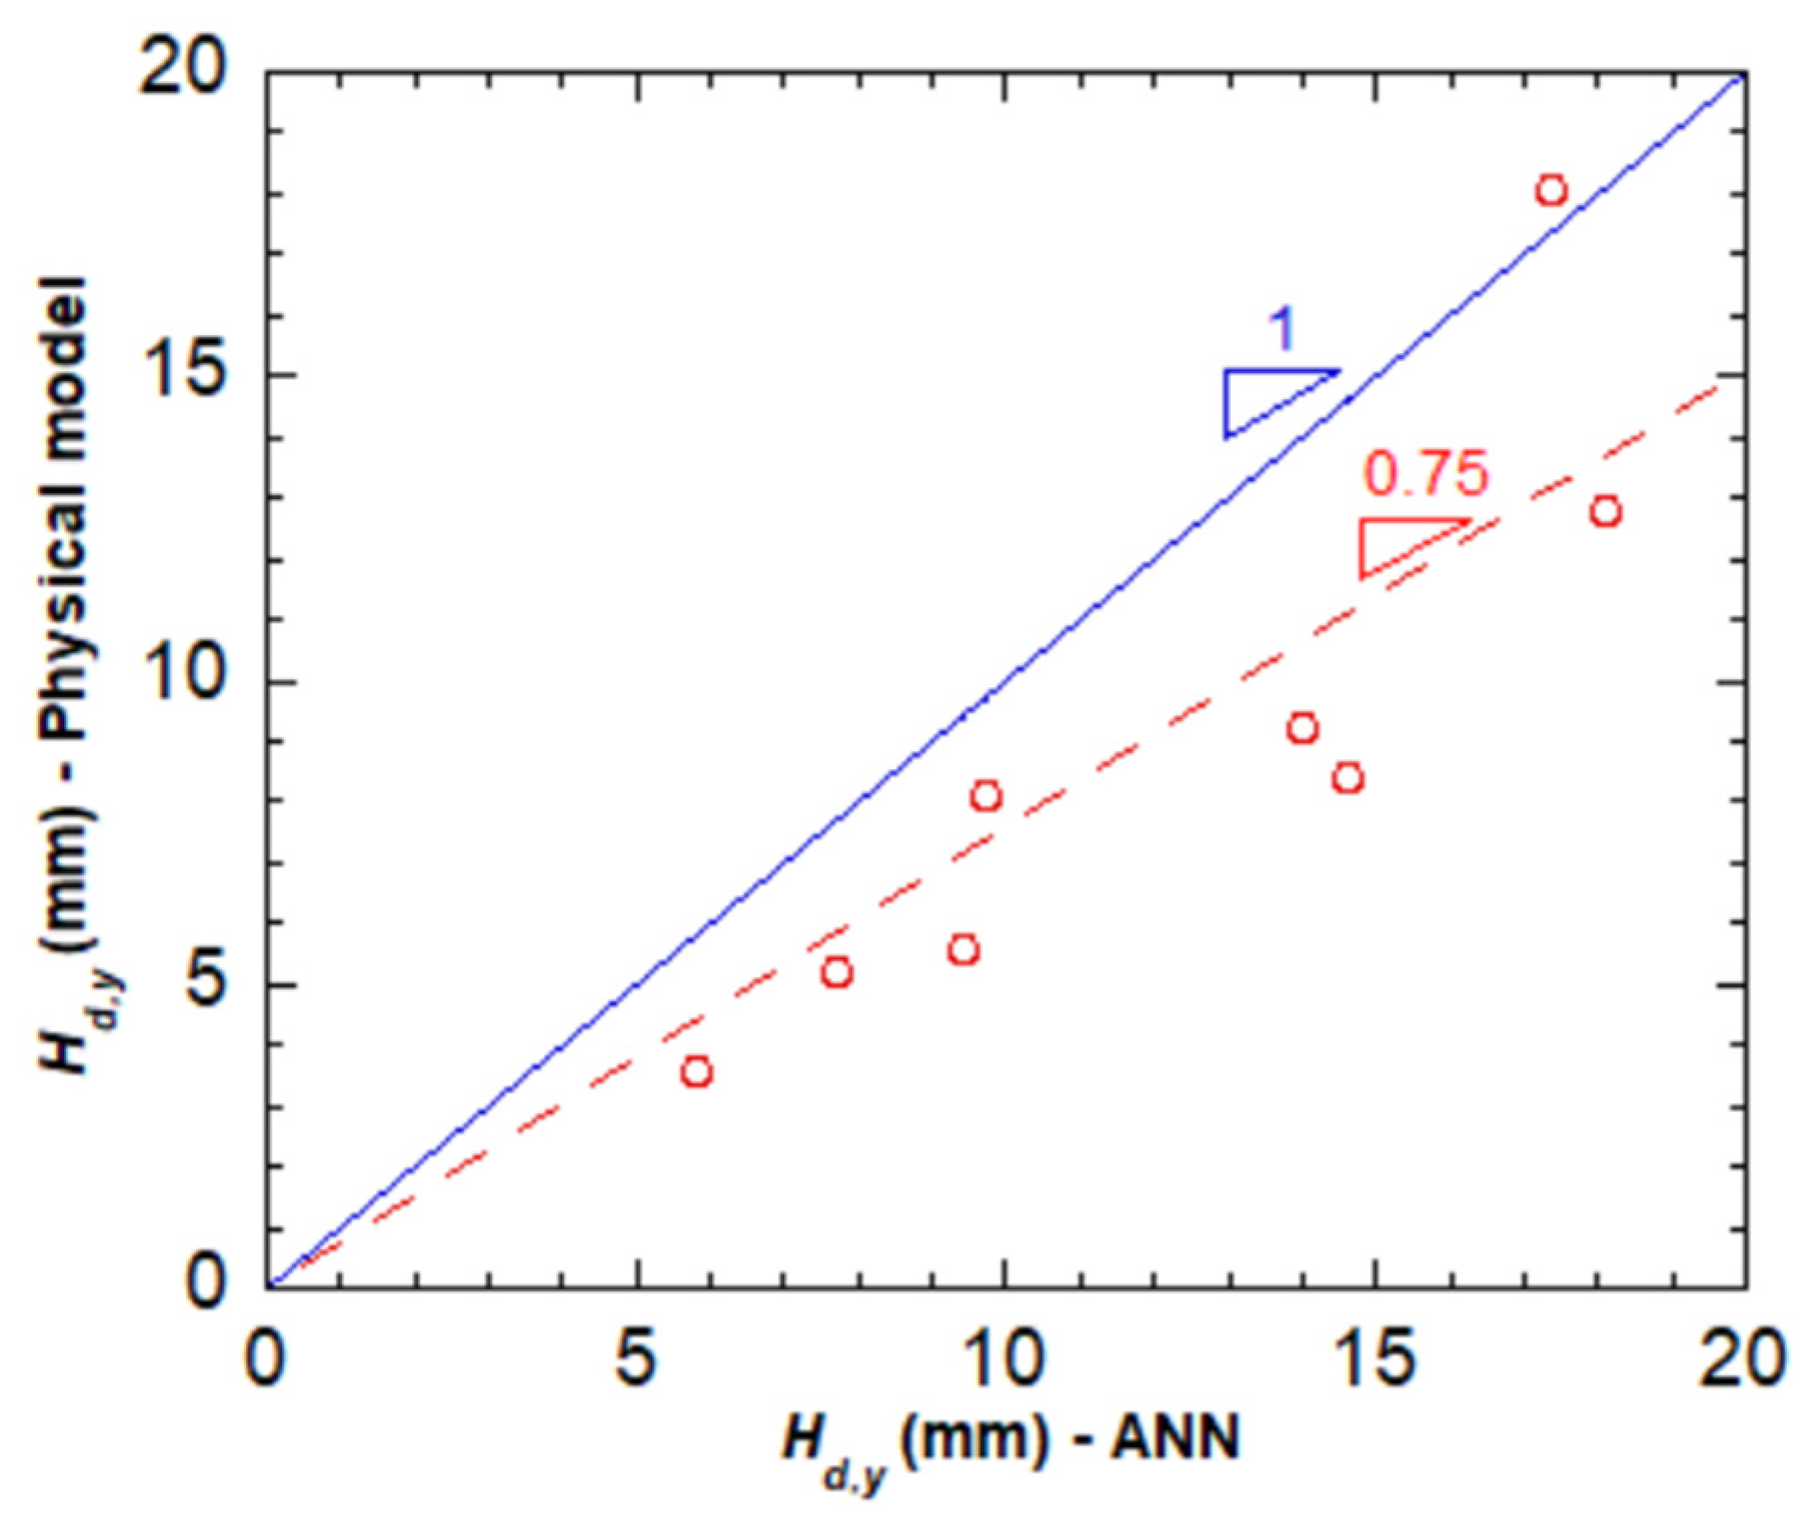
Figure 3 compares for the period May–October 2007 the dew yields as obtained from the physical model (this study) with the yields calculated in Mirleft by a neural networks approach (ANN) via a learning method ([17]). The ANN result for Mirleft was assumed to be also valid for the other Morocco cities. On eight sites, it shows that the calculated Hd,y values computed from ANN somewhat underestimate the values estimated from the physical model (Equation (3)), presumably because the ANN extrapolation from Mirleft to other cities is not fully justified. The correlation shows a proportionality factor of 0.75 (±0.06) and R2 = 0.753 (uncertainty: One standard deviation).

3.1.3. Rain

Table 4 and Figure 4 present the yearly and monthly mean (yearly mean = monthly mean × 12), min and max rainfall data extracted from [31]. From a general point of view, rain decreases towards SE (except the Spanish islands, Fuerte Ventura and Gran Canaria, located SW). As described below, the cities located in the Sahara Desert exhibit the lowest yearly rain precipitations: 58 mm in Tindouf and 116 mm in Béchar (i.e., respectively, 3.2% and 7.6% of rainfall events per year). In these areas (Figure 4a), precipitations are very erratic with no rain for several months and only few intense precipitations events (see also Section 3.3.2).
Inland rainfalls, although remaining relatively weak, are more abundant than above, with yearly averages of 184 and 255 mm·year−1 for Marrakech and Oujda, respectively—although these areas can exhibit months without any rain (Table 4). However, one notes that less than 16% of the days of the year are rainy (11.9% and 15.6% in Marrakech and Oujda, respectively). The closer to the coast, the heavier the rainfall precipitations (Figure 4a).
Figure 4b exhibits the yearly difference in rainfall between years 2020 and 2005. The whole area suffers from a drop in precipitation with the exception of the region of Al-Hoceima near the Mediterranean Sea. This is due to an exceptional year (457 mm in 2020 against an average of 302 mm over 16 years). As observed in Table 4, Agadir, Casablanca, Rabat, Tanger, Al-Hoceima and Oran exhibit mean yearly rainfall between 294 mm·yr−1 (Agadir) and 549 mm·yr−1 (Tanger), with mean monthly rainfall ranging from 24.5 mm·mth−1 (Al-Hoceima) to 45.8 mm·mth−1 (Tanger). In these locations, less than 21.5% of days of the year are rainy days with a minimum of 8.2% for Agadir, corresponding to intense rainfalls.
One notes than the ratio between the yearly cumulative dew and rainfall volumes, averaged over 16 years (2005–2020),
r = ( 1 16 ) 2005 2020 ( H d , y / H r , y )
can reach 12% (Figure 4c). Two areas are concerned by these high ratios: Agadir/Casablanca/Marrakech/Oujda in Morocco and Oran/Tlemcen in Algeria. For desert sites such as Béchar and Tindouf, the cumulative dew/rain ratio presents values in the range 4 to 8%.
Yearly rainfall data (Table 4) are fitted to Equation (14) to evidence a long term tendency. The yearly tendencies over the 16 years period undoubtedly show a decrease of yearly rainfall, with an (arithmetic) mean evolution factor α ¯ r , y = −4.4 ± 0.75 mm·yr−1. Only two inland sites (Fès, Tindouf) and one coastal site (Rabat) present a weak increase tendency on the studied period, with α ¯ r , y   = 1.3 ± 1 mm·yr−1.

3.2. Projected Climate Evolution 2020–2100

The 5th report of the Intergovernmental Panel on Climate Change has defined future scenarios of greenhouse gas emissions, denominated the Representative Concentration Trajectories (RCP): A scenario with a minimum of greenhouse gas emissions (RCP 2.6), two scenarios of stabilization (RCP 4.5 and RCP 6.0) and one scenario with a very high level of greenhouse gas emissions (RCP 8.5). In order to estimate from 2020 to 2100 the variation of meteorological and physical variables one has chosen to work with only the two extreme scenarios, RCP 2.6 and RCP 8.5.
The tendencies of the predicted variables are computed from the time derivative each 5 years (with one exception, see below). For dew and rain, with dt = 5 years, one thus considers, with Y y = H d / r , y the yearly dew or rain yield or Y y = T a , y , the yearly averaged air temperature:
Y ˙ d t = d Y y d t
The cumulative function of H ˙ d / r , l starting in 2006 (first year available for climatic prospective data on the Copernicus-Cordex database) and ending in 2100 gives the global variation of Hi:
Δ Y y = 2006 2100 Y ˙ d t = Y y ( 2100 ) Y y ( 2006 )
The time step is dt = 5 years except between 2006 and 2009 where it is 4 years.

3.2.1. Typical Tendencies

Air temperature (Ta,y) and dew and rain yields (Hd,y, Hr,y) are computed for the past period (2005–2020) and the future (2020–2100). According to Equations (16) and (17), the evolutions are compared with the measured means obtained for Ta between 1980 and 1990 [43], between 2005 and 2020 for dew yield H d (calculation from Equation (3)) and between 1990 and 2020 for rain yield H r [28]. One uses the following notations:
{ Δ T a = T a ( t ) T ¯ a | 1980 1990 Δ H d = H d ( t ) H ¯ d | 2005 2020 Δ H r = H r ( t ) H ¯ r | 1990 2020  
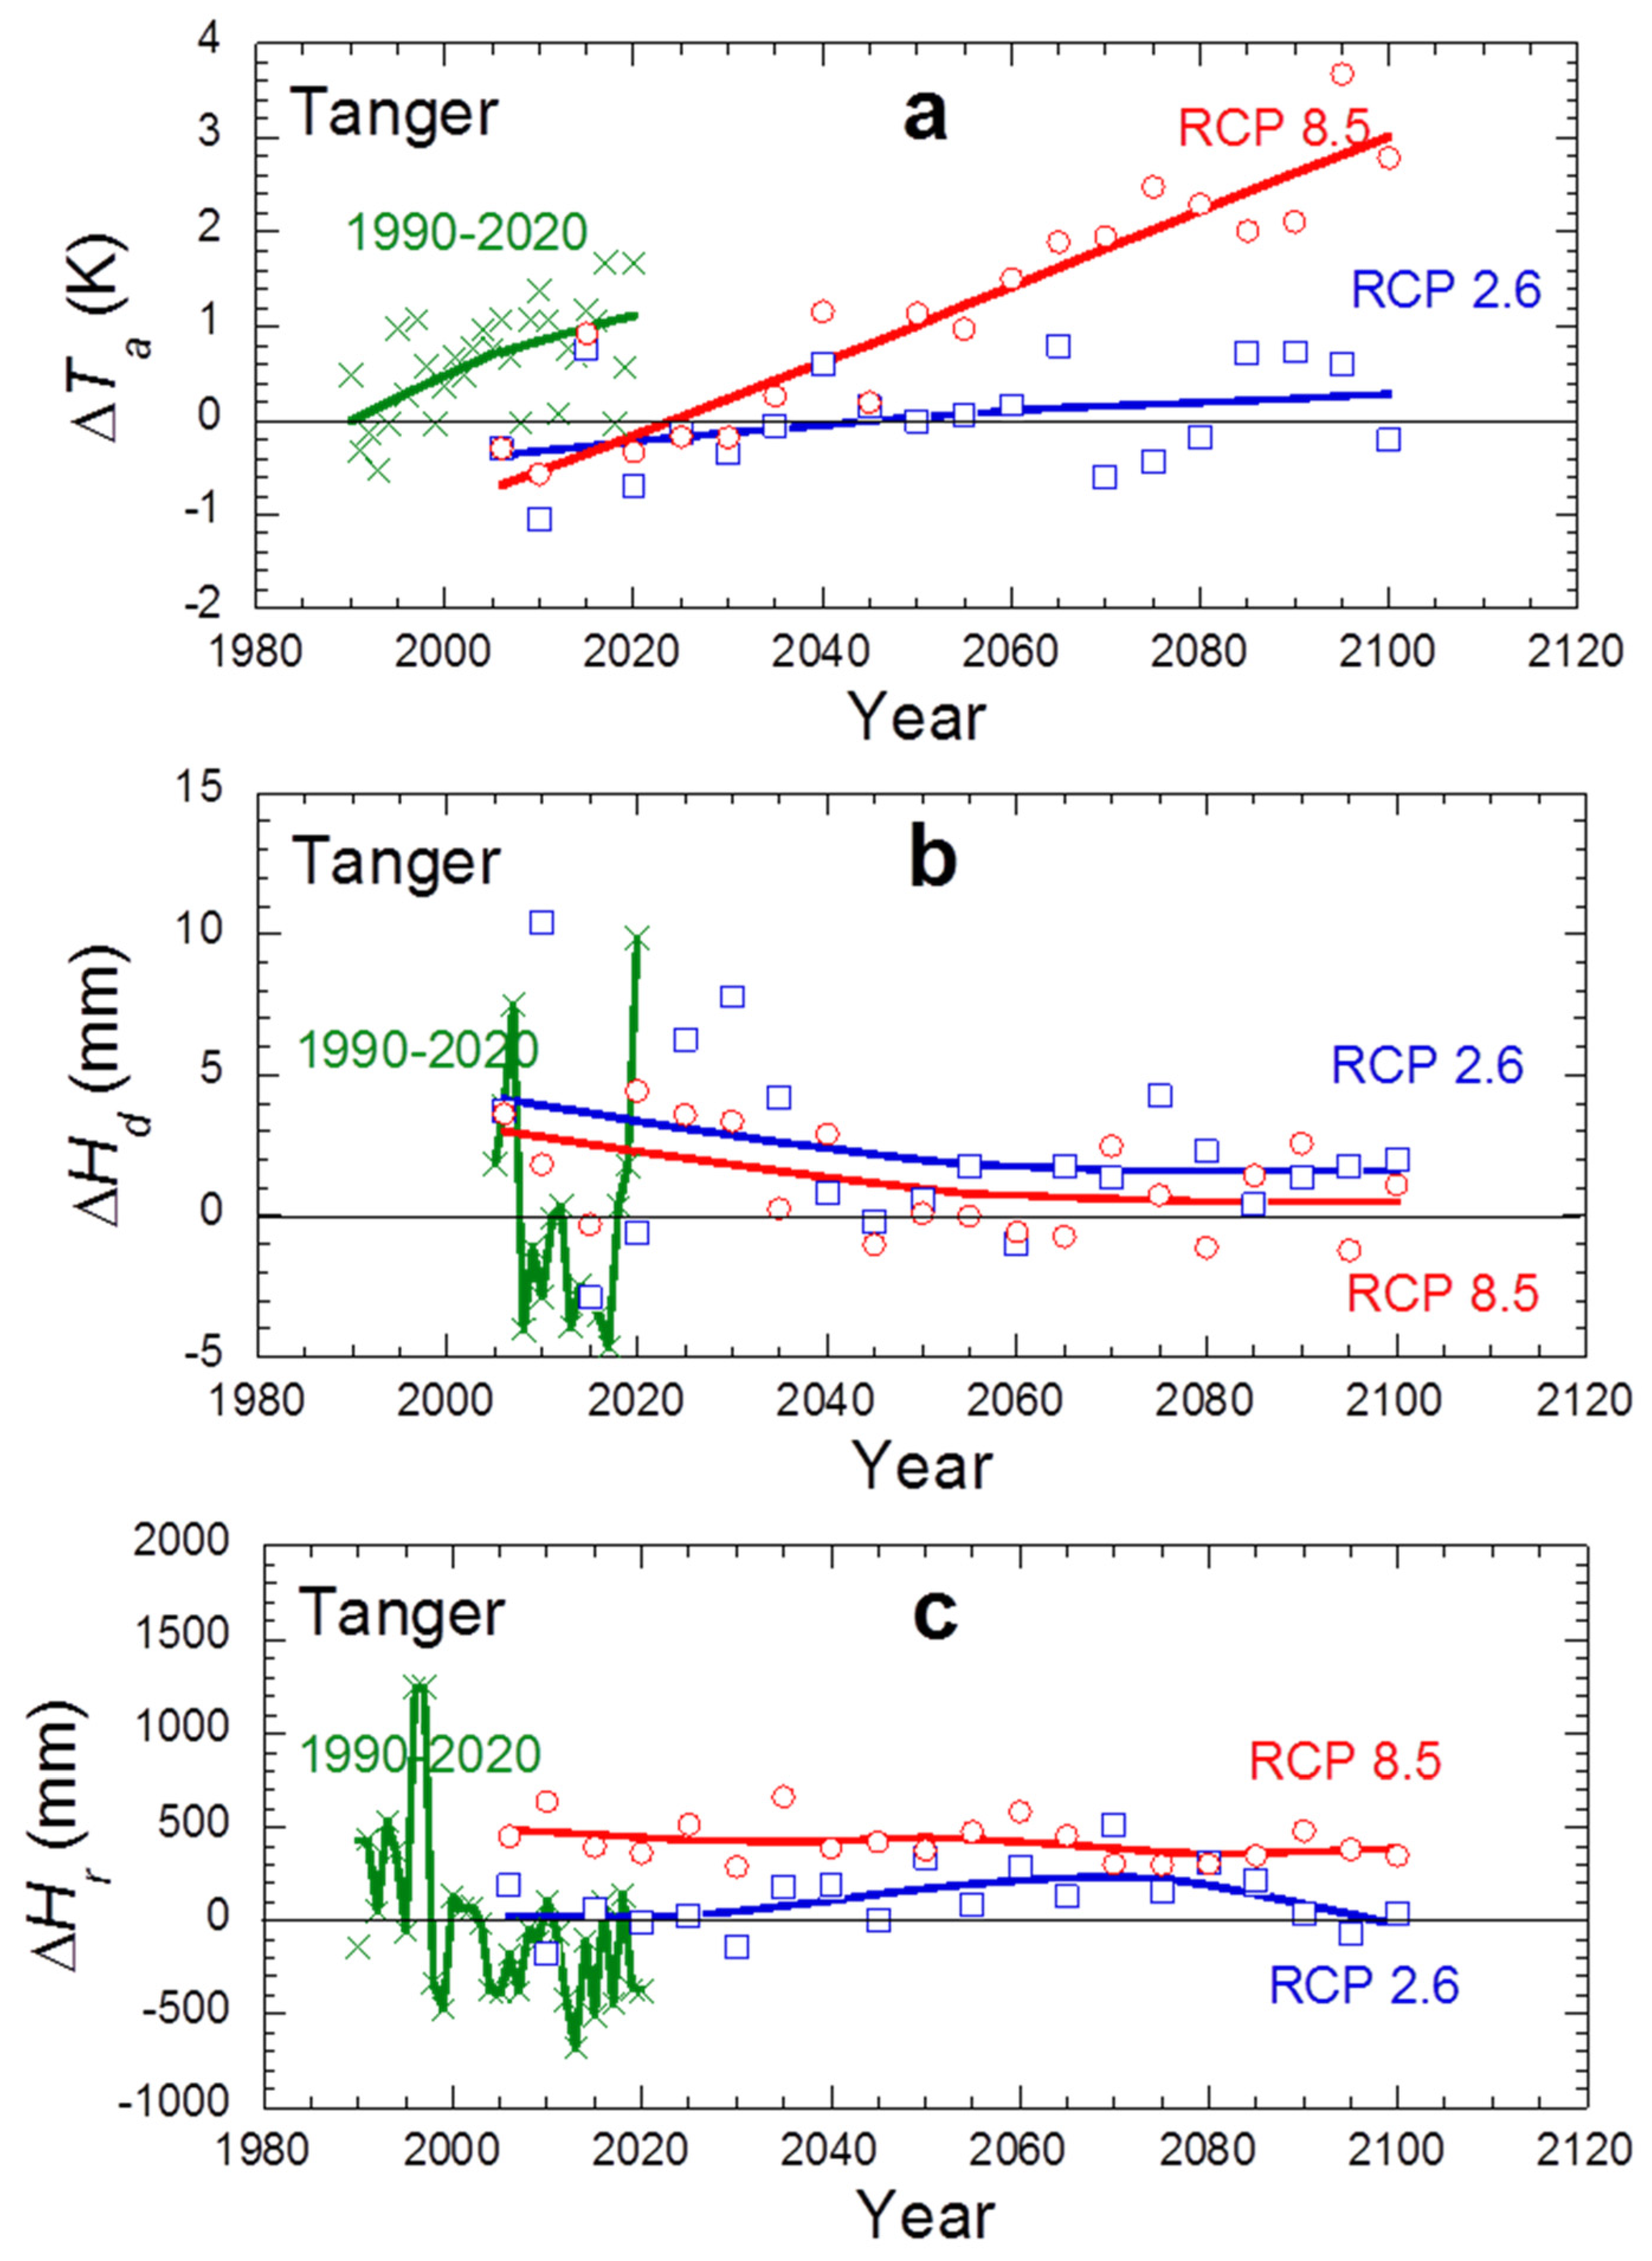
As an example, Figure 5 reports the evolutions for the site of Tanger. The most important influence of the RCP scenario is visible on the air temperature Ta (Figure 5a), with increases of 0.5 to 1 °C (RCP 2.6) and 3.5 to 4 °C (RCP 8.5) at the end of the century. These values are in agreement with those obtained in [3]. The scenario 2.6 shows a stabilization of the temperature evolution, while the unfavorable scenario (RCP 8.5) shows, from year 2020 with acceleration after 2040, an almost linear increase over several decades (see Figure 5a). According to previous works [44], this tendency was already observed on different area in Morocco. Temperature anomalies are indeed observed most frequently since 2010 leading in 2020 to an increase of +1.3 °C, in relation with the normal climatic temperature measured on the period 1981–2010. Years 2010, 2017 and 2020 are clearly the hottest years recorded since 1980.
Regarding the dew amounts, the trend is mainly decreasing (Figure 5b and Figure 6c). One observes for RCP 2.6 a decrease of −0.296 mm·decade−1; for RCP 8.5 the evolution becomes −0.259 mm·decade−1. Compared with 2006, dew yields should have decreased by the end of this century (−9.5%, RCP 2.6 and −13.6%, RCP 8.5). However, one notes according to RCP 2.6 an increase of rainfall between 2030 and 2090 and later a decrease to zero. Concerning RCP 8.5, one observes a weak decrease on order of −11 mm·decade−1 (−12%, RCP 8.5). The last scenario seems to be more credible because the decrease is already present in the measured data since the beginning of years 2000 (Figure 5c).
Sebbar et al. [45] and Driouech [46] have already highlighted a climate change identified around the end of the 1970′s. As a matter of fact, a majority of meteorological stations in the mountainous region of the Middle Atlas in Morocco observed a reduction in rainfall of around 18%. Khomsi et al. [47] confirmed this evolution by the decennial study of rainfall in Morocco since the middle of the 20th century. Stations such as Rabat (−3.31 mm·decade−1), Marrakech (−2.79 mm·decade−1), Fez (−12.7 mm·decade−1) or Tanger (−23.7 mm·decade−1) are experiencing significant rainfall decreases in winter season. The situation in 2022 is particularly alarming, with very weak precipitations during the winter season.
Figure 6 presents content for years 2006 and 2100, and for both extreme RCP scenarios the monthly potential evapotranspiration PET and actual evapotranspiration ET values. Monthly Hd,i and Hr,i yields are also shown for comparison. One can draw the following conclusions for the evolution between 2006 and 2100:
Firstly, the yearly PET (addition of the monthly PET over the year) displays an increase over the century (Figure 6a,c), being weak for the scenario RCP 2.6 (one calculates +4.0 mm·decade−1), and larger for the scenario RCP 8.5 (+7.4 mm·decade−1). This increase is related to the expected increase in ambient temperature (Figure 5a). Agoumi et Debbarh [48] have already reported a PET increase between 1961 and 2004 in relation with air temperature increase, causing adverse effects on the water potential of Morocco.
Secondly, the increase in PET is distributed almost evenly over all months of the year (Figure 6a,c). For RCPs 2.6/8.5, it corresponds to a monthly mean of +0.035 mm·month−1 and +0.065 mm·month−1, respectively.
Thirdly, one observes in Figure 6a,c that ET(2100) < ET(2006) with −15.8 mm·decade−1 for RCP 2.6, meaning that evaporation of water contained in the soil decreases. This evaluation looks coherent with the scenario RCP2.6 where an inversion of the climatic warming process is observed. For RCP 8.5, an exceptional rainy month of May 2100 (132 mm) leads to ET(2100) > ET(2006) but during the century the ET tendency is a decrease with ET(2100) < ET(2006). Note that a source of uncertainty is the impact of the large scale climatic phenomena on ET [49]. When determining ET while starting from ET0 (projected reference evapotranspiration from the climatic variables), the increase of temperatures and the change of the mode of precipitations is a source of uncertainty in the hydrological models. The choice of the method can involve biases of several tens of millimeters per year [50].

3.2.2. Dew and Rain Maps Evolution

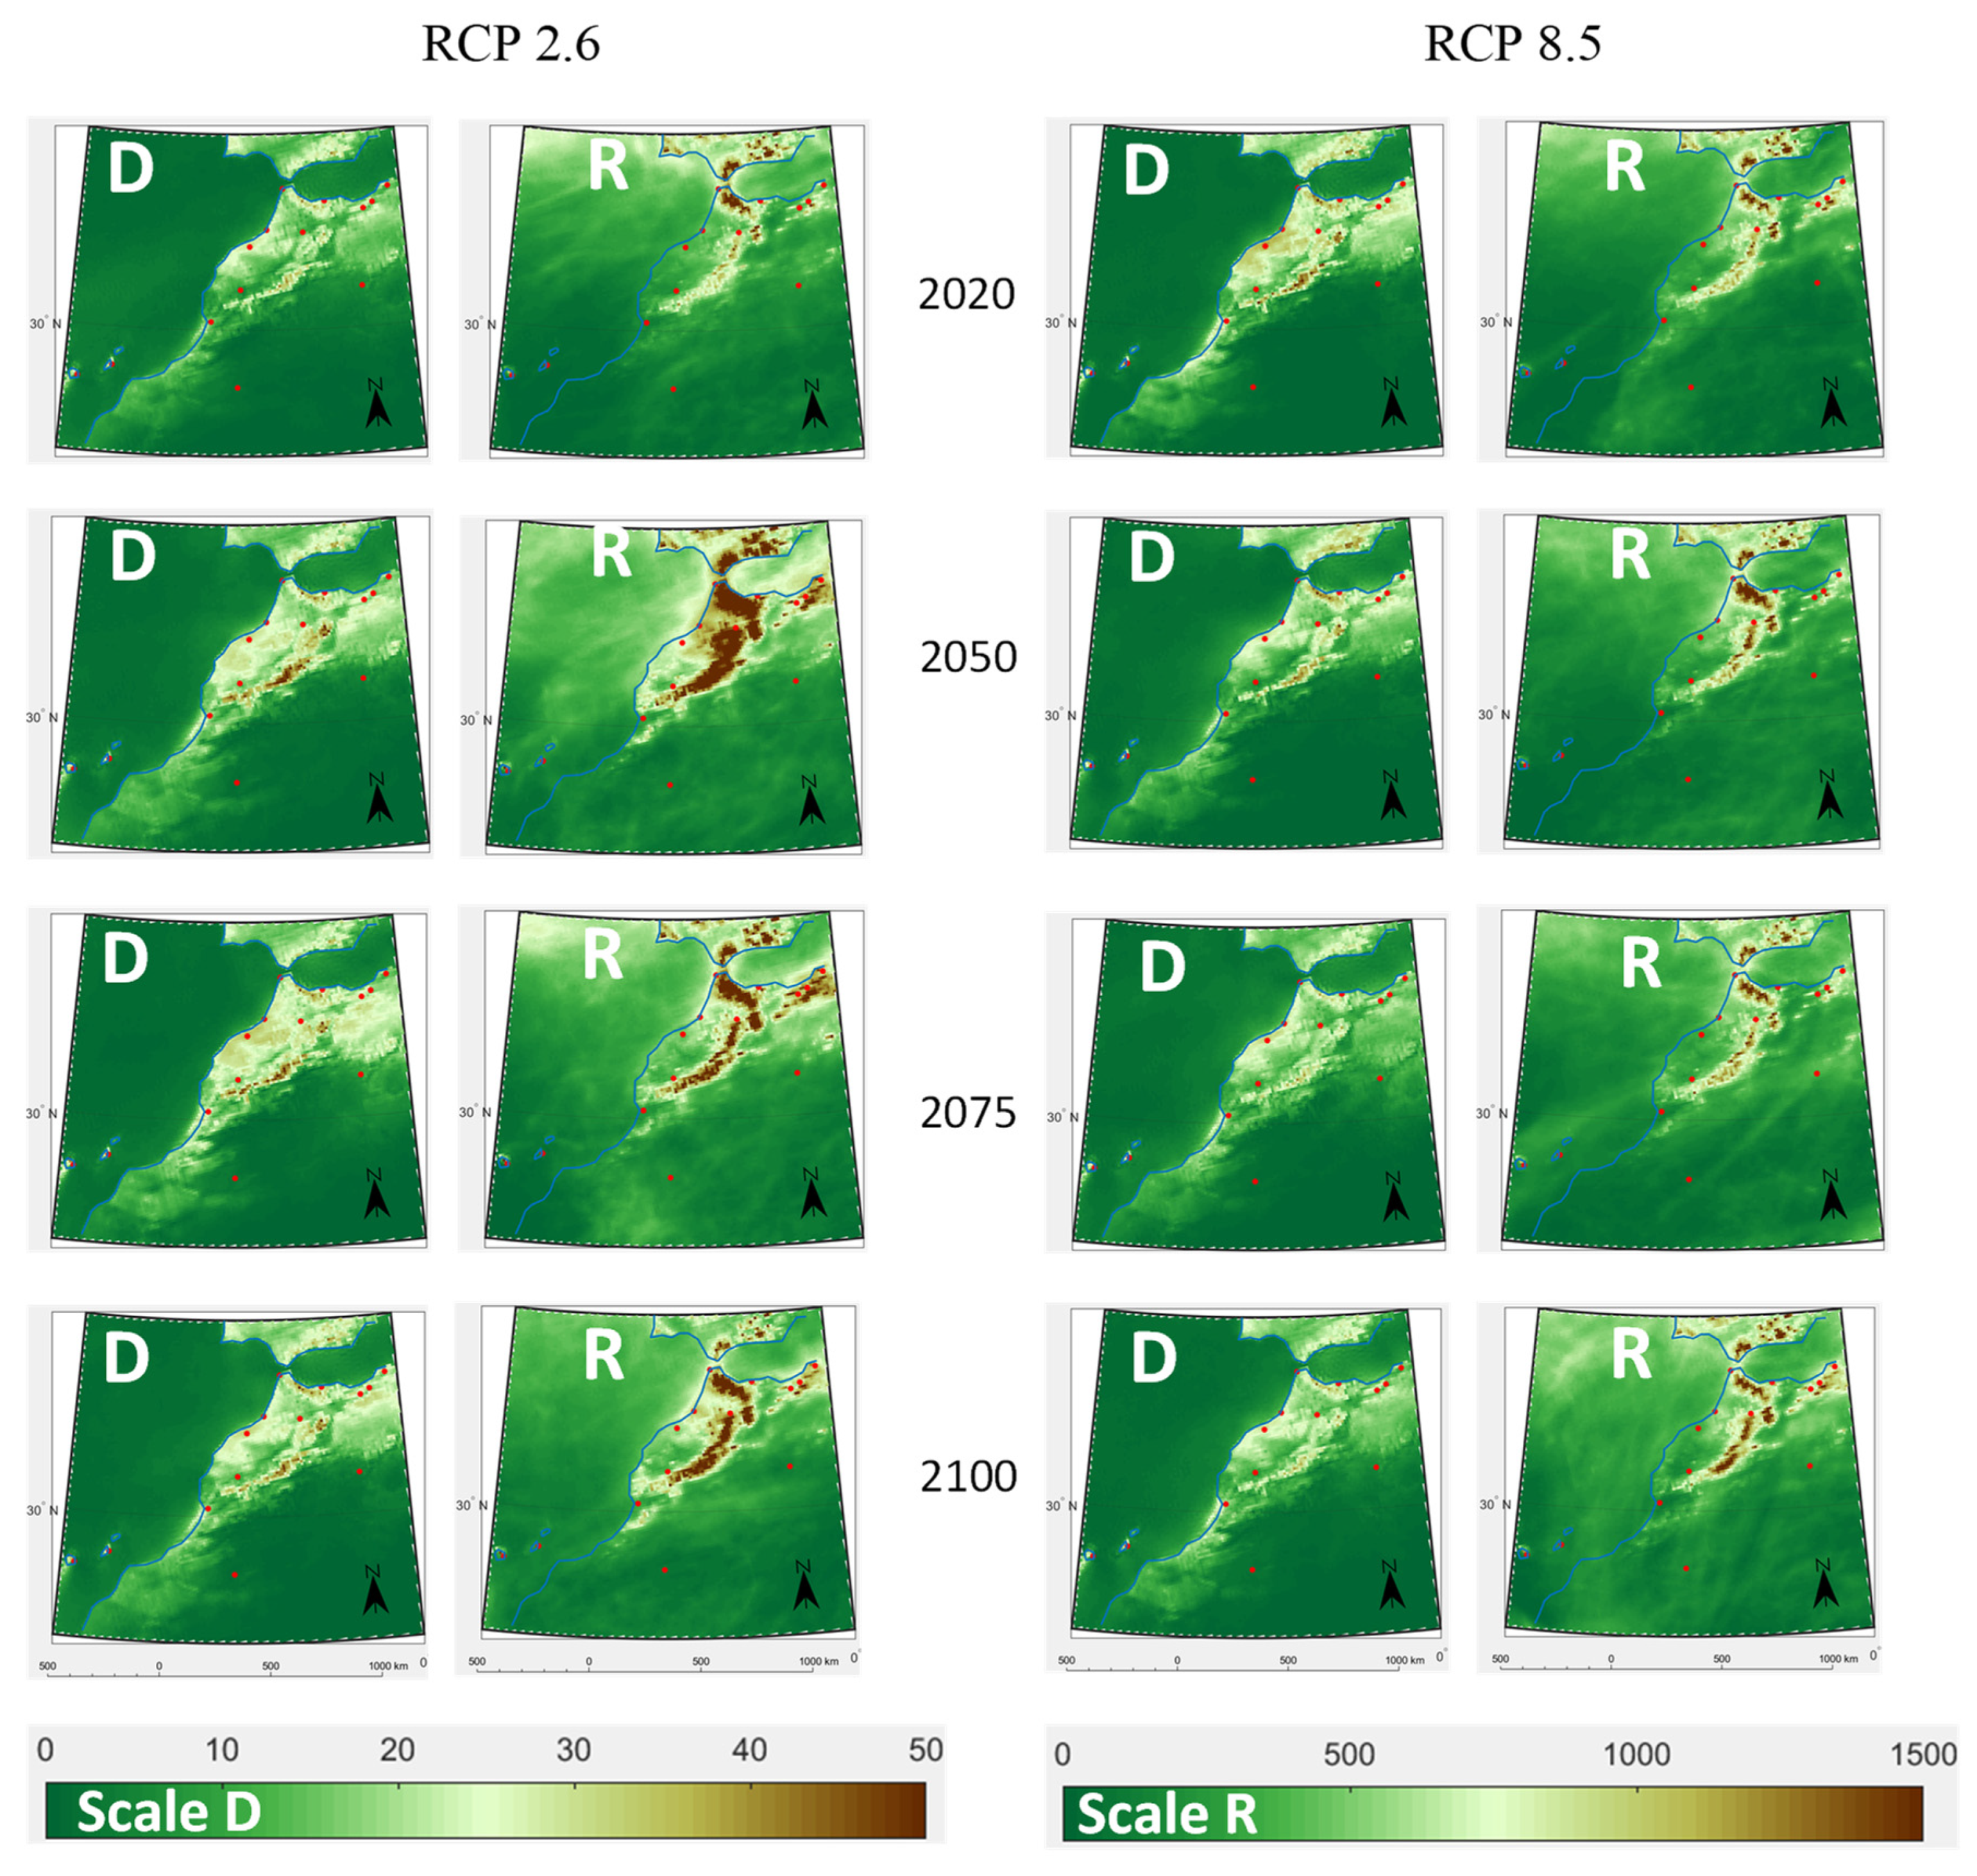
Dew and rain maps have been computed for each RCP scenario. Figure 7 shows yearly dew and rain yields (mm·yr−1) calculated on 4 specific years (2020, 2050, 2075 and 2100). The evolution of the dew resources during the 21st century are computed from Equation (3).
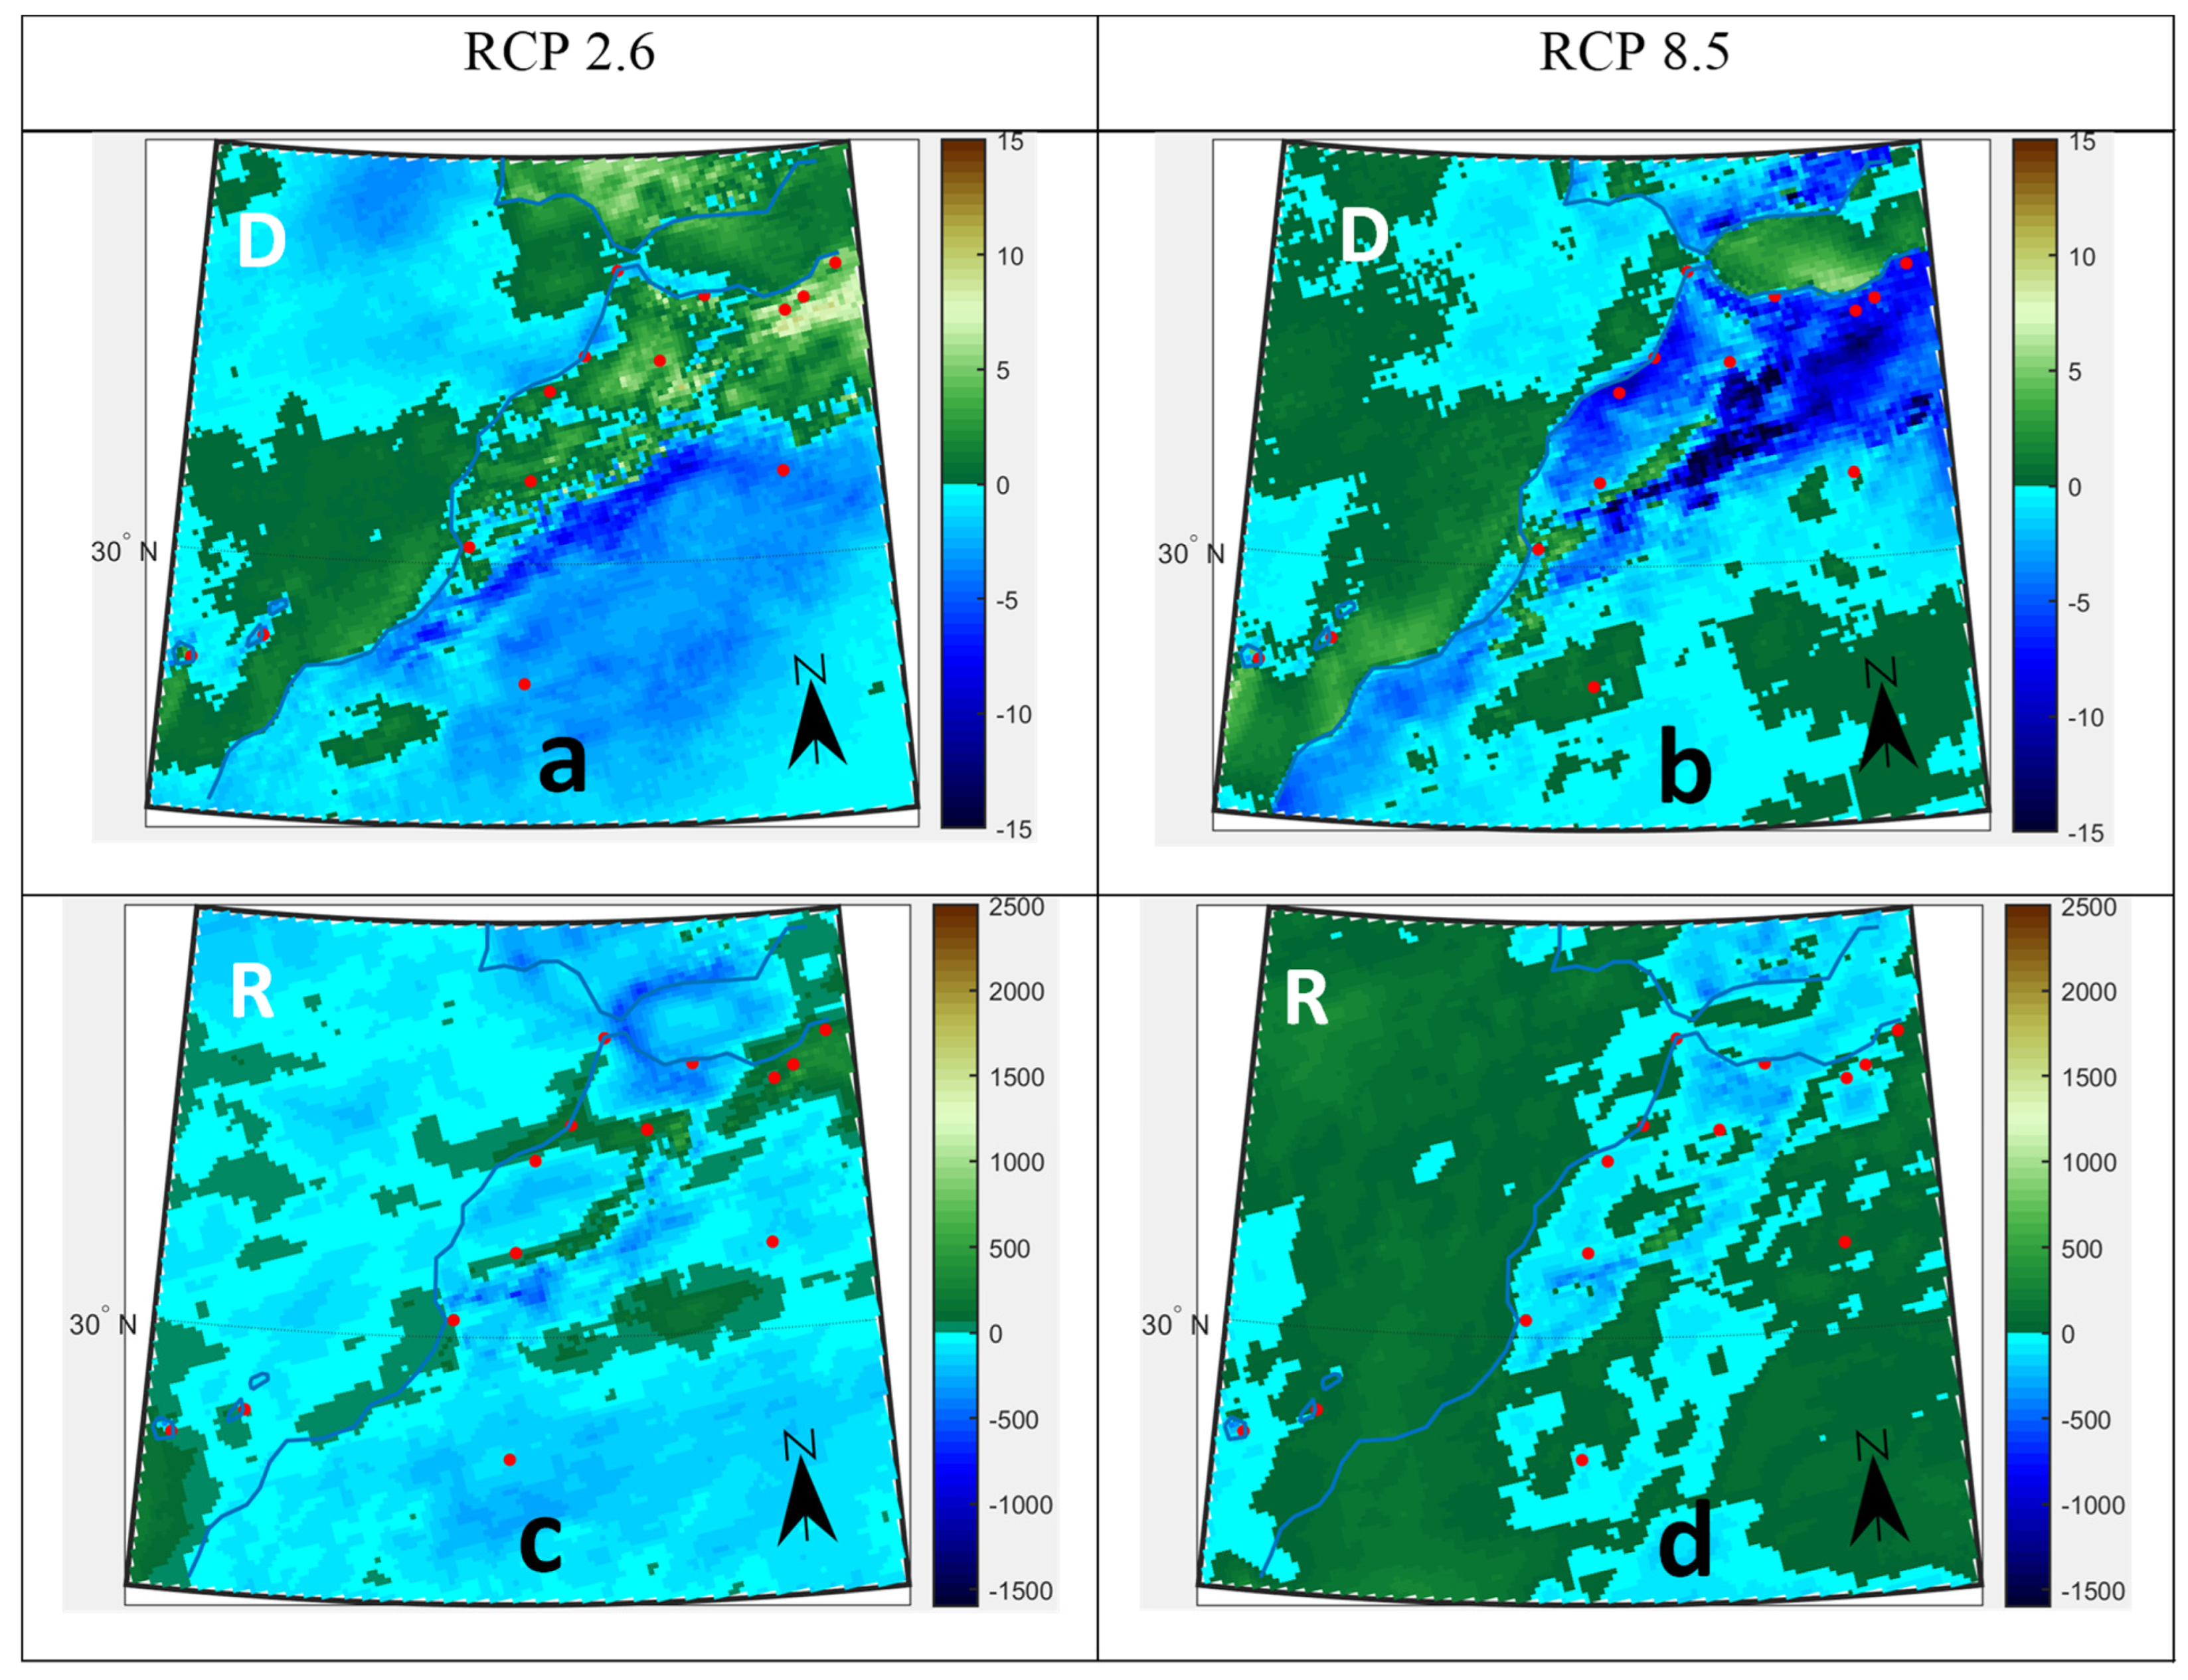
As expected, the Atlantic and Mediterranean coasts are the regions with the largest dew yields (dew > 20 mm·yr−1). For 2020, both scenarios present the same situation. For the future, whatever is the climatic scenario, one notes over the century a weak decrease in dew and a significant reduction in rain precipitation. This decrease appears more noticeably after 2050 as if the current climate system had an inertia that any current action could not modify. As expected, the decrease in precipitation is less marked in scenario RCP 2.6. The unfavorable RCP 8.5 scenario leads to a noteworthy diminution in precipitation along the coasts but also on the foothills of the Atlas Mountains.
Figure 8 shows the variations in yields, Δ H d / r , y , between 2100 and 2006. According to Equation (17) with a 5-years’ time step. Regarding dew, the scenario 2.6 leads to a slight increase (0–+5 mm·yr−1) for coastal areas and slight decrease elsewhere (0–−5 mm·yr−1). The mountainous area of the Atlas and the Algerian and Moroccan Sahara will clearly suffer from a marked yearly dew deficit, which can reach −10 mm. Algerian sites close to the Tunisian border will benefit from an increase in dew yields under the influence of humidity from the Mediterranean sea (+6 to +8 mm·yr−1). Unfavorable scenario RCP 8.5 exhibits a greater decrease: The whole country is hit by a decrease in dew yields, including coasts. Coastal towns in Algeria will experience dew yield reductions of around −5 to −10 mm·yr−1. Paradoxically, the desert areas of the Sahara may benefit from an increase in dew yield of a few mm (<5 mm·yr−1).
Regarding rain, most of the country will be affected by a notable drop in precipitation. The amplitude of this decrease can reach the coast at 200 mm·yr−1 and 400 to 500 mm·yr−1 on the foothills of Atlas. Only the extreme south of the country on the Mauritanian border could experience, with the RCP 8.5 scenario, a significant increase in rainfall.

3.3. Correlation between Dew and Rain Amounts

3.3.1. Cumulated Dew and Rain Yields

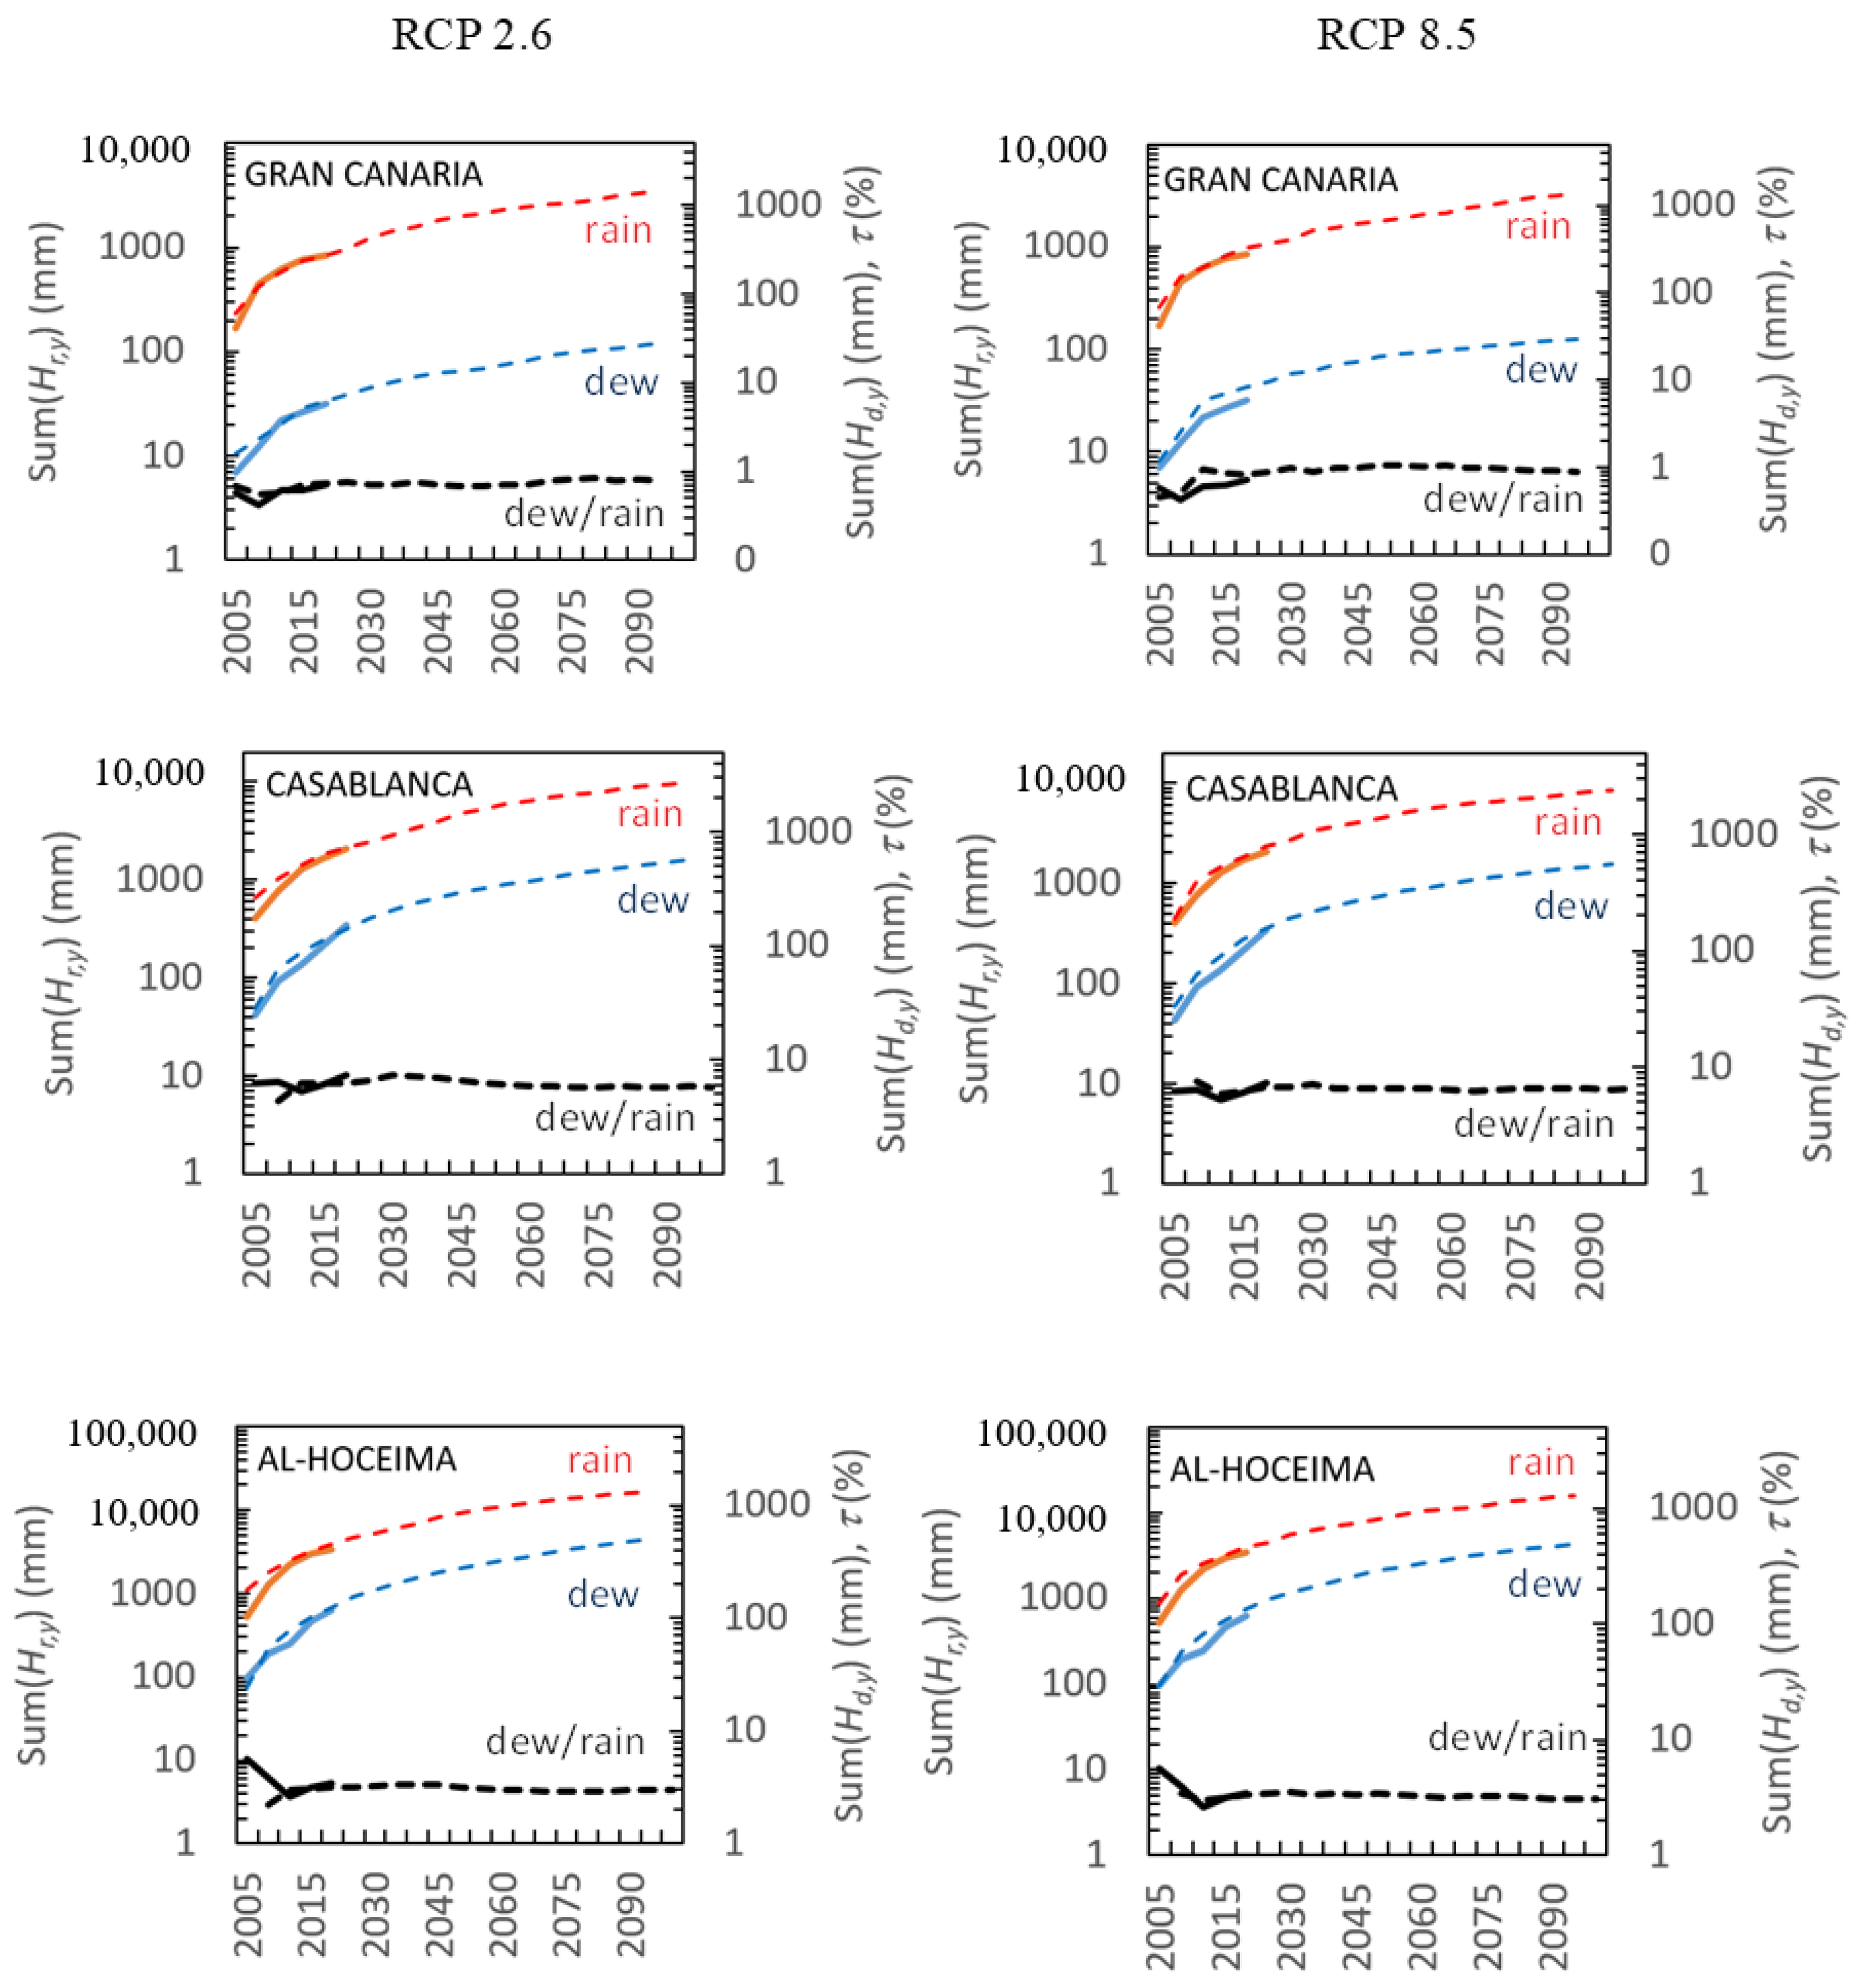
Analyzing the evolution of the summed values of the yearly dew (Hd,y) and rain (Hr,y) yields enables to smoothen the scattering of data and makes more apparent the comparisons. Figure 9 reported the summed values within a 5 years’ time step. The dew/rain ratio
τ   ( % ) = sum H d , y sum H r , y
is also presented.
For each studied site, both past and future periods are considered. Past period 2005–2020 (4 values, full lines are concerned with Hd,y, Hr,y and τ computed from the measured data (Equation (3)). Future period 2006–2100 (20 values, interrupted lines) deal with parameters calculated from the predicted meteorological data according to scenarios RCP 2.6 and RCP 8.5. As examples, Figure 9 presents the evolutions at Gran Canaria island, Casablanca and Al-Hoceima. All other results are presented in Supplementary Materials (Figure S1). As already noted in Section 3.2.1, it can be seen in Figure 9 there is a general tendency to decrease in the slopes of the evolution curves, corresponding to a decrease in dew and rain yields.
The period of 2005–2020 using actual data can be compared with the RCP models. The agreement is generally good (within the exceptions of Agadir and Marrakech for dew). As expected, there is a better agreement with the projection of the scenario RCP 8.5 in this period.
The relative contribution dew/rain as measured by τ (Figure 9) interestingly exhibits nearly constant values during the whole period. The values, reported in Table 4, are dependent on the sites and are found in the range 1–10%. Small values (τ < 2%) are obtained for Gran Canaria, Tindouf, Béchar and Tanger. For Tindouf and Béchar, the low relative humidity strongly impacts dew formation (Table 3). In contrast, in Tanger, the small value of τ can be attributed to the high amount of rain (it is most rainy site, see Table 4). At Agadir, Casablanca and Fuerte Ventura, τ is about 8 to 10%. At Fuerte Ventura, the dew yield is almost 3 times greater (Table 3) than in Gran Canaria, with rainfall two times less than in the other nearby islands (Table 4). Agadir and Casablanca, both coastal oceanic cities, present the largest dew/rain ratios due to high dew yields and moderate rainfalls (Table 3 and Table 4).

3.3.2. Dew and Rain Events Periods

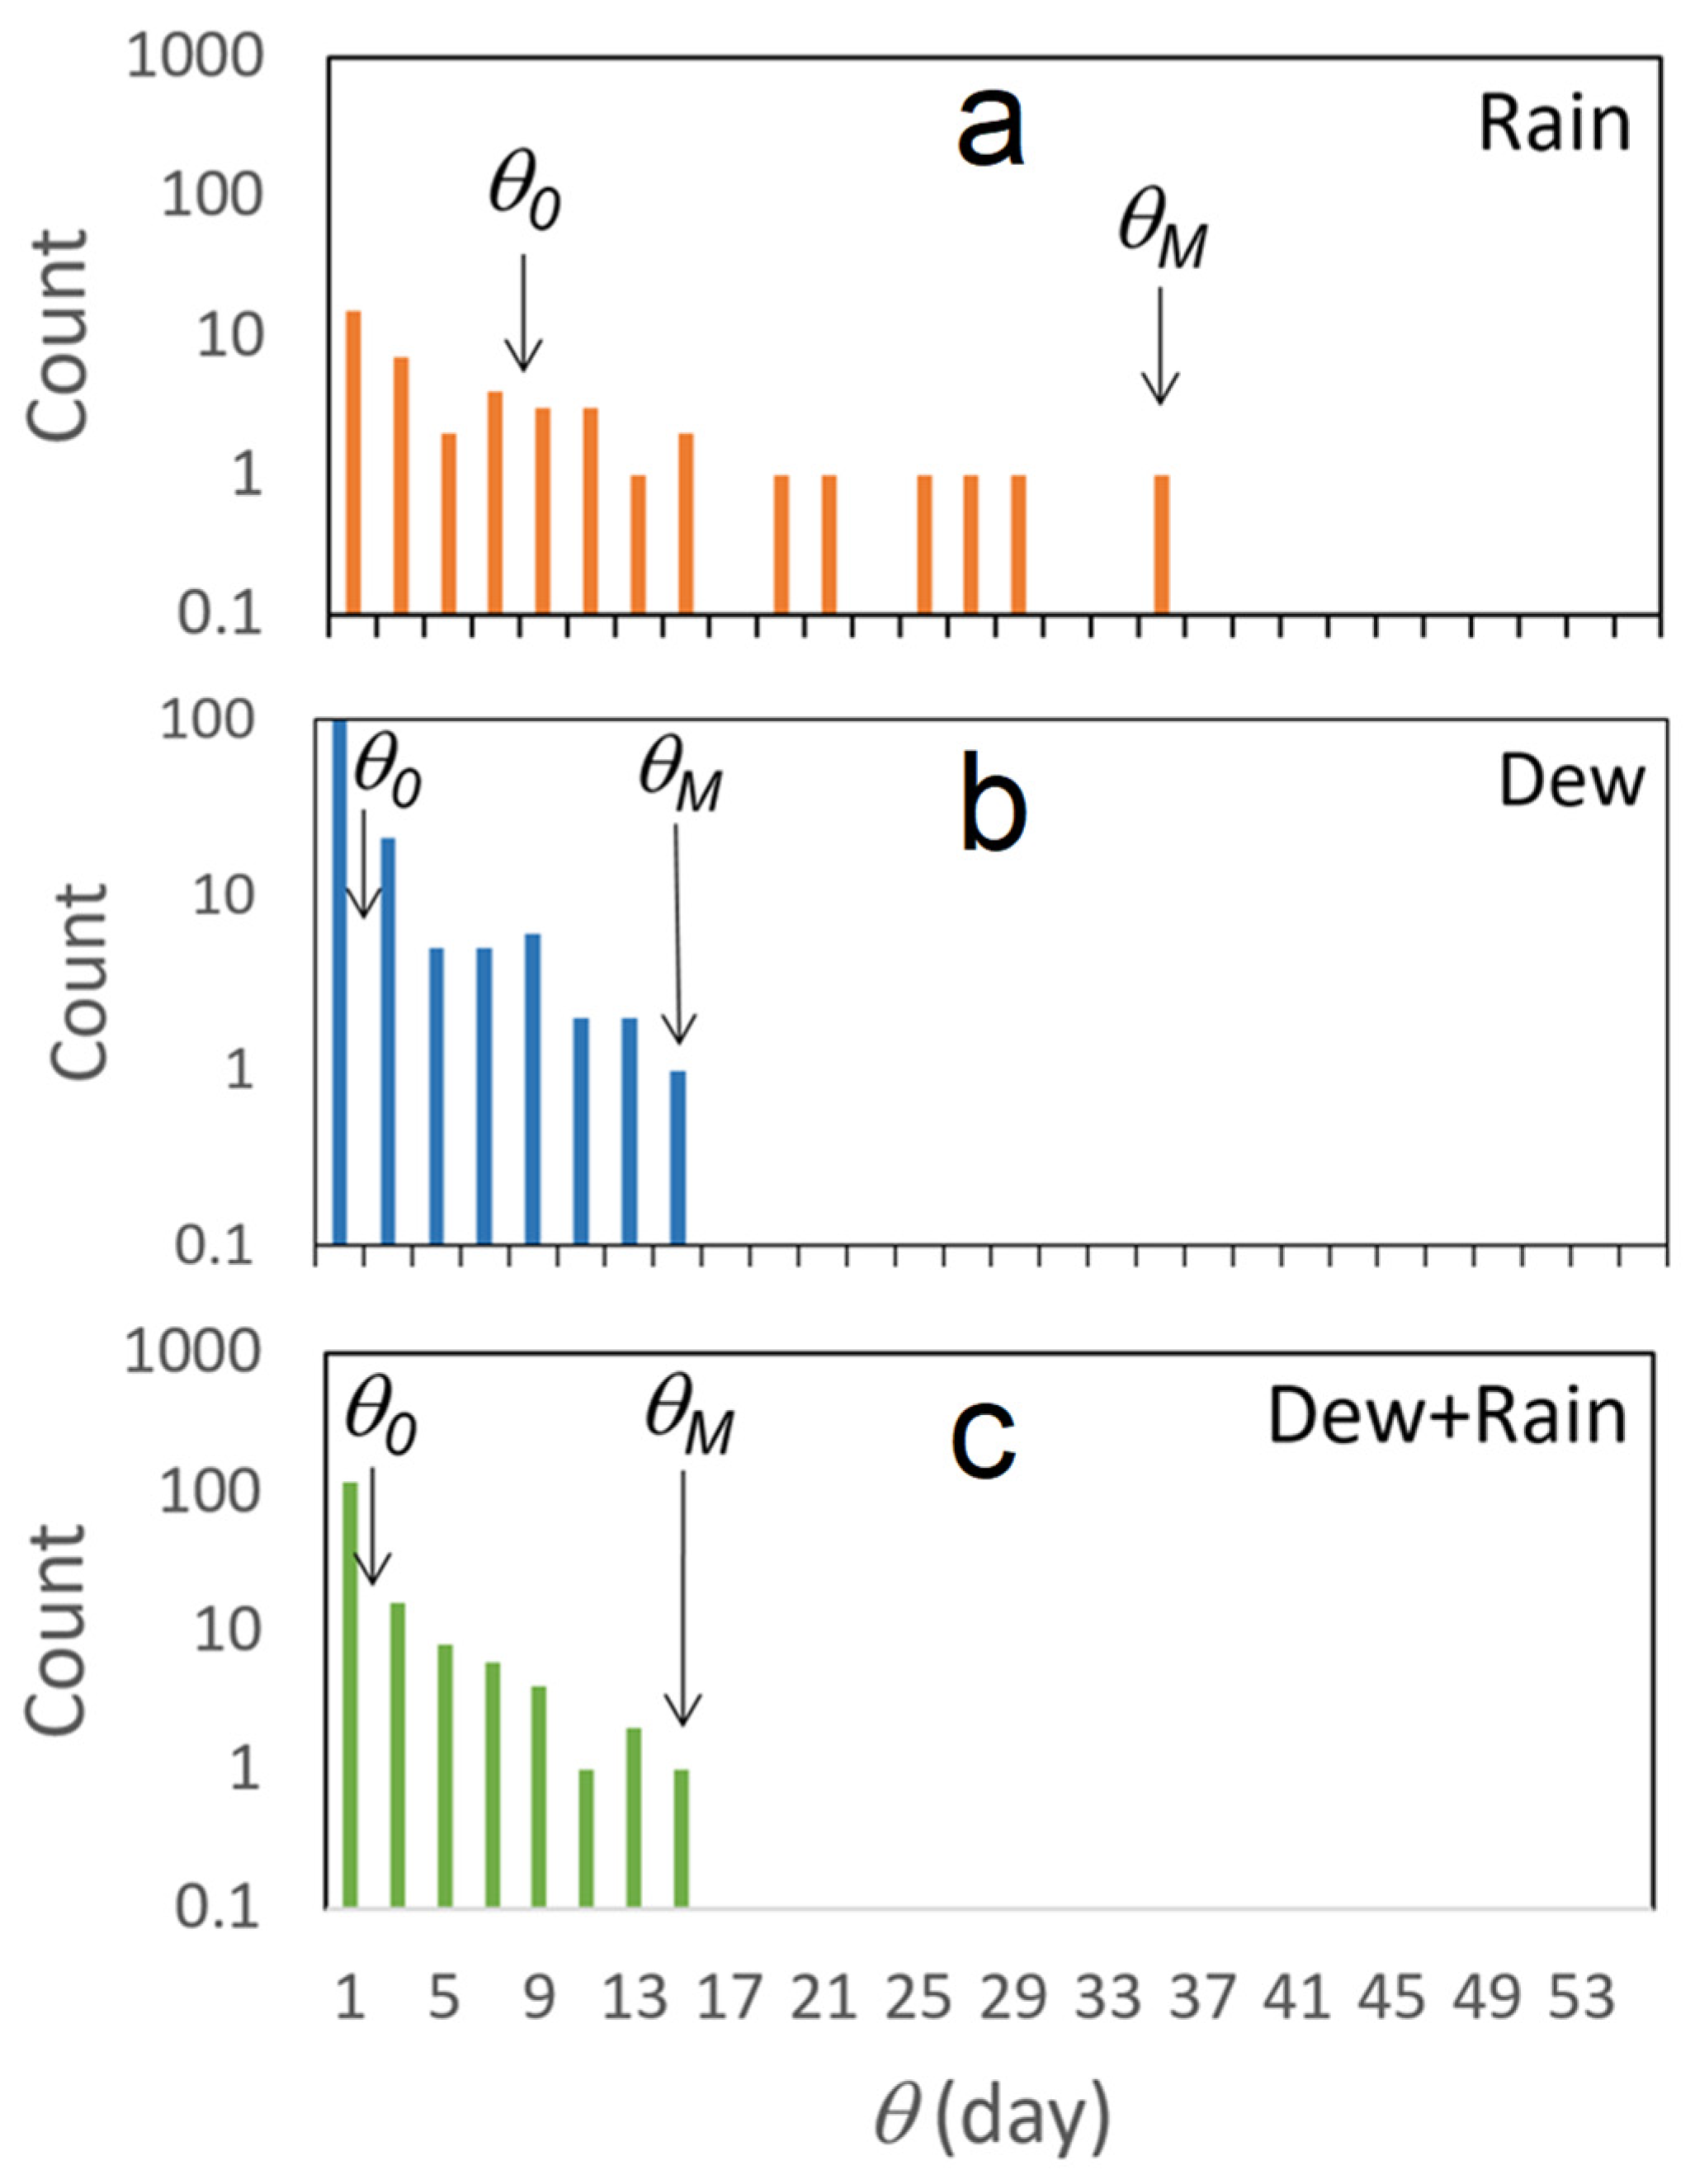
The time period between dew and rain events is important for plants and small living beings [51,52]. One, thus, investigates below this parameter for rain, dew, and dew plus rain. For that purpose, one considers first the histogram of rain, dew and rain plus dew events (Figure 10). Two important parameters can be extracted, the mean time period between events, θ0 (in days) and the maximum time period between events, θM (in days). The values are listed in Table 5 for dew, rain and dew + rain.
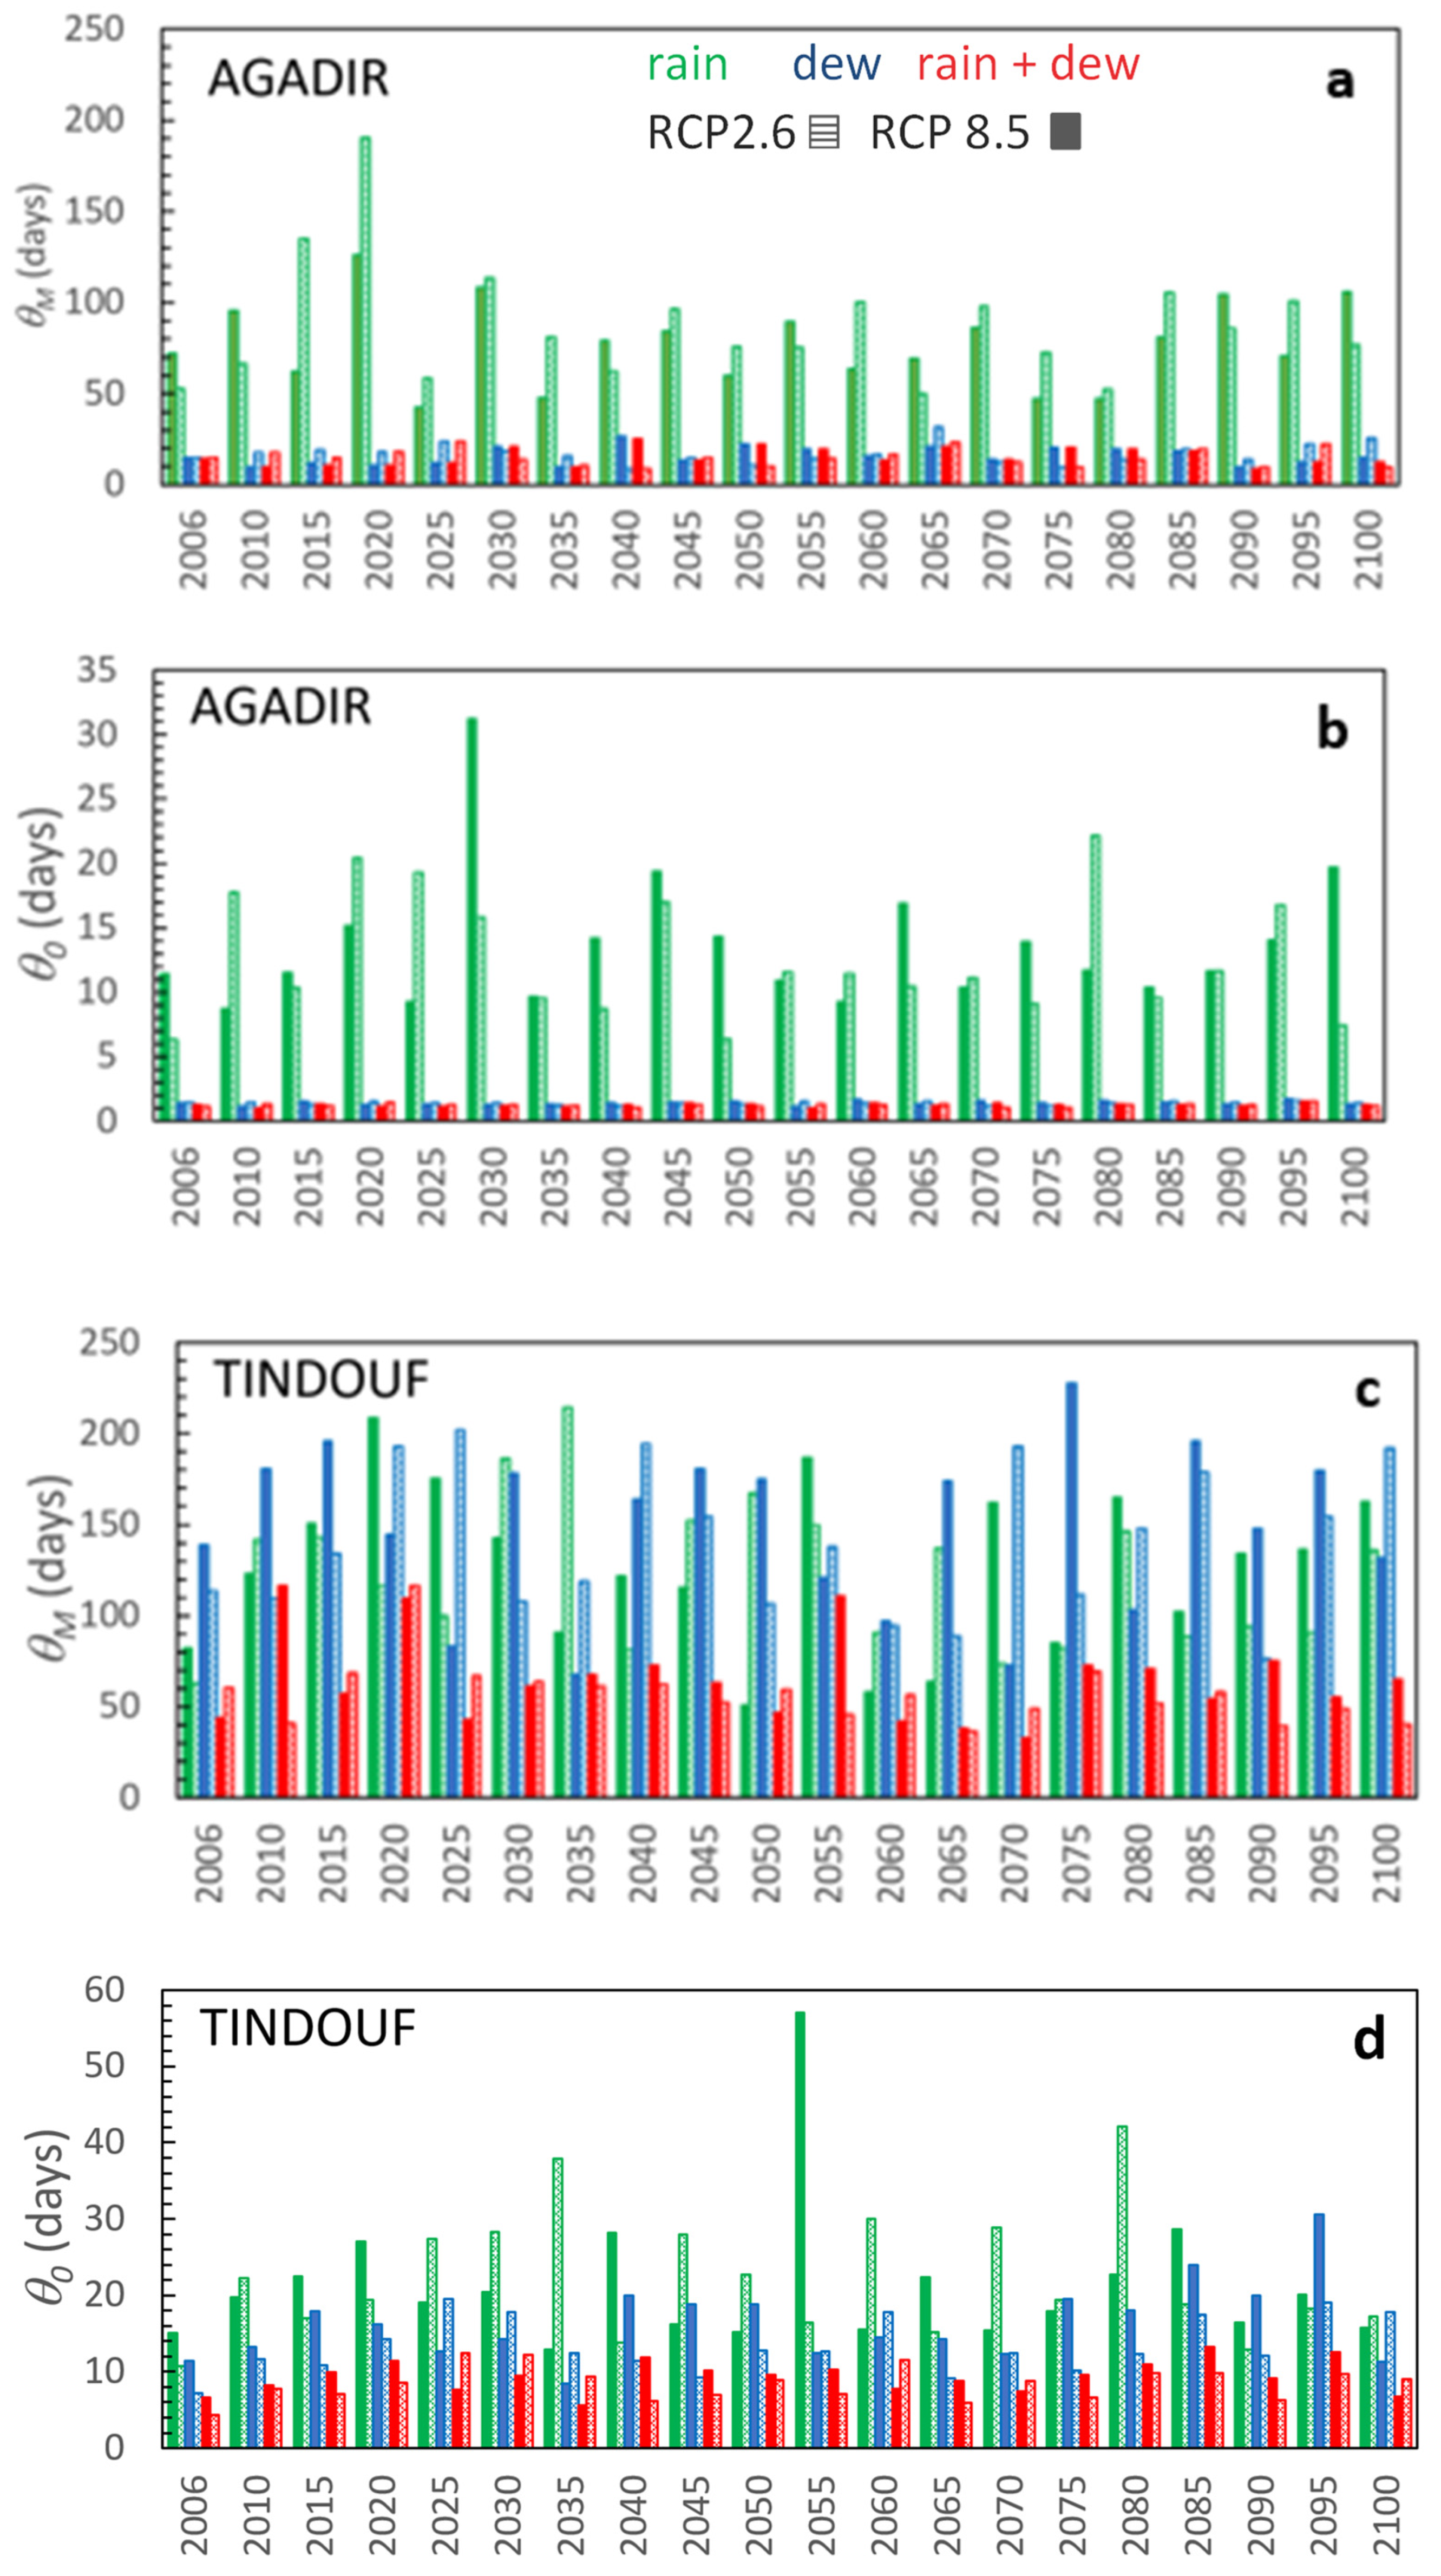
As an example, the evolutions of yearly θ0 and θM for rain, dew, and rain + dew events, are reported in Figure 11 between 2006 and 2100 using a 5 years’ time step for two sites, Agadir and Tindouf. These sites exhibit differences in climates and location (coast, continent), see Figure 1. As expected, the lapse time between events is smaller for dew than for rain, with smaller differences in the continental site of Tindouf. This is a general observation (see Table 3 and Table 4). A similar result was obtained in 4 countries in southern Africa by Muselli et al. [36]. In addition, the timescale for mean and maximum time period between events is much larger for rain than for dew, a difference which can reach two orders of magnitudes.
For both scenarios RCPs 2.6 and 8.5, θM (Table 5) exhibits large standard deviations in the yearly means. For rain, according to both scenarios RCPs 2.6/8.5, one notes that the maximum of times θM can exceed 4 months in 5 locations, those being Agadir (190/120 days), Rabat (79/127 days), Béchar (214/208 days), Gran Canaria (167/176 days), and Fuerte Ventura (242/280 days). For dew, θM is maximum in the Sahara Desert (Béchar and Tindouf, 174/183 and 202/228 days, respectively) and in islands (Gran Canaria, 157/193 days). The combination dew + rain allows the mean period without precipitation to be reduced by a factor of three. The conclusions are similar for the mean lapse time θ0 (see Table 5). One notes, unsurprisingly, that the dew events determine the behavior of the dew + rain time period (Table 5).

3.3.3. Potential (PET) and Real (ET) Evapotranspirations

Moisture from atmosphere plays an important role in sustaining life in arid or semi-arid climates. For example, Pan et al. [53] concluded on the mutual enhanced effect between dew and artificially revegetation ecosystems in the arid desert ecosystem in Shapotou (China). Li et al. [54,55], Zhuang and Zhao [56] determined that dewfall can be presented as a critical source of water in deserts environments, allowing for the establishment of sustainability of sand to stabilize planted vegetation. Kidron [57] suspected dew to be a necessary water source for cyanobacteria. Büdel et al. [51] concluded a study by noting that the time frequency of rain precipitations is more important than their amount for sustaining the biological soil crusts.
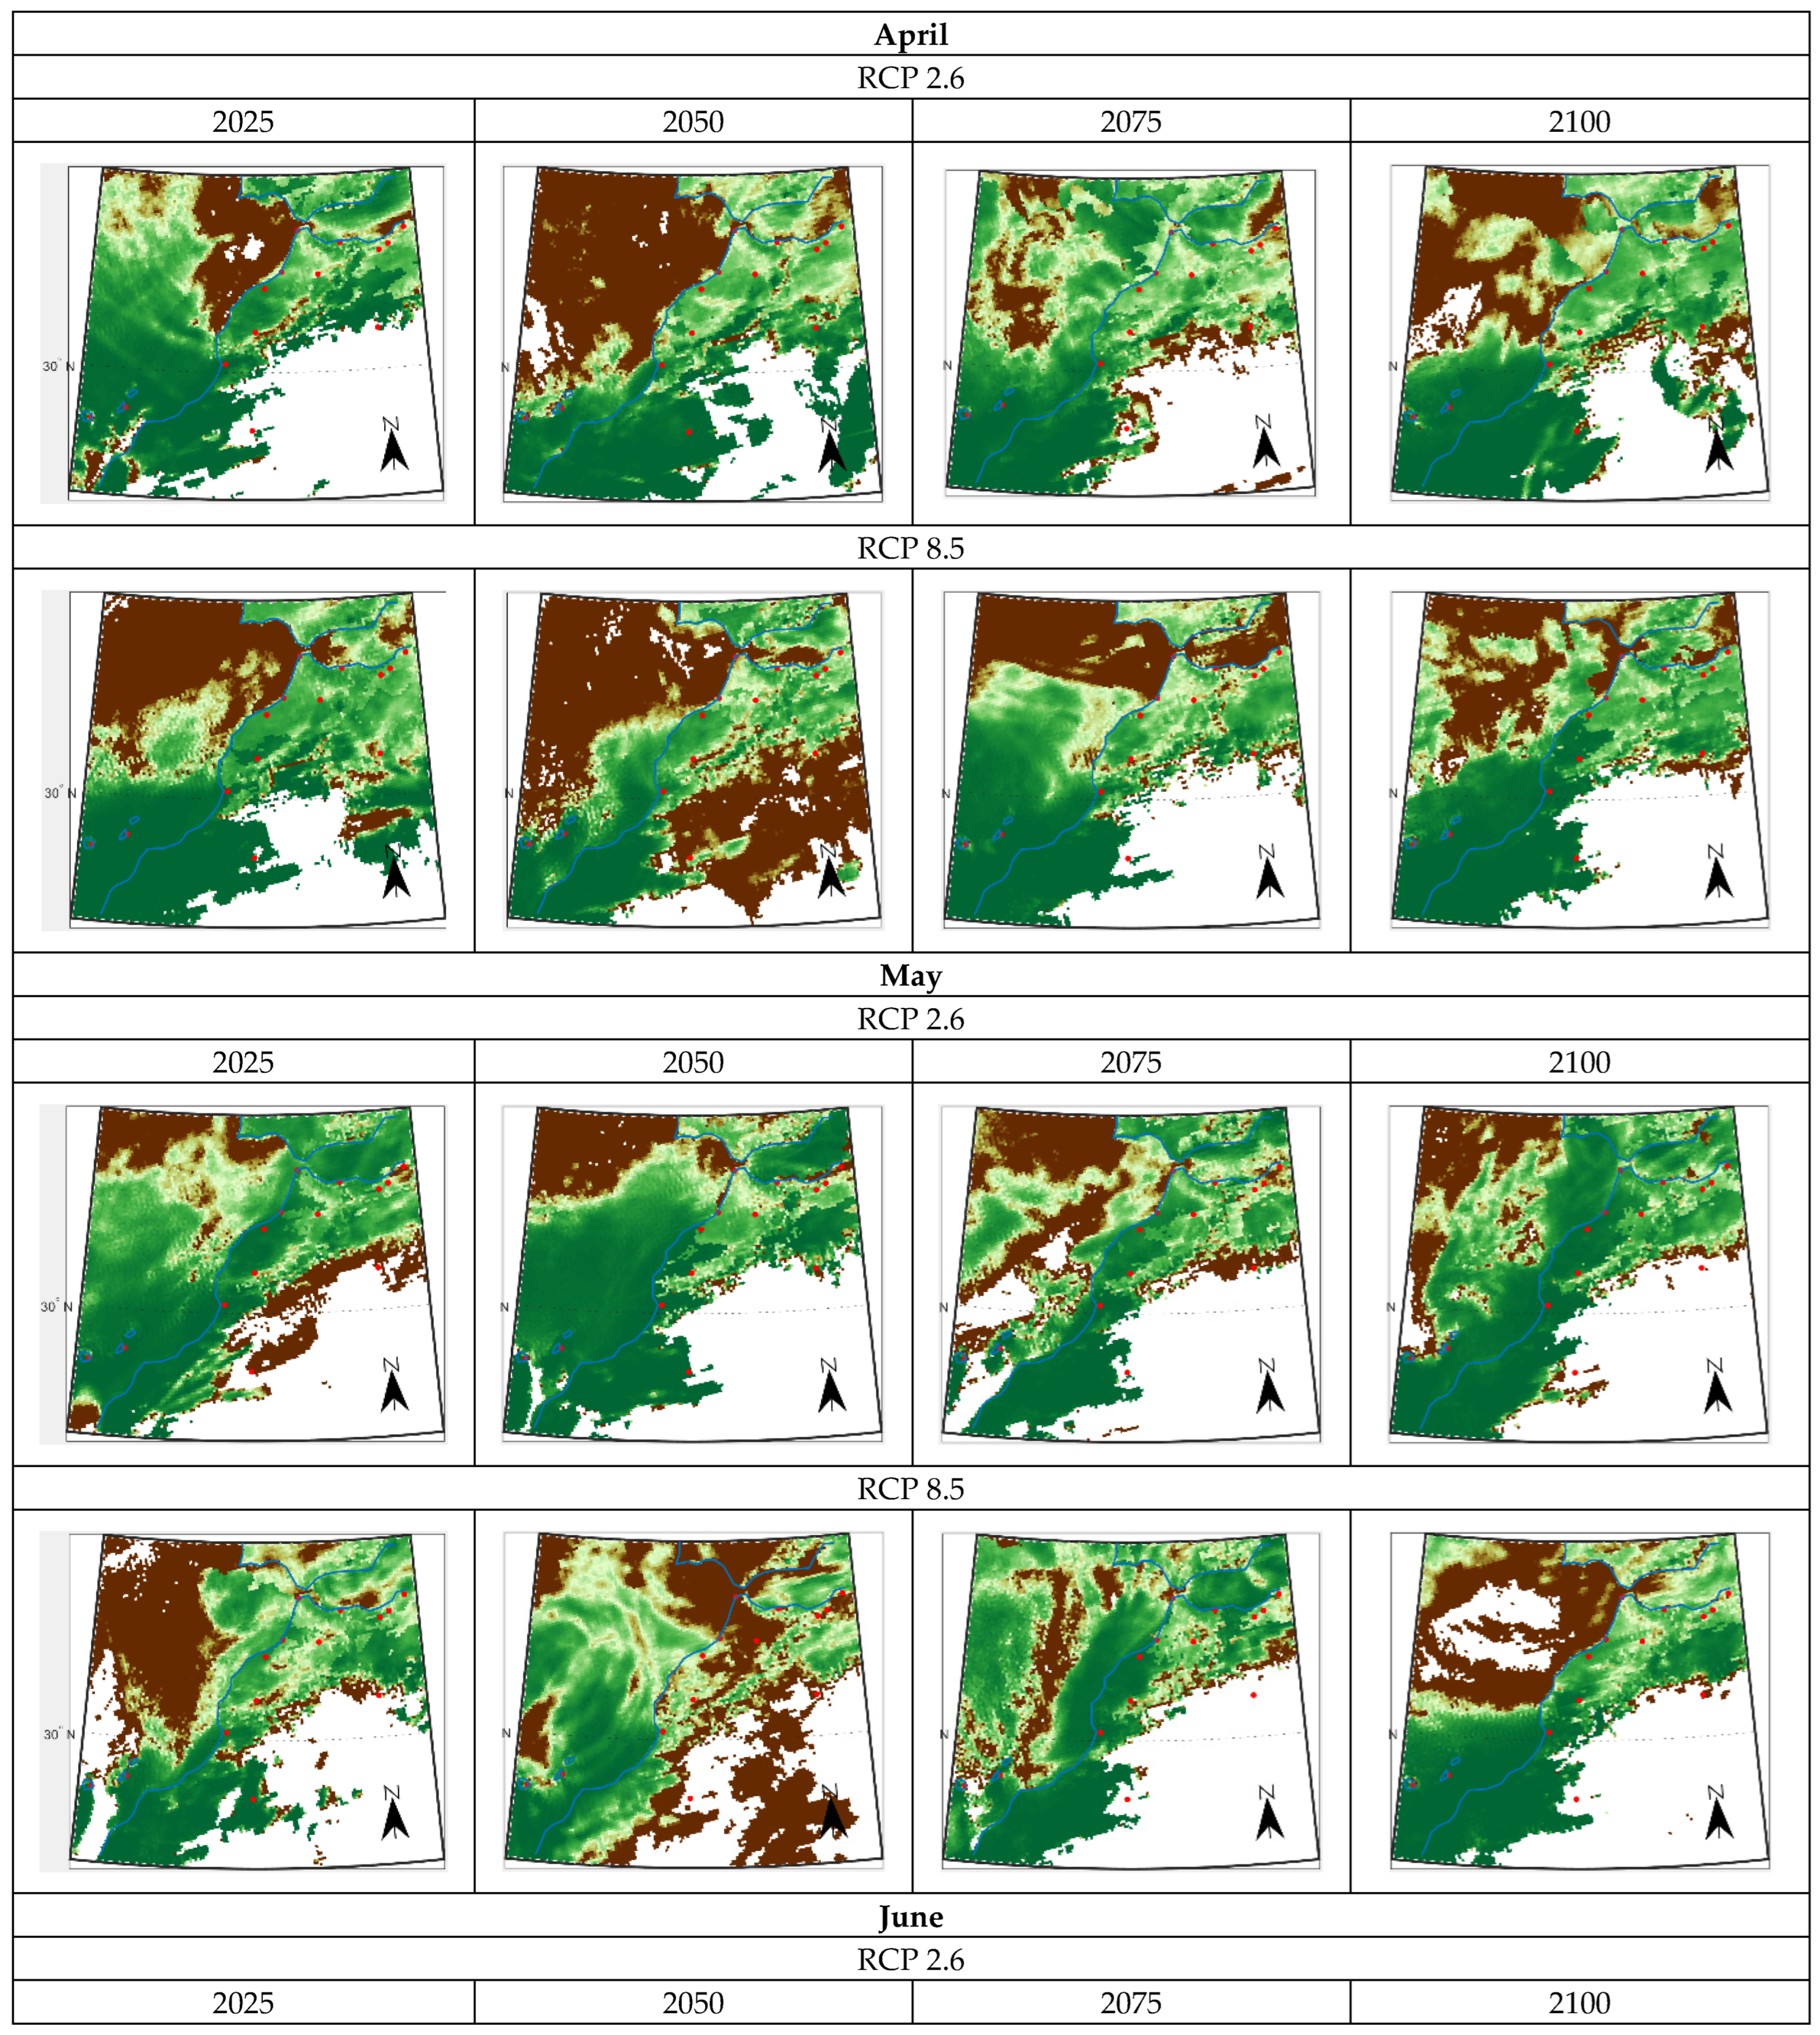
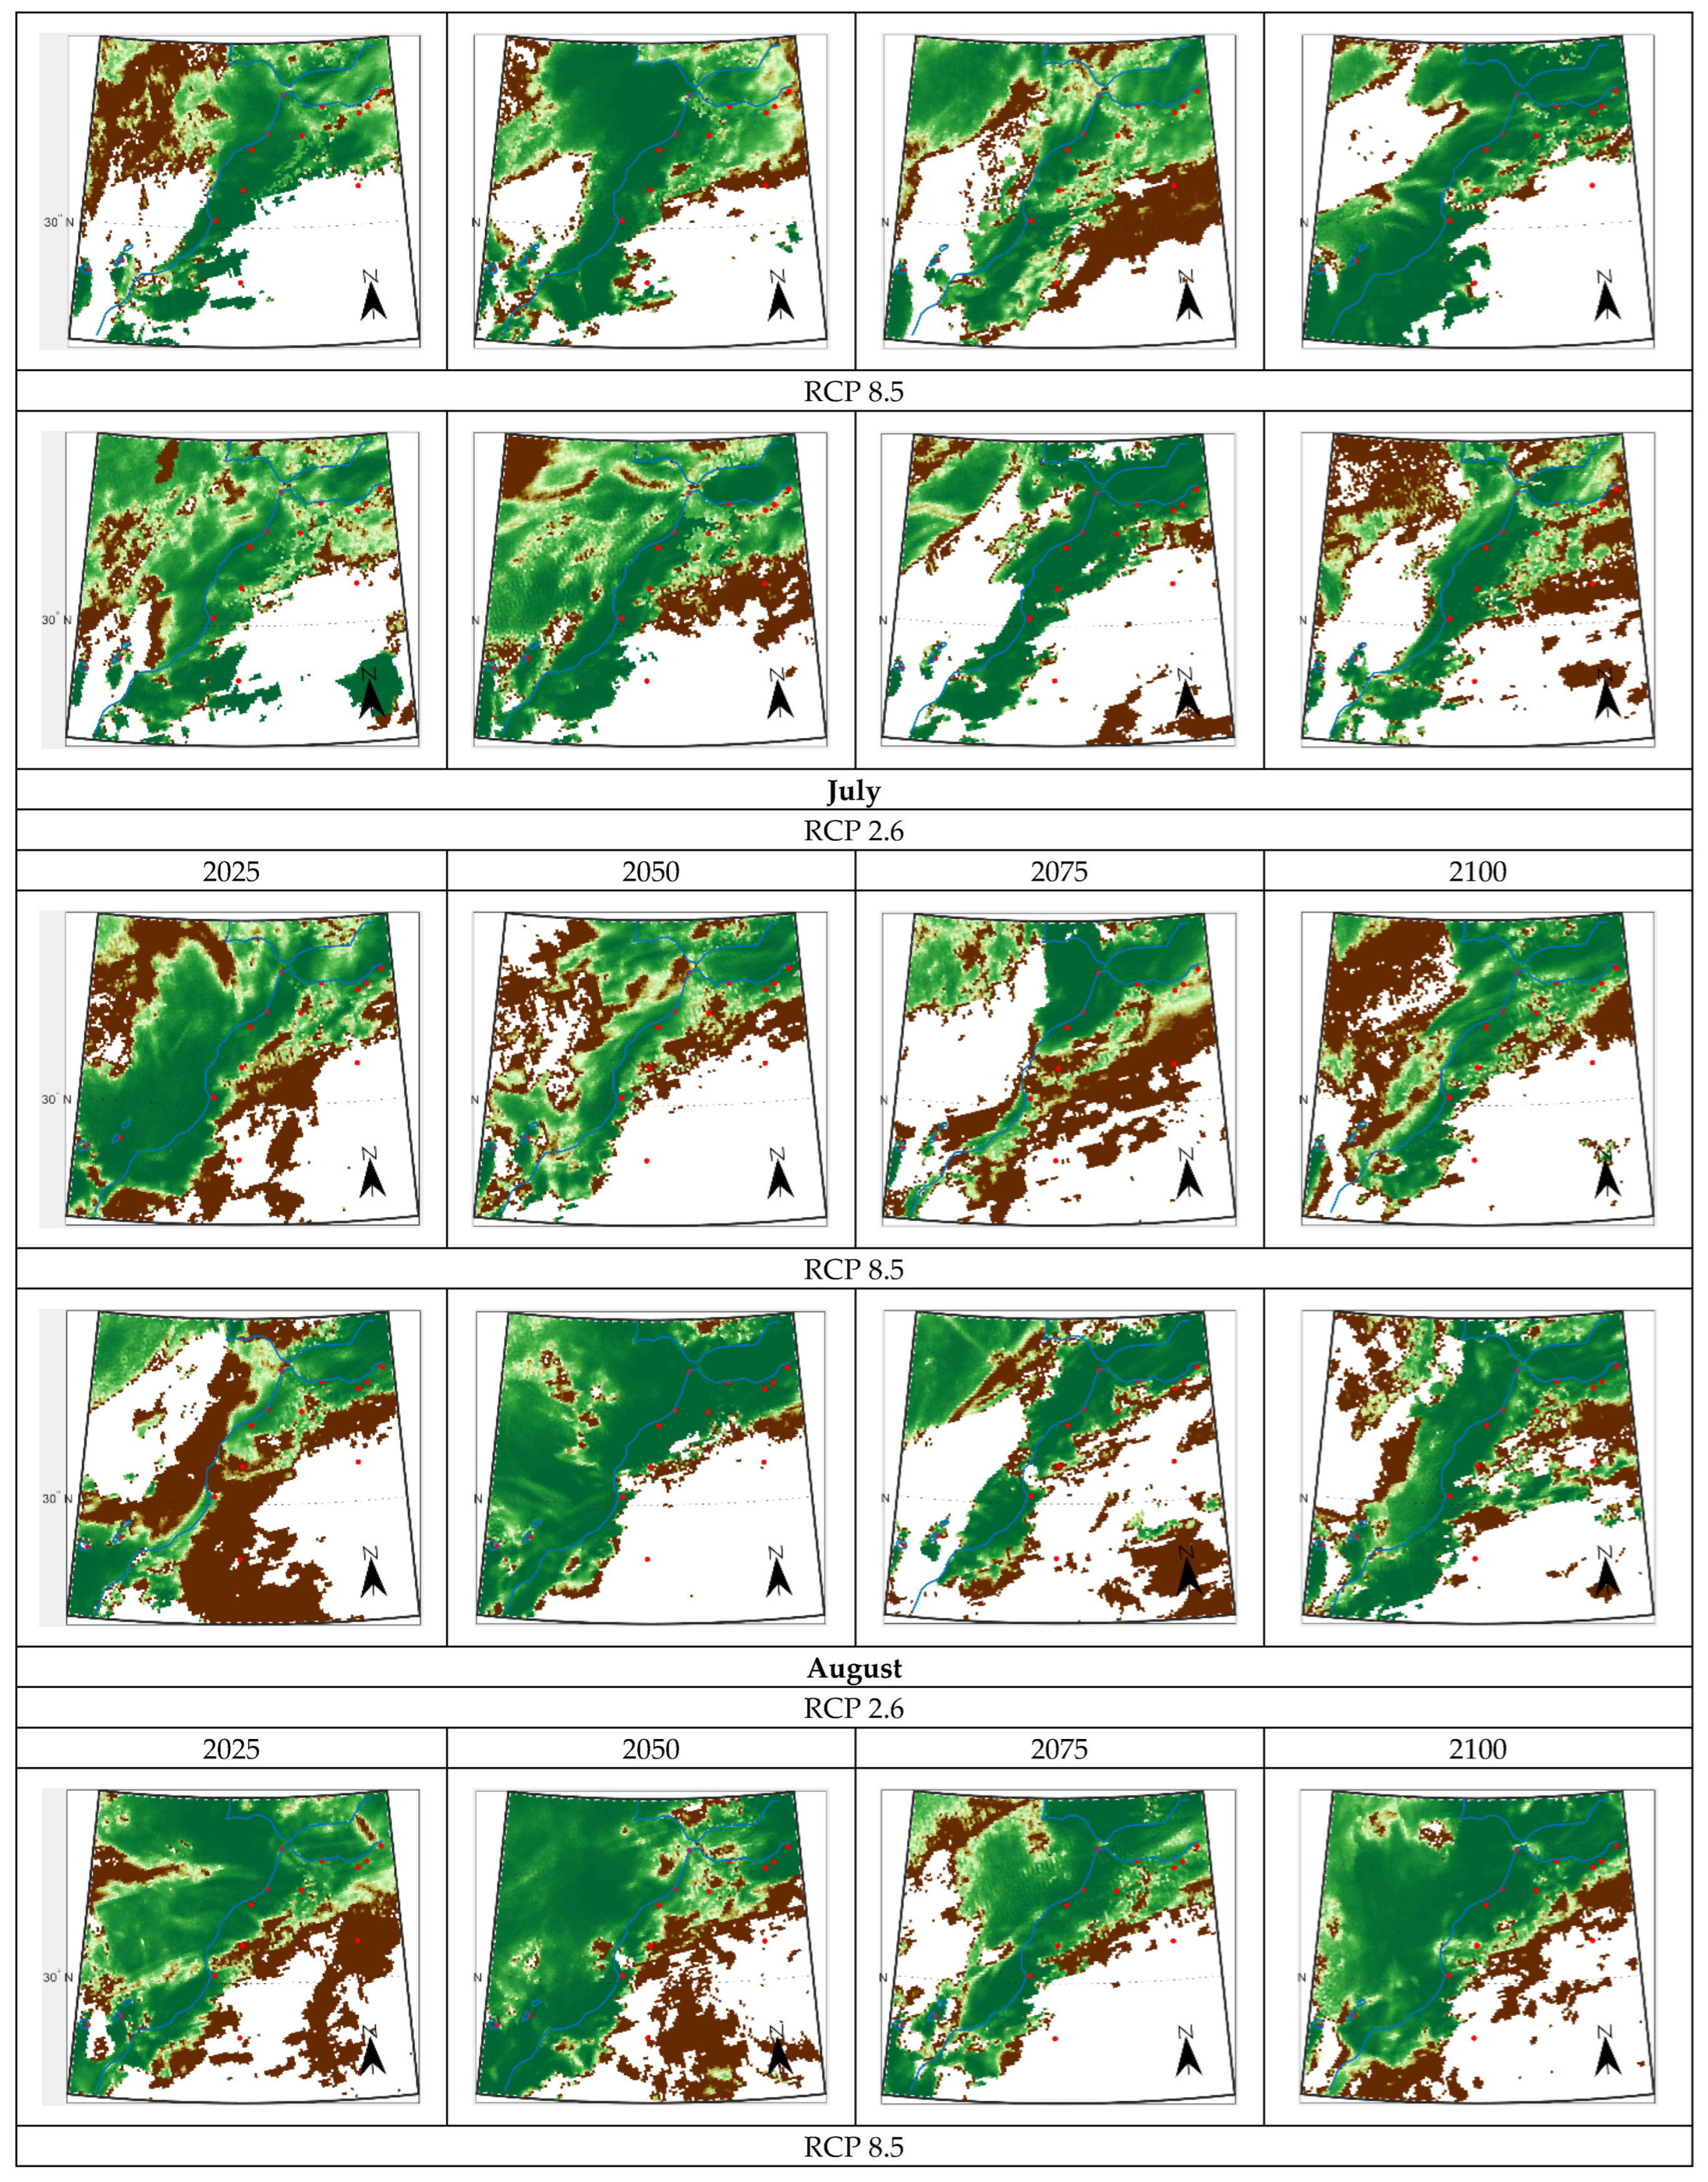
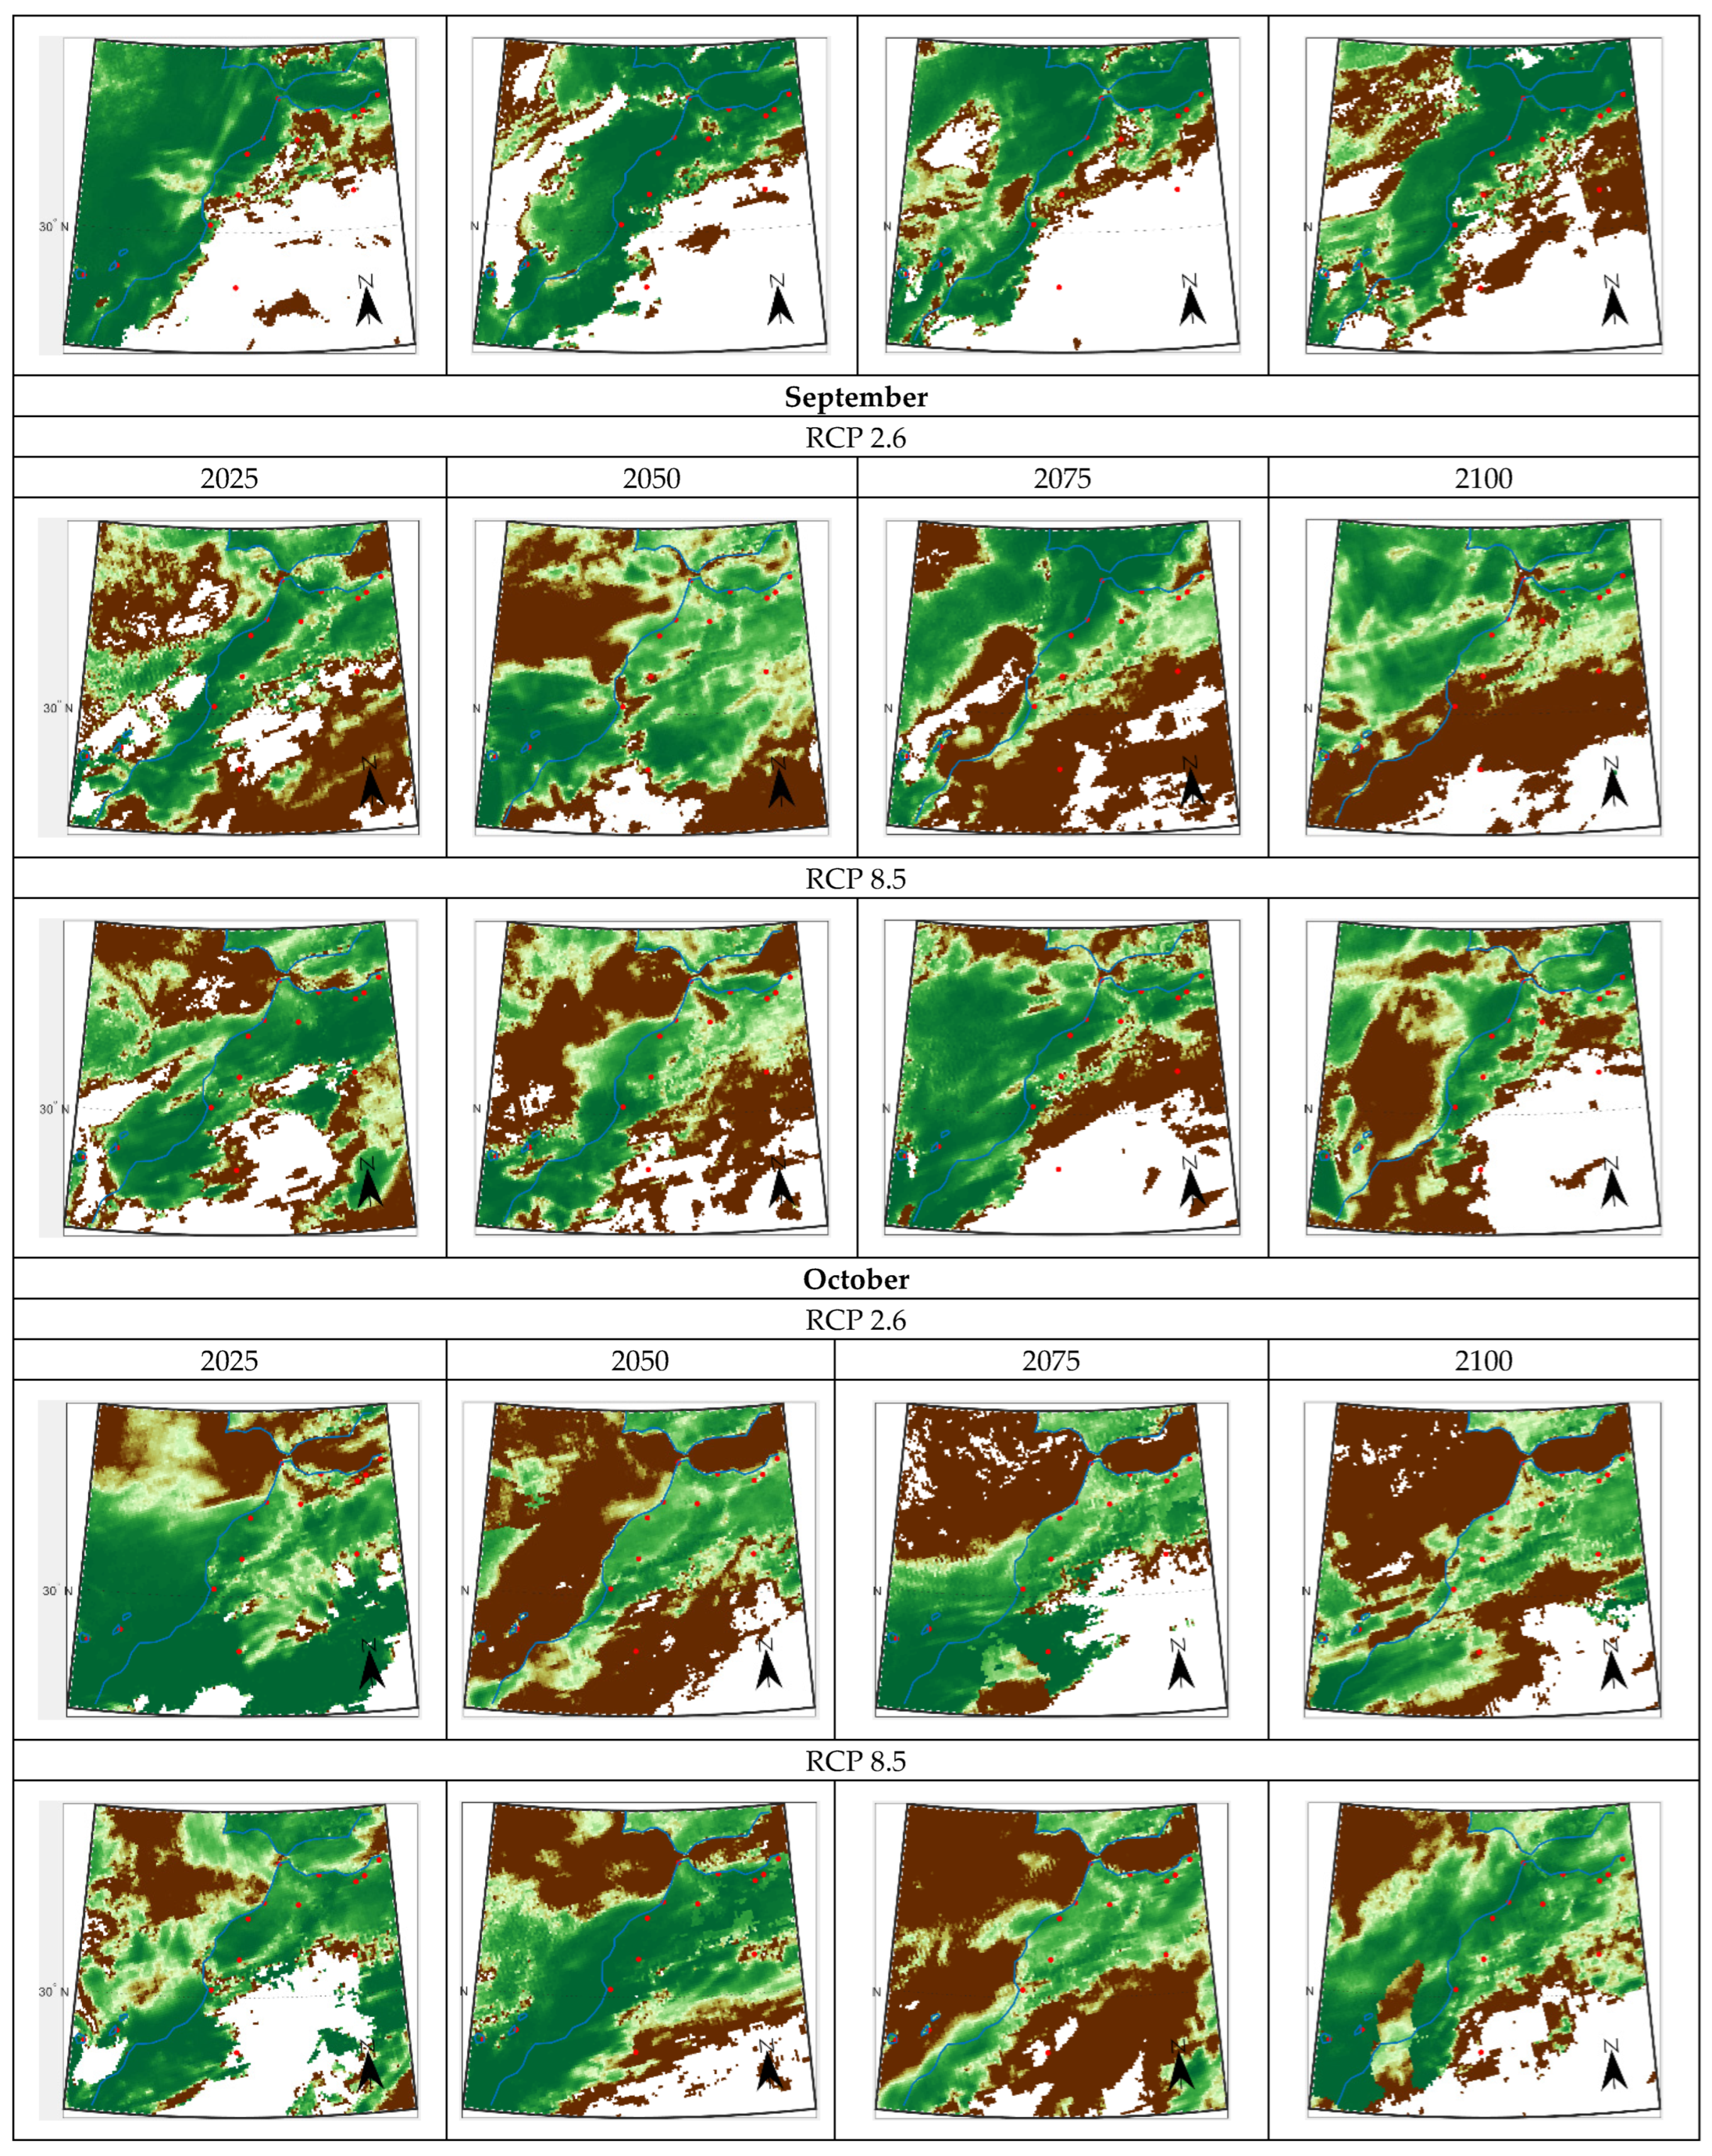
The ratio between the monthly potential evapotranspiration amount (PET) and monthly dew yield (Hd,i) is therefore of importance and worth of investigation during the dry period (April to October). In Supplementary Materials is drawn (Figure S2) the ratio between PET and Hd,i for 4 future years (25 years step) according to the projections of the climate models RCP 2.6 and RCP 8.5. The Atlas mountain range appears as a topographic barrier that delimits two different climate behavior. West of the mountains, the Atlantic coast benefits from oceanic moisture inputs where the PET/Hd,i ratio can be much less than 50. Depending on the months of the dry period, this coastal zone, which also extends over the Mediterranean coast, is restricted to the immediate vicinity of the coasts. In the middle of the dry period (June, July, August), the Atlas area is characterized by an absence of dew production. In mid-season months (April, May, September, October), the PET/Hd,i ratio can reach a value up to 300 in this area.
The trend of the PET/Hd,i ratio strongly depends on the value of the RCP climate scenario. RCP 2.6 leads to a stable evolution between 2025 and 2100, with values PET/Hd,i < 50 in the inland, in agreement with Tomaszkiewicz et al. [33]. The ratio can however reach 100 or even 150 on the southern coast of the country (south of Agadir up to the Mauritania boarder). The RCP 8.5 scenario, which exhibits a noticeable increase in ambient temperature over the century, leads to greater potential evapotranspiration and a stagnation or even a light decrease in dew yields (Figure 6). PET/Hd,i values can thus exceed 100 over a large part of the studied area, in particular on the Atlantic and Mediterranean coasts. The PET/Hd,i ratio can no longer be evaluated (Hd,i → 0) when moving to the east and south-east of the Atlas massif where the lack of relative humidity leads to a drying of the air mass and an absence of dew (Figure 2b).
Considering now the actual evapotranspiration ET, with E T P E T according to Equations (9)–(12), the comparison between ET and Hd,i (Figure 12) during the hottest months of the year shows the potential interest of dew for organisms and plants living in these areas under high water stress. In August (RCP 2.6), ET/Hd,i < 30 corresponds to 18.9% (2025), 12.5% (2050), 8.6% (2075) and 15.6% (2100) of the studied area. For RCP 8.5 (July), ET/Hd,i < 30 is observed for 9.5% (2025), 22.4% (2050), 12.3% (2075) and 27.4% (2100) of the studied area. The evolution corresponds to an ET increase due to the rise of the ambient temperature and the decrease of RH. For ET/Hd,i < 10, the area values are 7.7% ± 2.5% (RCP 2.6) and 12.0% ± 6.8% (RCP 8.5). These values highlight the interest in irrigation of native and little plants with small root zone area, which limits evaporation.

3.4. Chemical Composition

3.4.1. Previous Studies

An investigation of the chemistry and biology of dew and rainwater has been reported by Lekouch et al. [24] in Mirleft (S-Morocco), a site typical of an arid environment. This work showed the following. (i) Presence of significant concentration in dew and rain of total dissolved solids, mainly due to the deposition of sea salts. (ii) Near constant neutral pH for dew and rainwater. (iii) High dew and rain electric conductivity, related to the large concentration of dissolved solids. (iv) Acidity of the CO2, SOx and NOx compounds neutralized by Ca2+ and K+, which gives an alkaline character to dew and rainwater. (v) Balanced electro-neutrality, confirming that the analyzed ions are representative. (vi) Chemical and biological characteristics of dew and rainwater compatible with drinking water standards of the World Health Organization (WHO) after disinfection to eliminate the possible pathogenic germs present in the solutions.

3.4.2. Chemical Composition: A New Approach

In this section one reexamines the above data by taking into account the effect of dilution and motion of air masses. These parameters can exhibit significant modifications in the future, leading in particular to dew and rain decrease (see Section 3.2.1) and change in water composition. In contrast to the previous study [24] where the means were calculated as arithmetical means [58], in the present analysis the data are volume weighted means (VWM), giving more representative values for water accumulated in a tank. The obtained value is in general close to the median value.
The volume mean is computed from the following relation:
V W M [ X ] = i = 1 N ( V i X i ) i = 1 N V i
where X represents the variable to be analyzed (ion concentration, electrical conductivity) and Xi and Vi are, respectively, the variable value and the water sample volume for sample i.
The data in [24] are concerned with the chemical composition of dew (17 samples) and rain (8 samples). The samples are collected at Mirleft on a standard condenser 1 m × 1 m, inclined at 30° horizontal, thermally isolated from below and covered with a low-density polyethylene foil. In this foil are imbedded a few % of TiO2 and BaSO4 microbeads, plus a surfactant insoluble with water ([59,60], manufactured by OPUR [61]). Details of dew and rainwater collected volumes are reported in the same ref. [16].
The materials and methods to collect and analyze water can be found in [16]. Only a summary is presented here. Dew and rainwater (not filtered) were collected in sterilized polyethylene flasks placed in a cold enclosure (temperature below 20 °C) for further analysis. In this case, pH and electrical conductivity (EC) measurements were performed on site just after water collection. They are concerned with 130 data (dew EC) and 133 data (dew pH) and 25 data (rain EC and rain pH). Samples were analyzed later to determine the chemical concentrations of cations (Na+, K+, Ca2+, Zn2+, Cu2+, Mg2+, Pb2+) and anions (HCO3, Cl, SO42−, NO3). The quality control/analysis (QA/QC) of measurements consists of information used to obtain exact and reproducible results, such as the analysis sequence, including various QC tests.
The chemical compositions have been evaluated by classical statistical indicators (min, max, mean and standard deviation). As noted above, in the present analysis the mean is volume weighted mean (VWM). Dew and rain data are compared with the chemical analyses of a local spring water, “Sidi Ali”. The analyses (about 20) were carried out between 1995 and 2005 by Olive at al. [62]. “Sidi Ali” is a weakly mineralized spring water, collected in the village of Tarmilate (middle Atlas Mountains, 33°23′5″ N 6°7′13″ W), a few kilometers from the town of Oulmès at 1100 m elevation (578 km from Mirleft). Water comes from precipitations and is naturally filtered by the rocks and enriched over time with mineral salts.

3.4.2.1. Dew, Rain and Spring Water Ionic Concentrations

The analytical results are reported in Table 6 and the VWM concentrations of ions and cations are shown in Figure 13. For a given water sample, chemical compositions (dew or rain, in mEq·L−1) have been evaluated by classical statistical indicators (min, max, arithmetical mean and standard deviation) and also the volume weighted mean (VWM). The arithmetical mean values from [24] are generally found close to the VWM values. For dew, the major ions are by far Na+ and Cl. The result is the same, but to a lesser extent, with rain. For both dew and rain, the major cations are in the order Na+ >> Ca2+ > Mg2+ > K+. The composition of the spring water “Sidi Ali” is similar, with less Na+ and Cl ions concentration and an inversion between Mg2+ and Ca2+. The concentrations in dew of Cu2+, Zn2+ and Pb2+ are negligible (<0.05 mEq·L−1). For dew and rain samples, two major anions are present Cl >> HCO3 >> SO42− ~ NO3. It is noticeable in the spring water that a high concentration of SO42− (0.979 mEq·L−1), about 3 times greater than in dew and rain.
For all analyzed ions, the concentrations of cations and anions are compatible with WHO potable water standards [63,64]. As discussed in [24], the large concentration of Na+, Mg2+ and Cl in dew and rain samples can be attributed to a marine origin, due to the close vicinity of the sampling site with the Atlantic Ocean (a specific analysis with air mass trajectories is given in Section 3.4.2.3 and Section 3.4.2.4).
Dew and rain samples exhibit large total hardness values (TH, French degree °f), computed from Ca2+ and Mg2+ in mg·L−1. The mean VWM values are TH dew = 16.9   ( min / max : 6.1 / 42.7 )   and   TH rain = 9.9   ( min / max :   2.4 / 20.8 ) .   These large values are mainly due to the high concentration of calcium, of terrestrial origin, and magnesium, of marine origin. Hence, dew water can be considered as a medium hard water (15 < TH (°f) 30) and rainwater is considered as fresh water (7 < TH (°f) 15). For the spring water Sidi Ali, THSidi_Ali = 6.7, making it a very fresh water (0 < TH(°f) 7). No health-based guideline values are proposed for hardness in drinking-water [64]. Considering 1°f = 10 mg·L−1 CaCO3, the mean total hardness of dew and rain samples corresponds, respectively, to 196 mg·L−1 (min: 61 mg·L−1; max: 420 mg·L−1) and 120 mg·L−1 Ca CO3 (min: 24 mg·L−1; max: 208 mg·L−1). According to [64], depending on the interaction of other factors such as pH and alkalinity, water with a hardness above approximately 200 mg·L−1 may cause scale deposition in the treatment works, distribution system, pipeworks and tanks within buildings. It will also result in high soap consumption and subsequent “scum” formation. Upon heating, hard waters form deposits of calcium carbonate scales. Soft water (but not necessarily cation exchange softened water) with a hardness of less than 100 mg·L−1 may, in contrast, have a low buffering capacity and so be more corrosive for water pipes. Considering Sidi Ali water, a low total hardness can be estimated (67 mg·L−1 CaCO3).

3.4.2.2. Effect of Water Volume

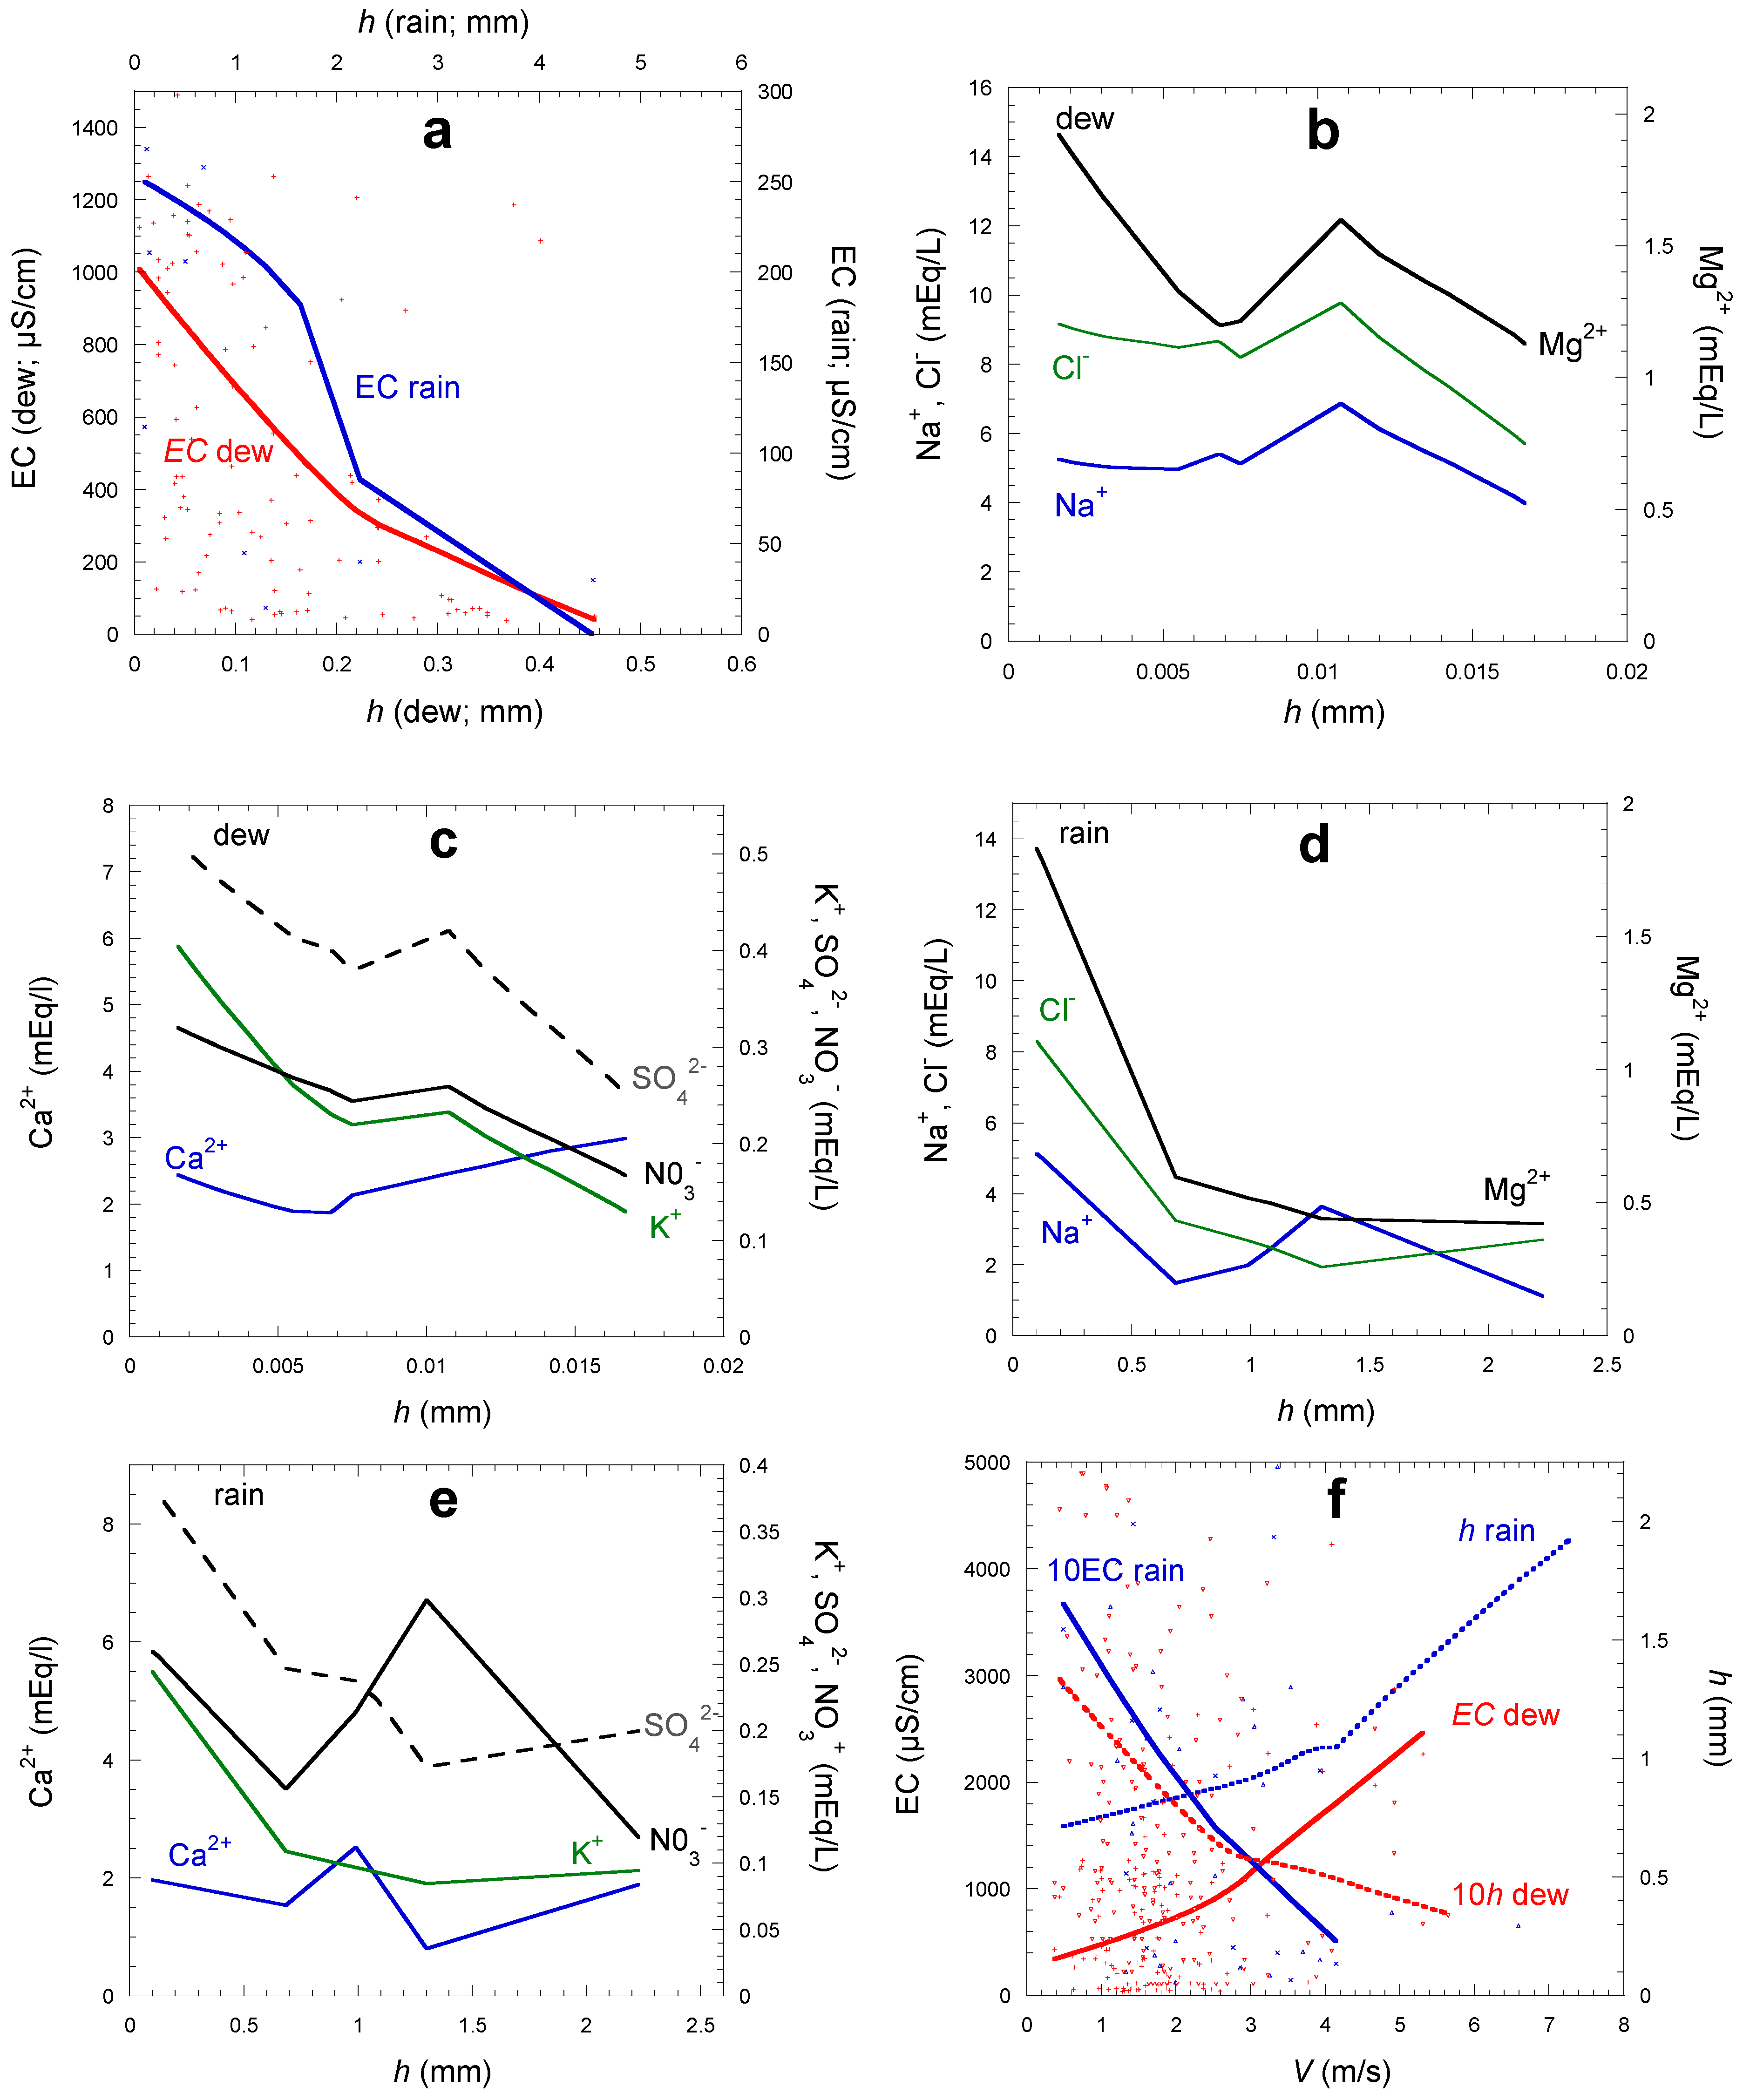
Figure 14a correlates the electric conductivity for dew and rain, corresponding to the total ion concentration in water, with the collected volume per unit surface h (mm). Note the different scales and h-ranges for dew and rain. The EC is seen to decrease with h as an effect of dilution [65,66]. In Figure 14, ions of ocean and continent origin in dew and rain are also shown. In general, smaller volumes match with larger ionic concentrations, corresponding to the same dilution effect observed in EC. This effect implicitly means that the concentration of aerosols and gases deposited from the ambient air keeps roughly constant in the atmosphere. This is of course not always the case, and the ionic concentration and EC should also depend on the air mass trajectories, as discussed in Section 3.4.2.3 (dew) and Section 3.4.2.5 (rain). Next, exceptions to the general dilution effect can be observed. Note that the concentration of ions of gas adsorption origin (SO42−, NO3) exhibit a weaker tendency to decrease with volume because there is nearly no dilution effect, the kinetics of adsorption being very fast. The next sections will, however, show that this dilution effect is dominant in the analyses.
Windspeed indirectly modifies the dew yield by the effect of dilution (Figure 14f), with higher wind speed giving lower dew yield and higher EC or ion concentration. This effect is inverted with respect to rain yield, where higher wind speed corresponds to higher water yield and lower EC or ion concentration. One notes that the dilution effect is, however, also present in rain for the small rain yields, which complicates the analysis (see Section 3.4.2.4 for further discussions).

3.4.2.3. Dew Air Flux Backward Trajectories

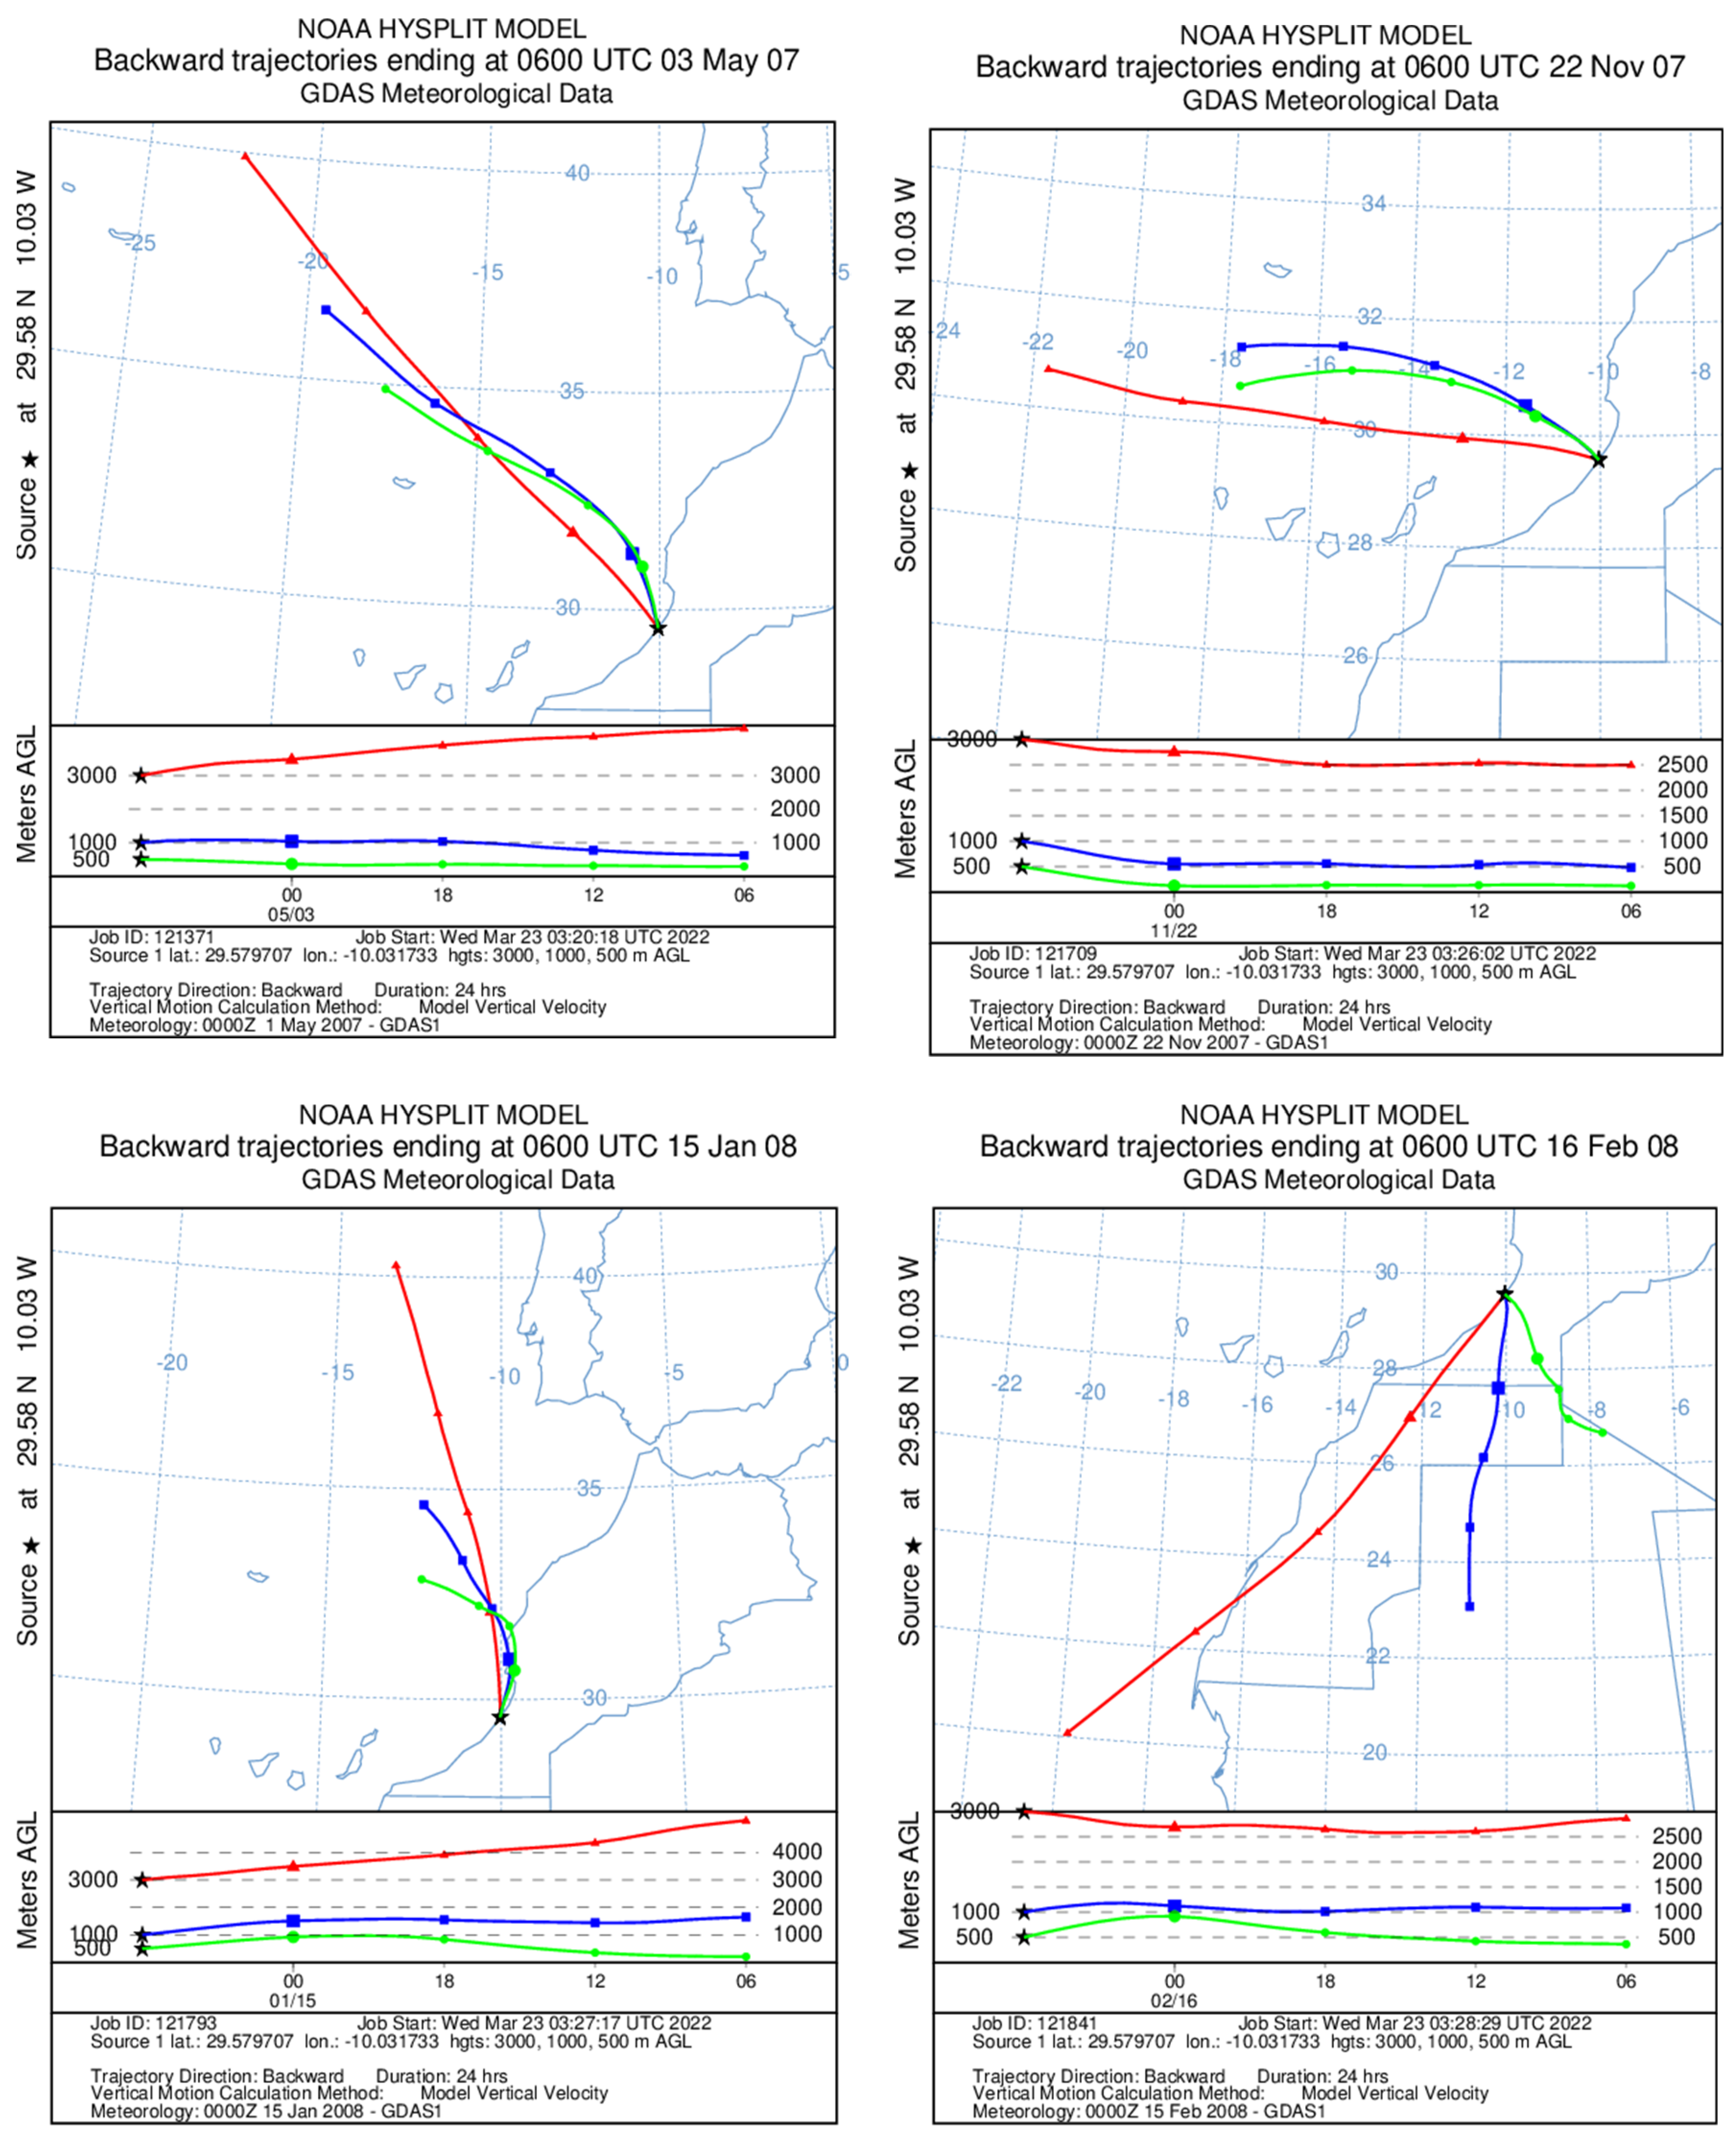
The backward trajectory of a point of the atmosphere can be calculated by the Hysplit model [67]. One can thus determine the path of a particle of air during the hours or days that preceded its analysis. We have used this model [68] to determine the backward trajectories for the studied site during the 24 h preceding the day of dew collection, taken at 6:00 in the morning.
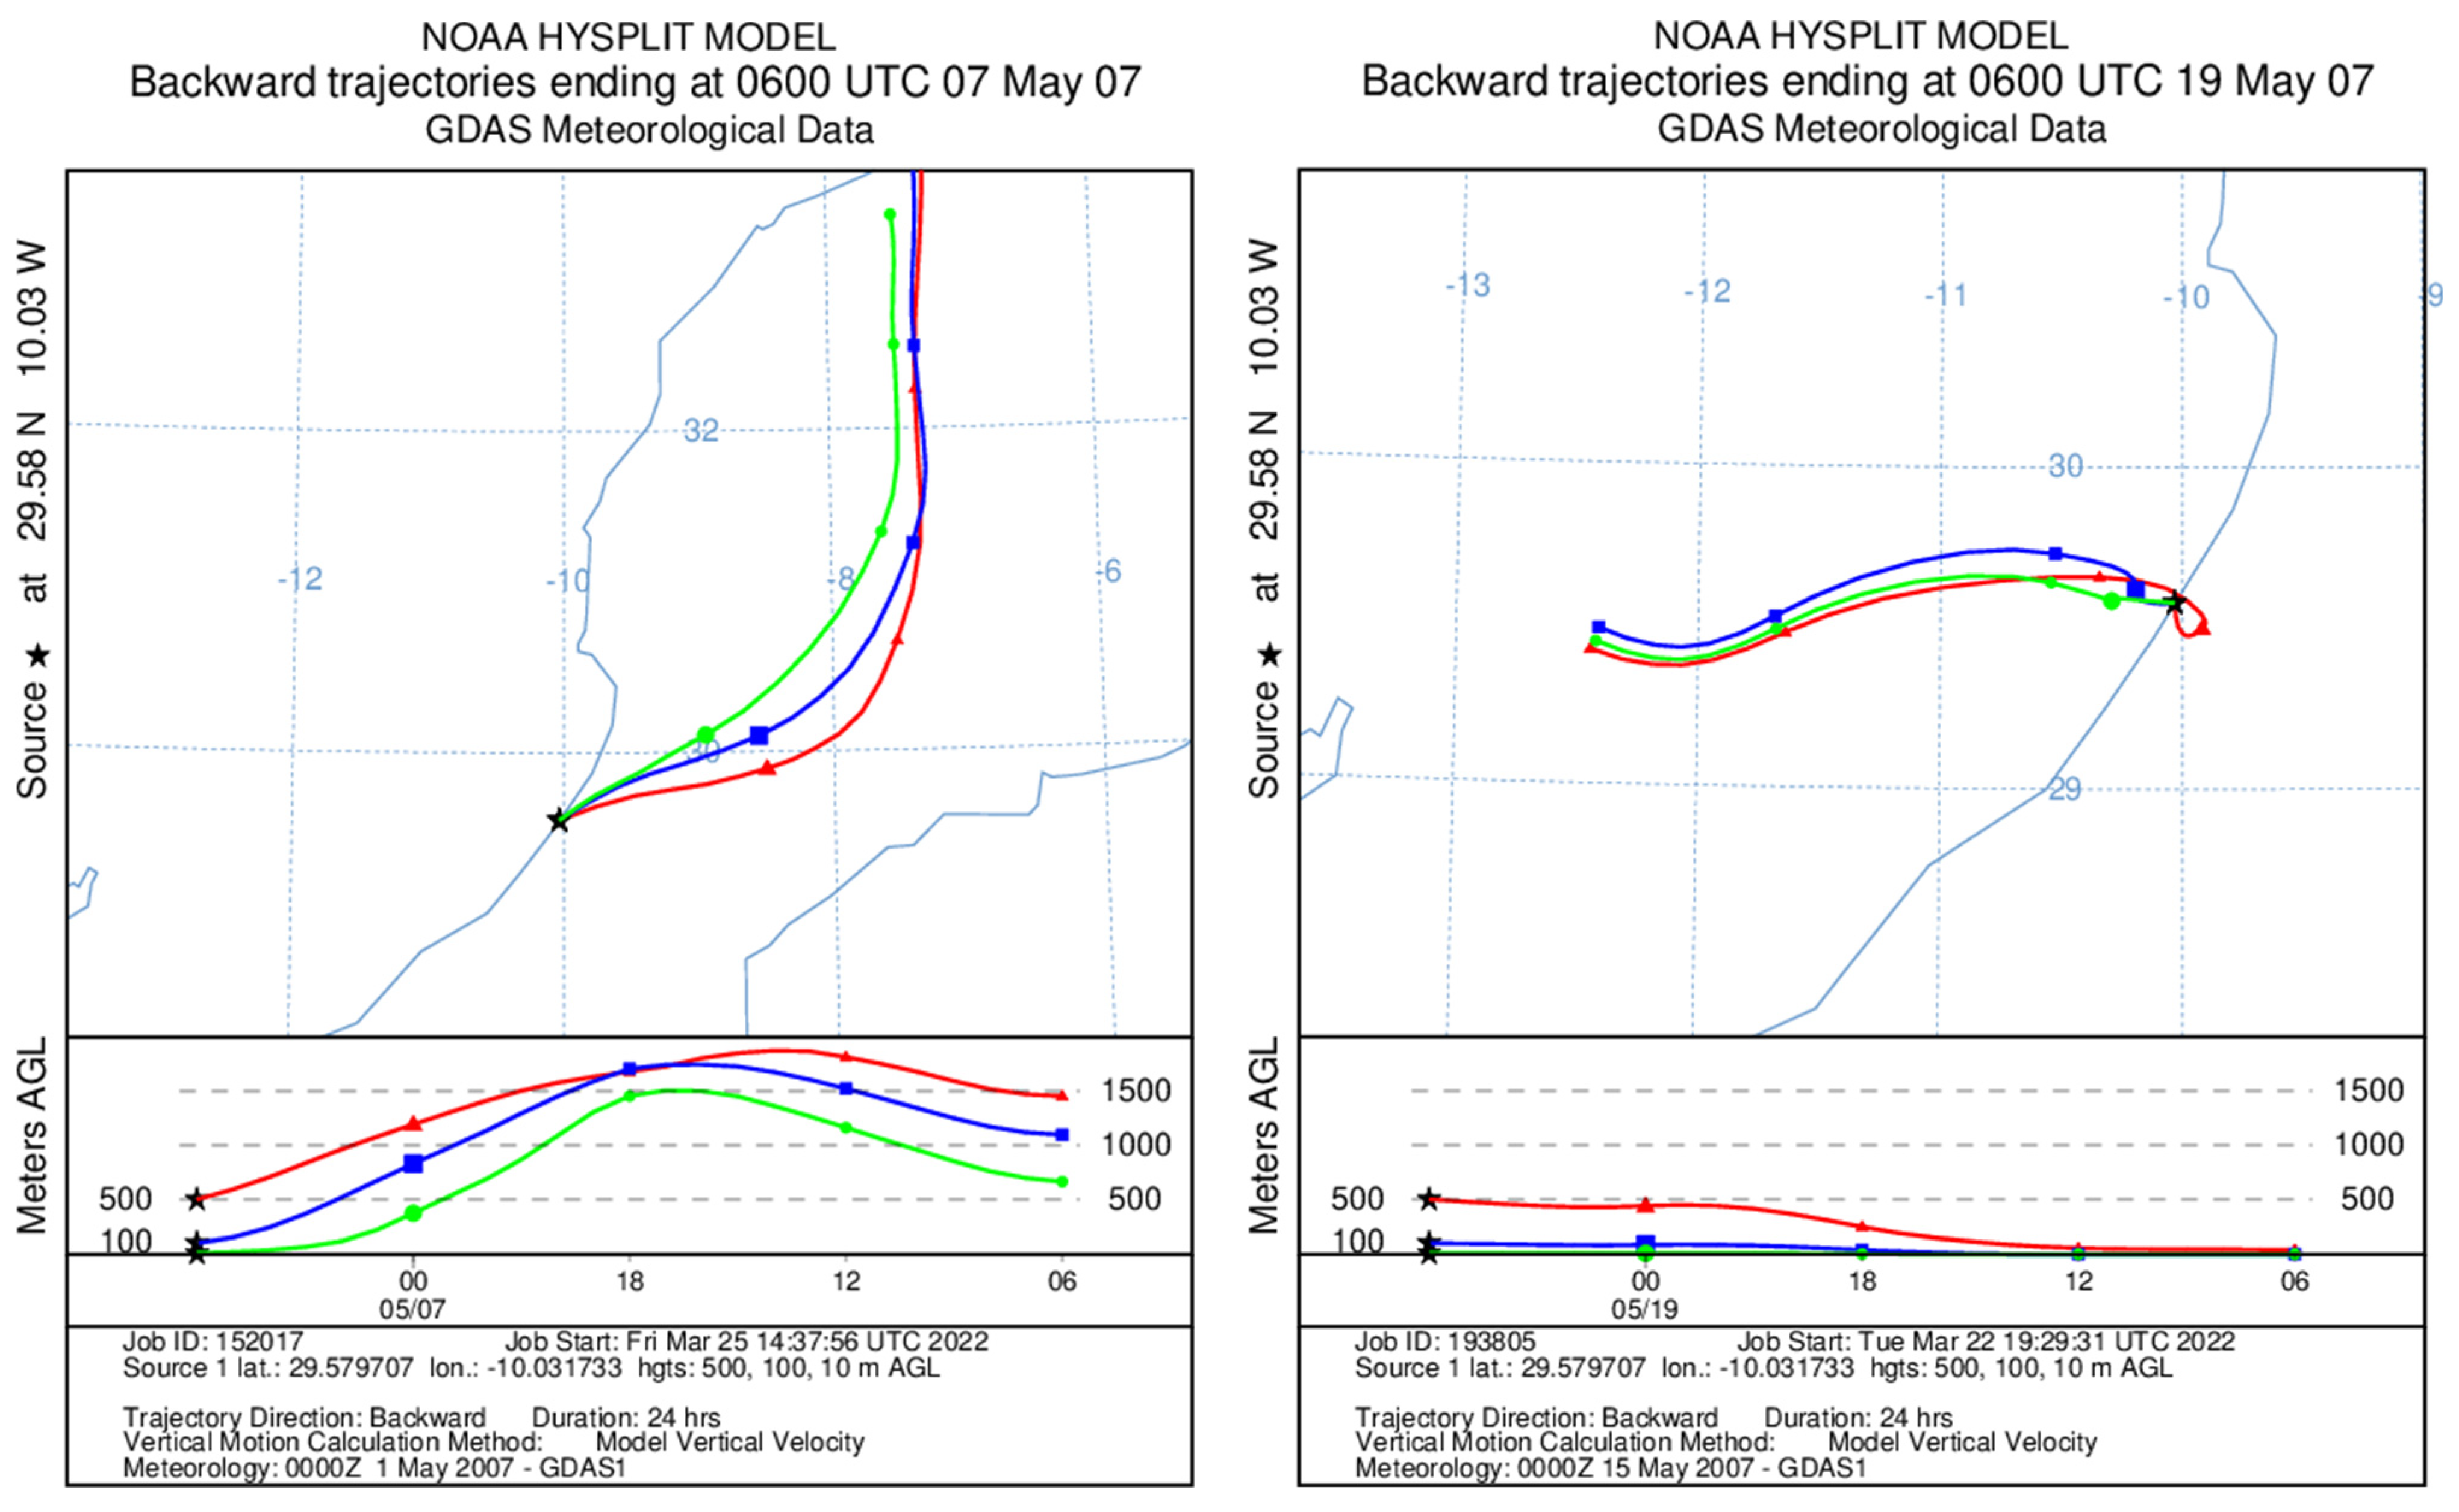
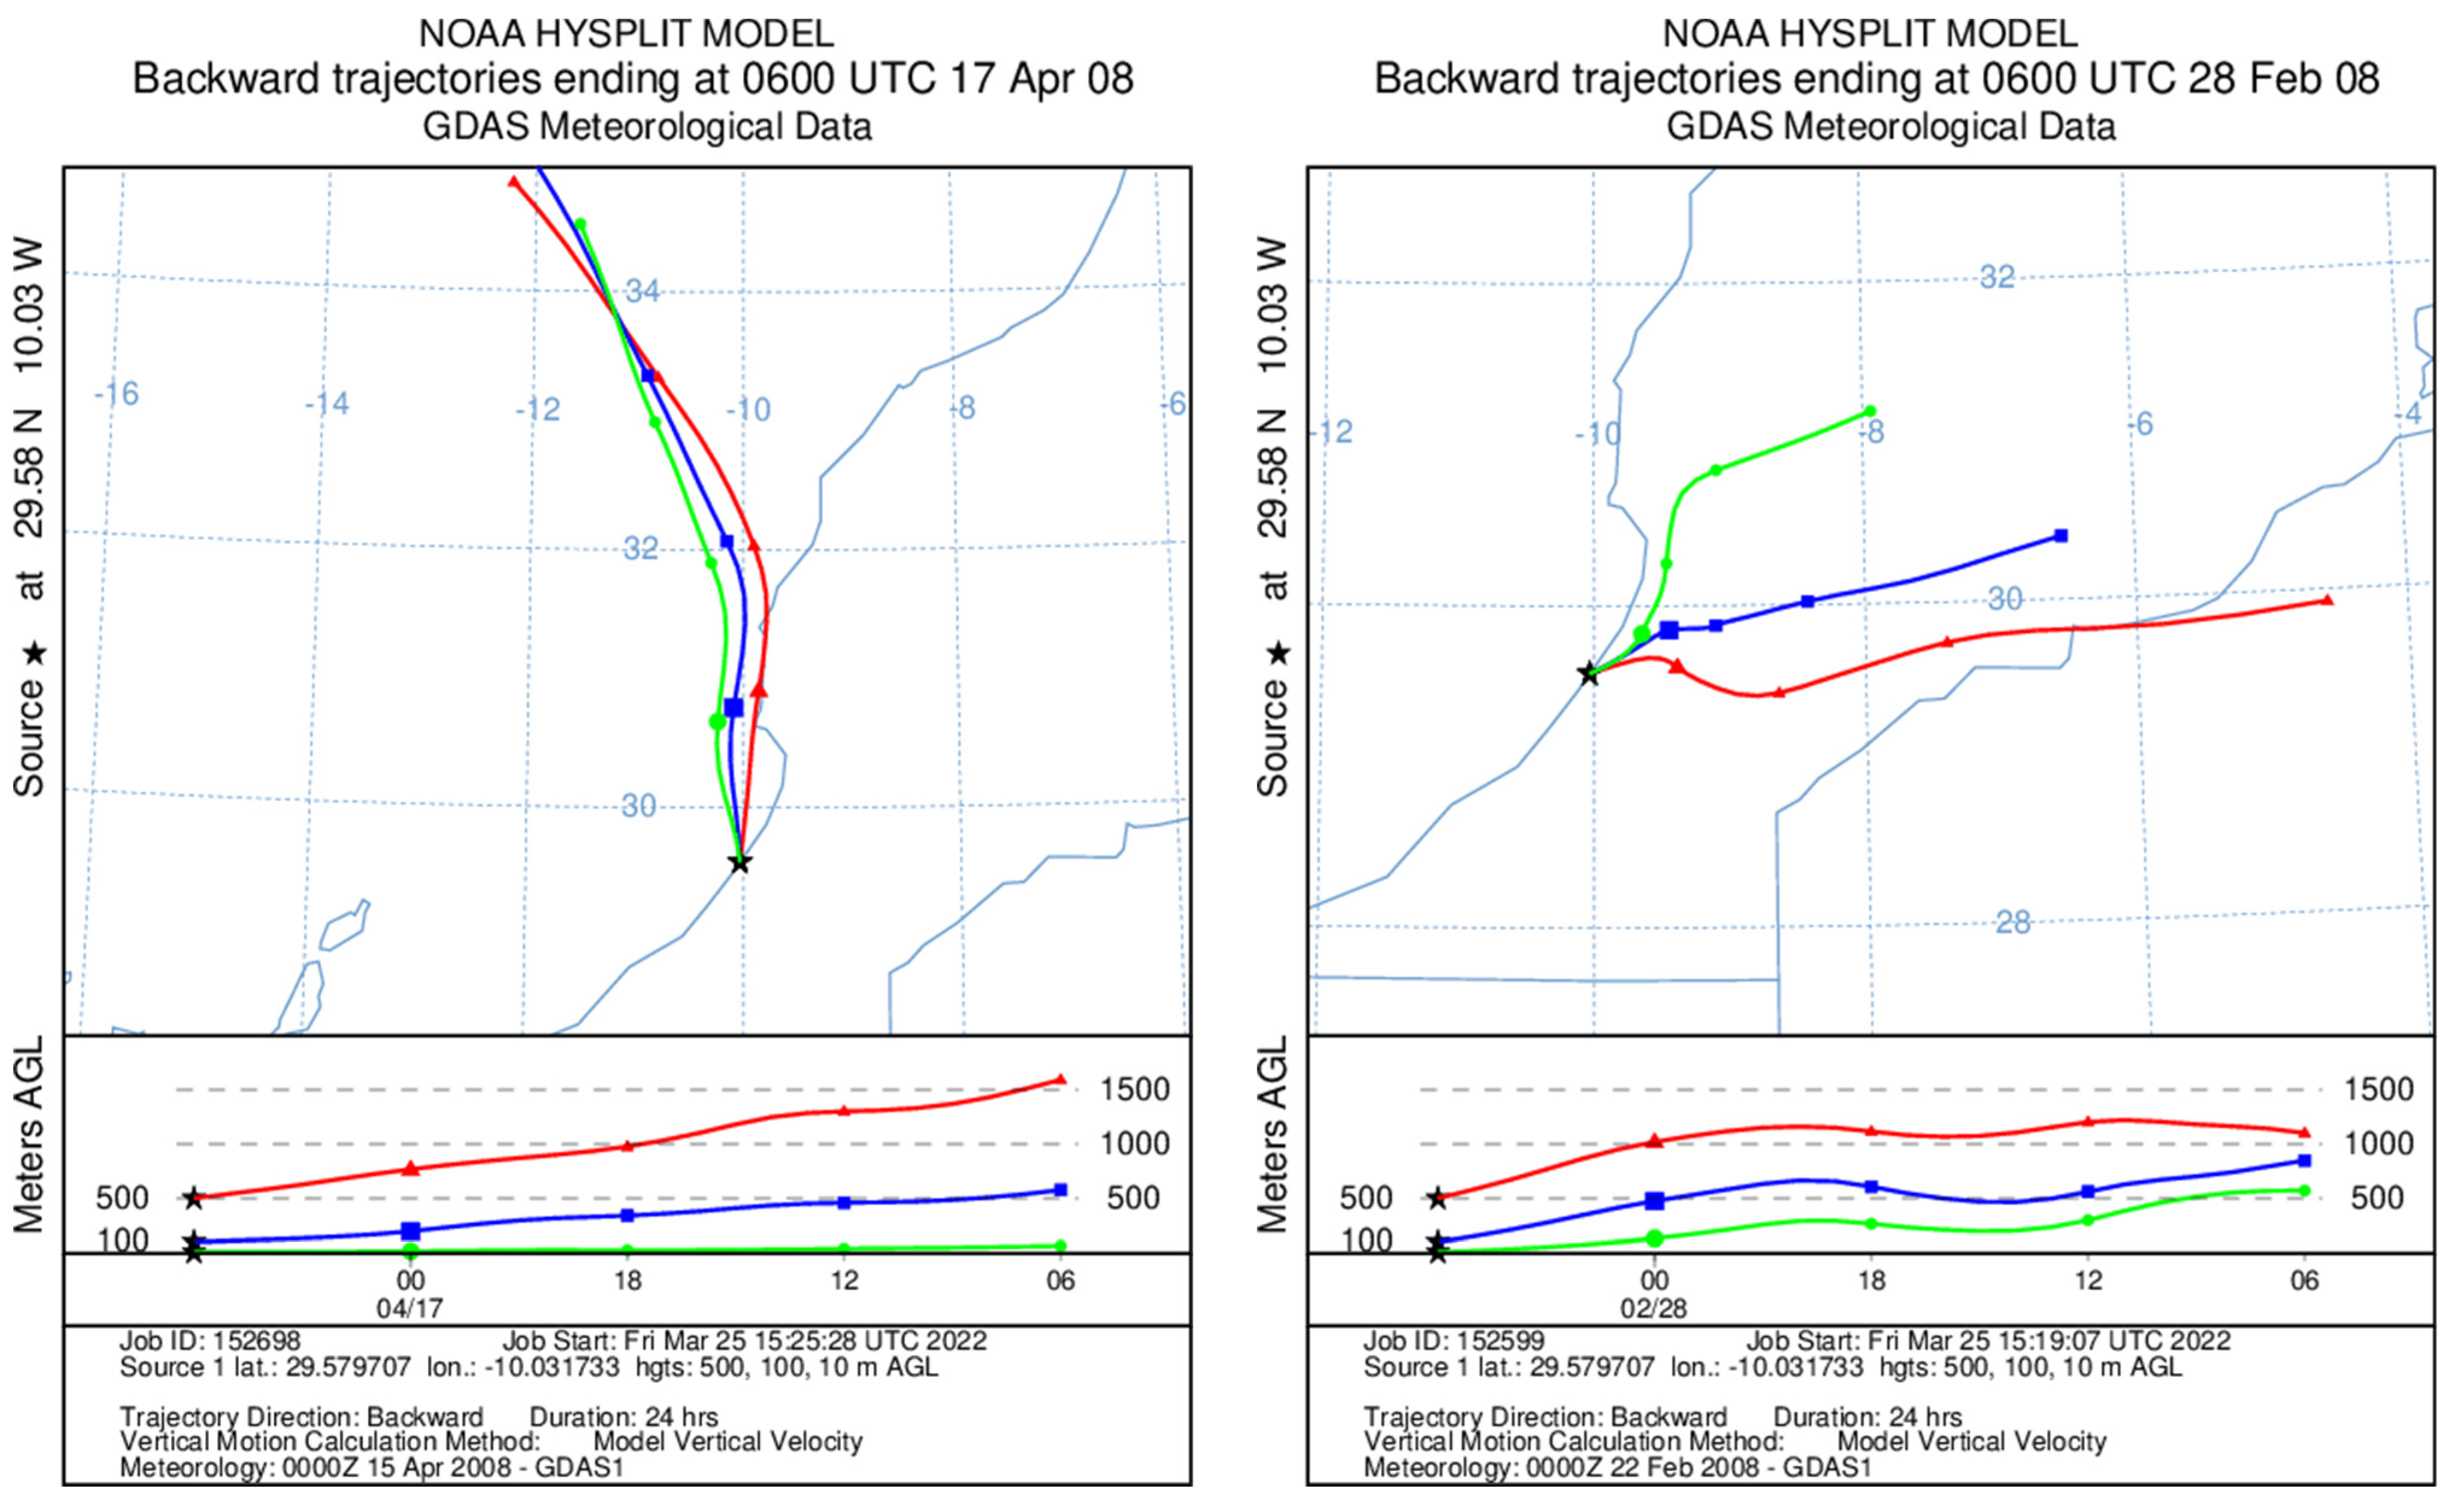
The air masses which cross Mirleft are characterized by a mixed origin, oceanic and continental (desert). Dew volume and composition are mostly affected by the relative humidity, aerosols and dissolved gases in the atmospheric boundary layer. One thus considers the path of air masses at 500, 100, 10 m above the collection site. Since dew does not form when wind comes from desert because RH is too small (Figure 2b), its chemical composition will be mainly of ocean or mixed ocean/continental origin. Some typical backward trajectories are shown in Figure 15.
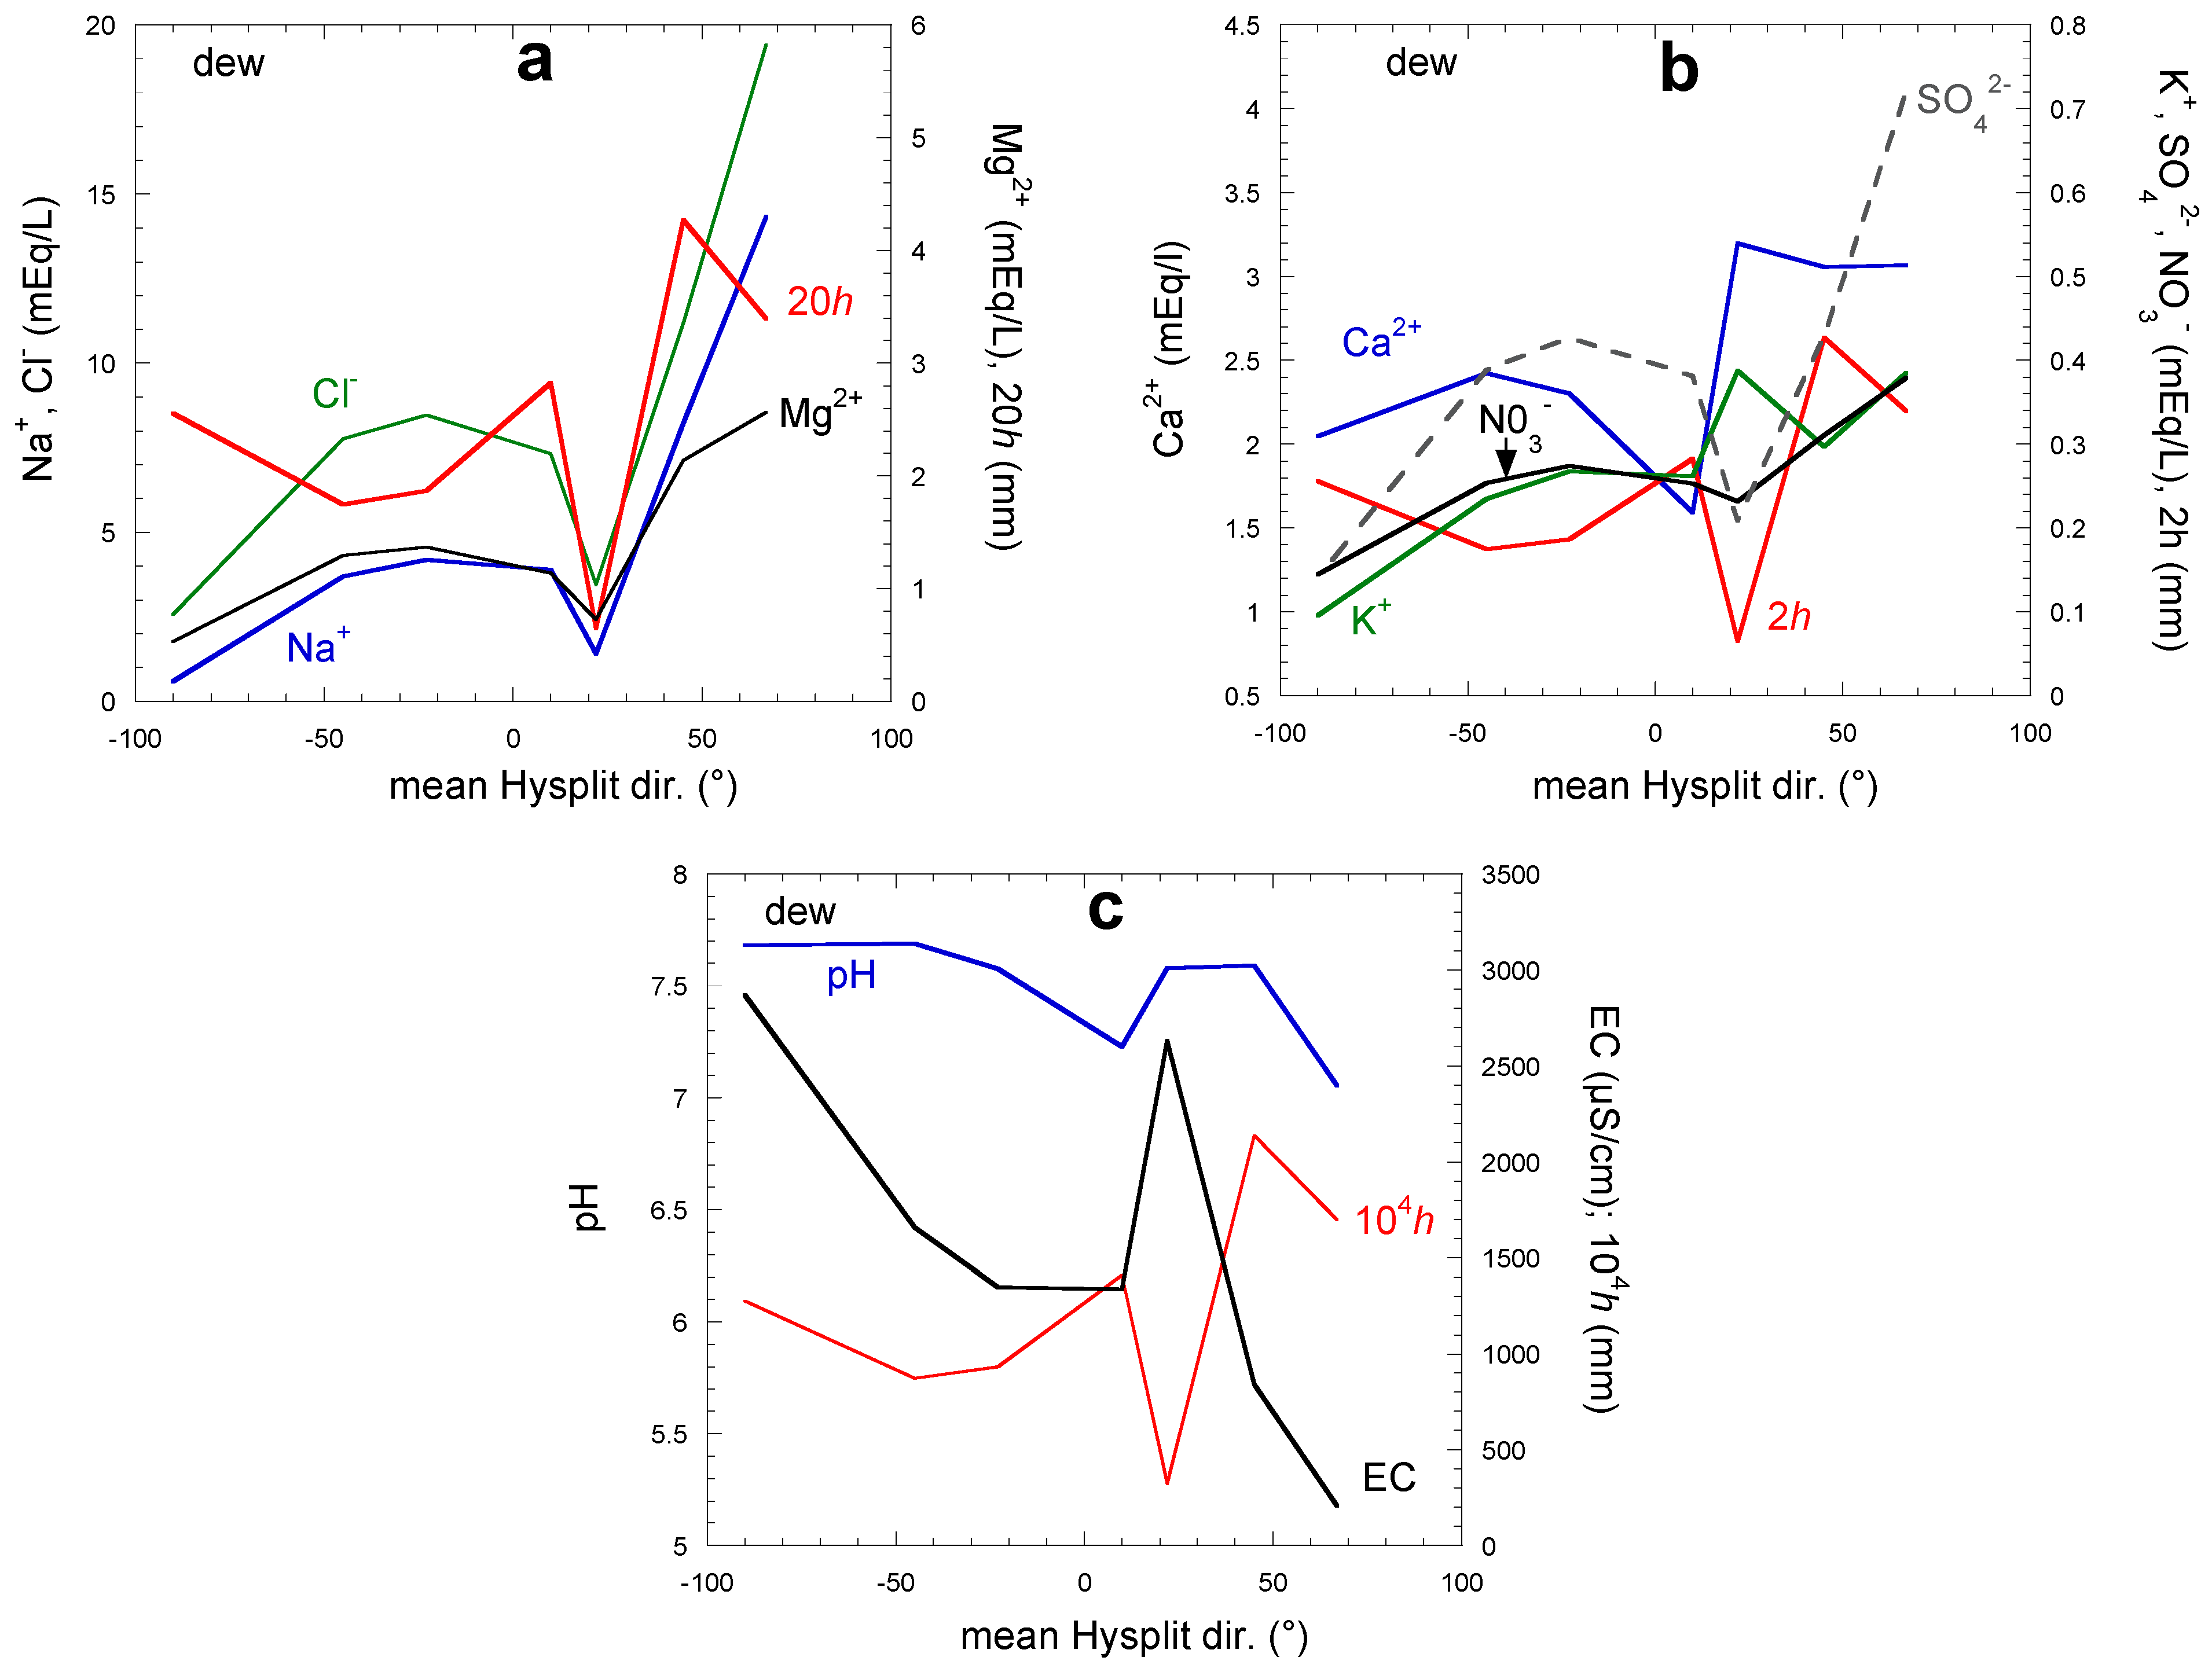
Figure 16a reports the concentration of major ions of ocean origin (Na+, Cl, Mg2+) and the volume of dew per unit surface area (h) as a function of mean air mass direction during 24 h. It was checked that this mean direction was well correlated with the direction of air masses at 6:00. For humid air coming between W and N, the dew yield is substantial and the concentration of ocean ions corresponds to an effect of dilution, the largest volumes corresponding to smaller concentrations. For directions between N and E, the concentrations of ocean ions rather follow the dew volume, with the largest volumes, the largest ions concentrations, as discussed in Section 3.4.2.2 and Figure 14. The lowest data correspond to directions 10–45° as in Figure 15 on 28 February 2008. Here one sees that the air masses are following a continental path, thus explaining the low dew yield related to a low RH and low, ocean-dominant, ion concentrations. For other continental directions larger than 50°, the dew yield is higher with larger ocean ion concentration, meaning that the air masses before 24 h should have also come from the ocean.
Figure 16b is concerned with major ions of continental or anthropic origin (Ca2+, K+, SO42−, NO3). The main variation in concentration of aerosols (Ca2+, K+) is a dilution effect, with higher concentrations for smaller volumes. Concerning gases (SO42−, NO3), in majority of anthropic origin (although SO42− can also be of marine origin), their concentration is less sensitive to the effect of dilution because of their fast absorption dynamics. The variation with air mass direction is different from that of ions of ocean origin and rather follows an increase for directions larger than 22°, corresponding to continental origins.
The variation of EC and pH are shown in Figure 16c, together with the dew yield h. The EC value roughly follows a dilution effect. Concerning pH, its value generally increases when the dew volume decreases. It corresponds to the highest concentrations of Ca2+ and K+, ions which react with the acidic ions SO42− and NO3 to increase the pH.
In the future, scenarios RCP 2.6 and RCP 8.5 lead to a decrease in dew yield but should not lead to main changes (Figure 6). It means that moist air, which gives rise to dew condensation, will continue to flow from the ocean. One therefore does not expect major changes in the chemistry of dew.

3.4.2.4. Dew Seasonal Variations

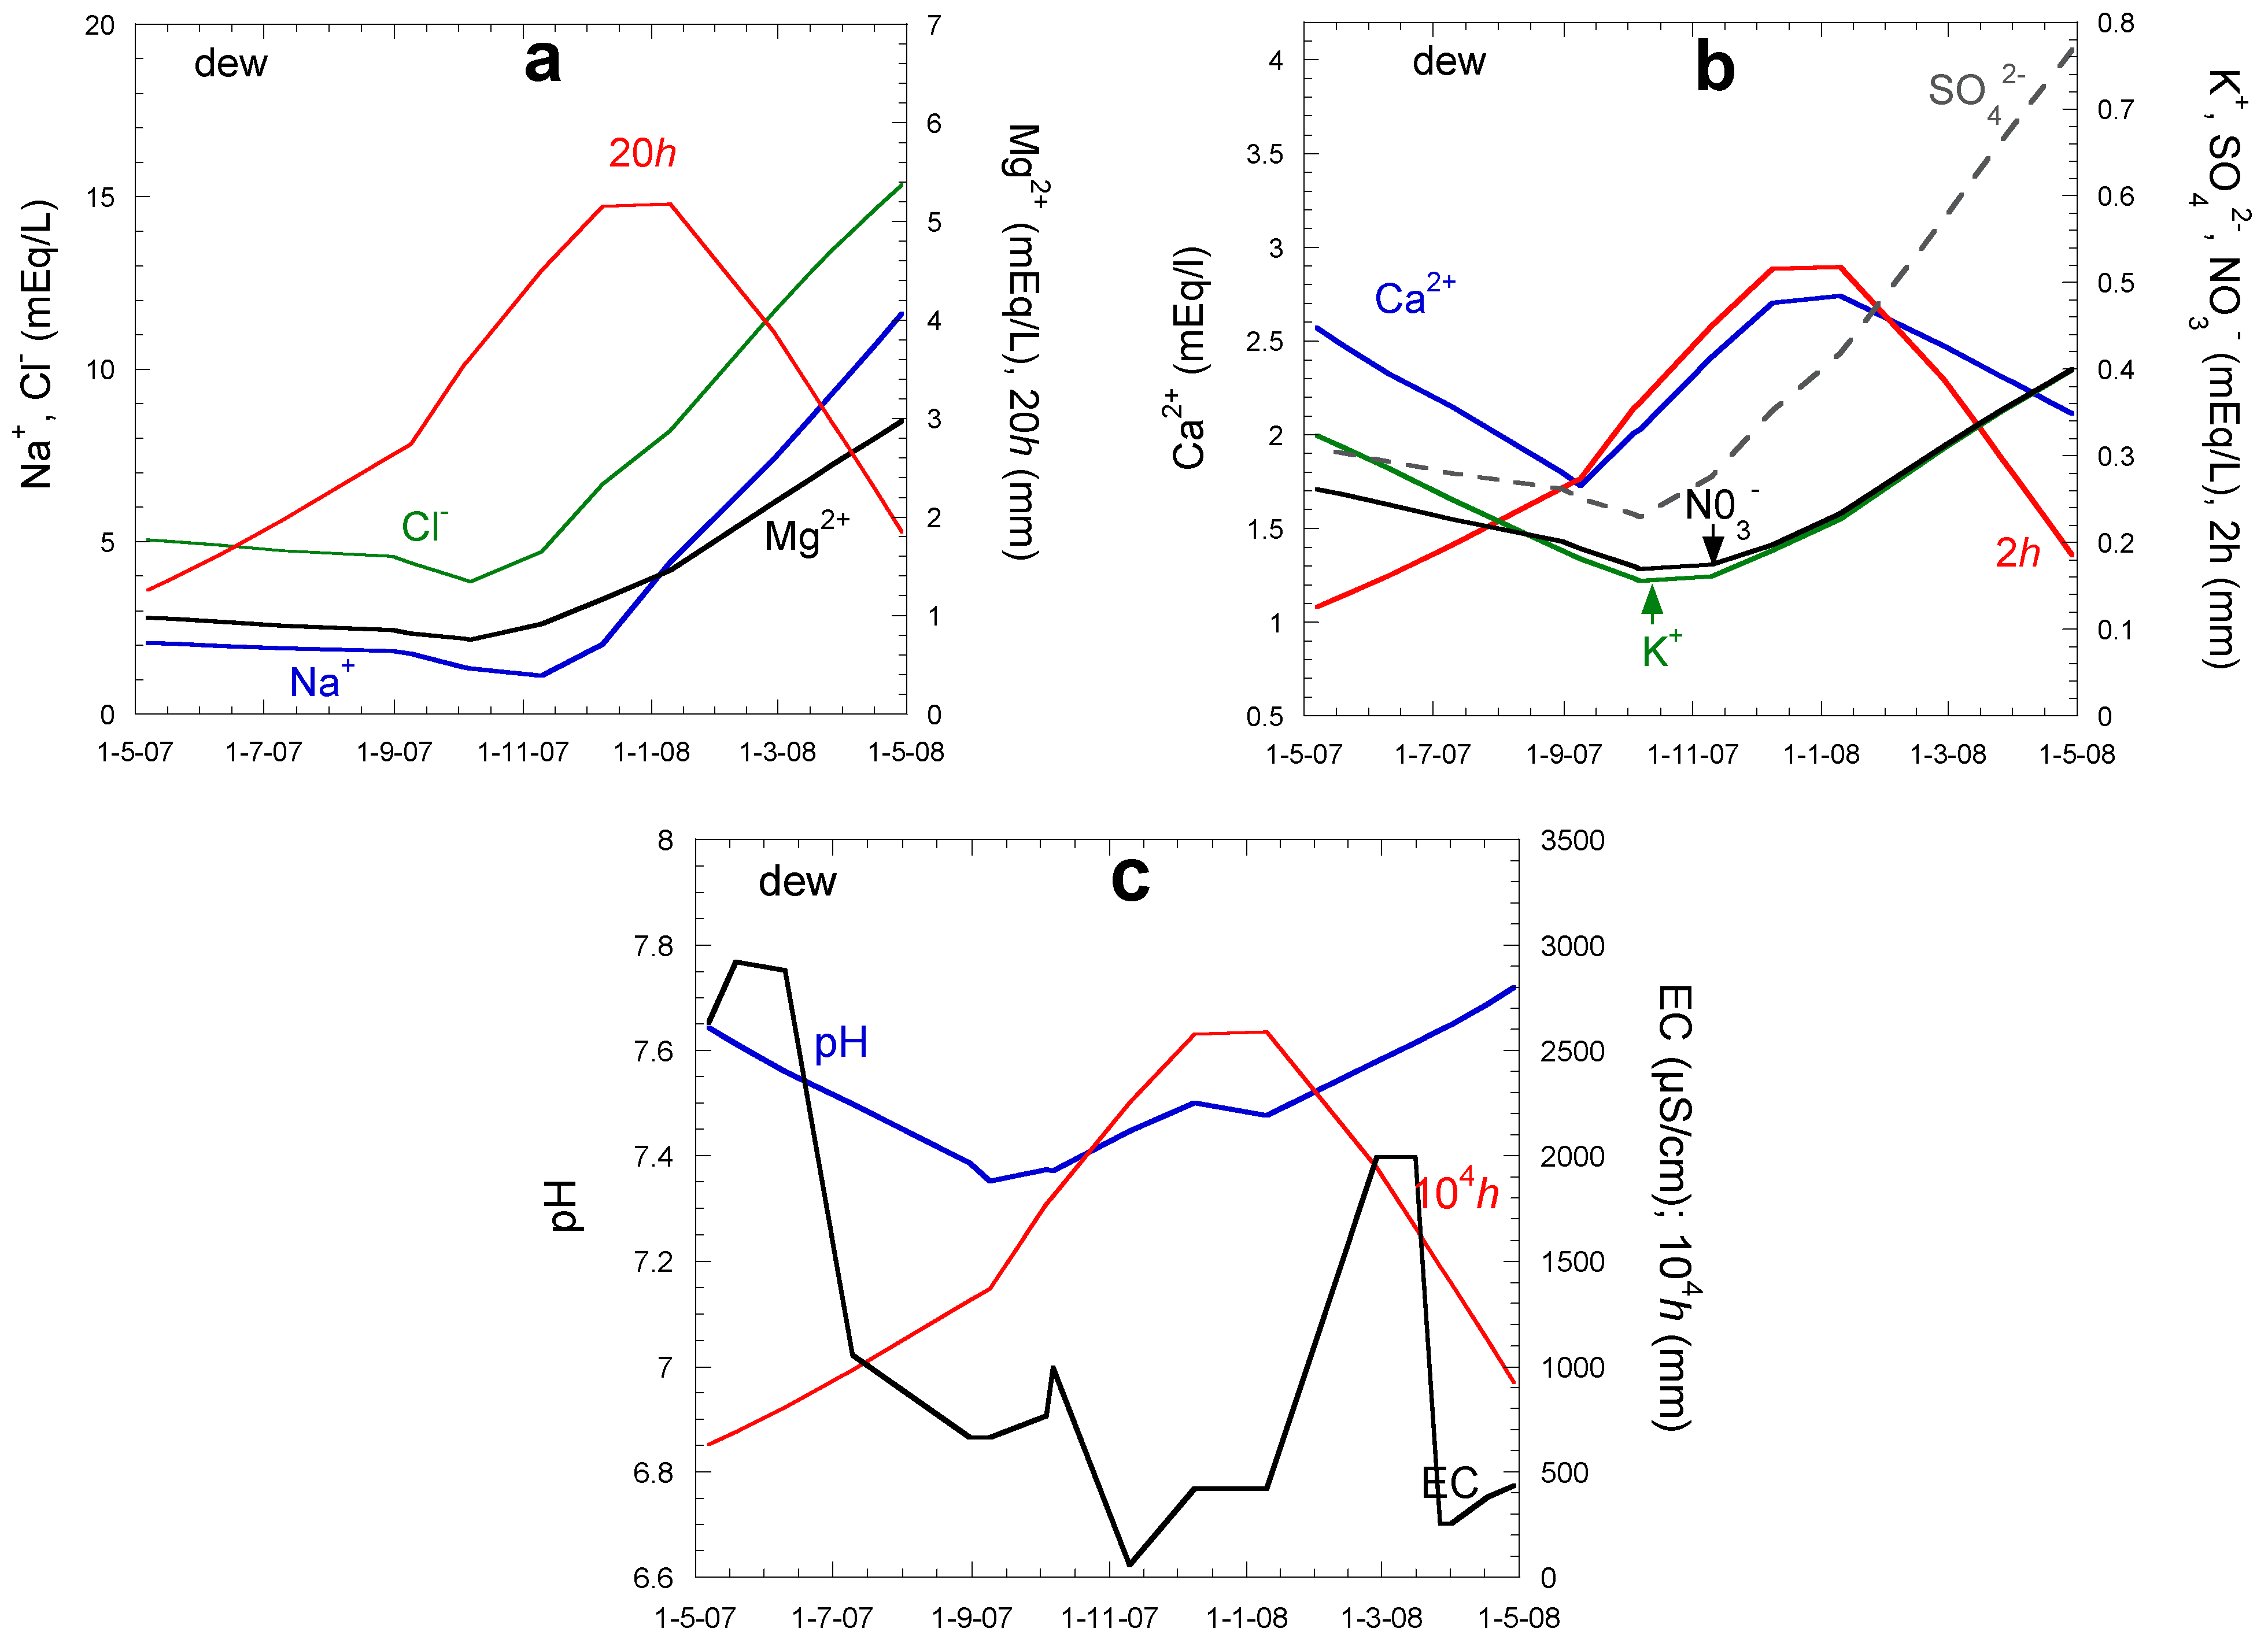
In Figure 17a,b are reported, respectively, the monthly evolution of ions of sea origin (Na+, Cl, Mg2+) and ions of continental origin (Ca2+, K+, SO42−, NO3), together with the dew yield h. The concentrations are seen to simply follow a dilution effect, that is, to show higher concentration for lower dew yield. The seasonal dependence is thus the inverse of the dewfall volume evolution, with smaller ion concentrations in winter and higher in summer. Figure 17c shows that the dew pH is rather stable with time around ≈7, while the electric conductivity obviously follows the major ions concentration behavior, being smaller in winter and larger in summer.
One expects for the future evolution described by the scenarios RCP 2.6 and RCP 8.5 a decrease in dew yield. This decrease is not related to a major change in the air masses. One therefore expects with a lower dew volume a higher concentration of ions from aerosols (Na+, Cl, Ca2+, K+). Since the other ions mainly come from anthropic gases (SO42−, NO3), it is probable that their concentration will also increase.

3.4.2.5. Rain Air Flux Backward Trajectories

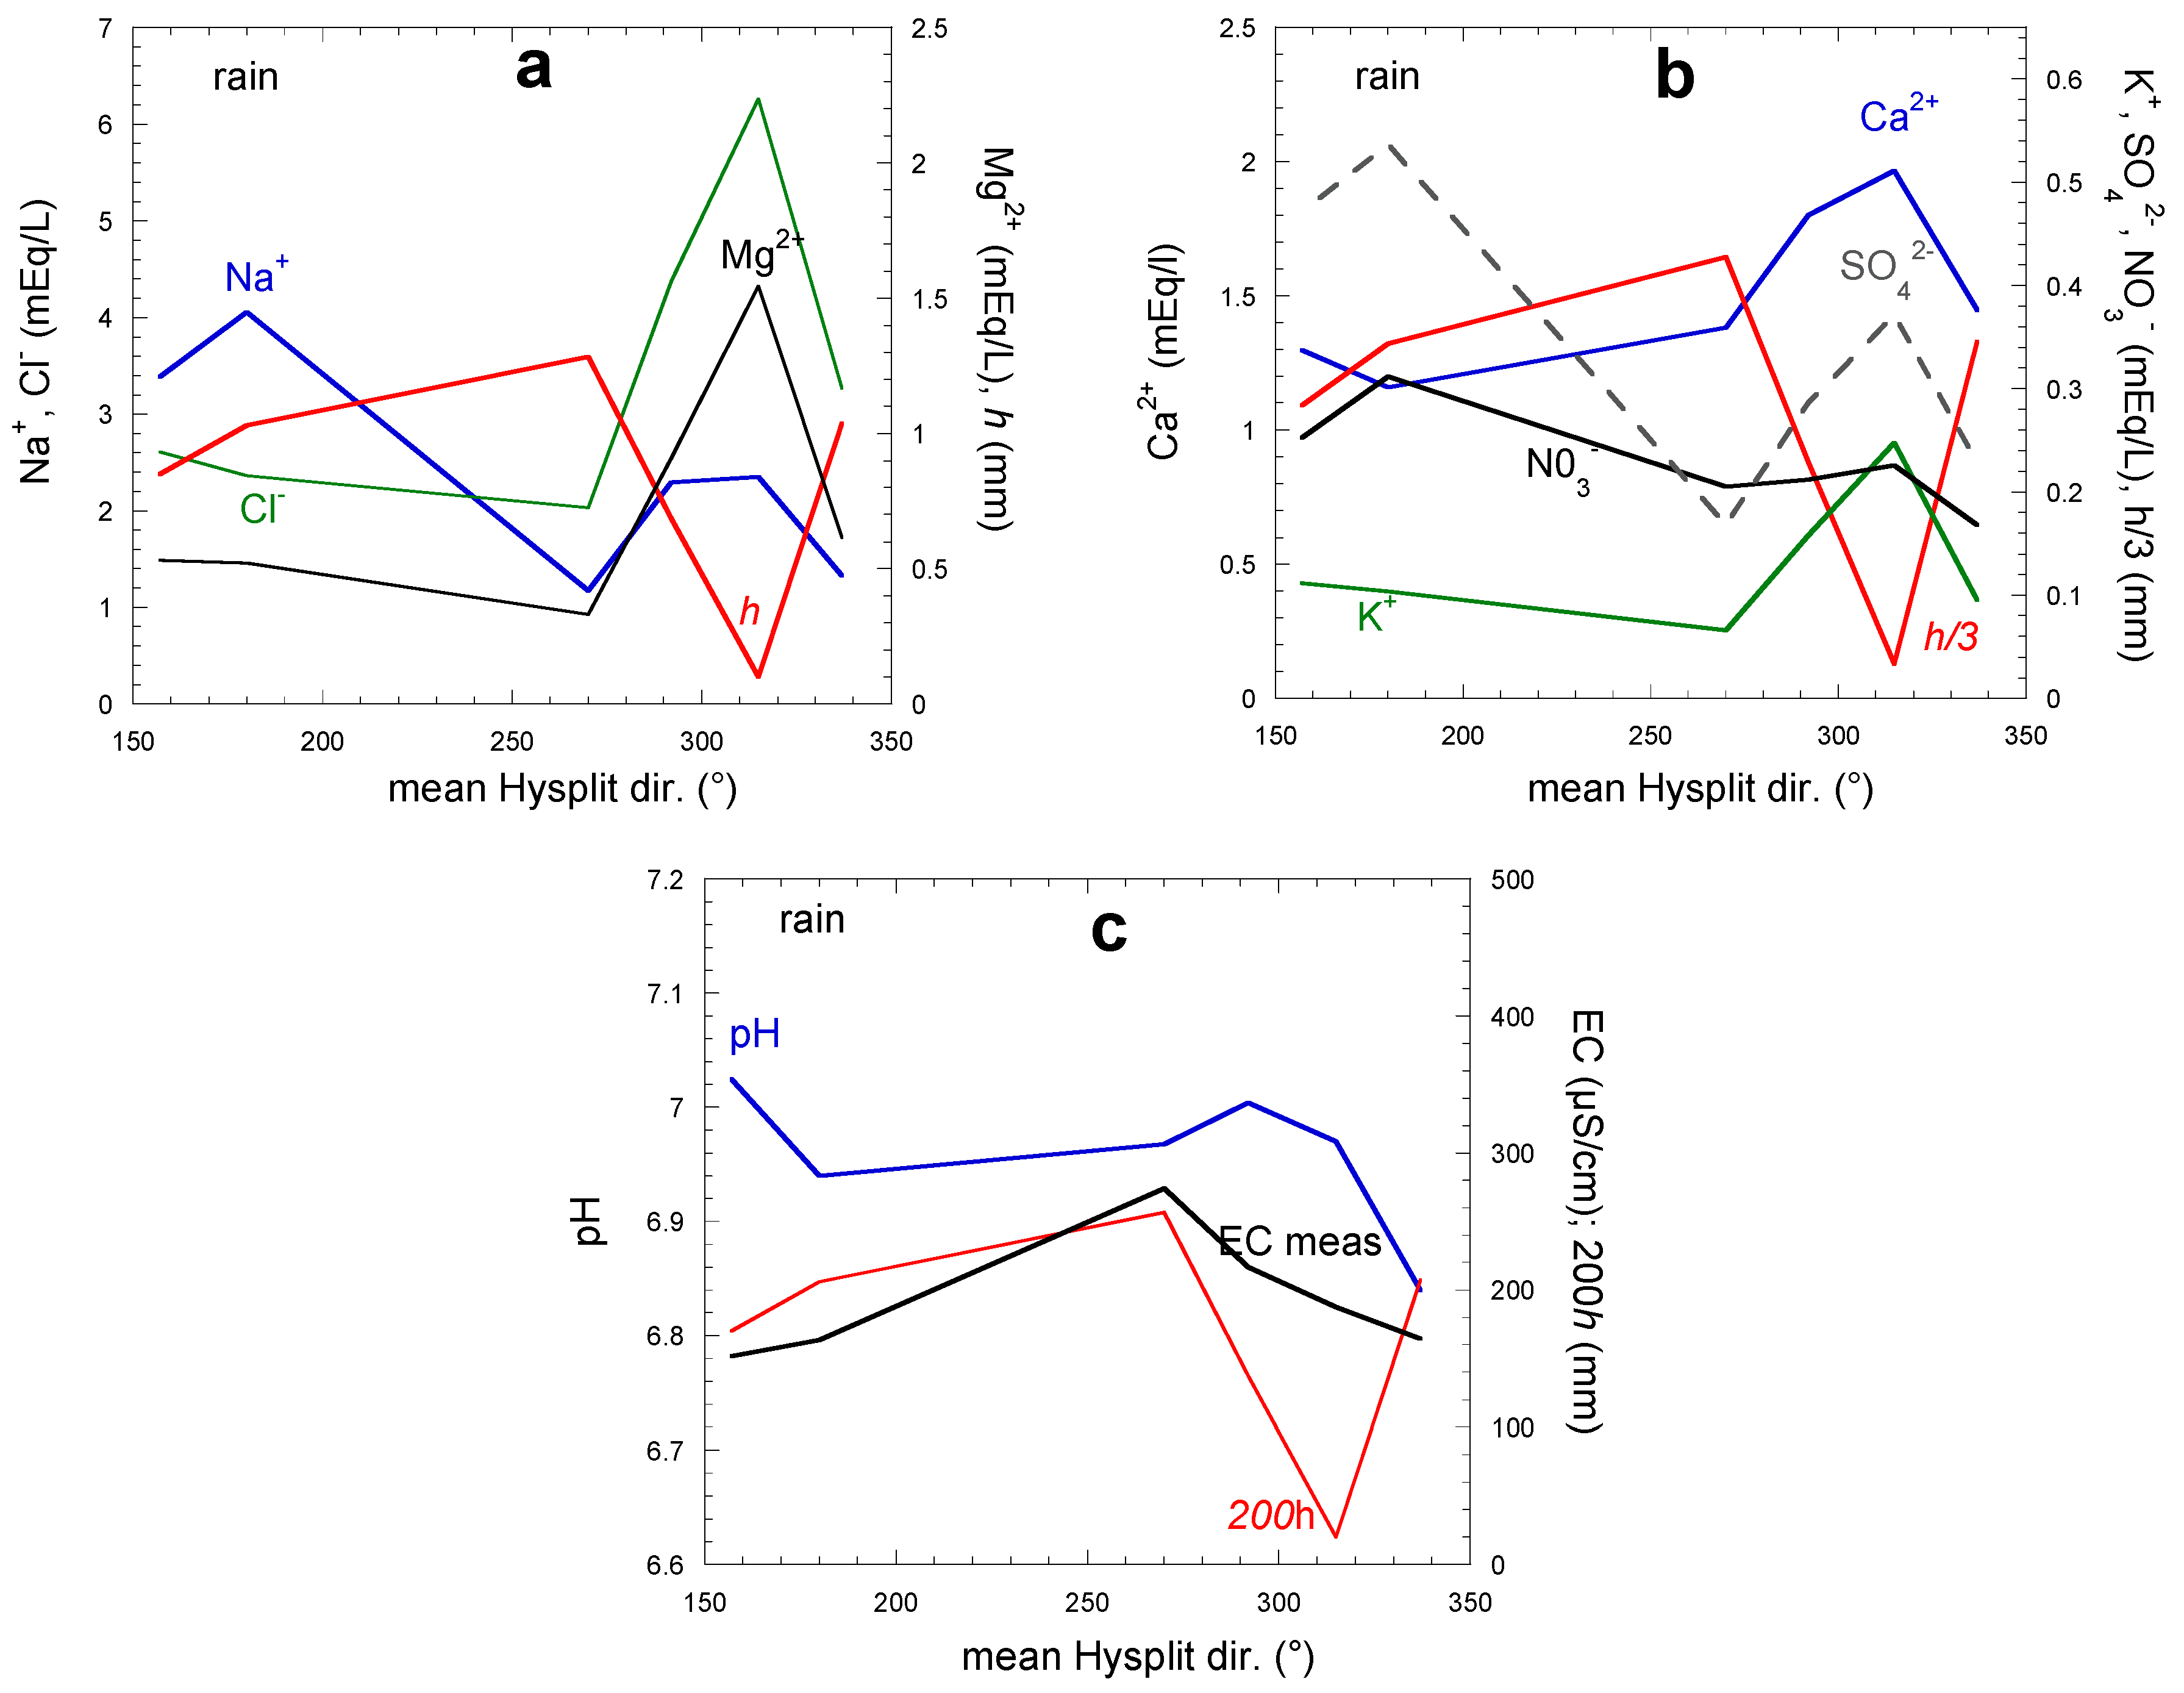
Morocco is on the south border of the mid-latitude area of depression systems issued from Newfound Land and Iceland, which habitually cross the North Atlantic Ocean. Rain yields are then low and gradually decrease from north to south. It results in wind that, during rainy days, mainly comes from directions S–W–N. Figure 18 reports some typical backward trajectories corresponding to rain events.
The variation of concentration of ions of marine origin (Na+, Cl, Mg2+) together with the rain volume per surface area, h, is presented in Figure 19a during the last 24 h. as a function of mean air mass direction. As for dew, the main variation is due to an effect of dilution, with higher ion concentration when h is lower. Figure 19b, concerning the ions (Ca2+, K+, SO42−, NO3) of continental origin (except some marine contribution for SO42−) shows a dilution effect for the aerosol’s contribution (Ca2+, K+). The same effect is seen with the ions of marine origin, with the higher rain volume, the lower ion concentration. Ions coming from gas adsorption (SO42−, NO3) display a less marked dependence with the rain volume as discussed above in Section 3.4.2.2.
The rain EC and pH variations with mean air masses directions (Figure 19c) show a general dilution dependence with rain volume h. EC and pH values have a tendency to rise when the rain volume decreases. It corresponds to a dilution effect; for the pH, a higher concentration of Ca2+ and K+ ions reacting with the acidic ions SO42− and NO3 increases the pH value.

3.4.2.6. Rain Seasonal Variations and Volume Dependence

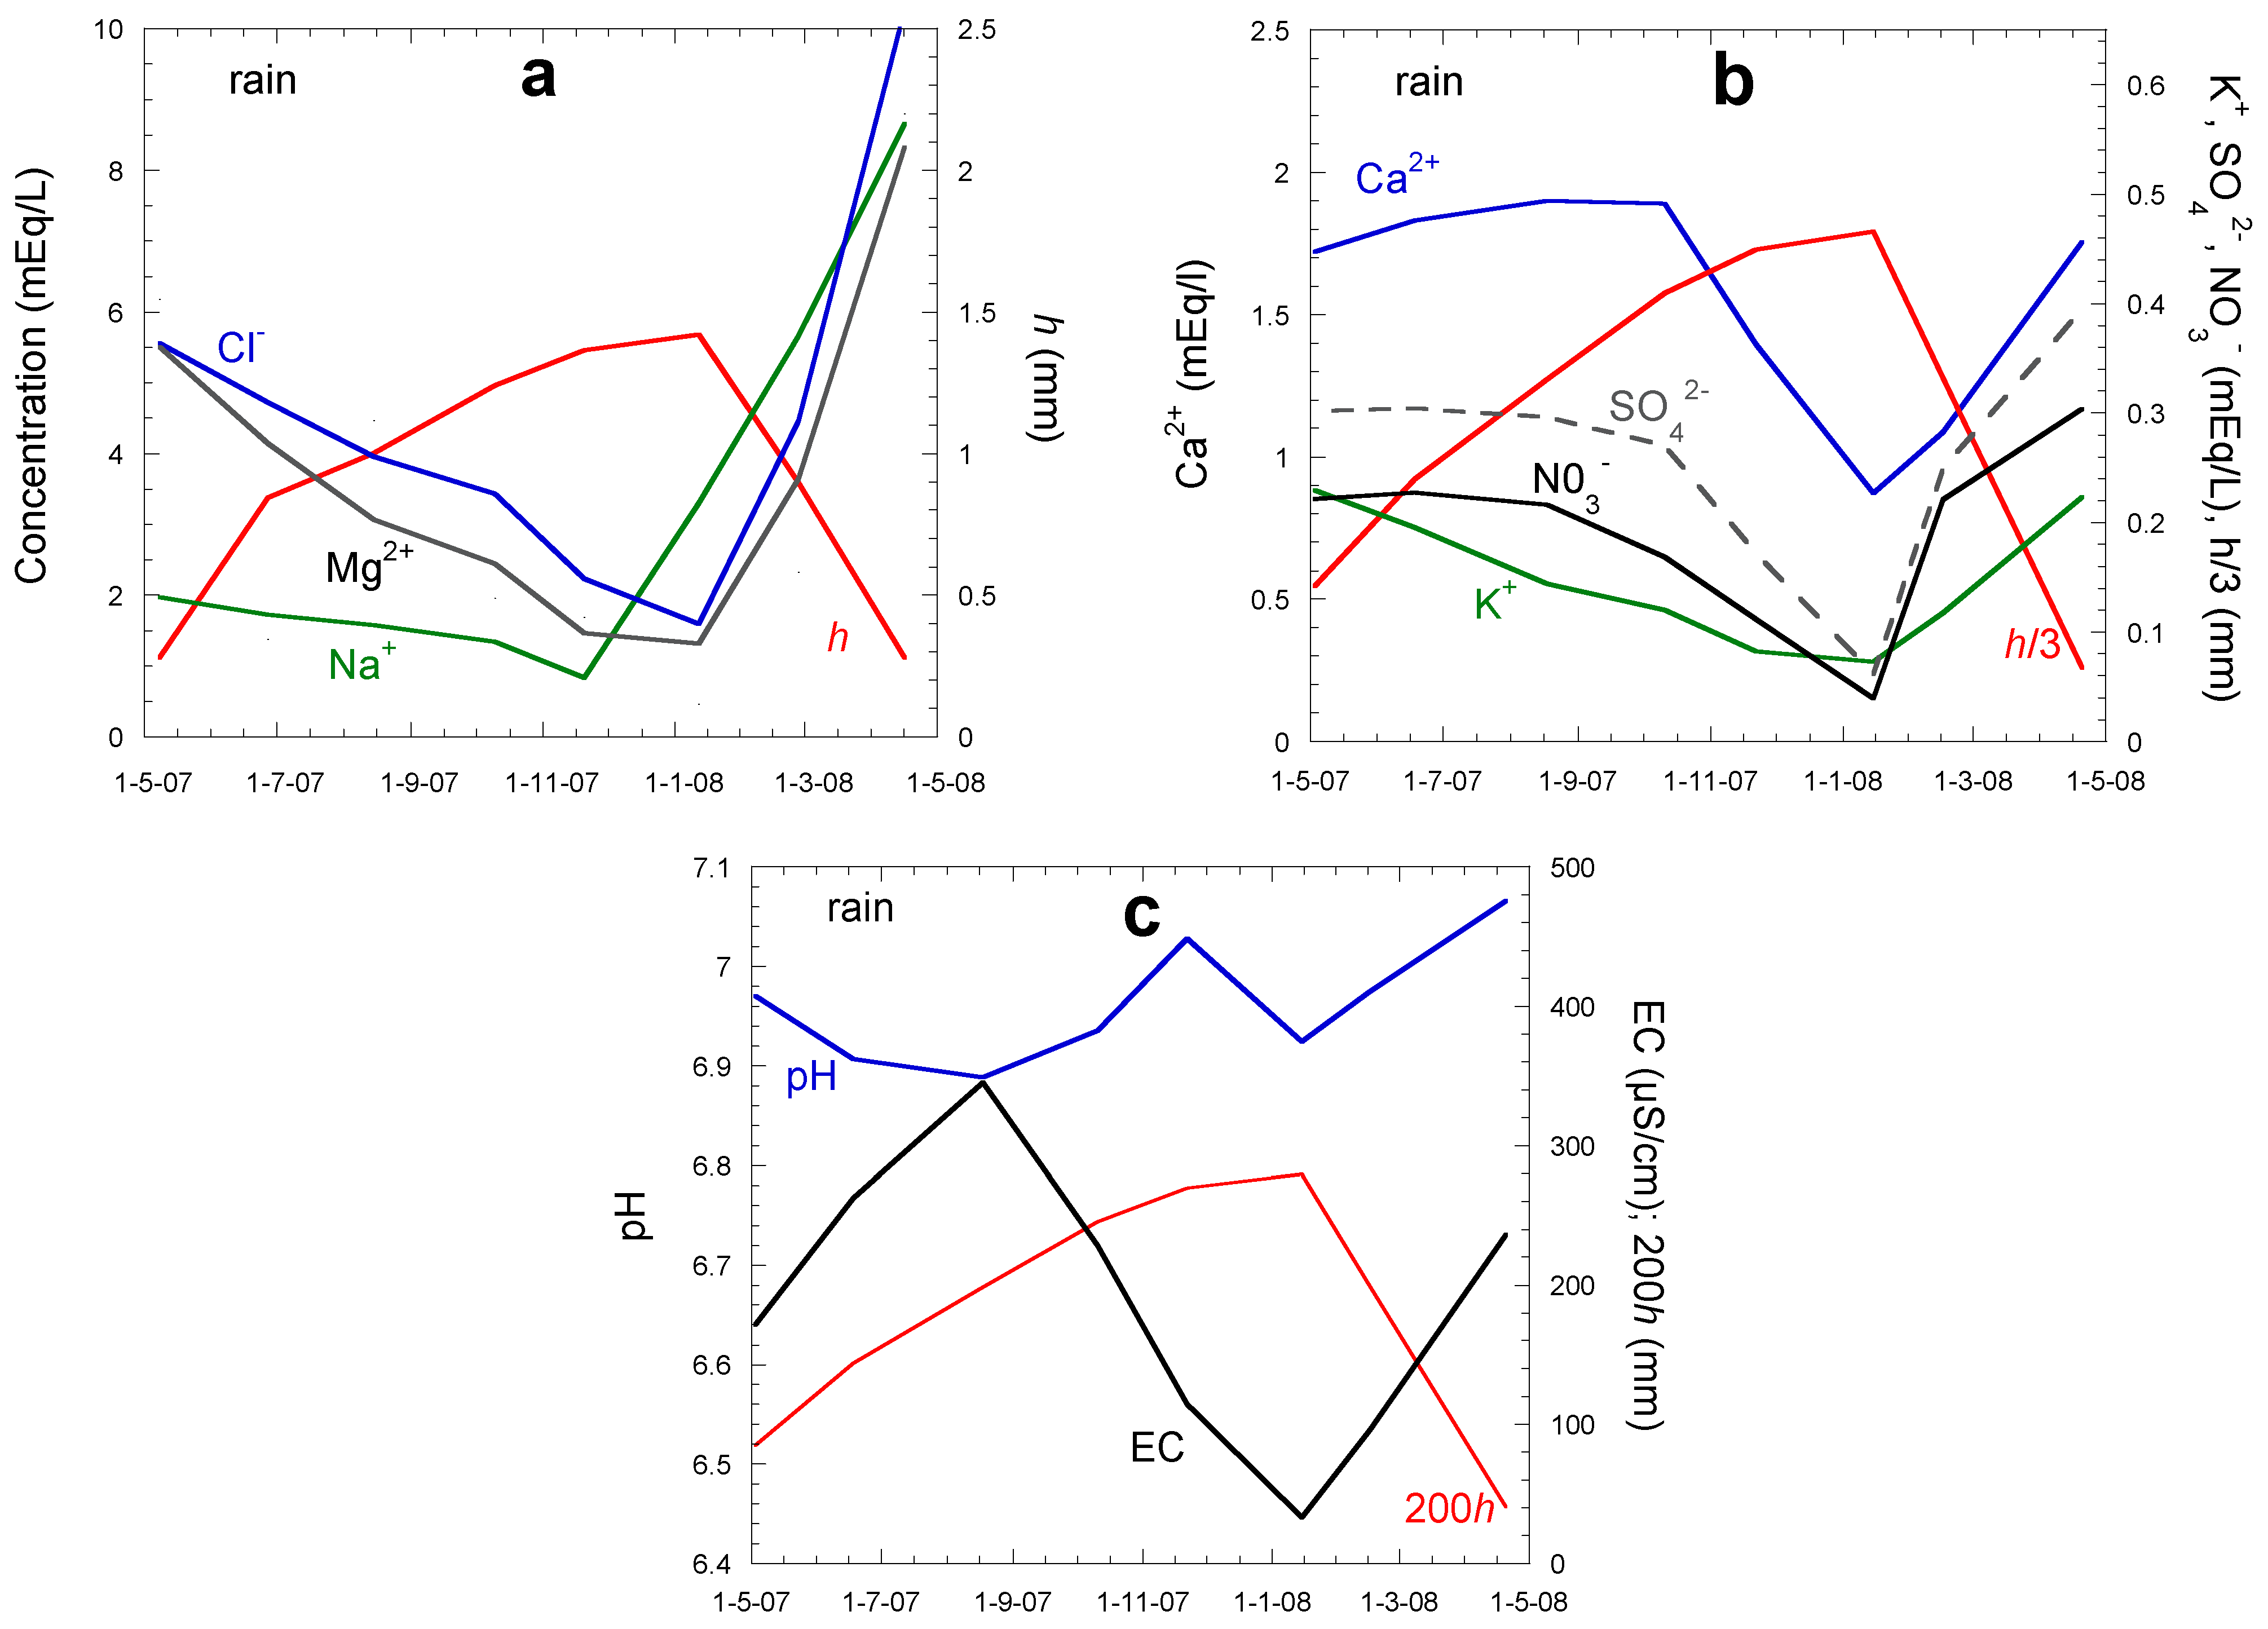
Although the number of analyzed rain samples is relatively low for ion concentrations, one can nevertheless draw some general conclusions. Figure 20a,b report, respectively, the evolution of ions of sea origin (Na+, Cl, Mg2+) and ions of continental origin (Ca2+, K+, SO42−, NO3), together with the rain yield h. The concentrations are seen to simply follow the inverse rain yield dependence, that is, higher concentration for smaller h. The season dependence is thus the inverse of the rainfall volume evolution, smaller ion concentrations in winter and higher in summer. Figure 20c shows that the rain pH is rather stable around ≈7 while the electric conductivity roughly follows the total ion concentration behavior with rain yield, being smaller in winter and larger in summer.
The future evolution is driven by the scenarios RCP 2.6 and RCP 8.5. They lead to a decrease in rain volumes yield but should not lead to major changes in the pathways of depressions across the Ocean. One therefore expects with the lower rain volume higher concentrations of ions from aerosols (Na+, Cl, Ca2+, K+). The other ions coming mainly from anthropic gases (SO42−, NO3), it is likely that their concentration will not decrease.

4. Conclusions

This paper firstly aims to study the evolution of dew, rain and evapotranspiration in the NW of Africa (Morocco and a part of desert and coastal Algeria). The time periods are concerned with the past years 2005–2020 using existing data, and future years for the period 2020–2100. For the latter are used the low and high emissions representative concentration pathway (RCP) scenarios, RCP 2.6 and RCP 8.5.
One notes than the relative contribution of dew with respect to rain can reach 12% in the coastal and near coastal regions of SW Morocco (Agadir/Casablanca/Marrakech/Oujda) and NW regions of Algeria (Oran/Tlemcen). For desert sites such as Béchar and Tindouf, the cumulative dew/rain ratio presents values in the range 4 to 8%.
It appears that the evolution from 2005 to 2100 leads to a notable continuous decrease in rain precipitation. However, one notes for RCP 2.6 an increase of rainfall between 2030 and 2090, and later a decrease to zero. Concerning RCP 8.5, one observes a decrease on order of −14 mm·decade−1. The last scenario seems to be more credible because the decrease is already observed since the beginning of years 2000. The amplitude of this decrease is maximum on the coast and on the foothills of Atlas. Only the extreme south of the country on the Mauritanian border could experience, with the RCP 8.5 scenario, a significant increase in rainfall.
One also observes a diminution in dew yields along a NW/SE axis. This decrease is strongly correlated with a corresponding decrease in relative humidity (up to 7%). The areas from the Atlantic coast to the Sahara Desert are gradually impacted by this reduction. Concerning the Sahara Desert, one also observes a decrease in dew yields, especially from the highlands (Atlas Mountains) towards SW. More generally, there is a tendency to see a reduction in dew yields with increasing distance from the sea, located W and N, correlated with a diminution in nocturnal relative humidity from NW to SE.
Concerning evapotranspirations, the increase of temperatures and the change of the mode of precipitations is a source of uncertainty. However, one can reasonably state that the potential evapotranspiration PET displays an increase over the century, weak for the scenario RCP 2.6 (+4.0 mm·decade−1), larger for the scenario RCP 8.5 (+7.4 mm·decade−1). This increase is related to the expected rise in ambient temperature. One also observes that the actual evapotranspiration ET is lower in 2100 than in 2006, with −15.8 mm·decade−1 for RCP 2.6. For RCP 8.5, an exceptional rainy month of May 2100 leads to ET(2100) > ET(2006) but during the century, the ET tendency rather shows a slow decrease.
When compared with the dew yield Hd, the potential evapotranspiration strongly depends on the value of the climate scenario. However, one can reasonably state that RCP 2.6 leads to stability between 2025 and 2100, with values PET/Hd < 50 in the inland, in agreement with a former evaluation for the Mediterranean Basin [33]. The ratio can reach 100 or 150 on the southern coast of the area. The RCP 8.5 scenario unsurprisingly exhibits a greater potential evapotranspiration and a stagnation or even a light decrease in dew yields, leading to values of the ratio PET/Hd,i > 100 over a large part of the territory, in particular on the Atlantic and Mediterranean coasts. Considering the comparison between the actual evapotranspiration ET with dew yields, the ratio can reach ET/Hd < 30 for 10 to 20% of the studied area, highlighting the potential interest of dew for organisms and plants living in these areas during the hottest months of the year. For ratios ET/Hd < 10, the concerned areas are near 8% (RCP 2.6) and 12% (RCP 8.5).
The second part of the study was concerned with chemical data in dew and rain in the representative site of Mirleft (south Morocco). Dew and rain samples exhibit major cations in the order Na+ > Ca2+ > Mg2+ > K+, similar to the spring water “Sidi Ali”. The ion concentration in rain and spring water is about two times less than in dew water. The concentrations of Cu2+, Zn2+ and Pb2+ are negligible. For all analyzed ions, the concentrations of cations and anions are compatible with WHO standards for potable water. However, the polycyclic aromatic hydrocarbons, which are present in the atmosphere [69], were not measured. Those hydrocarbons, of anthropogenic origin (combustion, car traffic, etc.) can lead to carcinogenic risks [70]. The large concentration of Na+, Mg2+ and Cl in dew and rain samples can be attributed to the marine origin of these ions, due to the close vicinity of the sampling site with the Atlantic Ocean as confirmed by the air mass trajectories.
The main variation in concentration of aerosols (Na+, Mg2+, Cl, Ca2+, K+) is a dilution effect, with higher concentrations for smaller volumes. Concerning gases (SO42−, NO3), in majority of anthropic origin, their concentration is less sensitive to the effect of dilution because of their fast absorption dynamics. The seasonal variations of the ionic concentrations in dew and rain thus mainly follow a volume dilution dependence, with higher concentration for lower dew and rain volumes; it is, thus, the inverse of the water volume evolution, with smaller ion concentrations in winter and higher in summer. Due to the expected diminution in dew and rain volumes according to the RCPs 2.6 and 8.5, it is therefore anticipated that the water ionic concentration of dew and rain will increase in the future.

Supplementary Materials

The following supporting information can be downloaded at: https://www.mdpi.com/article/10.3390/atmos13121974/s1.

Author Contributions

Conceptualization, D.B. and M.M.; Formal analysis, M.M. and D.B.; Funding acquisition, I.L. and D.B.; Methodology, M.M. and D.B., Resources, M.M., I.L. and D.B.; Writing—original draft, M.M. and D.B. All authors have read and agreed to the published version of the manuscript.

Funding

This research received no external funding.

Institutional Review Board Statement

Not applicable.

Informed Consent Statement

Not applicable.

Data Availability Statement

Data can be found on request at [email protected].

Acknowledgments

We thank G.A. Faggianelli (University of Corsica) for his help during data extraction from Weather Underground databases.

Conflicts of Interest

The authors declare no conflict of interest.

Appendix A. The Kriging Method

Kriging is a stochastic spatial interpolation method which predicts the value of a natural phenomenon at non-sampled sites by an unbiased, minimal variance linear combination of observations of the phenomenon at nearby sites. The Kriging tool assumes that the distance or direction between the sample points reflects a spatial correlation that can explain the surface variations. The Kriging tool applies a mathematical function to all points, or certain determined points, located within a specific radius. It determines the output value of each location.
The Kriging tool is particularly suitable for cases where it is known that there is a spatial correlation of distance or a directional deviation in the data. Kriging deduces, by weighting existing readings, the probable values of unmeasured locations. To calculate the interpolated data Z ^ ( s 0 ) at a specific location s0, the general formula of ordinary Kriging (OK) method consists of a weighted sum of the data [71]:
Z ^ ( s 0 ) = i = 1 P λ i Z ( s i )
Here, Z ( s i ) corresponds to the measured value at the ith location, λ i the ponderation coefficient to determine and relate to the ith location, s 0 the predicted location and p the number of measured data.
With the Kriging method, the λ i weighted coefficients are not only based on the distance between the surveyed points and the forecast location, but also on the general spatial organization of the surveyed points. To use the spatial arrangement in the weighing, the spatial autocorrelation is quantified. Thus, in ordinary Kriging, the weighting λ i depends on the distance from the forecast location and the spatial relationships between the values recorded around it.
The experimental semi-variogram can be estimated from point pairs:
γ ^ ( h ) = 1 2 n ( h ) i = 1 n ( h ) [ Z ( s i ) Z ( s i + h ) ] ²
where,
n ( h ) = C a r d { ( s i , s j ) / | s i s j | h }
with Card representing the number of elements for the given condition.
Classically, estimated semi-variogram are fitted by a spherical variogram model as proposed in previous studies on rainfall spatial estimation [72,73,74,75,76].
When the coordinates of the ground weather stations (e.g., Mirleft or Id Ouasskssou) do not correspond exactly to a kriging point, we have considered the nearest grid point to determine the estimated values.

References

  1. Tramblay, Y.; Badi, W.; Driouech, F.; El Adouni, S.; Neppel, L.; Servat, E. Climate change impacts on extreme precipitation in Morocco. Glob. Plan. Chang. 2012, 82–83, 104–114. [Google Scholar] [CrossRef]
  2. Schilling, J.; Hertig, E.; Tramblay, Y.; Scheffran, J. Climate change vulnerability, water resources and social implications in North Africa. Reg. Environ. Chang. 2020, 20, 15. [Google Scholar] [CrossRef] [Green Version]
  3. Schilling, J.; Freier, K.P.; Hertig, E.; Scheffran, J. Climate change, vulnerability and adaptation in North Africa with focus on Morocco. Agric. Ecosys. Environ. 2012, 156, 12–26. [Google Scholar] [CrossRef]
  4. Terink, W.; Immerzeel, W.W.; Droogers, P. Climate change projections of precipitation and reference evapotranspiration for the Middle East and Northern Africa until 2050. Int. J. Clim. 2013, 33, 3055–3072. [Google Scholar] [CrossRef]
  5. Tahiri, A.; Amraoui, F.; Sinan, M.; Bouchaou, L.; Berrada, F.; Benjmel, K. Influence of climate variability on water resource availability in the upper basin of Oum-Er-Rabiaa, Morocco. Groundw. Sustain. Dev. 2022, 19, 100814. [Google Scholar] [CrossRef]
  6. Chergui, B.; Fahd, S.; Santos, X.; Pausas, J.G. Socioeconomic factors drive fire-regime variability in the Mediterranean basin. Ecosystems 2018, 21, 619–628. [Google Scholar] [CrossRef] [Green Version]
  7. Choukri, F.; Raclot, D.; Naimi, M.; Chikhaoui, M.; Nunes, J.P.; Huard, F.; Hérivaux, C.; Sabir, M.; Pépin, Y. Distinct and combined impacts of climate and land use scenarios on water availability and sediment loads for a water supply reservoir in northern Morocco. Int. Soil Water Conserv. Res. 2020, 8, 141–153. [Google Scholar] [CrossRef]
  8. Seif-Ennasr, M.; Zaaboul, R.; Hirich, A.; Caroletti, G.N.; Bouchaou, L.; Beraaouz, E.H.; McDonnell, A.; Choukr-Allah, R. Climate change and adaptive water management measures in Chtouka Aït Baha region (Morocco). Sci. Total Environ. 2016, 573, 862–875. [Google Scholar] [CrossRef]
  9. Lefebvre, G.; Redmond, L.; Germain, C.; Palazzi, E.; Terzago, S.; Willm, L.; Poulin, B. Predicting the vulnerability of seasonally-flooded wetlands to climate change across the Mediterranean Basin. Sci. Total Environ. 2019, 692, 546–555. [Google Scholar] [CrossRef]
  10. Tramblay, Y.; Koutroulis, A.; Samaniego, L.; Vicente-Serranod, S.M.; Volaire, F.; Boone, A.; Le Page, M.; Llasat, M.C.; Albergel, C.; Burak, S.; et al. Challenges for drought assessment in the Mediterranean region under future climate scenarios. Earth-Sci. Rev. 2020, 210, 103348. [Google Scholar] [CrossRef]
  11. Marras, P.A.; Lima, D.C.A.; Soares, P.M.M.; Cardoso, R.M.; Medas, D.; Dore, E.; De Giudici, G. Future precipitation in a Mediterranean island and streamflow changes for a small basin using EURO-CORDEX regional climate simulations and the SWAT model. J. Hydrol. 2021, 603, 127025. [Google Scholar] [CrossRef]
  12. Grillakis, M.G. Increase in severe and extreme soil moisture droughts for Europe under climate change. Sci. Total Environ. 2019, 660, 1245–1255. [Google Scholar] [CrossRef]
  13. Carvalho, M.J.; Melo-Gonçalves, P.; Teixeira, J.C.; Rocha, A. Regionalization of Europe based on a K-Means Cluster Analysis of the climate change of temperatures and precipitation. Phys. Chem. Earth 2016, 94, 22–28. [Google Scholar] [CrossRef] [Green Version]
  14. Harbouze, R.; Pellissier, J.-P.; Rolland, J.-P.; Khechimi, W. Rapport de synthèse sur l’agriculture au Maroc; CIHEAM-IAMM: Montpellier, France, 2019; 104p. [Google Scholar]
  15. Werz, M.; Conley, L. Climate Change, Migration, and Conflict in Northwest Africa. Rising Dangers and Policy Options ACROSS the Arc of Tension; Report 2012; Heinrich Boll Stiftung, Center for Amirican Progress: Brussels, Belgium, 2012; p. 84. [Google Scholar]
  16. Desmidt, S. Climate change and security in North Africa. Focus on Algeria, Morocco and Tunisia. Cascades 2021, 1–44. [Google Scholar]
  17. Beysens, D. Dew Water; River Publishers: Gistrup, Denmark, 2018; p. 200. [Google Scholar]
  18. Lekouch, I.; Lekouch, K.; Muselli, M.; Mongruel, A.; Kabbachi, B.; Beysens, D. Rooftop dew, fog and rain collection in southwest Morocco and predictive dew modeling using neural networks. J. Hydrol. 2012, 448–449, 60–72. [Google Scholar] [CrossRef]
  19. Beysens, D. Estimating dew yield worldwide from a few meteo data. Atmos. Res. 2016, 167, 146–155. [Google Scholar] [CrossRef]
  20. Intergovernmental Panel on Climate Change. Climate Change 2014: Synthesis Report. Contribution of Working Groups I, II and III to the Fifth Assessment Report of the Intergovernmental Panel on Climate Change; Cambridge University Press: Cambridge, UK, 2014. [Google Scholar] [CrossRef]
  21. Moss, R.H.; Edmonds, J.A.; Hibbard, K.A.; Manning, M.R.; Rose, S.K.; Van Vuuren, D.P.; Kram, T. The next generation of scenarios for climate change research and assessment. Nature 2010, 463, 747–756. [Google Scholar] [CrossRef] [PubMed]
  22. O’Neill, B.C.; Carter, T.R.; Ebi, K.; Harrison, P.A.; Kemp-Benedict, E.; Kok, K.; Kriegler, E.; Preston, B.L.; Riahi, K.; Sillmann, J.; et al. Achievements and needs for the climate change scenario framework. Nat. Clim. Chang. 2020, 10, 1074–1084. [Google Scholar] [CrossRef] [PubMed]
  23. Taylor, K.E.; Stouffer, R.J.; Meehl, G.A. An overview of CMIP5 and the experiment design. Bull. Am. Meteorol. Soc. 2012, 93, 485–498. [Google Scholar] [CrossRef] [Green Version]
  24. ECMWF. Available online: https://cds.climate.copernicus.eu/cdsapp#!/dataset/projections-cordex-domains-single-levels?tab=overview (accessed on 1 March 2021).
  25. Lekouch, I.; Muselli, M.; Kabbachi, B.; Ouazzani, J.; Melnytchouk-milimouk, I.; Beysens, D. Dew, fog, and rain as supplementary sources of water in south-western Morocco. Energy 2011, 36, 2257–2265. [Google Scholar] [CrossRef]
  26. Beck, H.E.; Zimmermann, N.E.; McVicar, T.R.; Vergopolan, N.; Berg, A.; Wood, E.F. Present and future Köppen-Geiger climate classification maps at 1-km resolution. Sci. Data 2018, 5, 180214. [Google Scholar] [CrossRef] [PubMed] [Green Version]
  27. Zeroual, A.; Assani, A.; Meddi, M.; Alkama, R. Assessment of climate change in Algeria from 1951 to 2098 using the Köppen–Geiger climate classification schem. Clim. Dyn. 2019, 52, 227–243. [Google Scholar] [CrossRef]
  28. Arya, P.S. Introduction to Micrometeorology; Acadamic Press: San Diego, CA, USA, 2001; p. 420. [Google Scholar]
  29. Weather Underground Database. Available online: https://www.wunderground.com (accessed on 13 February 2021).
  30. NOAA. Available online: https://www.forecast.weather.gov (accessed on 13 February 2021).
  31. Muselli, M.; Clus, O.; Ortega, P.; Milimouk, I.; Beysens, D. Physical, chemical and biological characteristics of dew and rain water during the dry oceans on of tropical islands. Atmos 2020, 12, 69. [Google Scholar] [CrossRef]
  32. Météociel Database. Available online: https://www.meteociel.fr (accessed on 13 February 2021).
  33. Trosseille, J.; Mongruel, A.; Royon, L.; Beysens, D. Effective surface emissivity during dew water condensation. Int. J. Heat Mass Transf. 2022, 183, 122078. [Google Scholar] [CrossRef]
  34. Tomaszkiewicz, M.; Najm, A.; Beysens, D.; Alameddine, I.; Zeid, E.B.; El-Fadel, M. Projected climate change impacts upon dew yield in the Mediterranean basin. Sci. Total. Environ. 2016, 566–567, 1339–1348. [Google Scholar] [CrossRef]
  35. Martinez, W.A.; Melo, C.E.; Melo, O.O. Median Polish Kriging for space–time analysis of precipitation. Spat. Stat. 2017, 19, 1–20. [Google Scholar] [CrossRef]
  36. Pue, J.D.; Botula, Y.D.; Nguyen, P.M.; Meirvenne, M.V.; Cornelis, W.M. Introducing a Kriging-based Gaussian Process approach in pedotransfer functions: Evaluation for the prediction of soil water retention with temperate and tropical datasets. J. Hydrol. 2021, 597, 125770. [Google Scholar] [CrossRef]
  37. Muselli, M.; Beysens, D. Mapping past, present and future dew and rain water resources for biocrust evolution in southern Africa. J. Hydrol. Hydromech. 2021, 69, 400–420. [Google Scholar] [CrossRef]
  38. Amani, A.; Lebel, T. Lagrangian Kriging for the estimation of Sahelian rainfall at small time steps. J. Hydrol. 1997, 192, 125–157. [Google Scholar] [CrossRef]
  39. Lima, C.H.R.; Kwon, H.H.; Kim, Y.T. A Bayesian Kriging model applied for spatial downscaling of daily rainfall from GCMs. J. Hydrol. 2021, 597, 126095. [Google Scholar] [CrossRef]
  40. Yang, Y.; Chen, R.; Han, C.; Liu, Z. Evaluation of 18 models for calculating potential evapotranspiration in different climatic zones of China. Agric. Water Manag. 2021, 244, 106545. [Google Scholar] [CrossRef]
  41. Robineau, T.; Rodler, A.; Morille, B.; Ramier, D.; Sage, J.; Musy, M.; Graffin, V.; Berthier, E. Coupling hydrological and microclimate models to simulate evapotranspiration from urban green areas and air temperature at the district scale. Urban Clim. 2022, 44, 101179. [Google Scholar] [CrossRef]
  42. El Mansouri, B. Calcul de la réserve utile des sols pour une gestion rationnelle des eaux de l’irrigation. In Proceedings of the Recherche et Développement en Gestion Intégrée des Ressources Hydriques au Sud-Est du Maroc, International Conference, Ouarzazate, Morocco, 1–2 April 2004. [Google Scholar]
  43. Aoubouazza, M. Influence des propriétés hydrodynamiques du sol sur la sensibilité au dépérissement du cèdre dans le causse moyen-atlasique central marocain. Rev. Mar. Sci. Agron. Vét. 2017, 5, 293–303. [Google Scholar]
  44. Infoclimat. Available online: https://www.infoclimat.fr/ (accessed on 13 February 2021).
  45. MarocMétéo, Etat du Climat en 2020. Report of the Equipment, transport, logistic and water Minister. 2021. Available online: https://www.marocmeteo.ma/ (accessed on 1 May 2022). (In French).
  46. Sebbar, A.; Hsaine, M.; Fougrache, H.; Saloui, A.; Badri, W. Impact du changement climatique sur la région montagneuse du moyen Atlas au Maroc. In Proceedings of the XXXIIIème Colloque de l’Association Internationale de Climatologie, Rennes, France, 1–4 July 2020; pp. 619–624. [Google Scholar]
  47. Driouech, F. Distribution des Précipitations Hivernales sur le Maroc dans le cadre d’un Changement Climatique: Descente D’échelle et Incertitudes. Ph.D. Thesis, Institut National Polytechnique de Toulouse, Toulouse, France, 6 October 2010. [Google Scholar]
  48. Khomsi, K.; Mahe, G.; Tramblay, Y.; Sinan, M.; Snoussi, M. Trends in rainfall and temperature extremes in Morocco. Nat. Hazards Earth Syst. Sci. Discuss. 2015, 3, 1175–1201. [Google Scholar]
  49. Agoumi, A.; Debbarh, A. Ressources en eau et bassins versants du Maroc: 50 ans de développement (1955–2005). In 50 ans de Développement Humain et Perspectives 2025: Cadre Naturel, Environnement et Territoires; OIEau Association: Paris, France, 2005; pp. 9–58. [Google Scholar]
  50. Douville, H.; Ribes, A.; Decharme, B.; Alkama, R.; Sheffield, J. Anthropogenic influence on multidecadal changes in reconstructed global evapotranspiration. Nat. Clim. Chang. 2013, 3, 59–62. [Google Scholar] [CrossRef]
  51. Bartholomeus, R.P.; Stagge, J.H.; Tallaksen, L.M.; Witte, J.P.M. Sensitivity of potential evaporation estimates to 100 years of climate variability. Hydrol. Earth Syst. Sci. 2015, 19, 997–1014. [Google Scholar] [CrossRef] [Green Version]
  52. Büdel, B.; Darienko, T.; Deutschewitz, K.; Dojani, S.; Friedl, S.; Mohr, K.I.; Salisch, M.; Reisser, W.; Weber, B. Southern African biological soil crusts are ubiquitous and highly diverse in drylands, being restricted by rainfall frequency. Microb. Ecol. 2009, 57, 229–247. [Google Scholar] [CrossRef]
  53. Raggio, J.; Green, A.; Pintado, A.; Sancho, L.G.; Büdel, B. Functional performance of biocrust across Europe and its implications for drylands. J. Arid Environ. 2021, 186, 104402. [Google Scholar] [CrossRef]
  54. Pan, Y.; Wan, X.; Zhang, Y. Dew formation characteristics in a revegetation-stabilized desert ecosystem in Shapotou area, northern China. J. Hydrol. 2010, 387, 265–272. [Google Scholar] [CrossRef]
  55. Li, S.; Bowker, M.A.; Xiao, B. Biocrust enhance non rainfall water deposition and alter its distribution in dryland soils. J. Hydrol. 2021, 595, 126050. [Google Scholar] [CrossRef]
  56. Li, S.; Xiao, B.; Kidron, G.J. Moss-dominated biocrust enhance water vapor sorption capacity of surface soil and increase non-rainfall water deposition in drylands. Geoderma 2021, 388, 114930. [Google Scholar] [CrossRef]
  57. Zhuang, Y.; Zhao, W. Dew formation and its variation in Haloxylon ammodendron plantations at the edge of a desert oasis, northwestern China. Agric. For. Meteorol. 2017, 247, 541–550. [Google Scholar] [CrossRef]
  58. Kidron, G.J. The enigmatic absence of cyanobacterial biocrust from the Namib fog belt: Do dew and fog hold the key? Flora 2019, 257, 151416. [Google Scholar] [CrossRef]
  59. Lekouch, I. (OPUR International, Paris, France); Muselli, M. (OPUR International, Paris, France); Melnytchouk-Milimouk, I. (OPUR International, Paris, France); Beysens, D. (OPUR International, Paris, France) Personal communication, 2021.
  60. Nilsson, T.; Vargas, W.E.; Niklasson, G.A.; Granqvist, C.G. Condensation of water by radiative cooling. Renew. Energy 1994, 5, 310–317. [Google Scholar] [CrossRef]
  61. Nilsson, T. Initial experiments on dew collection in Sweden and Tanzania. Sol. Energy Mat. Solar Cells 1996, 40, 23–32. [Google Scholar] [CrossRef]
  62. OPUR. Organisation pour l’Utilisation de la Rosée. Available online: www.opur.fr (accessed on 15 November 2022).
  63. Olive, P.; Dassargues, A.; Grière, O.; Ruthy, I.; El Youbi, A. Caractérisation Isotopique des eaux de Granit et de l’auréole METAMORPHIQUE d’Oulmès (Maroc Central). Integrated Water Resources Management and Challenges of the Sustainable Development. In Proceedings of the GIRE3D International Congress on Integrated Water Resources Management and Challenges of the Sustainable Development; 2006. Available online: http://hdl.handle.net/2268/3459 (accessed on 13 February 2021).
  64. WHO WHO Guidelines for Drinking-Water Quality (GDWQ). 2017. Available online: https://www.who.int/publications/i/item/9789241549950 (accessed on 1 September 2022).
  65. WHO. WHO Guidelines for Drinking-Water Quality (GDWQ). 2022. Available online: https://www.who.int/publications/i/item/9789240045064 (accessed on 1 September 2022).
  66. Chang, T.Y.; Kuntasal, G.; Pierson, W.R. Night-time N2O5/NO3 chemistry and nitrate in dew water. Atmos. Environ. 1986, 21, 1345–1351. [Google Scholar] [CrossRef]
  67. Beysens, D.; Ohayon, C.; Muselli, M.; Clus, O. Chemical and biological characteristics of dew and rain water in an urban coastal area (Bordeaux, France). Atmos. Environ. 2006, 40, 3710–3723. [Google Scholar] [CrossRef]
  68. Draxler, R.R.; Rolph, G.D. HYSPLIT (HYbrid Single-Particle Lafrangian Integrated Trajectory) Model. 2010. Available online: http://www.arl.noaa.gov/ready/hysplit4.html (accessed on 13 February 2021).
  69. NOAA. 2022. Available online: http://www.arl.noaa.gov/ (accessed on 1 April 2022).
  70. Ambade, B.; Sankar, T.K.; Kumar, A.; Sethi, S.S. Characterization of PAHs and n-alkanes in atmospheric aerosol of Jamshedpur City, India. J. Hazard. Toxic Radioact. Waste 2020, 24, 04020003. [Google Scholar] [CrossRef]
  71. Ambade, B.; Sethi, S.S.; Chintalacheruvu, M.R. Distribution, risk assessment, and source apportionment of polycyclic aromatic hydrocarbons (PAHs) using positive matrix factorization (PMF) in urban soils of East India. Environ. Geochem. Health 2022, 1–15. [Google Scholar] [CrossRef]
  72. Kumar, P.; Rao, B.; Burman, A.; Kumar, S.; Samui, P. Spatial variation of permeability and consolidation behaviors of soil using ordinary kriging method. Groundw. Sustain. Dev. 2023, 20, 100856. [Google Scholar] [CrossRef]
  73. Bargaoui, Z.; Chebbi, A. Comparison of two Kriging interpolation methods applied to spatiotemporal rainfall. J. Hydrol. 2009, 365, 56–73. [Google Scholar] [CrossRef]
  74. Lepioufle, J.M.; Leblois, E.; Creutin, J.D. Variography of rainfall accumulation in presence of advection. J. Hydrol. 2012, 464–465, 494–504. [Google Scholar] [CrossRef]
  75. Van de Beek, C.Z.; Leijnse, H.; Torfs, P.J.J.F.; Uijlenhoet, R. Seasonal semi-variance of Dutch rainfall at hourly to daily scales. Adv. Water Resour. 2012, 45, 76–85. [Google Scholar] [CrossRef]
  76. Rahmawati, N. Space-time variogram for daily rainfall estimates using rain gauges and satellite data in mountainous tropical Island of Bali, Indonesia (Preliminary Study). J. Hydrol. 2020, 590, 125177. [Google Scholar] [CrossRef]
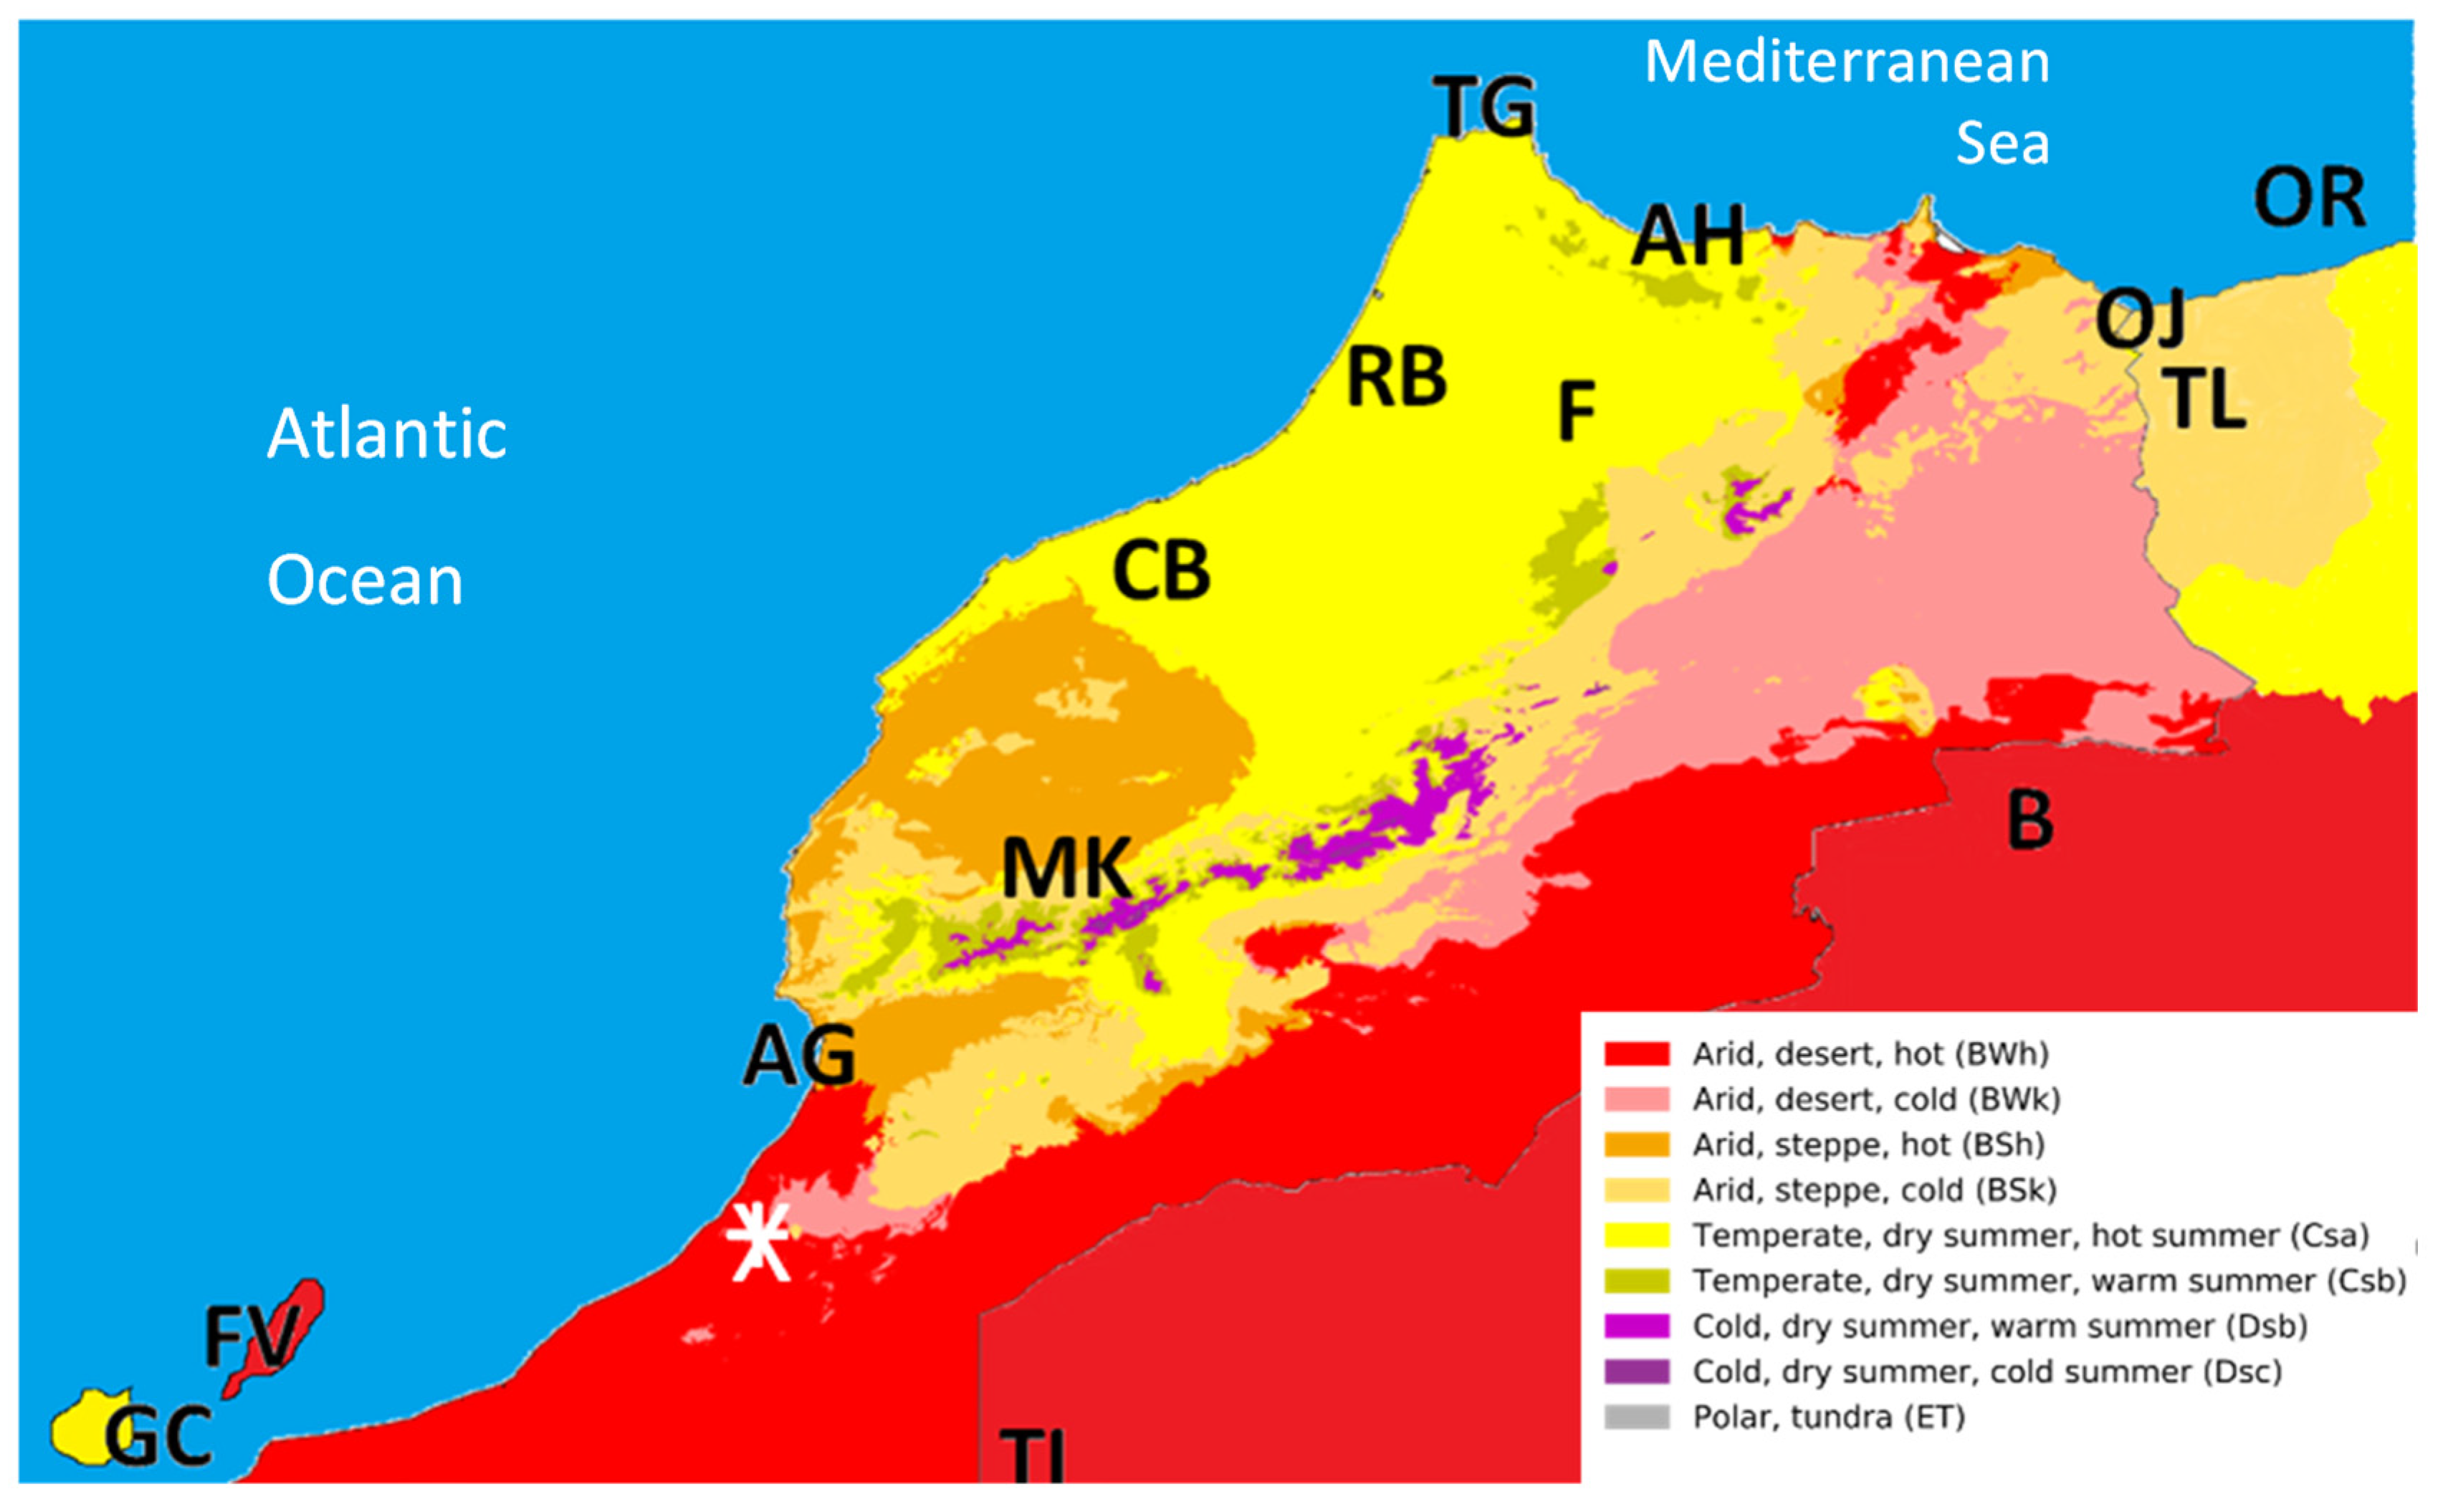
Figure 1. Köppen-Geiger climate classification map for the studied area concerning the period 1980–2016, from [25,26]. Meteo sites are indicated by letters (see Table 1 for the abreviations). The figure does not show the entire arid desert region (BWh climate) located at the south of the country. Right and inclined crosses (very close) represent Mirleft and Id Ouasskssou dew measurement sites.
Atmosphere 13 01974 g001
Figure 2. (a): Map of mean yearly dew yield Hd,y (mm·yr−1) for the period 2005–2020 (see text and Table 2). (b): Mean yearly nocturnal RH (%) during dew events during the same period. (c) Variations between years 2005 and 2020 of the yearly dew yield Hd,y (mm·yr−1). (d): Variations between years 2005 and 2020 of relative humidity RH (%). Red letters: Meteo sites (see Table 1). Right and inclined white crosses (very close) are, respectively, the sites of Mirleft (43 m asl, 200 m from the coast) and Id Ouasskssou (240 m asl, 8 km from the coast) [17].
Atmosphere 13 01974 g002
Figure 3. Yearly dew yields (mm·yr−1) for eight cities of Morocco as obtained from the physical model estimation (ordinate, Equation (3)) compared with the data obtained from an artificial neural network approach using the Mirleft data (abscissa, [17]). The full line corresponds to the equality of both calculations.
Atmosphere 13 01974 g003
Figure 4. (a) Mean yearly rainfall (mm·yr−1) during the period 2005–2020. (b) Yearly rainfall difference (mm·yr−1) between both years 2020 and 2005. (c) Ratio r (%) between the means of the yearly cumulative dew and rainfall volumes over the period 2005–2020 (Equation (15)). Red letters: Measurement sites (see Table 1). Right and inclined crosses (very close) represent, respectively, Mirleft (43 m asl, 200 m from the coast) and Id Ouasskssou (240 m asl, 8 km from the coast), both sites studied in [17].
Atmosphere 13 01974 g004
Figure 5. Predicted evolutions for Tanger (Morocco). Green crosses: Actual data of the difference with respect to the yearly mean value; blue squares: RCP 2.6 scenario; red circles: RCP 8.5 scenario. Curves are smoothened data. (a) Air temperature with respect to the 1980–1990 mean, Δ T a = T a ( t ) T ¯ a | 1980 1990 (K). (b) Dew yield Δ H d = H d ( t ) H ¯ d | 2005 2020 (mm) with respect to the 2005–2020 mean. (c) Rain precipitation Δ H r = H r ( t ) H ¯ r | 1990 2020 with respect to the 1990–2020 mean.
Atmosphere 13 01974 g005
Figure 6. Variation between 2006 (blue curves) and 2100 (red curves) of the monthly mean of potential evapotranspiration PET ((a,c), full lines), actual evapotranspiration ET ((a,c), interrupted lines), rain monthly means Hr,i ((b,d), full lines) and dew monthly means Hd,i (interrupted lines). The scenario RCP 2.6 is in (a,b) and RCP 8.5 in (c,d).
Atmosphere 13 01974 g006
Figure 7. Projected yearly dew yields (D, mm·yr−1) and rain yields (R, mm·yr−1) in North-West Africa according to the RCP scenarios 2.6 (left) and 8.5 (right) for years 2020, 2050, 2075 and 2100 (from top to bottom). The red points are the airport stations described in Table 1 and Figure 1.
Atmosphere 13 01974 g007
Figure 8. Spatial variation of the difference in yearly dew and rain yields Δ H d / r , y between 2100 and 2006 according to (a,c) scenario RCP 2.6 and (b,d) scenario RCP 8.5. Dew: (a,b); Rain: (c,d). Red points: airport stations described in Table 1 and Figure 1.
Atmosphere 13 01974 g008
Figure 9. Semi-log plot for Gran Canaria, Casablanca and Al-Hoceima of the yearly summed values of dew (Hd,y, blue, mm·yr−1, right axis), rain (Hr,y, red, mm·yr−1, left axis), and their ratio τ = sum(Hd,y)/sum(Hr,y) (black, dimensionless, right axis). The full curves correspond to the measured values (2005–2020), and the interrupted curves to predicted values (2006–2100) according to scenarios RCP 2.6 (left) and RCP 8.5 (right).
Atmosphere 13 01974 g009
Figure 10. Typical histograms of time period θ (day) between (a) rain events, (b) dew events (c) rain plus dew events, for the Fuerte Ventura site (Year 2010). θ0 is the mean time and θM is the maximum time between events. Note that some dew or rain events can disappear in the histogram dew + rain because dew or rain events can occur during the dew or rain time periods.
Atmosphere 13 01974 g010
Figure 11. Evolution of lapse times θM and θ0 (yearly values, 5 years timestep) for the coastal city Agadir (a,b) and the inland city Tindouf (c,d) sites from 2006 to 2100), according to both RCP scenarios (RCP 2.6: textured bars; RCP 8.5: full bars). The rain is green, dew is blue and rain + dew is red.
Atmosphere 13 01974 g011
Figure 12. Ratio of monthly actual evapotranspiration and monthly dew yield (ET/Hd,i) for 4 specific years (2025, 2050, 2075, 2100) according to the projections of RCPs 2.6 and 8.5 climate models. The study is concerned with the driest period (April to October). The white pixels, mainly located S and SW, correspond to Hd,i = 0 mm·mth−1, thus ET/Hd  . The resolution is 12.5 × 12.5 km2. The red points are Meteo stations as described in Table 1 and Figure 1.
Atmosphere 13 01974 g012aAtmosphere 13 01974 g012bAtmosphere 13 01974 g012cAtmosphere 13 01974 g012d
Figure 13. Dew and rainwater mean concentrations (mEq·L−1, VWM). The Sidi Ali spring water composition is given for comparison.
Atmosphere 13 01974 g013
Figure 14. (a) Variation of dew and rain electric conductivity EC with dew or rain volume per unit surface area, h (mm). Dew: red, lower abscissa; rain: blue, higher abscissa. (b) Correlations with h of the sea salts concentrations in dew (Na+, Cl: left ordinate; Mg2+: right ordinate). (c) Same, but with continental ions concentrations (Ca2+: left ordinate; K+, NO3, SO42−: right ordinate). (d) Same as (b) for rain ions of sea origin. (e) Same as (c) for rain ions of continental origin. (f) Correlated variations of EC and h with wind speed V at 10 m elevation for dew and rain. All curves in (af) are smoothed fit of single values.
Atmosphere 13 01974 g014
Figure 15. Some typical 24 h low elevation air mass backward trajectories for Mirleft at 6:00, corresponding to dew events. Colored lines represent the path of air masses starting at 500 m (red triangles and lines), 100 m (blue squares and lines), 10 m (green circles and lines) above the collection site. Data are taken every 6 h, corresponding to the points on the trajectories. From [68].
Atmosphere 13 01974 g015aAtmosphere 13 01974 g015b
Figure 16. Dew main ions concentrations, electric conductivity, pH and volume per unit area h (mm) correlated variations with the 24 h. mean air mass directions from Hysplit. (a) Concentration of main ions of ocean origin (Na+, Cl, Mg2+, in mEq·L−1). (b) Concentration of main ions of continental origin (Ca2+, K+, SO42−, NO3, in mEq·L−1). (c) EC and pH. All curves are smoothed fit of single values.
Atmosphere 13 01974 g016
Figure 17. Evolution of dew ions. (a) Comparative evolution of sea ions’ concentrations and dew volume per unit area h (mm). (b) Same as (a) but with continental ions. (c) Evolution of electric conductivity EC (µS·cm−1), pH and h (mm). All curves are smoothed fit of single values.
Atmosphere 13 01974 g017
Figure 18. Some typical 24 h low elevation air mass backward trajectories from Mirleft at 6:00 (data every 6 h) corresponding to rain events. Colored lines represent the path of air masses starting at 3000 m (red triangles and lines), 1000 m (blue squares and lines), 500 m (green circles and lines) above the collection site. Data are taken every 6 h, corresponding to the points on the trajectories. From [68].
Atmosphere 13 01974 g018
Figure 19. Correlated variations with the 24 h. mean air mass directions from Hysplit of main rain ions concentrations, electric conductivity EC, pH and dew volume per unit area h (mm). (a) Concentration of main ions of ocean origin (Na+, Cl, Mg2+) and h. (b) Concentration of the main ions of continental origin (Ca2+, K+, SO42−, NO3) and h. (c) EC, pH and h variation. All curves are smoothed fit of single values.
Atmosphere 13 01974 g019
Figure 20. Evolution of rain ions. (a) Comparative evolution of sea anions and cations concentrations and rain volume per unit area h (mm). (b) Same as (a) but with continental ions. (c) Evolution of electric conductivity EC (µS·cm−1), pH and rain volume per unit area h (mm). All curves are smoothed fit of single values.
Atmosphere 13 01974 g020
Table 1. Meteorological sites (airports) where atmospheric data are collected (8 stations in Morocco, 4 stations in Algeria and 2 stations in Spain) with typical climate and distance from the sea. They are sorted according to their longitude (west to east). The missing data fractions, in % of the total data, are also reported.
CountryAirportAbbreviationsKöppen-
Geiger
Climate
LatLongLat
Dec.
Long
Dec.
Alt (m)Missing Data
(%)
Distance
from the
Sea (km)
SpainGran CanariaGCCsa27° 55′ 55″ N15° 23′ 12″ W27.932−15.387240.01
SpainFuerteventuraFVBWh28° 27′ 10″ N13° 51′ 50″ W28.453−13.864260.01
MoroccoAgadirAGBSh30° 19′ 30″ N9° 24′ 47″ W30.325−9.413690.22
AlgeriaTindoufTICsa27° 42′ 00″ N8° 10′ 00″ W27.700−8.1674430.1275
MoroccoMarrakechMKBSh31° 36′ 54″ N8° 02′ 17″ W31.615−8.0384710.1137
MoroccoCasablancaCBCsa33° 22′ 05″ N7° 35′ 17″ W33.368−7.5882000.21
MoroccoRabatRBCsa34° 03′ 04″ N6° 45′ 05″ W34.051−6.751840.14
MoroccoTangerTGCsa35° 43′ 43″ N5° 55′ 01″ W35.729−5.917190.24
MoroccoFèsFCsa33° 55′ 39″ N4° 58′ 41″ W33.927−4.9785790.4134
MoroccoAl-HoceimaAHCsa35° 10′ 37″ N3° 50′ 23″ W35.177−3.840270.71
AlgeriaBécharBCsa31° 39′ 02″ N2° 15′ 11″ W31.651−2.2538110.1393
MoroccoOujdaOJBSk34° 47′ 15″ N1° 55′ 26″ W34.788−1.9244680.244
AlgeriaTlemcenTLCsa35° 00′ 55″ N1° 27′ 03″ W35.015−1.4512480.027
AlgeriaOranORCsa35° 37′ 38″ N0° 36′ 41″ W35.627−0.611910.011
Table 2. Correlation between sky observation and cloud cover according to [29]. The abbreviations for sky conditions are the following: CLR = Clear; FEW = Few; SCT = Scattered; BKN = Broken; OVC = Overcast.
ObservationN (Oktas)
CLR0
FEW1
SCT3
BKN5
OVC8
Table 3. Monthly (Hd,i) and yearly (Hd,y) dew yields calculated from meteorological data. Mean (arithmetic, with H ¯ d , y = 12 H ¯ d , i ), minimum and maximum values are reported for the 16 years period 2005–2020. The evolution of the yearly and monthly mean values is fitted to Equation (14) with α d , y and H d , y 0 (yearly means) and α d , i and H d , i 0 (monthly means) as free parameters. The red values correspond to a decrease, blue values to an increase.
SiteHd,y
(mm·year−1)
Hd,I
(mm·mth−1)
αd,y
(mm·yr−1)
H d , y 0

(mm·yr−1)
αd,i
(mm·mth−1)
H d , i 0

(mm·mth−1)
Yearly Frequency
(%)
MeanMinimumMaximumMeanMinimumMaximum
Gran Canaria1.30.61.90.080.00.90.021.130.0020.09418.4
Fuerteventura3.71.19.91.570.05.70.182.240.0010.18637.9
Agadir28.020.835.92.670.55.6−0.0828.71−0.0012.39880.7
Tindouf1.00.12.70.090.01.4−0.091.83−0.0010.1478.3
Marrakech18.84.732.81.240.011.1−0.6924.64−0.0052.02860.4
Casablanca32.118.954.31.820.48.92.0514.690.0141.31478.3
Rabat34.925.647.31.621.06.6−0.2236.82−0.0023.05675.9
Tanger14.910.324.80.530.24.2−0.0315.13−0.0031.28155.8
Fès21.914.236.52.130.09.0−0.0622.45−0.0011.89858.7
Al-Hoceima19.55.139.92.780.16.11.0210.790.0070.92970.0
Béchar6.40.811.62.640.06.5−0.4310.06−0.0030.80122.1
Oujda25.619.534.80.080.27.10.5021.280.0031.79865.3
Tlemcen33.423.643.81.570.46.9−0.8340.48−0.0063.34571.7
Oran31.723.640.92.670.47.50.1530.490.0012.54274.2
Table 4. Yearly (Hr,y) and monthly (Hr,i = Hr,y/12) rainfall values from meteorological data. Mean (arithmetic), minimum and maximum values are reported for the 16 years period (2005–2020). The evolution of the yearly and monthly mean values is fitted to Equation (14) with α r , y and H r , y 0 (yearly means) and α r , i and H r , i 0 (monthly means) as free parameters. Red values correspond to a decrease, blue values to an increase. r is the ratio between the yearly cumulative dew and rainfall volumes averaged over the period 2005–2020 (Equation (15)).
SiteHr,y (mm)Hr,i (mm)αr,y
(mm·yr−1)
H0r,y
(mm·yr−1)
αr,i
(mm·mth−1)
h0r,i
(mm·mth−1)
Yearly Frequency
(%)
r (%)
RCP2.6
RCP8.5
MeanMinimumMaximumMeanMinimumMaximum
Gran Canaria112382819.30113−6.907170.76−0.048814.04211.20.7 ± 0.1
0.9 ± 0.2
Fuerteventura61101315.1069−3.05987.33−0.02087.11347.47.7 ± 0.9
9.9 ± 1.6
Agadir29410111424.50662−8.209364.13−0.053429.6788.28.2 ± 0.8
8.0 ± 0.7
Tindouf5841444.801200.04857.680.00214.63843.21.2 ± 0.2
1.1 ± 0.1
Marrakech1846832415.30139−1.514197.47−0.011316.47211.92.8 ± 0.2
3.3 ± 0.2
Casablanca3468262428.80213−3.743387.17−0.026831.44716.86.1 ± 0.6
6.5 ± 0.3
Rabat488117123640.703260.645482.880.00340.41319.94.4 ± 0.4
5.1 ± 0.4
Tanger5499992045.80355−2.8744573.48−0.013647.07121.52.1 ± 0.2
2.0 ± 0.2
Fès47213084439.302163.371443.880.020437.41419.12.4 ± 0.2
2.5 ± 0.1
Al-Hoceima3027856225.20255−0.734309.06−0.008826.08115.83.0 ± 0.2
3.3 ± 0.1
Béchar11682769.670236−6.5135171.22−0.04313.8027.62.9 ± 0.3
3.1 ± 0.6
Oujda2556176021.20466−7.474318.78−0.059627.02515.63.6 ± 0.2
4.0 ± 0.2
Tlemcen28215342723.50111−3.551311.72−0.02726.06817.84.0 ± 0.2
4.3 ± 0.1
Oran33120653427.60144−3.955364.56−0.02530.00618.62.9 ± 0.2
3.5 ± 0.2
Table 5. Yearly mean, minimum and maximum values for maximum time θM and mean time θ0 (days) between events, considering all sites and according to both RCP scenarios between years 2006 and 2100.
θM (Days) RDR + D
RCP2.6AirportMeanMinMaxMeanMinMaxMeanMinMax
Gran Canaria83.4 ± 33.745.0167.6115.0 ± 27.070.3157.562.5 ± 23.732.3126.7
Fuerteventura135.1 ± 45.174.4242.340.6 ± 12.426.079.036.5 ± 10.721.957.8
Agadir87.5 ± 32.349.9190.617.2 ± 5.58.831.615.0 ± 4.68.824.0
Tindouf122.8 ± 39.863.0214.6140.5 ± 39.376.5201.957.5 ± 16.736.8116.5
Marrakech40.7 ± 10.622.662.626.6 ± 7.713.041.920.6 ± 4.412.826.5
Casablanca47.6 ± 17.425.998.59.6 ± 2.75.815.47.6 ± 2.34.912.9
Rabat39.7 ± 13.023.178.99.3 ± 1.76.814.06.7 ± 1.54.410.3
Tanger41.5 ± 12.325.570.113.3 ± 3.19.823.910.4 ± 2.66.115.8
Fès26.2 ± 6.415.638.118.5 ± 7.410.939.912.2 ± 3.16.519.9
Al-Hoceima36.9 ± 9.920.560.114.2 ± 3.79.622.612.9 ± 3.28.919.9
Béchar63.3 ± 22.829.6116.5107.2 ± 29.166.8173.944.2 ± 14.127.674.1
Oujda36.1 ± 10.520.057.313.6 ± 3.17.921.611.7 ± 3.37.617.9
Tlemcen38.9 ± 11.023.457.111.5 ± 3.45.818.010.7 ± 3.45.818.0
Oran38.6 ± 11.624.870.110.8 ± 2.46.816.88.8 ± 2.64.914.3
Statistics59.9 ± 40.415.6242.339.1 ± 46.75.8201.922.7 ± 20.84.4126.7
RCP8.5Gran Canaria91.6 ± 30.941.6176.698.6 ± 31.660.3193.662 ± 20.637.0105.5
Fuerteventura152.4 ± 54.271.4280.041.0 ± 14.923.084.937.3 ± 16.019.584.9
Agadir77.2 ± 22.742.6126.316.0 ± 4.89.526.615.5 ± 4.98.925.1
Tindouf125.9 ± 43.551.1208.6148.0 ± 44.067.8227.965.0 ± 23.333.0116.4
Marrakech50.3 ± 17.924.898.330.7 ± 11.616.960.923.4 ± 6.615.842.9
Casablanca56.4 ± 21.631.193.59.4 ± 2.05.813.58.3 ± 2.44.912.8
Rabat58.7 ± 26.124.4127.18.7 ± 2.05.913.56.7 ± 1.74.611.8
Tanger53.8 ± 22.427.490.914.8 ± 3.48.822.612.3 ± 3.96.822.6
Fès28.2 ± 7.116.748.023.5 ± 11.811.060.514.4 ± 5.57.830.0
Al-Hoceima37.1 ± 11.520.368.317.1 ± 4.910.830.014.4 ± 3.39.623.6
Béchar64.4 ± 19.135.3111.3114.8 ± 38.865.5182.945.6 ± 16.621.983.8
Oujda40.6 ± 13.821.970.315.1 ± 4.78.524.013.9 ± 4.57.923.3
Tlemcen41.3 ± 13.722.068.011.1 ± 3.66.922.89.9 ± 2.45.914.8
Oran51.8 ± 20.225.596.611.2 ± 2.66.819.88.5 ± 2.25.514.8
Statistics66.4 ± 42.816.7280.040.0 ± 47.85.8227.924.1 ± 22.24.6116.4
θ0 (days) RDR + D
AirportMeanMinMaxMeanMinMaxMeanMinMax
RCP2.6Gran Canaria14.7 ± 5.38.627.811.3 ± 3.47.422.46.3 ± 1.44.49.9
Fuerteventura27.3 ± 9.312.844.93.3 ± 0.62.65.03.0 ± 0.52.34.3
Agadir12.6 ± 4.76.322.21.4 ± 0.11.21.61.2 ± 0.11.01.5
Tindouf22.3 ± 8.110.842.113.4 ± 3.57.219.68.4 ± 2.14.412.5
Marrakech5.4 ± 1.33.28.82.1 ± 0.31.32.81.5 ± 0.21.01.9
Casablanca4.5 ± 0.93.16.21.0 ± 0.10.81.20.8 ± 0.10.70.9
Rabat3.8 ± 0.72.35.31.0 ± 0.10.81.20.7 ± 0.10.60.9
Tanger3.4 ± 0.62.24.61.6 ± 0.21.22.01.0 ± 0.10.81.3
Fès2.6 ± 0.41.63.31.1 ± 0.10.91.20.9 ± 0.10.71.0
Al-Hoceima3.7 ± 0.62.64.71.0 ± 0.10.91.20.9 ± 0.10.71.0
Béchar9.7 ± 1.76.513.35.0 ± 1.23.48.03.4 ± 0.72.54.7
Oujda3.7 ± 0.62.44.91.5 ± 0.21.11.71.0 ± 0.10.81.2
Tlemcen3.6 ± 0.62.24.81.2 ± 0.11.01.30.9 ± 0.10.71.0
Oran3.7 ± 0.62.85.11.4 ± 0.21.21.71.0 ± 0.10.81.1
Statistics8.6 ± 8.51.644.93.3 ± 4.10.822.42.2 ± 2.40.612.5
RCP8.5Gran Canaria17.9 ± 4.013.028.810.0 ± 2.06.2615.086.4 ± 1.04.48.4
Fuerteventura38.3 ± 22.318.9115.13.1 ± 0.32.603.652.9 ± 0.32.53.3
Agadir13.7 ± 5.18.731.21.4 ± 0.21.121.721.3 ± 0.11.01.5
Tindouf21.4 ± 9.312.957.116.4 ± 5.08.4230.599.3 ± 2.05.613.2
Marrakech6.0 ± 1.04.28.02.4 ± 0.41.513.401.7 ± 0.31.12.4
Casablanca4.9 ± 0.73.66.11.0 ± 0.10.861.230.8 ± 0.10.71.0
Rabat4.2 ± 0.72.65.41.0 ± 0.10.861.130.7 ± 0.10.60.8
Tanger3.5 ± 0.62.04.41.7 ± 0.21.362.101.1 ± 0.10.81.3
Fès2.8 ± 0.42.03.81.1 ± 0.20.821.530.9 ± 0.10.71.3
Al-Hoceima3.8 ± 0.62.54.71.2 ± 0.10.981.401.0 ± 0.10.81.2
Béchar10.9 ± 2.57.816.45.2 ± 1.13.267.363.6 ± 0.72.65.1
Oujda3.8 ± 0.72.75.11.5 ± 0.21.141.851.1 ± 0.10.81.4
Tlemcen3.8 ± 0.72.85.71.2 ± 0.10.981.450.9 ± 0.10.71.1
Oran3.9 ± 0.62.85.11.4 ± 0.11.131.551.0 ± 0.10.81.1
Statistics9.9 ± 11.82115.13.5 ± 4.50.830.62.3 ± 2.50.613.2
Table 6. Chemical analysis of dew and rain samples from Mirleft (Morocco, 1 May 2007–30 April 2008). The concentrations are expressed in mEq·L−1 and are compared with a local spring water (“Sidi Ali”, produced at Oulmès, Morocco). The electric conductivity is at 25 °C.
DEW (17 Samples)RAIN (8 Samples)Sidi Ali
MinMaxMeanSDVWMMinMaxMeanSDVWM(£)
V (mL)3333415699-1002230977649--
TH (°f)6.142.719.69.816.92.420.812.06.09.96.7
pH (*)6.87.97.50.37.56.77.16.90.26.96.5 ± 0.30
pH (**)6.87.97.50.3-6.57.26.90.2--
EC (mS.cm−1) (*)592920124393610751540618614273280 ± 20
EC (mS.cm−1) ($)394230759755-152081276269--
CationsCa2+0.8315.3982.4421.1622.0050.3682.5261.5400.6551.4470.624 ± 0.095
mEq·L−1Mg2+0.3543.1331.4780.9371.3660.1142.2000.8510.6670.5290.708 ± 0.305
K+0.0460.4770.2580.1350.2120.0180.2480.1310.0760.0960.077 ± 0.018
Na+0.76614.2805.4764.7575.3840.2658.1932.9903.0222.3060.992 ± 0.222
Cu2+0.0010.0330.0160.0100.014------
Zn2+0.0001.4000.1410.3550.145------
Pb2+0.000040.000080.000050.000010.00005------
AnionsCl1.71619.5398.5735.7408.0560.69910.9084.1473.3422.7770.542 ± 0.141
mEq·L−1NO30.0880.4640.2570.1110.2300.0390.4900.2260.1310.2100.003 ± 0.002
SO42−0.1151.1270.4190.2750.3660.0260.9950.3510.2760.3380.979 ± 0.625
HCO31.0001.4001.1410.1501.117-----1.234 ± 0.251
(*) chemical analysis samples: 17 for dew and 8 for rain; (**) all samples: 133 for dew and 27 for rain; ($) all samples: 130 for dew and 15 for rain; (£) calculated from [56].
Publisher’s Note: MDPI stays neutral with regard to jurisdictional claims in published maps and institutional affiliations.