Abstract
Sanjiang Plain is the most extensive marsh distribution region in China. Marshes in this region can protect biodiversity, regulate climate, and provide habitats for wild animals and plants. The normalized difference vegetation index (NDVI) is a crucial indicator of vegetation coverage, which may reflect ecosystem structure and functional features. Clarifying the spatiotemporal change of marsh coverage and its climatic drivers is vital for observing and predicting vegetation change in Sanjiang Plain. Using meteorological dataand MODIS NDVI data from 2000 to 2020, we analyzed the spatiotemporal variation in marsh vegetation coverage and climatic change effects in Sanjiang Plain. We found that the growing season vegetation NDVI of marsh increased significantly at a rate of 0.011/decade, indicating that the marsh vegetation growth has obviously improved during the past 21 years. Furthermore, we found that the increase of minimum (Tmin) and maximum (Tmax) temperature in July can significantly promote the marsh plant growth, and increasing nighttime Tmin has a stronger impact on promoting the growth than increasing daytime Tmax in this month. In addition, the increase of daytime Tmax in August can promote the marsh vegetation growth, whereas the increasing precipitation in August was unfavorable for the growth in Sanjiang Plain.
1. Introduction
Wetlands are an important ecosystem worldwide and have significant effects on regional and global carbon cycles [1,2]. Marshes are an important type of wetland that have an important effect on biogeochemical cycles and environmental purification [3,4,5,6,7]. As the core part of marsh ecosystems, vegetation can notably impact the energy cycle and transformation [8,9]. The normalized difference vegetation index (NDVI) is a vital indicator of vegetation coverage, which may reflect ecosystem structure and functional features [10]. It has been found that the growth, structure, and distribution of vegetation are affected by climate change. This has been one of the research hotspots in global change to clarify the climatic change effects on vegetation coverage [11,12]. At present, most scholars have studied the influences of climatic change on vegetation coverage in grassland and forest ecosystems, but there is a lack of research on the influence of climatic change in marsh vegetation coverage [13,14,15,16]. Marshes have unique environmental conditions that differ from other terrestrial ecosystems, and may lead to differences in the response of marsh vegetation coverage to climatic change [17,18,19,20,21,22,23,24,25,26,27]. Under the background of global climatic change, it is important to understand and clarify the climatic change effects on marsh vegetation coverage.
Sanjiang Plain is the most extensive marsh distribution region in China. Marshes in this region have many ecological functions such as protecting biodiversity, regulating climate, and providing habitats for wild animals and plants [9]. In recent decades, marshes on the Sanjiang Plain have been seriously degraded under the influence of climatic changes and human activity, and the loss of marsh has become increasingly serious [28]. The degradation and loss of marshes in the Sanjiang Plain have seriously affected the ecological environment of this region, causing a series of problems such as the reduction of biodiversity and ecological imbalance in this region [29]. For the purpose of ensuring sustainable economic development, it is urgent to protect and restore marshes in this region. The changes in marsh vegetation caused by climate change are more difficult to control than those caused by human activities, and they can only be adapted by improving ecosystem management. To scientifically promote the restoration of marsh vegetation, we need to further clarify the temporal and spatial variations in marsh vegetation coverage and the climatic changes in this region. In recent years, many researchers have studied the climatic change effects on marsh vegetation coverage in Sanjiang Plain, such as Scirpus nipponicus [30], Carex pseudocuraica and Carex lasiocarpa [31]. However, these studies have only analyzed the effect of climatic changes on marsh vegetation coverage at the species level, and there is a lack of research on the effect of climatic changes on all species vegetation in Sanjiang Plain. Some researchers have found that the effects of climatic changes on marsh vegetation coverage may be different for different vegetation types [9]. Therefore, we need to further analyze the effects of climatic changes on vegetation coverage for all plant species in this region. In addition, it has been found that the effect of climate on marsh vegetation is different during different months [9,32]. Chuai et al. [33] concluded that the increasing temperature in April and May promoted marsh vegetation growth in Inner Mongolia from 1998 to 2007. Shen et al. [34] found that the increasing precipitation from March to May was favorable for the vegetation growth in the marsh of Qinghai Tibet Plateau from 2000 to 2020. Wang et al. [35] concluded that the increase in precipitation from June to August could improve the marsh vegetation growth in the western Songnen Plain from 2000 to 2020. In order to protect and restore the marsh plants in this region, it is essential to further explore the effects of climatic changes on marsh vegetation coverage in different months in the Sanjiang Plain. Furthermore, Wang et al. [17] found that the minimum and maximum temperature have asymmetric effects on the marsh vegetation of Songnen Plain. An increase of maximum temperature may reduce the marsh vegetation coverage, while increasing the minimum temperature can increase the marsh vegetation coverage [17]. Compared with the brackish marshes in the semi-arid and arid Songnen Plain, the marshes in Sanjiang Plain are freshwater marshes. The climate in this region is wetter, and the temperature is lower. It is not clear whether the variations of daytime and nighttime temperatures have different influences on the marsh vegetation coverage in this region. Given the background of global asymmetric daytime and nighttime temperature rises, we should further explore the response of marsh vegetation coverage to daytime and nighttime temperature variations in Sanjiang Plain.
Using MODIS NDVI and meteorological data in Sanjiang Plain, this study analyzed the spatial and temporal variation in NDVI and climatic change effects in marshes of the Sanjiang Plain during the growing season and each month from 2000 to 2020. Under the background of global climate change, clarifying the changes in marsh vegetation coverage and climatic change effects in Sanjiang Plain can provide scientific reference for the dynamic prediction and adaptive management of marsh vegetation in this region.
2. Materials and Methods
2.1. Study Area
Sanjiang Plain is situated at the east of Heilongjiang Province, China (Figure 1) [36]. The climate of Sanjiang Plain is a temperate monsoon climate, with humid and semi humid characteristics [37]. The annual average precipitation and temperature are 500 to 700 mm and 1.6 to 3.9 °C, respectively [38]. The Sanjiang Plain is rich in water resources and is the most extensive marsh distribution region in China [39]. The marsh vegetation types in this region mainly include Carex lasiocarpa, Phragmites communis, Carex meyeriana, and Carex pseudocuraica [40].
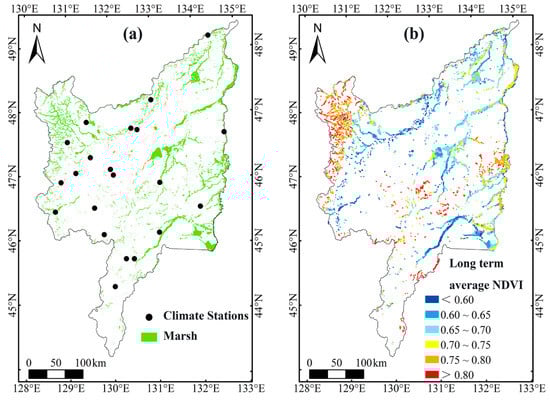
Figure 1.
Spatial distribution of (a) marsh wetlands and (b) long-term average growing season NDVI of unchanged marsh vegetation in Sanjiang Plain from 2000 to 2020.
2.2. Data
The marsh distribution data used in this study wereobtained from the Chinese marsh wetland in 2015 and 2000 [41]. The spatial resolution of the marsh distribution data was 30 m and passed strict data quality control and verification [42,43]. The meteorological data used in this study were monthly minimum (Tmin), maximum (Tmax), average (Tmean) temperature, and precipitation data from 21 climatic stations on the study region from 2000 to 2020. The meteorological data were obtained from the Chinese Meteorological Center, and the quality of them was guaranteed with a strong quality assurance procedure [44,45]. The MODIS NDVI data used in this study were the MOD13Q1 dataset from 2000 to 2020 and the temporal and spatial resolutions of MOD13Q1 were 16 days and 250 m, respectively [2].
2.3. Methods
In this study, the maximum value compositing method [46] was applied to convert the ten-day NDVI dataset into the monthly NDVI, so as to reduce the impact of uncertainties such as atmosphere, solar altitude angle, and cloud on the data. Considering that the vegetation only grows in the growing season and the annual NDVI value may be greatly affected by snow cover and other factors [47], this paper used NDVI during the growing season to analyze the dynamic changes of vegetation. According to previous studies [48,49], this study defined May to September as the growing season of the marsh vegetation in the study region, and calculated the average NDVI from May to September in each year to obtain the dataset of the average growing season NDVI (hereinafter referred to as growing season NDVI) from 2000 to 2020. For the purpose of excluding the influences of human activity on marsh vegetation, we extracted the unchanged marsh distribution in this region (marshes in 2015 and 2000). To prevent the influence of non-vegetation on the research results, this study further extracted pixels with a long-term (2000–2020) growing season NDVI higher than 0.1 of marshes in the study region. We then chose the distribution of these pixels as the distribution of the unchanged marsh vegetation. The average NDVI and climate factor corresponding to all marsh vegetation pixels were taken as the NDVI and climate factors of marsh vegetation in this region.
The Kriging interpolation method was applied to interpolate meteorological data, and the images of climatic factor had the same spatial resolution (250 m) as NDVI images of marsh vegetation in study region [2,9].
The Mann–Kendall (MK) test and simple linear regression [50,51] were used to analyze the trend of NDVI and climatic factors of marshes in Sanjiang Plain. The formula of the trend analysis is the following [47]:
In Formula (1), Mi refers to the NDVI (or meteorological factor) value in the ith year; n means the length of the research period, n = 21 years in this study; i is the serial number of year; θslope represents the slope of the change trend in NDVI (or climatic factor) of each pixel; if θslope > 0, it means that the NDVI (or climatic factor) has an increasing trend, otherwise it is reduced.
The correlation between climatic factors and corresponding NDVI was calculated by Pearson correlation analysis method, and the formula is the following [47]:
In Formula (2), Rab represents the correlation coefficient; n refers the length of the study period, n = 21 years in this study; ai represents the average value of the climatic factors in year i; is the average of the climatic factors during the past 21 years; bi means the NDVI in year i; refers to the average NDVI during the past 21 years. In addition, this study used multiple linear regression analysis to explore the effects of precipitation and temperature together on the dynamics of marsh vegetation NDVI [52].
3. Results and Discussions
3.1. Spatiotemporal Change in NDVI in Marsh Vegetation of Sanjiang Plain
The growing season vegetation NDVI of marshes in Sanjiang Plain increased significantly (p < 0.05) by 0.011/decade from 2000 to 2020 (Figure 2a). This result was similar to Du et al. [53] who found that the growing season NDVI of marshes increased in this region. The NDVI of the marsh vegetation increased each month during the growing season and the NDVI in June and July increased significantly (p < 0.05) by 0.021/decade and 0.016/decade, respectively (Figure 2c,d).
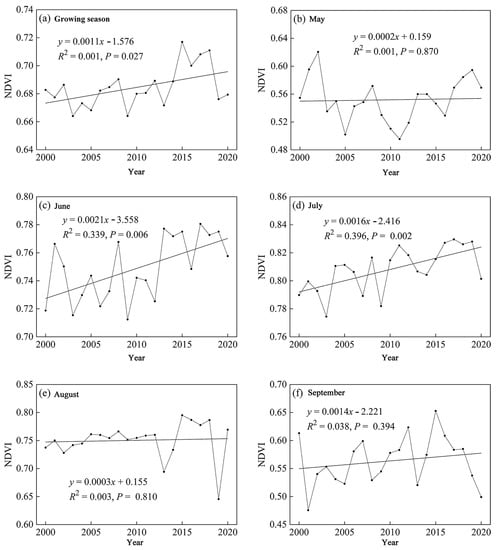
Figure 2.
Changes of vegetation NDVI of marshes in Sanjiang Plain from 2000 to 2020.
From 2000 to 2020, the higher and lower growing season NDVI of marsh was situated at the northwestern and eastern Sanjiang Plain (Figure 1b). Spatially, from 2000 to 2020, pixels with an increasing trend of growing season NDVI of marsh vegetation accounted for 71.12% of the total pixels, and the increased NDVI was mainly located in the northwestern Sanjiang Plain (Figure 3a). The decreased growing season NDVI was mainly situated at the east of Sanjiang Plain (Figure 3a). This result was basically consistent with the conclusion of Zhang et al. [54], who found that the NDVI of vegetation in the eastern Sanjiang Plain decreased remarkably. During the growing season, the increased NDVI of marsh vegetation from May to September in Sanjiang Plain accounted for 42.78% (Figure 3b), 73.91% (Figure 3c), 75.70% (Figure 3d), 62.58% (Figure 3e) and 71.12% (Figure 3f) of the total pixels, respectively. The increased NDVI in June was mainly situated at the middle (Figure 3c), while the increased NDVI in other months was situated in the northwest of the study region. The NDVI during the growing season showed a decreasing trend in the eastern Sanjiang Plain, and the pixels with decreased NDVI in May accounted for the largest proportion in the marsh of Sanjiang Plain (Figure 3b).
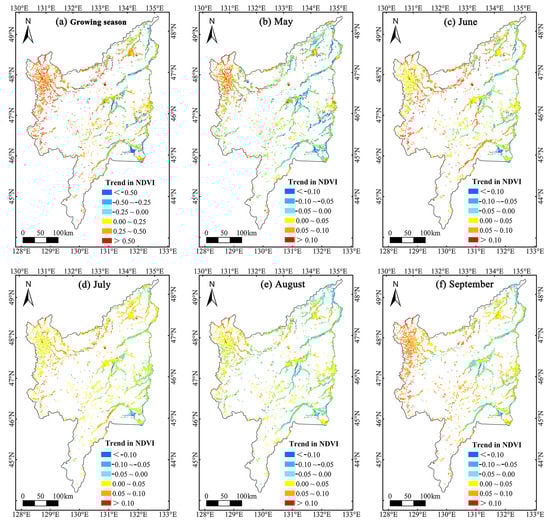
Figure 3.
Change trends in vegetation NDVI (/decade) of marshes in the study region from 2000 to 2020.
3.2. Correlation between NDVI of Marsh Vegetation and Climatic Factors in Sanjiang Plain
The growing season NDVI of marsh vegetation had a weak negative correlation with Tmean and Tmax, and a weak positive correlation with Tmin and precipitation in the growing season from 2000 to 2020 (Table 1) in Sanjiang Plain. Spatially, the pixels with positive correlation between the growing season NDVI of marsh vegetation and precipitation in the growing season accounted for approximately 62.26% (Figure 4a), while the pixels with positive correlation with growing season Tmin accounted for 56.80% (Figure 4d) of the total pixels in Sanjiang Plain from 2000 to 2020. The proportion of pixels with a negative correlation between NDVI and Tmean during growing season was approximately 54.20% (Figure 4b), while the proportion of pixels with anegative correlation with growing season Tmax was approximately 59.53% (Figure 4c).

Table 1.
Correlation coefficients between growing season (monthly) NDVI of marsh vegetation and growing season (monthly) Tmean, Tmin, Tmax and precipitation during the growing season in Sanjiang Plain from 2000 to 2020.
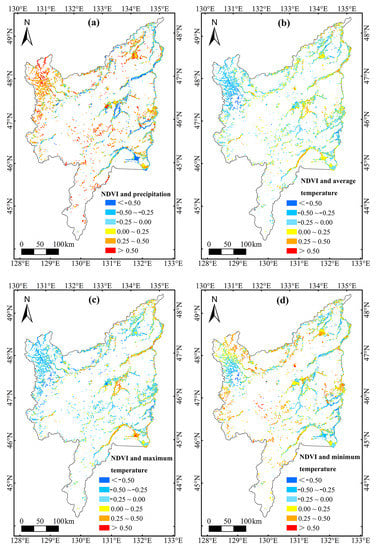
Figure 4.
Spatial distribution of relationships between growing season NDVI of marsh vegetation and (a) precipitation, (b) average temperature, (c) maximum temperature and (d) minimum temperature during growing season in the study region from 2000 to 2020.
For exploring the climatic effects on vegetation NDVI in the marshes of the study region, we explored the relationships between climatic factors and NDVI of marsh vegetation during the growing season (from May to September). Marshes are relatively humid ecosystems [18,19,20,21,22], and thus water is important for the establishment and reproduction of plants in marshes [47]. In addition to water, temperature has an important effect on marsh plant growth [28,32,34]. The rise of temperature increases enzyme activity, thus promoting vegetation photosynthesis [32,55,56]. Furthermore, increasing temperature may promote nutrient absorption, thus promoting the marsh vegetation growth [34,57]. We found that the July NDVI had positive correlations with temperature and precipitation in July, and a significant (p < 0.05) positive correlation with temperature in July (Table 1). The positive relationship between NDVI and temperature in July was mainly situated at the north of the study region (Figure 5). This indicates that increasing temperature in July could promote marsh vegetation growth in Sanjiang Plain. Warming during the nighttime and daytime in July had asymmetric effects on marsh vegetation growth. The increase of daytime Tmax and nighttime Tmin could promote the growth of marsh vegetation, whereas the increase of nighttime Tmin was more favorable to marsh vegetation growth. On one hand, July is the most vigorous period of vegetation growth [58], and the rise of the Tmax in the daytime can promote photosynthesis by increasing the activity of enzymes [59]. On the other hand, the increase of nighttime Tmin may cause a compensatory effect to compensate for respiration. The compensation effect is a phenomenon whereby a plant recovers by promoting the photosynthesis of vegetation the next day after the increase of respiration caused by the increase of temperature at night and the loss of more organic matter, which belongs to the mechanism of vegetation to adapt to the marsh growth environment [60,61]. The influence of night warming on marsh plants depends on the balance between the compensation effect and respiration enhancement. It is reported that plants have a high compensation effect when they grow in an environment with sufficient nutrients and water [34], and it may sometimes even cause a super compensation effect, which may exceed the original growth state [62]. The marshes in Sanjiang Plain have good hydrothermal and nutrient conditions in July, which is the best period for the occurrence of the overcompensation effect [32]. Therefore, increasing Tmin at night in July can significantly promote marsh vegetation growth in Sanjiang Plain.
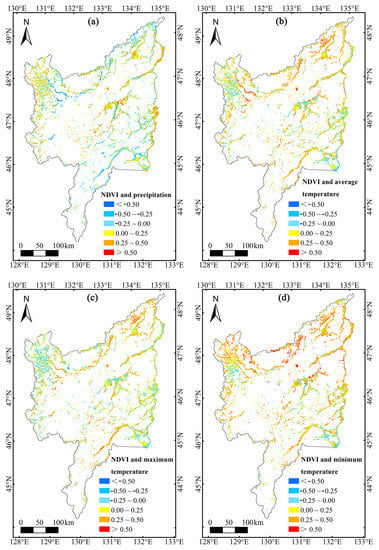
Figure 5.
Spatial distribution of relationships between July NDVI of marsh vegetation and July (a) precipitation, (b) average temperature, (c) maximum temperature and (d) minimum temperature in the study region from 2000 to 2020.
In addition, we found that the August NDVI of marsh vegetation showed significant (p < 0.05) negative and positive correlations with precipitation and Tmax in August (Table 1) in Sanjiang Plain. Spatially, the proportion of negative correlations between the NDVI of marsh vegetation and precipitation in August was approximately 58.35% in Sanjiang Plain (Figure 6a), and the proportion of positive correlations with the Tmax in August was about 60.67% (Figure 6c). This indicates that the increase of precipitation in August may inhibit the growth of marsh vegetation, while the increase of Tmax would promote marsh vegetation growth. This is because August is the vigorous growth season of marsh plants [63], when they require a higher daytime temperature to promote photosynthesis. Therefore, the rise of the Tmax in August could promote the growth of plants in this region. In addition, August is the rainy season in this region [63]. Increasing precipitation may cause an increase of daytime cooling and cloudy days, which may inhibit photosynthesis in marsh vegetation. Increasing precipitation during the rainy season may also cause the appearance of vegetation flooding [64,65], which could partly explain the unfavorable effect of precipitation in August on the plant growth in Sanjiang Plain. In particular, the August minimum vegetation NDVI of marshes occurred in 2019 (Figure 2e). The maximum precipitation in August occurred in 2019 of marshes in this region from 2000 to 2020, reaching 287 mm, which was far higher than the long-term average precipitation in August during the study period (125 mm). As the increase of precipitation in August may be unfavorable to plant growth, the excessive precipitation in August 2019 may explain the August minimum vegetation NDVI of marshes in Sanjiang Plain. In addition, this study found that NDVI showed weak negative correlations with Tmin at night in June and August (Table 1), which differed from the result that NDVI showed a significant (p < 0.05) positive correlation with the Tmin in July. This may be because the highest temperature in Sanjiang Plain occurred in July [66], and the marsh vegetation grows most vigorously in July [58]. The compensation effect may be stronger due to enhanced respiration at night. Compared with July, June and August were not the most vigorous periods of plant growth in the marsh in this region. The temperature was lower in these two months; August was the rainy season with more cloudy days, and the photosynthetic ability of vegetation was relatively weak [63]. This may explain why the photosynthetic compensation could not remarkably exceed the organic consumption of respiration in June and August.
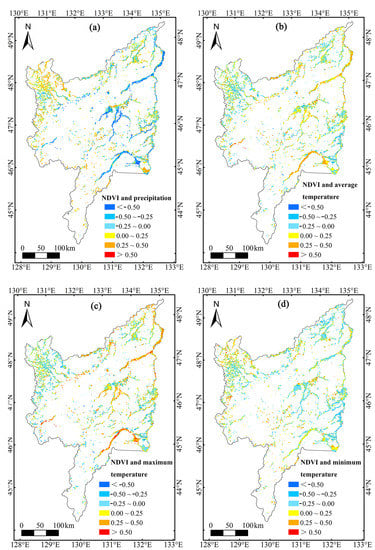
Figure 6.
Spatial distribution of relationships between August NDVI of marsh vegetation and August (a) precipitation, (b) average temperature, (c) maximum temperature and (d) minimum temperature in the study region from 2000 to 2020.
Furthermore, we analyzed the effects of annual and monthly climatic factors (Tmean, Tmin, Tmax and precipitation) on the growing season NDVI, and found that the correlations between annual climatic factors and the growing season NDVI were not significant (Table 2). This suggests that the annual climatic factors have no significant effects on the growing season NDVI. Based on multiple linear regression analysis, we found that precipitation and temperature in all months together explained 87.8% of the variation in growing season NDVI over the study region. The results showed that growing season NDVI has a significant (p < 0.05) positive correlation with the temperature in July (Table 2). This confirms that the rise of temperature in July can promote the marsh plant growth in Sanjiang Plain. Therefore, increasing temperature in July (Table 2) may be the main reason for the increased growing season NDVI of marsh vegetation in Sanjiang Plain in the past 21 years (Figure 2).
Table 2.
Correlation coefficients between growing season NDVI of marsh vegetation and annual and monthly Tmean, Tmin, Tmax and precipitation in Sanjiang Plain from 2000 to 2020.
The variations in precipitation and temperature in Sanjiang Plain over the past 21 years were calculated to further explain the spatiotemporal variations of vegetation NDVI. From 2000 to 2020, the Tmin and precipitation in the growing season generally increased, and the precipitation in the growing season showed a significant (p < 0.05) increasing trend (Table 3). The Tmean and Tmax in the growing season showed weak decreasing trends in marshes in this region (Table 3). In different months, the precipitation showed significant (p < 0.05) increasing trends in June, August and September, while the Tmax only showed a significant (p < 0.05) increasing trend in June (Table 3). Spatially, the largest increase in the growing season NDVI of marsh vegetation was situated in the northwestern Sanjiang Plain from 2000 to 2020 (Figure 3a). The strongest increasing trend of precipitation and the strongest decreasing trend of Tmean in the growing season were also situated in the northwestern Sanjiang Plain (Figure 7). According to the correlation analysis results, it can be concluded that decreasing Tmean and increasing precipitation in the growing season may be the reason for the largest increase in growing season vegetation NDVI of marshes in the northwest of Sanjiang Plain. The July vegetation NDVI of marshes increased significantly in the north of the study region (Figure 3d), and the correlation between NDVI of marsh vegetation and temperature in July was positive in this region (Figure 5). Therefore, the increase of temperature in July (Figure 8) may explain the increase in July NDVI of marsh vegetation in the north of the study region. The largest decreasing trend of August NDVI was mainly situated at the northeast of Sanjiang Plain (Figure 3e). According to the correlation analysis results, the Tmax and precipitation in August were positively and negatively correlated with the August vegetation NDVI of marshes in this region (Figure 6). The decrease of the Tmax and the increase of precipitation in August (Figure 9) may be the reason for the decrease in August vegetation NDVI of marshes in the northeast of Sanjiang Plain.
Table 3.
Change trends in Tmean (°C/year), Tmin (°C/year), Tmax (°C/year) and precipitation (mm/year) of marshes in Sanjiang Plain during the growing season from 2000 to 2020.
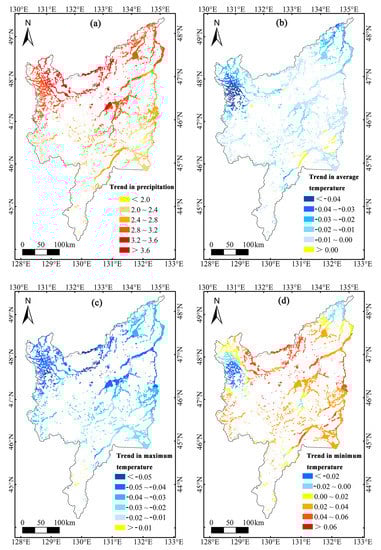
Figure 7.
Change trends in growing season (a) precipitation (mm/year), (b) Tmean (°C/year), (c) Tmax (°C/year) and (d) Tmin (°C/year) in the study region from 2000 to 2020.
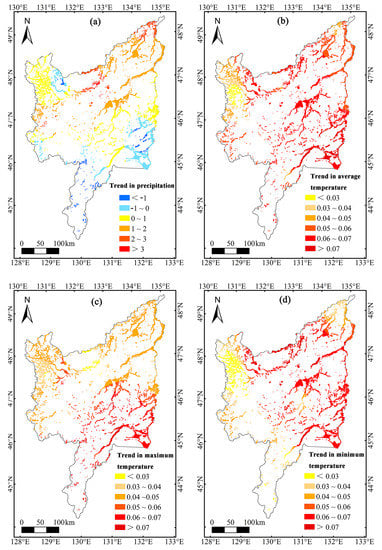
Figure 8.
Change trends in July (a) precipitation (mm/year), (b) Tmean (°C/year), (c) Tmax (°C/year) and (d) Tmin (°C/year) in the study region from 2000 to 2020.
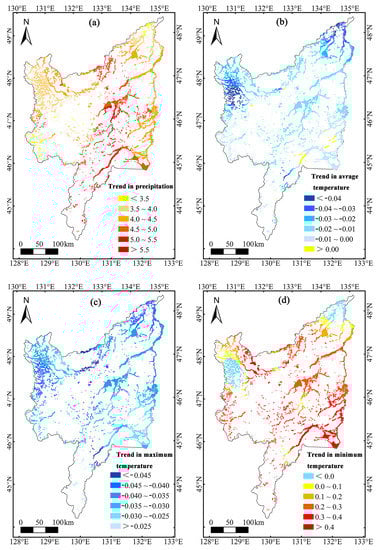
Figure 9.
Change trends in August (a) precipitation (mm/year), (b) Tmean (°C/year), (c) Tmax (°C/year) and (d) Tmin (°C/year) in the study region from 2000 to 2020.
There may have been some uncertainties in this study. First, the remote sensing satellite data may affect the research results owing to the influence of clouds, atmosphere, etc. Second, meteorological results obtained by the interpolation method in this study may have some errors, which may impact the results of this study. Furthermore, human activities have had significant impacts on the marsh vegetation in Sanjiang Plain during the recent decades. Although this study extracted the unchanged marsh vegetation in the study period as the study region, it cannot completely exclude the influences of human activity on the marsh vegetation. Therefore, we need to further distinguish the influences of human activity on marsh vegetation in future studies. Third, considering the complexity of climate change and its impacts on vegetation, we should employ techniques of signal analysis to explore the cyclic patterns, and use more professional tools to model the impact of climate change in the future. In addition, this study mainly analyzed the impact of precipitation and temperature on the vegetation coverage of marshes in Sanjiang Plain. However, many other factors also influence the marsh vegetation coverage. In the future, it will be necessary to explore the impacts of environmental and other meteorological factors on the vegetation coverage of marshes in Sanjiang Plain.
4. Conclusions
Under the background of climate change, the variation invegetation coverage and its response to climate change in the marshes of Sanjiang Plainare not clear. This study revealed the spatiotemporal change in NDVI and the effect of climatic change on the marsh vegetation coverageinSanjiang Plain. We found that the growing season NDVI of marsh vegetation increased at a rate of 0.011/decade in Sanjiang Plain from 2000 to 2020. The significant increased growing season NDVI of marsh vegetation was mainly concentrated in the northwestern Sanjiang Plain, while the decreasing trend was mainly concentrated in the eastern area. The growing season NDVI of marsh vegetation has no significant correlations with growing season temperature and precipitation in Sanjiang Plain. The precipitation and temperature in different months have different effects on the growth of marsh vegetation in Sanjiang Plain. The increase of daytime and nighttime temperatures in July could accelerate plant growth inmarshes, and increasing Tmin at night has a greater effect on promoting plant growth inmarshes than the increase of Tmax in the daytime. Increasing daytime Tmax in August could still promote marsh vegetation growth, while the increase of precipitation in August is unfavorable to the growth of marsh vegetation in Sanjiang Plain. In the context of global climatic change, we should pay attention to the effects of climatic changes in different months on marsh vegetation, especially when simulating marsh vegetation coverage in Sanjiang Plain. These results can provide scientific reference for the dynamic prediction and adaptive management of marsh vegetation in this region.
Author Contributions
Y.L. analyzed and wrote this paper. X.S. contributed to writing—reviewing and editing. J.Z., Y.W., L.W. and R.M. contributed to reviewing and editing; X.L. and M.J. contributed to reviewing and supervising. All authors have read and agreed to the published version of the manuscript.
Funding
This research was funded by National Natural Science Foundation of China (41971065), Natural Science Foundation of Jilin Province (20210101104JC), Key Research Program of Frontier Sciences, CAS (ZDBS-LY-7019), and Youth Innovation Promotion Association, CAS (2019235).
Institutional Review Board Statement
Not applicable.
Informed Consent Statement
Not applicable.
Data Availability Statement
The datasets used and/or analyzed during the current study areavailable in the article/from the corresponding author on request.
Conflicts of Interest
The authors declare no conflict of interest.
References
- Mitsch, W.J.; Bernal, B.; Nahlik, A.M.; Mander, Ü.; Zhang, L.; Anderson, C.J.; Jørgensen, S.E.; Brix, H. Wetlands, carbon, and climate change. Landsc. Ecol. 2013, 28, 583–597. [Google Scholar] [CrossRef]
- Shen, X.; Liu, B.; Xue, Z.; Jiang, M.; Lu, X.; Zhang, Q. Spatiotemporal variation in vegetation spring phenology and its response to climate change in freshwater marshes of Northeast China. Sci. Total Environ. 2019, 666, 1169–1177. [Google Scholar] [CrossRef]
- Benelli, S.; Bartoli, M. Worms and submersed macrophytes reduce methane release and increase nutrient removal in organic sediments. Limnol. Oceanogr. Lett. 2021, 6, 329–338. [Google Scholar] [CrossRef]
- Cabral, A.; Dittmar, T.; Call, M.; Scholten, J.; Rezende, C.; Asp, N.; Gledhill, M.; Seidel, M.; Santos, I. Carbon and alkalinity outwelling across the groundwater-creek-shelf continuum off Amazonian mangroves. Limnol. Oceanogr. Lett. 2021, 6, 369–378. [Google Scholar] [CrossRef]
- Keppeler, F.; Olin, J.; López-Duarte, P.; Polito, M.; Hooper-Bùi, L.; Taylor, S.; Rabalais, N.; Fodrie, F.; Roberts, B.; Turner, R.; et al. Body size, trophic position, and the coupling of different energy pathways across a saltmarsh landscape. Limnol. Oceanogr. Lett. 2021, 6, 360–368. [Google Scholar] [CrossRef]
- Marlow, J.; Spietz, R.; Kim, K.Y.; Ellisman, M.; Girguis, P.; Hatzenpichler, R. Spatially resolved correlative microscopy and microbial identification reveal dynamic depth- and mineral-dependent anabolic activity in salt marsh sediment. Environ. Microbiol. 2021, 23, 4756–4777. [Google Scholar] [CrossRef]
- Shen, X.; Jiang, M.; Lu, X. Diverse impacts of day and night temperature on spring phenology in freshwater marshes of the Tibetan Plateau. Limnol. Oceanogr. Lett. 2022. [Google Scholar] [CrossRef]
- Zhao, L.; Dai, A.; Dong, B. Changes in global vegetation activity and its driving factors during 1982–2013. Agric. For. Meteorol. 2018, 249, 198–209. [Google Scholar] [CrossRef]
- Shen, X.; Xue, Z.; Jiang, M.; Lu, X. Spatiotemporal change of vegetation coverage and its relationship with climate change in freshwater marshes of Northeast China. Wetlands 2019, 39, 429–439. [Google Scholar] [CrossRef]
- Gao, J.; Jiao, K.; Wu, S. Investigating the spatially heterogeneous relationships between climate factors and NDVI in China during 1982 to 2013. J. Geogr. Sci. 2019, 29, 1597–1609. [Google Scholar] [CrossRef]
- Fitzpatrick, M.C.; Gove, A.D.; Sanders, N.J.; Dunn, R.R. Climate change, plant migration, and range collapse in a global biodiversity hotspot: The Banksia (Proteaceae) of Western Australia. Glob. Chang Biol. 2008, 14, 1337–1352. [Google Scholar] [CrossRef]
- Piao, S.; Liu, Q.; Chen, A.; Janssens, I.A.; Fu, Y.; Dai, J.; Liu, L.; Lian, X.; Shen, M.; Zhu, X. Plant phenology and global climate change: Current progresses and challenges. Glob. Chang. Biol. 2019, 25, 1922–1940. [Google Scholar] [CrossRef]
- Hoffmann, W.A.; Jackson, R.B. Vegetation–climate feedbacks in the conversion of tropical savanna to grassland. J. Clim. 2000, 13, 1593–1602. [Google Scholar] [CrossRef]
- Crookston, N.L.; Rehfeldt, G.E.; Dixon, G.E.; Weiskittel, A.R. Addressing climate change in the forest vegetation simulator to assess impacts on landscape forest dynamics. For. Ecol. Manag. 2010, 260, 1198–1211. [Google Scholar] [CrossRef]
- Wan, J.Z.; Wang, C.J.; Qu, H.; Liu, R.; Zhang, Z.X. Vulnerability of forest vegetation to anthropogenic climate change in China. Sci. Total Environ. 2018, 621, 1633–1641. [Google Scholar] [CrossRef]
- Zarei, A.; Asadi, E.; Ebrahimi, A.; Jafari, M.; Malekian, A.; Nasrabadi, H.M.; Chemura, A.; Maskell, G. Prediction of future grassland vegetation cover fluctuation under climate change scenarios. Ecol. Indic. 2020, 119, 106858. [Google Scholar] [CrossRef]
- Wang, Y.; Shen, X.; Jiang, M.; Lu, X. Vegetation change and its response to climate change between 2000 and 2016 in marshes of the Songnen Plain, Northeast China. Sustainability 2020, 12, 3569. [Google Scholar] [CrossRef]
- Aukes, P.J.; Schiff, S.L.; Venkiteswaran, J.J.; Elgood, R.J.; Spoelstra, J. Size-based characterization of freshwater dissolved organic matter finds similarities within a waterbody type across different Canadian ecozones. Limnol. Oceanogr. Lett. 2021, 6, 85–95. [Google Scholar] [CrossRef]
- Hu, Z.; Borsje, B.W.; van Belzen, J.; Willemsen, P.W.; Wang, H.; Peng, Y.; Yuan, L.; Dominicis, M.D.; Wolf, J.; Temmerman, S.; et al. Mechanistic modeling of marsh seedling establishment provides a positive outlook for coastal wetland restoration under global climate change. Geophys. Res. Lett. 2021, 48, e2021GL095596. [Google Scholar] [CrossRef]
- Luk, S.Y.; Todd-Brown, K.; Eagle, M.; McNichol, A.P.; Sanderman, J.; Gosselin, K.; Spivak, A.C. Soil organic carbon development and turnover in natural and disturbed salt marsh environments. Geophys. Res. Lett. 2021, 48, e2020GL090287. [Google Scholar] [CrossRef]
- Mobilian, C.; Wisnoski, N.I.; Lennon, J.T.; Alber, M.; Widney, S.; Craft, C.B. Differential effects of press vs.pulse seawater intrusion on microbial communities of a tidal freshwater marsh. Limnol. Oceanogr. Lett. 2020. [Google Scholar] [CrossRef]
- Rietl, A.; Megonigal, J.; Herbert, E.; Kirwan, M. Vegetation type and decomposition priming mediate brackish marsh carbon accumulation under interacting facets of global change. Geophys. Res. Lett. 2021, 48, e2020GL092051. [Google Scholar] [CrossRef]
- Saderne, V.; Fusi, M.; Thomson, T.; Dunne, A.; Mahmud, F.; Roth, F.; Carvalho, S.; Duarte, C.M. Total alkalinity production in a mangrove ecosystem reveals an overlooked Blue Carbon component. Limnol. Oceanogr. Lett. 2021, 6, 61–67. [Google Scholar] [CrossRef]
- Schutte, C.A.; Moore, W.S.; Wilson, A.M.; Joye, S.B. Groundwater-driven methane export reduces salt marsh blue carbon potential. Glob. Biogeochem. Cycles 2020, 34, e2020GB006587. [Google Scholar] [CrossRef]
- Smith, A.J.; Kirwan, M.L. Sea level/10.1029/2020GBigration results in rapid net loss of carbon. Geophys. Res. Lett. 2021, 48, e2021GL092420. [Google Scholar] [CrossRef]
- Vaughn, D.R.; Bianchi, T.S.; Shields, M.R.; Kenney, W.F.; Osborne, T.Z. Increased organic carbon burial in northern Florida mangrove-salt marsh transition zones. Glob. Biogeochem. Cycles 2020, 34, e2019GB006334. [Google Scholar] [CrossRef]
- Volta, C.; Ho, D.T.; Maher, D.T.; Wanninkhof, R.; Friederich, G.; Del Castillo, C.; Dulai, H. Seasonal variations in dissolved carbon inventory and fluxes in a mangrove-dominated estuary. Glob. Biogeochem. Cycles 2020, 34, e2019GB006515. [Google Scholar] [CrossRef]
- Shen, X.; Liu, B.; Jiang, M.; Lu, X. Marshland loss warms local land surface temperature in China. Geophys. Res. Lett. 2020, 47, e2020GL087648. [Google Scholar] [CrossRef]
- Bai, Y.; Jiang, B.; Wang, M.; Li, H.; Alatalo, J.M.; Huang, S. New ecological redline policy (ERP) to secure ecosystem services in China. Land Use Policy 2016, 55, 348–351. [Google Scholar] [CrossRef]
- Gu, Y.; Pan, Y.; Chen, F.; Lou, Y.; Tang, Z. Effects of water level and nitrogen concentration on growth and biomass allocation of Scirpusnipponicus seedlings. Chin. J. Ecol. 2019, 38, 2302–2309. (In Chinese) [Google Scholar] [CrossRef]
- Bai, J.; Chen, F.; Tang, H.; Lou, Y. Effects of simulated water depth and nitrogen addition on functional traits of wetland plants in the Sanjiang Plain. Chin. J. Appl. Environ. Biol. 2021, 27, 38–45. (In Chinese) [Google Scholar] [CrossRef]
- Liu, Y.; Shen, X.; Wang, Y.; Zhang, J.; Ma, R.; Lu, X.; Jiang, M. Spatiotemporal variation in aboveground biomass and its response to climate change in the marsh of Sanjiang Plain. Front. Plant Sci. 2022, 13, 1973. [Google Scholar] [CrossRef]
- Chuai, X.W.; Huang, X.J.; Wang, W.J.; Bao, G. NDVI, temperature and precipitation changes and their relationships with different vegetation types during 1998–2007 in Inner Mongolia, China. Int. J. Climatol. 2013, 33, 1696–1706. [Google Scholar] [CrossRef]
- Shen, X.; Liu, Y.; Zhang, J.; Wang, Y.; Ma, R.; Liu, B.; Lu, X.; Jiang, M. Asymmetric impacts of diurnal warming on vegetation carbon sequestration of marshes in the Qinghai Tibet Plateau. Glob. Biogeochem. Cycles 2022, 36, e2022GB007396. [Google Scholar] [CrossRef]
- Wang, Y.; Shen, X.; Jiang, M.; Tong, S.; Lu, X. Daytime and nighttime temperatures exert different effects on vegetation net primary productivity of marshes in the western Songnen Plain. Ecol. Indic. 2022, 137, 108789. [Google Scholar] [CrossRef]
- Song, K.; Wang, Z.; Du, J.; Liu, L.; Zeng, L.; Ren, C. Wetland degradation: Its driving forces and environmental impacts in the Sanjiang Plain, China. Environ. Manag. 2014, 54, 255–271. [Google Scholar] [CrossRef]
- Wang, Z.; Song, K.; Ma, W.; Ren, C.; Zhang, B.; Liu, D.; Chen, J.; Song, C. Loss and fragmentation of marshes in the Sanjiang Plain, Northeast China, 1954–2005. Wetlands 2011, 31, 945–954. [Google Scholar] [CrossRef]
- Li, H.; Qu, Y.; Zeng, X.; Zhang, H.; Cui, L.; Luo, C. Dynamic response of the vegetation carbon storage in the Sanjiang Plain to changes in land use/cover and climate. Herit. Sci. 2021, 9, 134. [Google Scholar] [CrossRef]
- Fu, J.; Liu, J.; Wang, X.; Zhang, M.; Chen, W.; Chen, B. Ecological risk assessment of wetland vegetation under projected climate scenarios in the Sanjiang Plain, China. J. Environ. Manag. 2020, 273, 111108. [Google Scholar] [CrossRef]
- Zhang, Z.; Liu, K.B.; Bianchette, T.A.; Wang, G. The mid-Holocene decline of the East Asian summer monsoon indicated by a lake-to-wetland transition in the Sanjiang Plain, Northeast China. Holocene 2018, 28, 246–253. [Google Scholar] [CrossRef]
- Mao, D.; Wang, Z.; Du, B.; Li, L.; Tian, Y.; Jia, M.; Zeng, Y.; Song, K.; Jiang, M.; Wang, Y. National wetland mapping in China: A new product resulting from object-based and hierarchical classification of Landsat 8 OLI images. ISPRS J. Photogramm. Remote Sens. 2020, 164, 11–25. [Google Scholar] [CrossRef]
- Wang, Z.; Mao, D.; Li, L.; Jia, M.; Dong, Z.; Miao, Z.; Ren, C.; Song, C. Quantifying changes in multiple ecosystem services during 1992–2012 in the Sanjiang Plain of China. Sci. Total Environ. 2015, 514, 119–130. [Google Scholar] [CrossRef] [PubMed]
- Mao, D.; He, X.; Wang, Z.; Tian, Y.; Xiang, H.; Yu, H.; Man, W.; Jia, M.; Ren, C.; Zheng, H. Diverse policies leading to contrasting impacts on land cover and ecosystem services in Northeast China. J. Clean. Prod. 2019, 240, 117961. [Google Scholar] [CrossRef]
- Shen, X.; Liu, B.; Li, G.; Wu, Z.; Jin, Y.; Yu, P.; Zhou, D. Spatiotemporal change of diurnal temperature range and its relationship with sunshine duration and precipitation in China. J. Geophys. Res. Atmos. 2014, 119, 13163–13179. [Google Scholar] [CrossRef]
- Shen, X.; Liu, B.; Lu, X. Weak cooling of cold extremes versus continued warming of hot extremes in China during the recent global surface warming hiatus. J. Geophys. Res. Atmos. 2018, 123, 4073–4087. [Google Scholar] [CrossRef]
- Holben, B.N. Characteristics of maximum-value composite images from temporal AVHRR data. Int. J. Remote Sens. 1986, 7, 1417–1434. [Google Scholar] [CrossRef]
- Shen, X.; Liu, B.; Jiang, M.; Wang, Y.; Wang, L.; Zhang, J.; Lu, X. Spatiotemporal change of marsh vegetation and its response to climate change in China from 2000 to 2019. J. Geophys. Res. Biogeosciences 2021, 126, e2020JG006154. [Google Scholar] [CrossRef]
- Sun, L.; Song, C. Evapotranspiration from a freshwater marsh in the Sanjiang Plain, Northeast China. J. Hydrol. 2008, 352, 202–210. [Google Scholar] [CrossRef]
- Song, C.; Xu, X.; Tian, H.; Wang, Y. Ecosystem–atmosphere exchange of CH4 and N2O and ecosystem respiration in wetlands in the Sanjiang Plain, Northeastern China. Glob. Chang. Biol. 2009, 15, 692–705. [Google Scholar] [CrossRef]
- Mann, H.B. Nonparametric tests against trend. Econom. J. Econom. Soc. 1945, 13, 245–259. [Google Scholar] [CrossRef]
- Kendall, M.G. Rank Correlation Measures; Charles Griffin: London, UK, 1975. [Google Scholar]
- Ma, R.; Shen, X.; Zhang, J.; Xia, C.; Liu, Y.; Wu, L.; Wang, Y.; Jiang, M.; Lu, X. Variation of vegetation autumn phenology and its climatic drivers in temperate grasslands of China. Int. J. Appl. Earth Obs. Geoinf. 2022, 114, 103064. [Google Scholar] [CrossRef]
- Du, J.; Fang, S.; Sheng, Z.; Wu, J.; Quan, Z.; Fu, Q. Variations in vegetation dynamics and its cause in national key ecological function zones in China. Environ. Sci. Pollut. Res. 2020, 27, 30145–30161. [Google Scholar] [CrossRef]
- Zhang, J.; Zhang, B.; Ma, B.; Cao, B.; Liang, J.; Ma, S. Spatial-temporal variation of NDVI in the Sanjiang Plain and its response to climate change. J. Desert Res. 2019, 39, 206–213. (In Chinese) [Google Scholar] [CrossRef]
- O’Sullivan, M.; Smith, W.K.; Sitch, S.; Friedlingstein, P.; Arora, V.K.; Haverd, V.; Jain, A.K.; Kato, E.; Kautz, M.; Lombardozzi, D.; et al. Climate-driven variability and trends in plant productivity over recent decades based on three global products. Glob. Biogeochem. Cycles 2020, 34, e2020GB006613. [Google Scholar] [CrossRef]
- Regier, P.; Larsen, L.; Cawley, K.; Jaffé, R. Linking hydrology and dissolved organic matter characteristics in a subtropical wetland: A long-term study of the Florida Everglades. Glob. Biogeochem. Cycles 2020, 34, e2020GB006648. [Google Scholar] [CrossRef]
- Pasut, C.; Tang, F.H.; Hamilton, D.; Riley, W.J.; Maggi, F. Spatiotemporal assessment of GHG emissions and nutrient sequestration linked to agronutrient runoff in global wetlands. Glob. Biogeochem. Cycles 2021, 35, e2020GB006816. [Google Scholar] [CrossRef]
- Zhu, X.; Song, C.; Guo, Y.; Sun, X.; Zhang, X.; Miao, Y. Methane emissions from temperate herbaceous peatland in the Sanjiang Plain of Northeast China. Atmos. Environ. 2014, 92, 478–483. [Google Scholar] [CrossRef]
- Salvucci, M.E.; Crafts-Brandner, S.J. Inhibition of photosynthesis by heat stress: The activation state of Rubisco as a limiting factor in photosynthesis. Physiol. Plant. 2004, 120, 179–186. [Google Scholar] [CrossRef]
- Wan, S.; Xia, J.; Liu, W.; Niu, S. Photosynthetic overcompensation under nocturnal warming enhances grassland carbon sequestration. Ecology 2009, 90, 2700–2710. [Google Scholar] [CrossRef]
- Belsky, A.J. Does herbivory benefit plants? A review of the evidence. Am. Nat. 1986, 127, 870–892. [Google Scholar] [CrossRef]
- Belsky, A.J.; Carson, W.P.; Jensen, C.L.; Fox, G.A. Overcompensation by plants: Herbivore optimization or red herring? Evol. Ecol. 1993, 7, 109–121. [Google Scholar] [CrossRef]
- Song, C.; Yan, B.; Wang, Y.; Wang, Y.; Lou, Y.; Zhao, Z. Fluxes of carbon dioxide and methane from swamp and impact factors in the Sanjiang Plain, China. Chinese. Sci. Bull. 2003, 48, 2749–2753. [Google Scholar] [CrossRef]
- Birkett, C.; Murtugudde, R.; Allan, T. Indian Ocean climate event brings floods to East Africa’s lakes and the Sudd Marsh. Geophys. Res. Lett. 1999, 26, 1031–1034. [Google Scholar] [CrossRef]
- Kunkel, K.E. North American trends in extreme precipitation. Nat. Hazards. 2003, 29, 291–305. [Google Scholar] [CrossRef]
- Song, C.; Sun, L.; Huang, Y.; Wang, Y.; Wan, Z. Carbon exchange in a freshwater marsh in the Sanjiang Plain, northeastern China. Agric. For. Meteorol. 2011, 151, 1131–1138. [Google Scholar] [CrossRef]


Publisher’s Note: MDPI stays neutral with regard to jurisdictional claims in published maps and institutional affiliations. |
© 2022 by the authors. Licensee MDPI, Basel, Switzerland. This article is an open access article distributed under the terms and conditions of the Creative Commons Attribution (CC BY) license (https://creativecommons.org/licenses/by/4.0/).