
The Use of Basal Area Increment to Preserve the Multi-Decadal Climatic Signal in Shrub Growth Ring Chronologies: A Case Study of Betula glandulosa in a Rapidly Warming Environment
 , and
, and
Abstract
:1. Introduction
2. Materials and Methods
2.1. Study Area
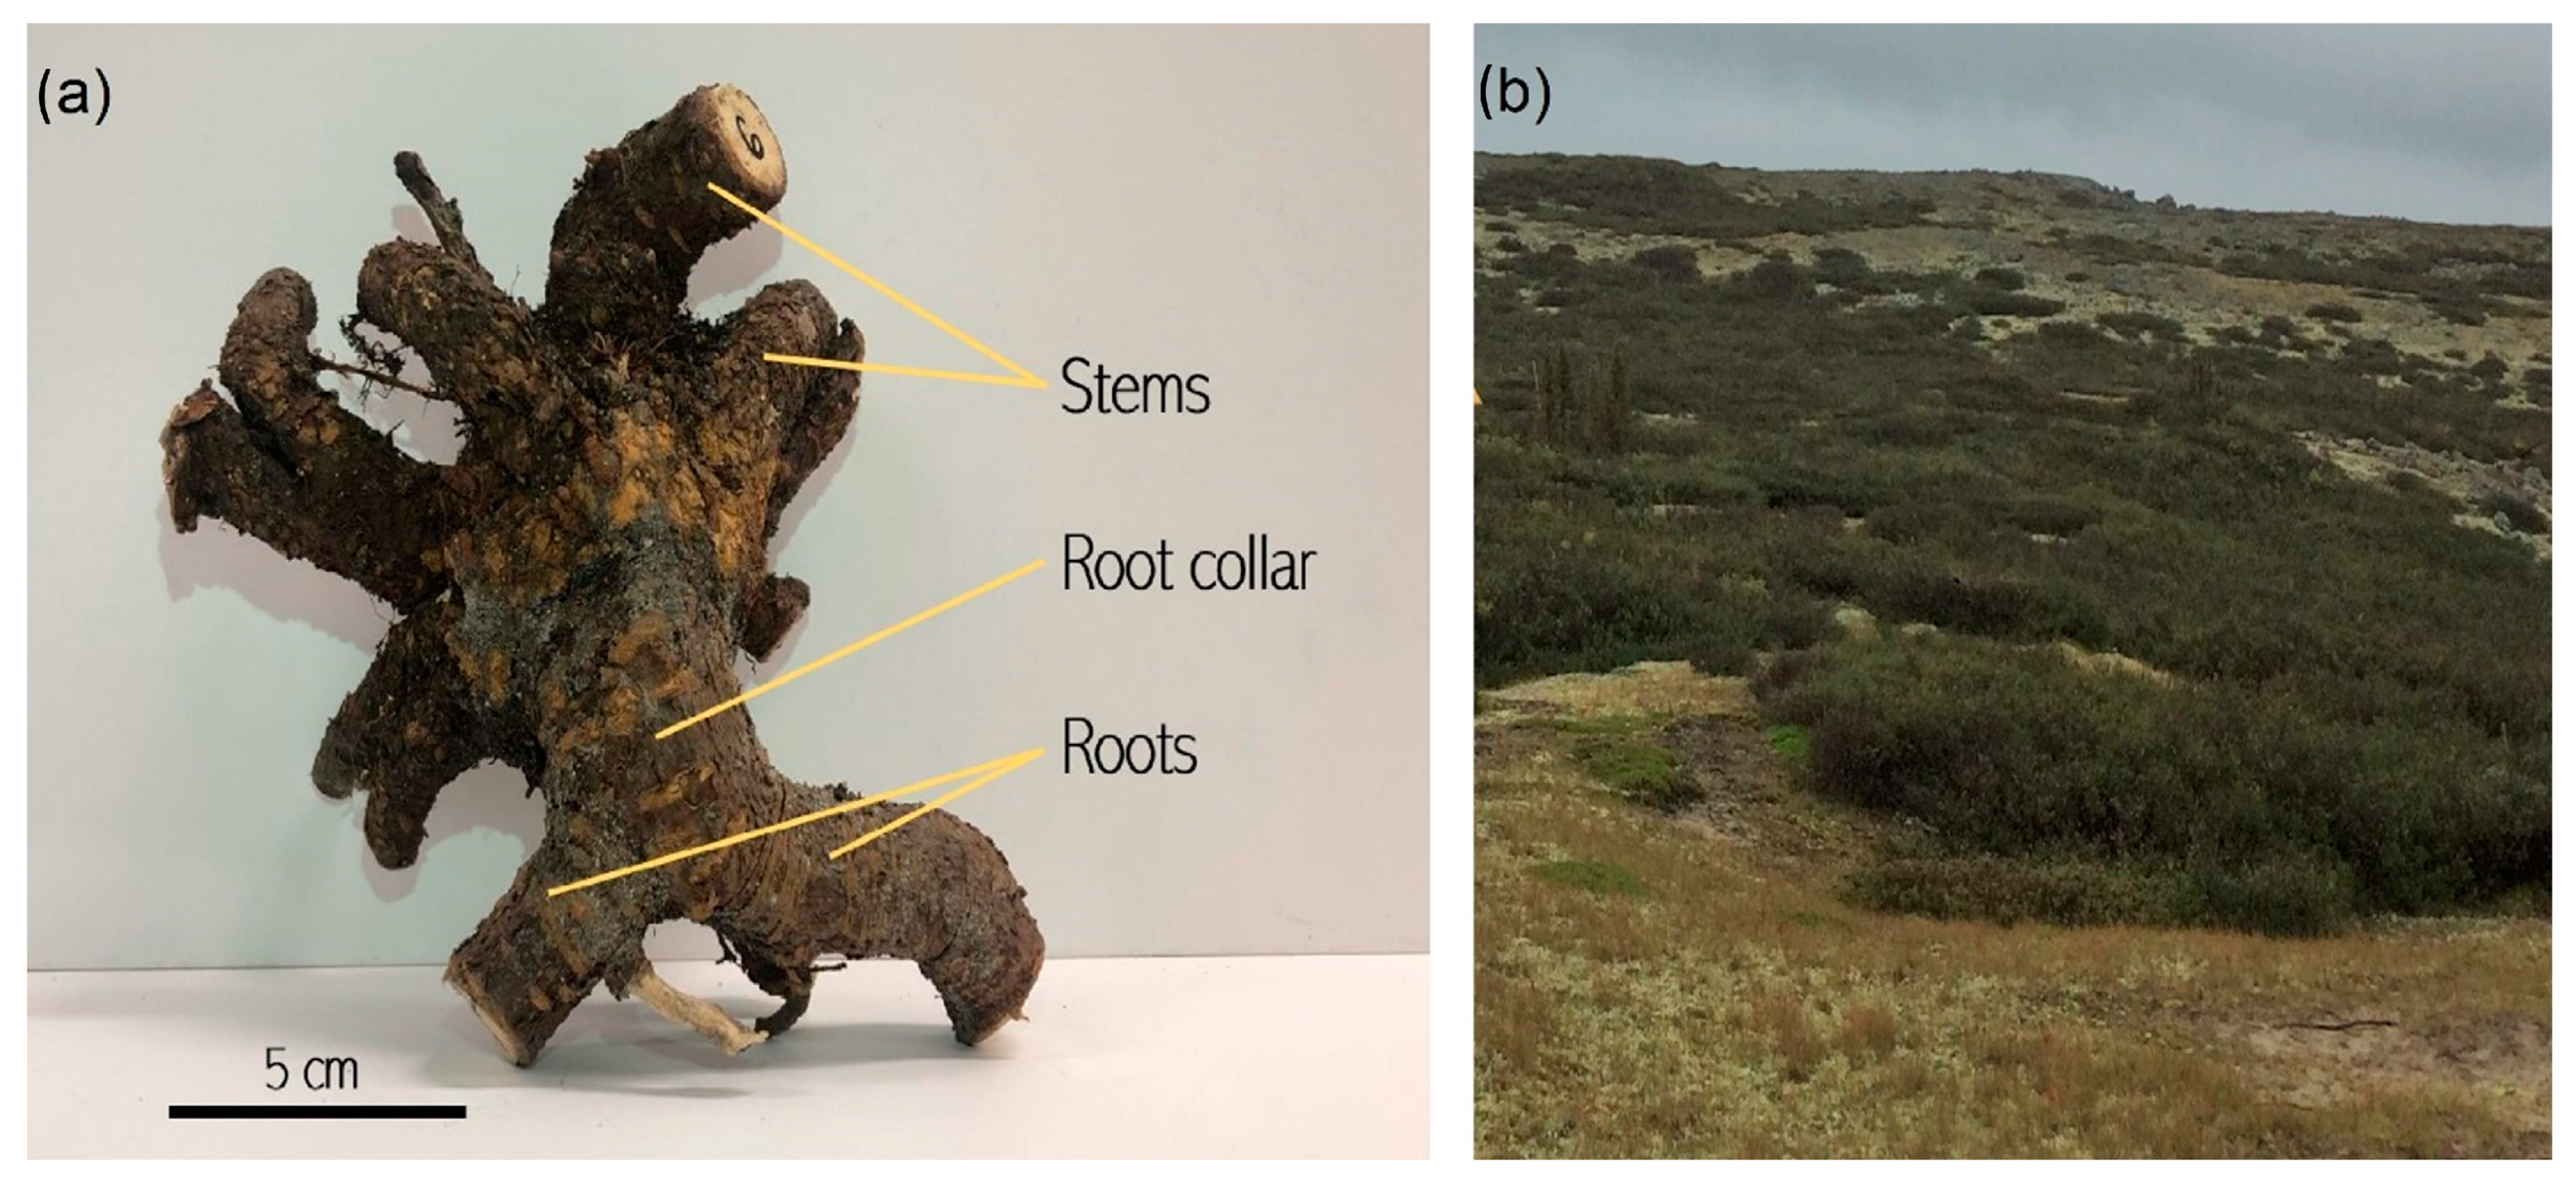
2.2. Field Sampling
2.3. Dendrochronological Analysis
2.4. Statistical Analyses
3. Results
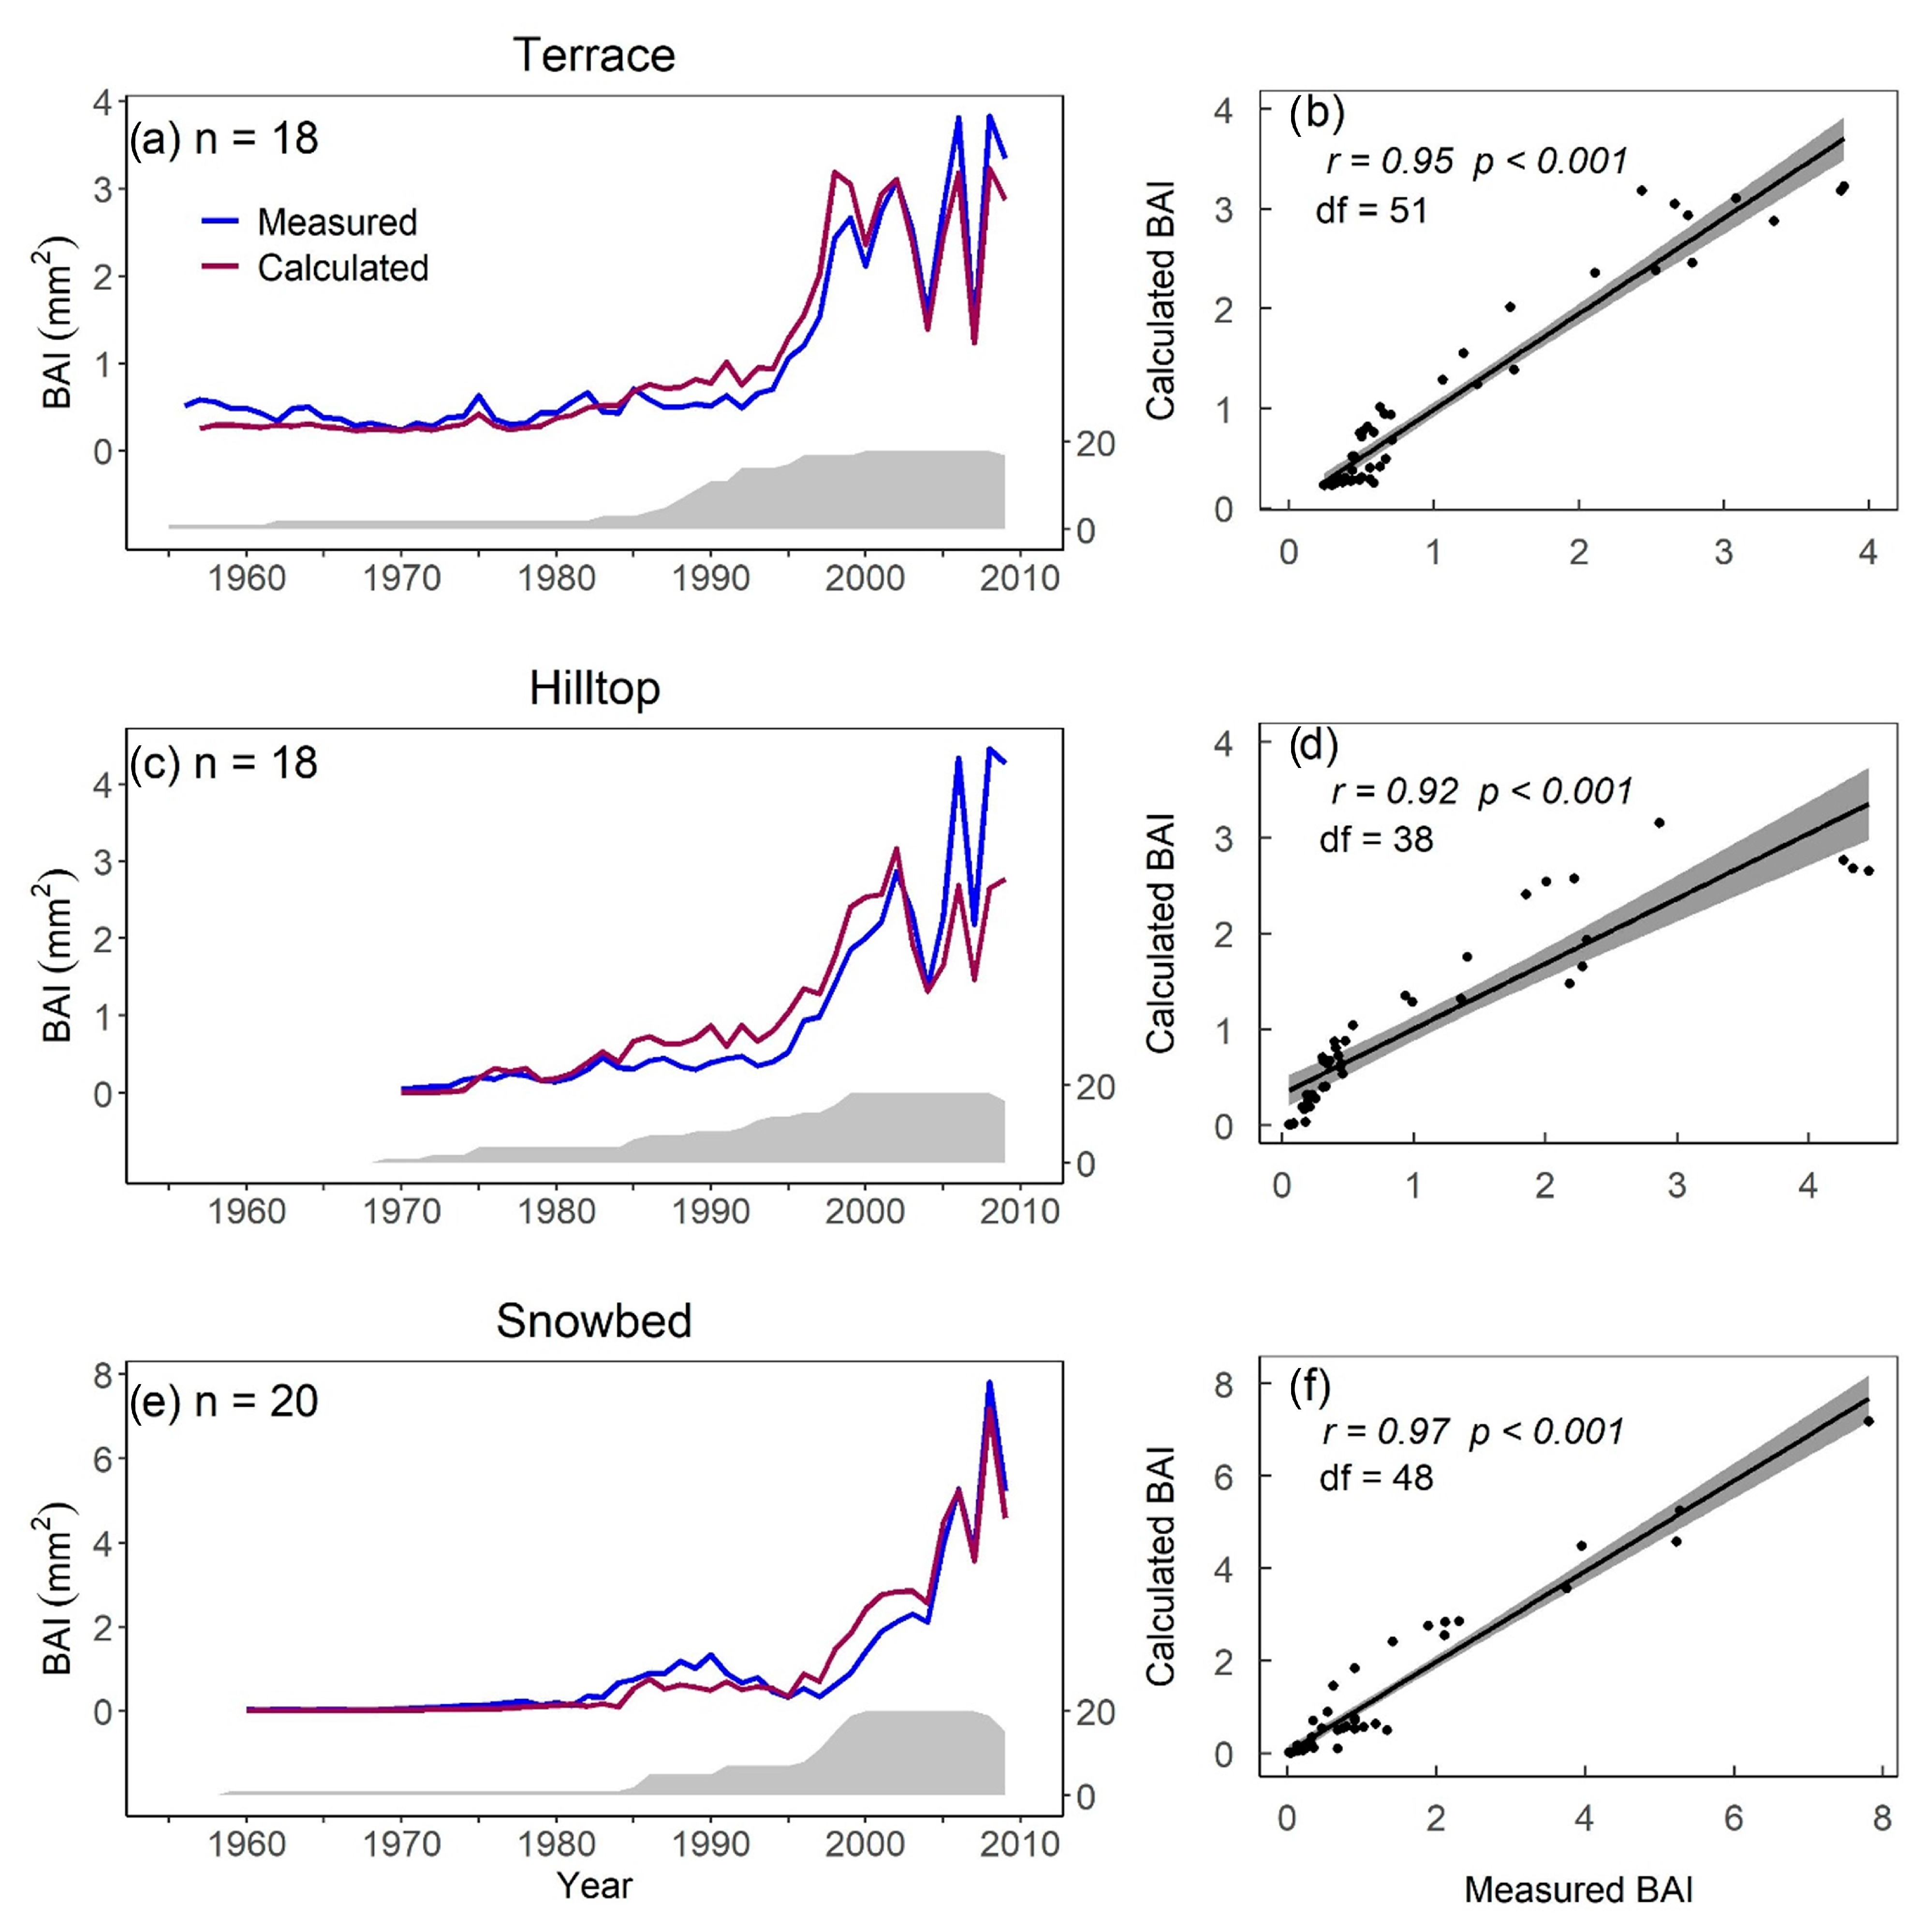
3.1. Growth Chronologies
3.2. Climatic Drivers and Sensitivity to Climate
4. Discussion
4.1. Growth Chronologies
4.1.1. Calculated vs. Measured BAI
4.1.2. BAI Conversion as a Detrending Method for Shrub Chronologies
4.2. Climatic Drivers and Sensitivity to Climate: The Influence of BAI
5. Conclusions
Supplementary Materials
Author Contributions
Funding
Institutional Review Board Statement
Informed Consent Statement
Data Availability Statement
Acknowledgments
Conflicts of Interest
References
- Chapin, F.S. Direct and Indirect Effects of Temperature on Arctic Plants. Polar Biol. 1983, 2, 47–52. [Google Scholar] [CrossRef]
- Jia, G.J.; Epstein, H.E.; Walker, D.A. Vegetation Greening in the Canadian Arctic Related to Decadal Warming. J. Environ. Monit. 2009, 11, 2231–2238. [Google Scholar] [CrossRef] [PubMed]
- Vicente-Serrano, S.M.; Martín-Hernández, N.; Camarero, J.J.; Gazol, A.; Sánchez-Salguero, R.; Peña-Gallardo, M.; El Kenawy, A.; Domínguez-Castro, F.; Tomas-Burguera, M.; Gutiérrez, E.; et al. Linking Tree-Ring Growth and Satellite-Derived Gross Primary Growth in Multiple Forest Biomes. Temporal-Scale Matters. Ecol. Indic. 2020, 108, 105753. [Google Scholar] [CrossRef]
- Taiz, L.; Zieger, E.; Moller, I.M.; Murphy, A. Plant Physiology and Development, 6th ed.; Sinauer Associates: Sunderland, CT, USA, 2015; 761p. [Google Scholar]
- Aerts, R.; Cornelissen, J.H.C.; Dorrepaal, E. Plant Performance in a Warmer World: General Responses of Plants from Cold, Northern Biomes and the Importance of Winter and Spring Events. Plant Ecol. 2006, 182, 65–77. [Google Scholar] [CrossRef]
- Meunier, C.; Sirois, L.; Bégin, Y. Climate and Picea Mariana Seed Maturation Relationships: A Multi-Scale Perspective. Ecol. Monogr. 2007, 77, 361–376. [Google Scholar] [CrossRef]
- Sirois, L.; Bégin, Y.; Parent, J. Female Gametophyte and Embryo Development of Black Spruce along a Shore-Hinterland Climatic Gradient of a Recently Created Reservoir, Northern Quebec. Can. J. Bot. 1999, 77, 61–69. [Google Scholar] [CrossRef]
- Bush, E.; Lemmen, D.S. Canada’s Changing Climate Report; Gouvernement du Canada: Ottawa, ON, Canada, 2019; 446p. [Google Scholar]
- Menzel, A.; Jakobi, G.; Ahas, R.; Scheifinger, H.; Estrella, N. Variations of the Climatological Growing Season (1951–2000) in Germany Compared with Other Countries. Int. J. Climatol. 2003, 23, 793–812. [Google Scholar] [CrossRef]
- Zeng, H.; Jia, G.J.; Epstein, H. Recent Changes in Phenology over the Northern High Latitudes Detected from Multi-Satellite Data. Environ. Res. Lett. 2011, 6, 045508. [Google Scholar] [CrossRef]
- Charron, I. Élaboration Du Portrait Climatique Régional Du Nunavik; Ouranos: Montréal, QC, Canada, 2015; 86p. [Google Scholar]
- Baird, R.A.; Verbyla, D.; Hollingsworth, T.N. Browning of the Landscape of Interior Alaska Based on 1986–2009 Landsat Sensor NDVI. Can. J. For. Res. 2012, 42, 1371–1382. [Google Scholar] [CrossRef]
- Verbyla, D. The Greening and Browning of Alaska Based on 1982-2003 Satellite Data. Glob. Ecol. Biogeogr. 2008, 17, 547–555. [Google Scholar] [CrossRef]
- Wang, J.A.; Friedl, M.A. The Role of Land Cover Change in Arctic-Boreal Greening and Browning Trends. Environ. Res. Lett. 2019, 14, 125007. [Google Scholar] [CrossRef]
- Bunn, A.G.; Goetz, S.J.; Kimball, J.S.; Zhang, K. Northern High-Latitude Ecosystems Respond to Climate Change. Eos (Washington DC) 2007, 88, 333–335. [Google Scholar] [CrossRef]
- Ju, J.; Masek, J.G. The Vegetation Greenness Trend in Canada and US Alaska from 1984–2012 Landsat Data. Remote Sens. Environ. 2016, 176, 1–16. [Google Scholar] [CrossRef]
- Tape, K.; Sturm, M.; Racine, C. The Evidence for Shrub Expansion in Northern Alaska and the Pan-Arctic. Glob. Change Biol. 2006, 12, 686–702. [Google Scholar] [CrossRef]
- Lemay, M.A.; Provencher-Nolet, L.; Bernier, M.; Lévesque, E.; Boudreau, S. Spatially Explicit Modeling and Prediction of Shrub Cover Increase near Umiujaq, Nunavik. Ecol. Monogr. 2018, 88, 385–407. [Google Scholar] [CrossRef]
- Myers-Smith, I.; Forbes, B.C.; Wilmking, M.; Hallinger, M.; Lantz, T.; Blok, D.; Tape, K.D.; MacIas-Fauria, M.; Sass-Klaassen, U.; Lévesque, E.; et al. Shrub Expansion in Tundra Ecosystems: Dynamics, Impacts and Research Priorities. Environ. Res. Lett. 2011, 6, 045509. [Google Scholar] [CrossRef]
- Ropars, P.; Boudreau, S. Shrub Expansion at the Forest-Tundra Ecotone: Spatial Heterogeneity Linked to Local Topography. Environ. Res. Lett. 2012, 7, 015501. [Google Scholar] [CrossRef]
- Shen, X.; Liu, Y.; Liu, B.; Zhang, J.; Wang, L.; Lu, X.; Jiang, M. Effect of Shrub Encroachment on Land Surface Temperature in Semi-Arid Areas of Temperate Regions of the Northern Hemisphere. Agric. For. Meteorol. 2022, 320, 108943. [Google Scholar] [CrossRef]
- Buras, A.; Wilmking, M. Straight Lines or Eccentric Eggs? A Comparison of Radial and Spatial Ring Width Measurements and Its Implications for Climate Transfer Functions. Dendrochronologia 2014, 32, 313–326. [Google Scholar] [CrossRef]
- Lu, X.; Huang, R.; Wang, Y.; Sigdel, S.R.; Dawadi, B.; Liang, E.; Camarero, J.J. Summer Temperature Drives Radial Growth of Alpine Shrub Willows on the Northeastern Tibetan Plateau. Arctic Antarct. Alp. Res. 2016, 48, 461–468. [Google Scholar] [CrossRef] [Green Version]
- Bär, A.; Pape, R.; Bräuning, A.; Löffler, J. Growth-Ring Variations of Dwarf Shrubs Reflect Regional Climate Signals in Alpine Environments Rather than Topoclimatic Differences. J. Biogeogr. 2008, 35, 625–636. [Google Scholar] [CrossRef]
- Hallinger, M.; Manthey, M.; Wilmking, M. Establishing a Missing Link: Warm Summers and Winter Snow Cover Promote Shrub Expansion into Alpine Tundra in Scandinavia. New Phytol. 2010, 186, 890–899. [Google Scholar] [CrossRef]
- Uyeda, K.A.; Stow, D.A.; O’Leary, J.F.; Tague, C.; Riggan, P.J. Chaparral Growth-Ring Analysis as an Indicator of Stand Biomass Development. Int. J. Wildl. Fire 2016, 25, 1086–1092. [Google Scholar] [CrossRef]
- Weijers, S.; Pape, R.; Löffler, J.; Myers-Smith, I. Contrasting Shrub Species Respond to Early Summer Temperatures Leading to Correspondence of Shrub Growth Patterns. Environ. Res. Lett. 2018, 13, 034005. [Google Scholar] [CrossRef]
- Ropars, P.; Angers-Blondin, S.; Gagnon, M.; Myers-Smith, I.; Lévesque, E.; Boudreau, S. Different Parts, Different Stories: Climate Sensitivity of Growth Is Stronger in Root Collars vs. Stems in Tundra Shrubs. Glob. Change Biol. 2017, 23, 3281–3291. [Google Scholar] [CrossRef]
- Cook, E.; Briffa, K.; Shiyatov, S.; Mazepa, V. Chapter 3.3: Tree-ring standardization and growth-trend estimation. In Methods of Dendrochronology: Applications in the Environmental Sciences; Springer Science+Business Media: Berlin, Germany, 1990; pp. 104–123. 394p. [Google Scholar]
- Briffa, K.R.; Melvin, T.M. A closer look at regional curve standardization of tree-ring records: Justification of the need, a warning of some pitfalls, and suggested improvements in its application. In Dendroclimatology: Progress and Prospects; Springer: Berlin, Germany, 2011; pp. 113–145. 368p. [Google Scholar]
- Dietrich, R.; Anand, M. Trees Do Not Always Act Their Age: Size-Deterministic Tree Ring Standardization for Long-Term Trend Estimation in Shade-Tolerant Trees. Biogeosciences 2019, 16, 4815–4827. [Google Scholar] [CrossRef]
- Peters, R.L.; Groenendijk, P.; Vlam, M.; Zuidema, P.A. Detecting Long-Term Growth Trends Using Tree Rings: A Critical Evaluation of Methods. Glob. Change Biol. 2015, 21, 2040–2054. [Google Scholar] [CrossRef]
- Hornbeck, J.W.; Smith, R.B. Documentation of Red Spruce Growth Decline. Can. J. For. Res. 1985, 15, 1199–1201. [Google Scholar] [CrossRef]
- Phipps, R.L. Ring-Width Analysis. In Air Pollution and the Productivity of the Forest; Izaak Walton League: Washington, DC, USA, 1984; pp. 225–271. [Google Scholar]
- Boakye, E.A.; Houle, D.; Bergeron, Y.; Girardin, M.P.; Drobyshev, I. Insect Defoliation Modulates Influence of Climate on the Growth of Tree Species in the Boreal Mixed Forests of Eastern Canada. Ecol. Evol. 2022, 12, e8656. [Google Scholar] [CrossRef] [PubMed]
- Hornbeck, J.W.; Smith, R.B.; Federer, C.A. Growth Decline in Red Spruce and Balsam Fir Relative to Natural Processes. Water Air Soil Pollut. 1986, 31, 425–430. [Google Scholar] [CrossRef]
- Linares, J.C.; Delgado-Huertas, A.; Camarero, J.J.; Merino, J.; Carreira, J.A. Competition and Drought Limit the Response of Water-Use Efficiency to Rising Atmospheric Carbon Dioxide in the Mediterranean Fir Abies Pinsapo. Oecologia 2009, 161, 611–624. [Google Scholar] [CrossRef] [PubMed]
- Sullivan, P.F.; Pattison, R.R.; Brownlee, A.H.; Cahoon, S.M.P.; Hollingsworth, T.N. Effect of Tree-Ring Detrending Method on Apparent Growth Trends of Black and White Spruce in Interior Alaska. Environ. Res. Lett. 2016, 11, 114007. [Google Scholar] [CrossRef]
- LeBlanc, D.C. Using Tree Rings to Study Forest Decline: An Epidemiological Approach Based on Estimated Annual Wood Volume Increment. In Proceedings of the Tree Rings, Environment and Humanity, Tucson, AZ, USA, 17–21 May 1994; pp. 437–449. [Google Scholar]
- Baral, S.; Gaire, N.P.; Aryal, S.; Pandey, M.; Rayamajhi, S.; Vacik, H. Growth Ring Measurements of Shorea Robusta Reveal Responses to Climatic Variation. Forests 2019, 10, 466. [Google Scholar] [CrossRef]
- Bär, A.; Bräuning, A.; Löffler, J. Dendroecology of Dwarf Shrubs in the High Mountains of Norway—A Methodological Approach. Dendrochronologia 2006, 24, 17–27. [Google Scholar] [CrossRef]
- Buchkowski, R.W.; Morris, D.W.; Halliday, W.D.; Dupuch, A.; Morrissette-Boileau, C.; Boudreau, S. Warmer Temperatures Promote Shrub Radial Growth but Not Cover in the Central Canadian Arctic. Arctic Antarct. Alp. Res. 2020, 52, 582–595. [Google Scholar] [CrossRef]
- Le Moullec, M.; Sandal, L.; Grøtan, V.; Buchwal, A.; Hansen, B.B. Climate Synchronises Shrub Growth across a High-Arctic Archipelago: Contrasting Implications of Summer and Winter Warming. Oikos 2020, 129, 1012–1027. [Google Scholar] [CrossRef]
- Ropars, P.; Lévesque, E.; Boudreau, S. How Do Climate and Topography Influence the Greening of the Forest-Tundra Ecotone in Northern Québec? A Dendrochronological Analysis of Betula Glandulosa. J. Ecol. 2015, 103, 679–690. [Google Scholar] [CrossRef]
- Payette, S.; Filion, L.; Delwaide, A. Spatially Explicit Fire-Climate History of the Boreal Forest-Tundra (Eastern Canada) over the Last 2000 Years. Philos. Trans. R. Soc. B Biol. Sci. 2008, 363, 2301–2316. [Google Scholar] [CrossRef]
- Dufour-Tremblay, G.; Boudreau, S. Black Spruce Regeneration at the Treeline Ecotone: Synergistic Impacts of Climate Change and Caribou Activity. Can. J. For. Res. 2011, 41, 460–468. [Google Scholar] [CrossRef]
- Environment Canada Inukjuak Station Monthly Data Report. Available online: https://climat.meteo.gc.ca/climate_data/monthly_data_f.html (accessed on 6 March 2020).
- Payette, S.; Boudreau, F.; Gagnon, R. Gélifluxion Néoglaciaire Dans Une Combe à Neige à La Limite Des Arbres, Québec Nordique. Géographie Pysique Quat. 1985, 39, 91–97. [Google Scholar] [CrossRef] [Green Version]
- Holmes, R. Computer-Assisted Quality Control in Tree-Ring Dating and Measurement. Tree-ring Bull. 1983, 43, 69–78. [Google Scholar]
- Bunn, A.; Korpela, M.; Franco, B.; Campelo, F.; Mérian, P.; Qeadan, F.; Zang, C. DplR: Dendrochronology Program Library in R. Available online: https://cran.r-project.org/package=dplR (accessed on 10 April 2021).
- R Core Team R: A Language and Environment for Statistical Computing. Available online: https://www.r-project.org/ (accessed on 3 December 2020).
- Myers-Smith, I.; Elmendorf, S.C.; Beck, P.S.A.; Wilmking, M.; Hallinger, M.; Blok, D.; Tape, K.D.; Rayback, S.A.; Macias-fauria, M.; Forbes, B.C.; et al. Climate Sensitivity of Shrub Growth across the Tundra Biome. Nat. Clim. Change 2015, 5, 887–891. [Google Scholar] [CrossRef]
- Nakagawa, S.; Schielzeth, H. A General and Simple Method for Obtaining R 2 from Generalized Linear Mixed-Effects Models. Methods Ecol. Evol. 2013, 4, 133–142. [Google Scholar] [CrossRef]
- Visser, H. Note on the Relation between Ring Widths and Basal Area Increments. For. Sci. 1995, 41, 297–304. [Google Scholar] [CrossRef]
- Alfaro-Sánchez, R.; Valdés-Correcher, E.; Espelta, J.M.; Hampe, A.; Bert, D. How Do Social Status and Tree Architecture Influence Radial Growth, Wood Density and Drought Response in Spontaneously Established Oak Forests? Ann. For. Sci. 2020, 77, 49. [Google Scholar] [CrossRef]
- Bouriaud, O.; Bréda, N.; Dupouey, J.L.; Granier, A. Is Ring Width a Reliable Proxy for Stem-Biomass Increment? A Case Study in European Beech. Can. J. For. Res. 2005, 35, 2920–2933. [Google Scholar] [CrossRef]
- Rozenberg, P.; Chauvin, T.; Escobar-Sandoval, M.; Huard, F.; Shishov, V.; Charpentier, J.P.; Sergent, A.S.; Vargas-Hernandez, J.J.; Martinez-Meier, A.; Pâques, L. Climate Warming Differently Affects Larix Decidua Ring Formation at Each End of a French Alps Elevational Gradient. Ann. For. Sci. 2020, 77, 54. [Google Scholar] [CrossRef]
- Biondi, F.; Qeadan, F. A Theory-Driven Approach to Tree-Ring Standardization: Defining the Biological Trend from Expected Basal Area Increment. Tree-Ring Res. 2008, 64, 81–96. [Google Scholar] [CrossRef]
- Nehrbass-Ahles, C.; Babst, F.; Klesse, S.; Nötzli, M.; Bouriaud, O.; Neukom, R.; Dobbertin, M.; Frank, D. The Influence of Sampling Design on Tree-Ring-Based Quantification of Forest Growth. Glob. Change Biol. 2014, 20, 2867–2885. [Google Scholar] [CrossRef]
- Chouinard, C.; Fortier, R.; Mareschal, J.C. Recent Climate Variations in the Subarctic Inferred from Three Borehole Temperature Profiles in Northern Quebec, Canada. Earth Planet. Sci. Lett. 2007, 263, 355–369. [Google Scholar] [CrossRef]
- Sadras, V.O.; Denison, R.F. Do Plant Parts Compete for Resources? An Evolutionary Viewpoint. New Phytol. 2009, 183, 565–574. [Google Scholar] [CrossRef] [PubMed]
- Nicault, A.; Bégin, Y.; Guiot, J. Chapitre 8: Standardisation des séries dendrochronologiques. In La Dendroécologie: Principes, Méthodes et Applications; Presse de l’Université Laval: Québec City, QC, Canada, 2010; pp. 199–228. [Google Scholar]
- Deslauriers, A.; Rossi, S.; Morin, H. Chapitre 3: Analyse et développement intraannuel des cernes de croissance. In La Dendroécologie: Principes, Méthodes et Applications; Presse de l’Université Laval: Québec City, QC, Canada, 2010; pp. 61–92. [Google Scholar]
- Bokhorst, S.F.; Bjerke, J.W.; Tømmervik, H.; Callaghan, T.V.; Phoenix, G.K. Winter Warming Events Damage Sub-Arctic Vegetation: Consistent Evidence from an Experimental Manipulation and a Natural Event. J. Ecol. 2009, 97, 1408–1415. [Google Scholar] [CrossRef]


| Environment | Data Type | Sample Type | Best Climatic Model | Climatic Sensitivity (∆AICnull) | Marg. R2 | Cond. R2 | Residual df |
|---|---|---|---|---|---|---|---|
| Terrace | RW index | Root collars | T Jul + P Mar | 9.8 | 0.07 | 0.14 | 413 |
| Stems | T Apr | 6.4 | 0.04 | 0.06 | 403 | ||
| BAI | Root collars | T Jul + P Mar | 34.8 | 0.29 | 0.39 | 400 | |
| Stems | T Jul + P Mar | 33.5 | 0.39 | 0.46 | 354 | ||
| Hilltop | RW index | Root collars | T Jul + P Mar | 16.3 | 0.13 | 0.25 | 471 |
| Stems | T Apr | 4.9 | 0.03 | 0.08 | 486 | ||
| BAI | Root collars | T Jul + P Mar | 43.1 | 0.43 | 0.56 | 458 | |
| Stems | T Jul + P Mar | 36.7 | 0.40 | 0.48 | 449 | ||
| Snowbed | RW index | Root collars | T Jul + P Mar | 18.9 | 0.28 | 0.50 | 339 |
| Stems | T Jun | 10.6 | 0.15 | 0.24 | 246 | ||
| BAI | Root collars | T Jul + P Mar | 33.5 | 0.52 | 0.75 | 325 | |
| Stems | T Jul + P Mar | 20.2 | 0.39 | 0.52 | 228 |
Disclaimer/Publisher’s Note: The statements, opinions and data contained in all publications are solely those of the individual author(s) and contributor(s) and not of MDPI and/or the editor(s). MDPI and/or the editor(s) disclaim responsibility for any injury to people or property resulting from any ideas, methods, instructions or products referred to in the content. |
© 2023 by the authors. Licensee MDPI, Basel, Switzerland. This article is an open access article distributed under the terms and conditions of the Creative Commons Attribution (CC BY) license (https://creativecommons.org/licenses/by/4.0/).
Share and Cite
Labrecque-Foy, J.-P.; Angers-Blondin, S.; Ropars, P.; Simard, M.; Boudreau, S. The Use of Basal Area Increment to Preserve the Multi-Decadal Climatic Signal in Shrub Growth Ring Chronologies: A Case Study of Betula glandulosa in a Rapidly Warming Environment. Atmosphere 2023, 14, 319. https://doi.org/10.3390/atmos14020319
Labrecque-Foy J-P, Angers-Blondin S, Ropars P, Simard M, Boudreau S. The Use of Basal Area Increment to Preserve the Multi-Decadal Climatic Signal in Shrub Growth Ring Chronologies: A Case Study of Betula glandulosa in a Rapidly Warming Environment. Atmosphere. 2023; 14(2):319. https://doi.org/10.3390/atmos14020319
Chicago/Turabian StyleLabrecque-Foy, Julie-Pascale, Sandra Angers-Blondin, Pascale Ropars, Martin Simard, and Stéphane Boudreau. 2023. "The Use of Basal Area Increment to Preserve the Multi-Decadal Climatic Signal in Shrub Growth Ring Chronologies: A Case Study of Betula glandulosa in a Rapidly Warming Environment" Atmosphere 14, no. 2: 319. https://doi.org/10.3390/atmos14020319