Abstract
Future changes in crop evapotranspiration (ETc) are of interest to water management stakeholders. However, long-term projections are complex and merit further investigation due to uncertainties in climate data, differential responses of crops to climate and elevated atmospheric CO2, and adaptive agricultural management. We conducted factor-control simulation experiments using the process-based CropSyst model and investigated the contribution of each of these factors. Five major irrigated crops in the Columbia Basin Project area of the USA Pacific Northwest were selected as a case study and fifteen general circulation models (GCM) under two representative concentration pathways (RCP) were used as the climate forcing. Results indicated a wide range in ETc change, depending on the time frame, crop type, planting dates, and CO2 assumptions. Under the 2090s RCP8.5 scenario, ETc changes were crop-specific: +14.3% (alfalfa), +8.1% (potato), −5.1% (dry bean), −8.1% (corn), and −12.5% (spring wheat). Future elevated CO2 concentrations decreased ETc for all crops while earlier planting increased ETc for all crops except spring wheat. Changes in reference ET (ETo) only partially explains changes in ETc because crop responses are an important modulating factor; therefore, caution must be exercised in interpreting ETo changes as a proxy for ETc changes.
1. Introduction
Understanding future changes in crop evapotranspiration and net irrigation requirements is important for irrigated agriculture around the globe [1,2,3]. While changes in atmospheric evaporative demand are determined by several meteorological variables (e.g., solar radiation, temperature, humidity, and wind speed), crop evapotranspiration (ETc), and net irrigation requirements (NIR) depend on additional factors. ETc depends on crop type, growing cycle length, canopy evolution, initial root zone soil moisture, root depth and distribution, and other factors. Additionally, NIR depends on the magnitude and seasonality of precipitation patterns. Furthermore, a concurrent increase of atmospheric CO2 concentration (CO2) affects stomatal conductance, potentially altering ETc [4,5] and NIR. Our evaluation of many studies assessing future changes in ETc is that a great deal of confusion and misrepresentation exists due to methodologies that do not consider the multiple influences that future environmental conditions will have on crop water demand, particularly on the main component, crop transpiration, and how different crop types will respond to changing conditions.
Although ETc is often projected to increase in the future, projections of future ETc and NIR may differ when crop factors are properly considered; not only in terms of magnitude but also in the direction of change (increase or decrease). Furthermore, the use of different methodological approaches and assumptions also contribute to differences in projections.
Many studies are based on the reference crop evapotranspiration (ETo) introduced by Allen et al. [6], an FAO publication widely used by irrigation practitioners rather than ETc and NIR. Using this approach, Khalil [7] projected an increase of ~12% of annual ETo by the end of the century in Egypt. Tao et al. [8] reported ETo increases of 9.8%, 12.6%, and 15.6% under Representative Concentration Pathway (RCP) 4.5, and 10.2%, 19.1%, and 27.3% under RCP8.5 for the periods 2011–2040, 2041–2070, and 2071–2100, respectively, compared to 1961–1990 reference period. A study in the Upper Godavari basin in India projected average ETo increases of ~3% by the end of the century, and NIR decreases of 14.7% due to large increases in annual precipitation [9]. Despite limitations, as will be argued in this article, several recent studies continue to assess changes in crop irrigation requirements based on ETo, e.g., [10,11,12,13], always projecting modest to substantial increases. These projections describe changes in atmospheric evaporative demand, using ETo as an approximation, but do not provide an adequate estimation on how these changes could transfer to ETc, which depends on crop growth conditions along with the climate. In addition, they do not include the moderating effect of CO2 on plant water vapor conductance and transpiration. Therefore, using ETo as a proxy for future ETc or NIR projections will often predict larger increases than likely realized.
Another approach provides a better approximation of ETc by adjusting ETo by incorporating crop-specific coefficients (Kc) (ETc = Kc × ETo). Saadi et al. [14] evaluated wheat and tomato in the Mediterranean region reporting a 6.7% increase in annual ETo for the period 2000–2050, but reductions in ETc and NIR of 6%/11% (wheat) and 5%/5% (tomato) by 2050. The reductions were attributed to a shorter growing season, 15 and 12 days shorter for wheat and tomato respectively. In their study, ETc was determined using the FAO Penman-Monteith equation and growth-stage-specific crop coefficients, the growing season duration was approximated using the sum of growing-degree days, NIR was calculated using a simple soil water balance [6], and CO2 effects were not considered. Using the same crop coefficient approach, Li et al. [15] projected crop water requirements in five Central Asia countries to increase 13 mm year−1 (RCP4.5, 2016–2045, 1.5 °C warming) and 19 mm year−1 (RCP8.5, 2036–2065, 2.0 °C warming). Although simple crop elements were included in this approach via crop coefficients, they are insufficient to account for the complexity of crop responses to environmental changes, and the effect of projected changes in CO2 is not considered.
More detailed considerations of ETc responses to changing environmental conditions are incorporated in crop simulation models. Using a hydrology/crop growth model (SWAT), Woznicki et al. [16] evaluated the effect of changing planting dates and water availability on corn and soybean irrigation requirements in the Kalamazoo River Watershed, Michigan, USA. Corn irrigation requirements increased with early planting but decreased with late planting due to reduced growth and yields as a result of fluctuations in available water. Soybean, with a much larger response to elevated CO2 than corn, showed yield increases regardless of planting date shifts but with similar irrigation demand trends as corn. Chen et al. [17] used the RZWQM2 crop model to evaluate irrigation water requirements of cotton in Qira Oasis, China, reporting a decrease of 7.5% (2041–2060) and 10.3% (2061–2080) relative to the present-day baseline (averaged across RCP4.5 and RCP8.5 scenarios). Rajagopalan et al. [18] showed decreases in NIR for annual crops in the Columbia River basin of the Pacific Northwest USA for the 2030s, primarily based on shortened growing seasons because of warming with significant spatial variations. Precipitation had little impact on NIR because there were minimal changes in precipitation between the historical baseline and future projections at annual scales and because precipitation has minimal contributions to NIR in semi-arid regions. Rajagopalan et al. [18] also highlighted the importance of considering the spatial crop mix in getting aggregate regional responses right given the crop-specific nature of NIR response to climate change.
The representation of evapotranspiration in crop models varies widely, which can result in small to large departures compared with observations [19]. The description of the water flow in the soil-plant-atmosphere continuum, the interactions between the water and energy balance, and the CO2 effects on stomatal conductance and transpiration are often oversimplified [20]. Although crop models are a necessary tool for ETc projections that incorporate multiple crop responses to environmental change, careful consideration of these factors is necessary when selecting models.
Another significant limitation of many studies of climate change effects on ETc is the small number of General Circulation Models (GCM) utilized for projections. There is considerable spread in GCM climate projections, which can significantly bias conclusions depending on GCM choices. Most studies range from using just one GCM [9] to a handful [16]. In some cases, the GCM choices are based on capturing the extreme changes in the temperature and precipitation space [18], and in others, it is arbitrary with no explanation provided. In addition, several studies use the low spatial resolution (1 degree to half a degree) gridded GCM climate inputs, without downscaling limiting its usefulness for assessing ETc and NIR responses to climate change at the basin or irrigation district scales, e.g., [21,22]).
In summary, besides region-specific climatic differences, there is a wide variation in projected changes to crop evapotranspiration and irrigation requirements (with increases being projected in most cases) depending on assessment methods and the spread of GCM projections utilized. When crop responses are incorporated, different assumptions related to crop types, planting dates, growing cycle lengths, and CO2 effects are additional sources of variation. For an end user utilizing this information for decision making, it is important to understand the reasons for this variability to have clarity of implications. A systematic assessment of the reasons for variability in results is missing in the literature, and this study aims to address this gap. Our objective is to isolate key assumptions and highlight how projected changes in ETc and NIR vary across these assumptions, partly explaining the wide variation in results observed across studies. We perform crop model simulations with combinations of assumptions around crop water-requirement definitions (ETo, ETc, and NIR), CO2 levels (fixed and transient), and growing season length (fixed versus dynamic planting and harvest), to quantify differences in projected changes. We use the Columbia Basin Project (CBP) area in central Washington State, the USA, as a case study. The five dominant crops in this area (alfalfa, corn, potato, dry bean, and spring wheat) have differences in growth and water use characteristics, phenology, photosynthetic pathways (C3 versus C4 species), and management, thereby offering an opportunity to gain insight about crop-specific differences in the ETc and NIR response to climate change. We project ETo, ETc, and NIR changes using a comprehensive suite of 15 GCM projections under two RCP covering three future time frames until the end of the 21st century. The findings of this study are relevant beyond the region of study and will help in interpreting projected changes of crop water requirements for irrigated agriculture in general.
2. Materials and Methods
2.1. Study Area
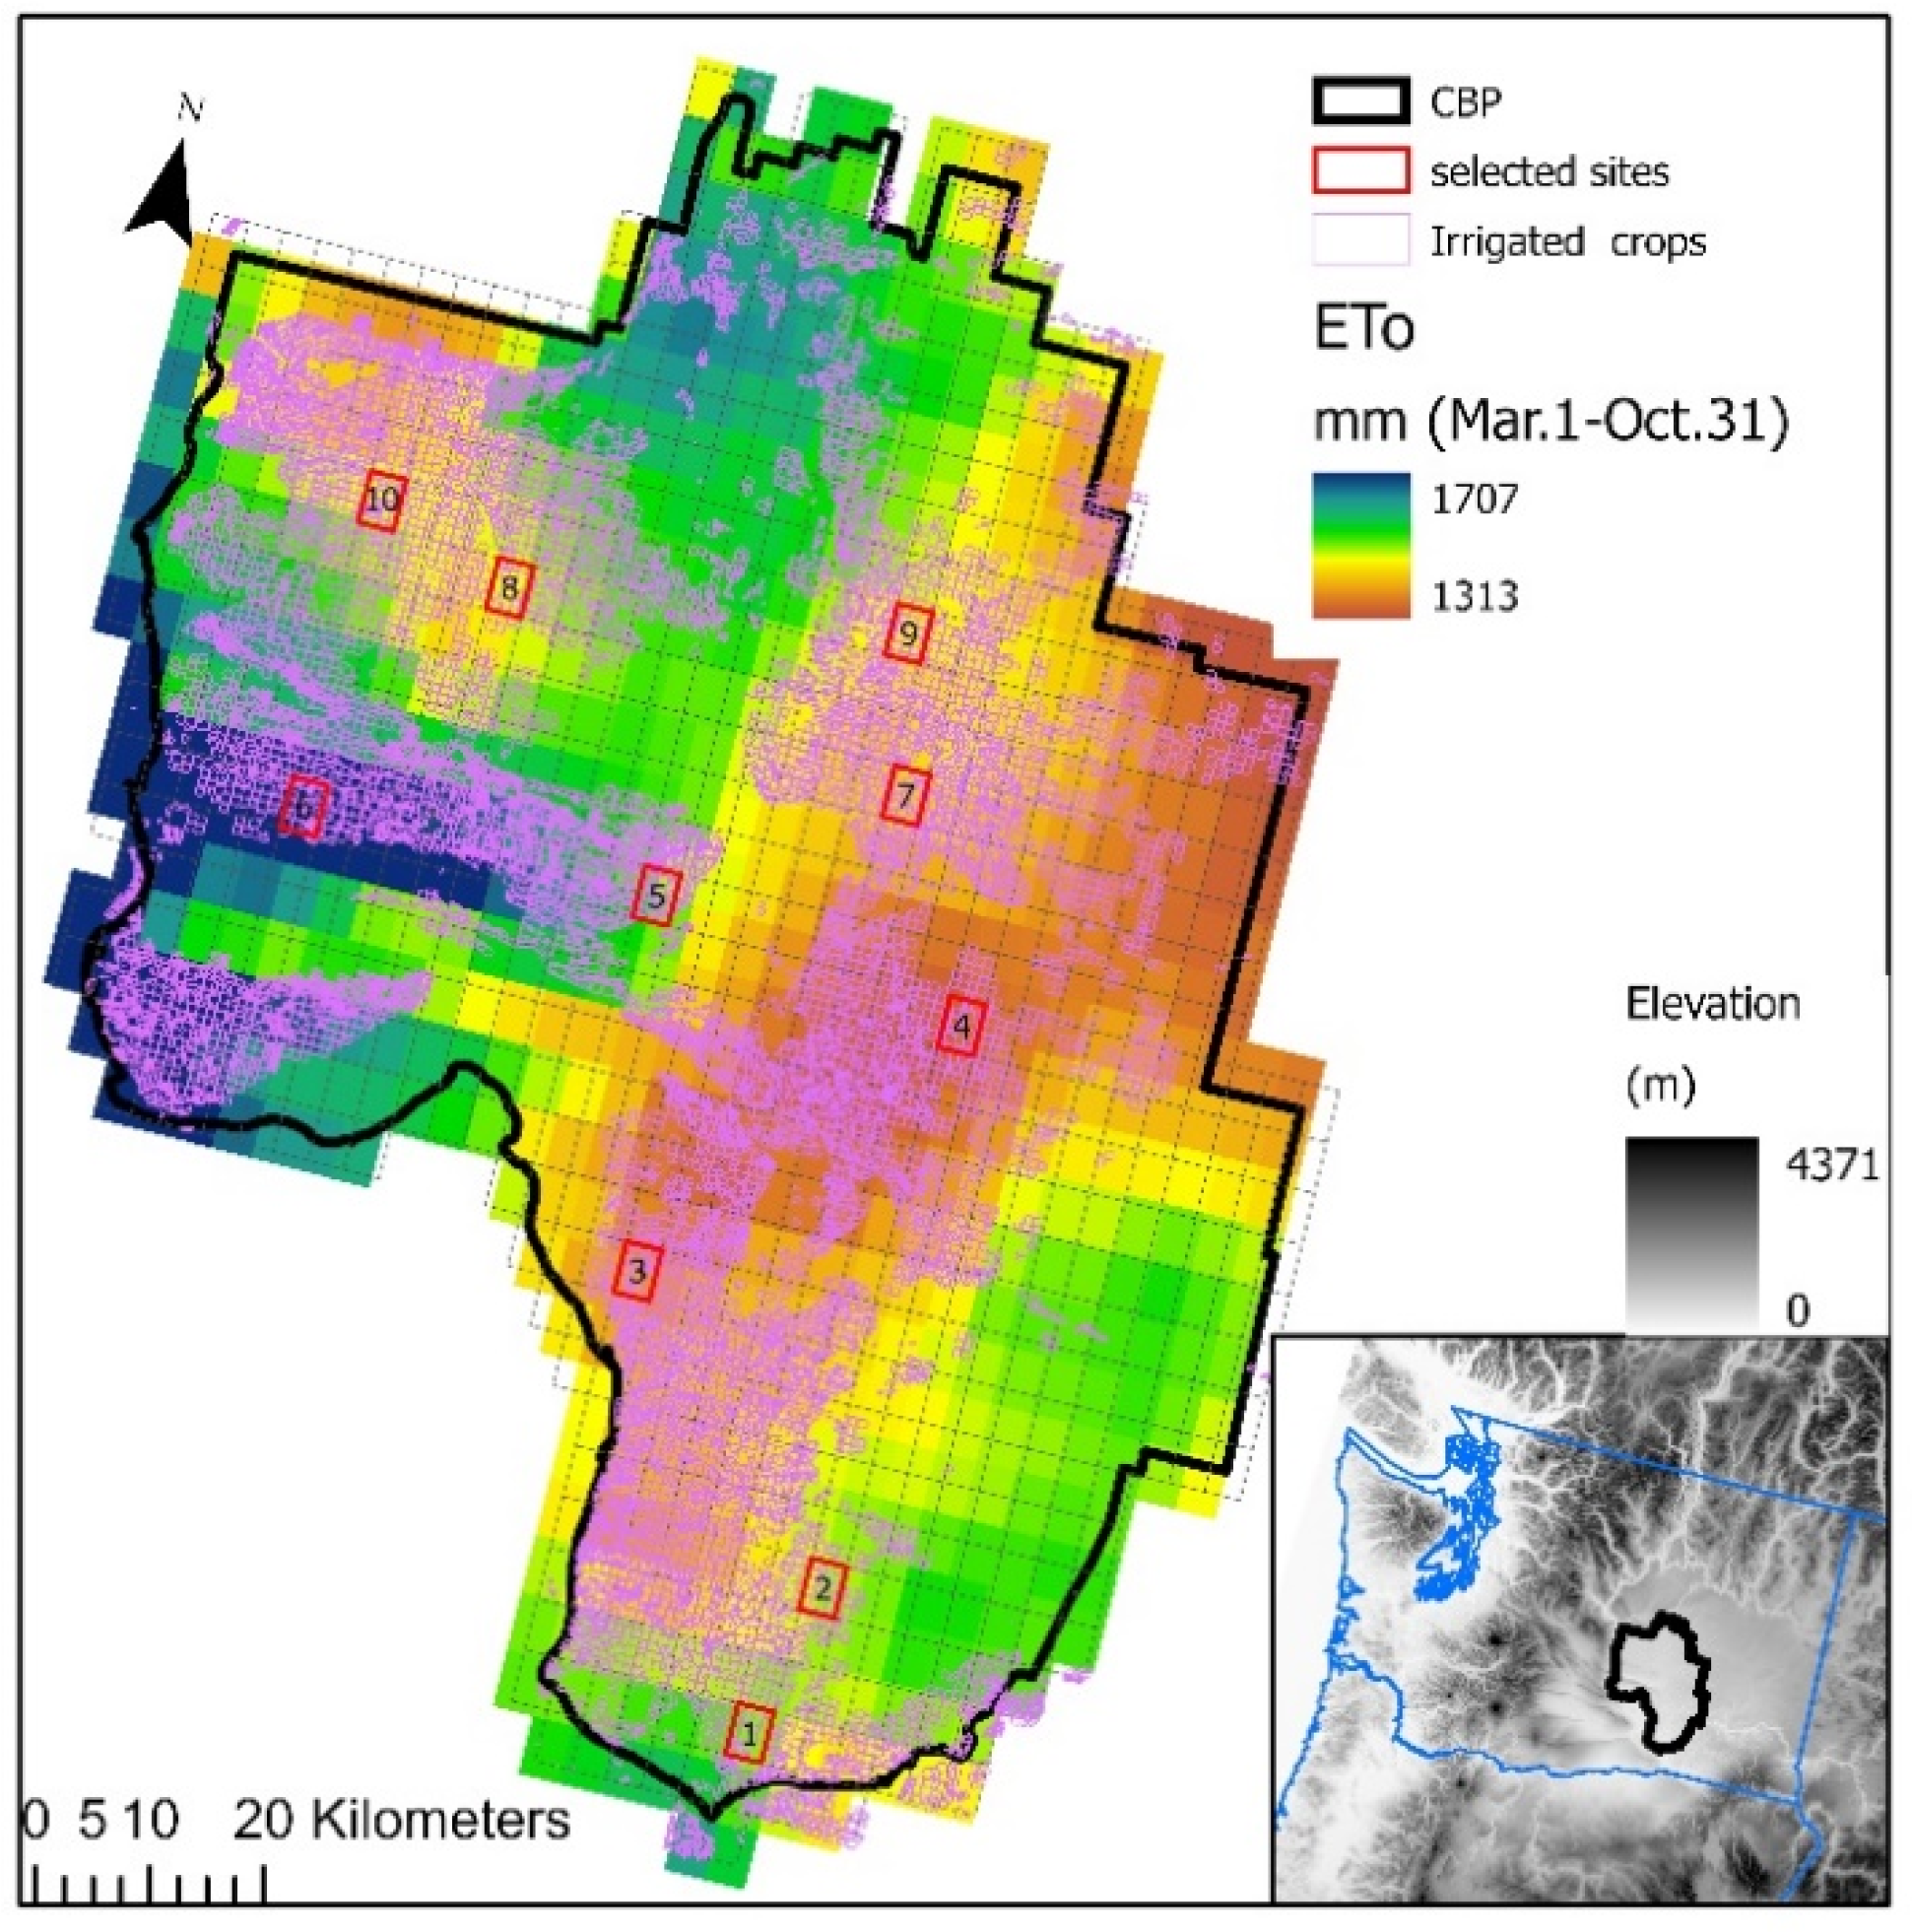
The CBP region has a semiarid climate characterized by cool, moist winters and hot, dry summers (BSk–Köeppen climate classification). Soil composition varies widely from deep, fine soils with moderately low clay content to shallow, sandy wind-deposited soils. The region has ~268,400 irrigated hectares and center pivot systems are the dominant irrigation type (~80% of the total irrigated area). Five crops represent ~60% of the total irrigated extent: alfalfa (hay), grain corn, dry bean, potato, and spring wheat [23]. Ten irrigated grids (4 km × 4 km) distributed in the project area, encompassing the range of regional growing season ETo, were selected (Figure 1).

Figure 1.
Selected grids and average total reference crop evapotranspiration (ETo) from 1 March to 31 October for years 1981–2009 in the Columbia Basin Project of the USA Pacific Northwest.
Meteorological inputs include daily minimum and maximum air temperature (°C), solar radiation (MJ m−2), wind speed at 10 m height (m s−1), precipitation (mm), and maximum and minimum relative humidity (%) at a 1/24th degree (~4 km) spatial resolution. Historical data were sourced from the gridMET dataset, a gridded product that blends the spatial attributes of the PRISM dataset with desirable temporal attributes from regional reanalysis (NLDAS-2) using climatically aided interpolation [24]. Future climate projections include 15 CMIP5 (Coupled Model Intercomparison Project Phase 5) GCM (bcc-csm1-1, bcc-csm1-1-m, BNU-ESM, CanESM2, CNRM-CM5, CSIRO-Mk3-6-0, GFDL-ESM2G, GFDL-ESM2M, inmcm4, IPSL-CM5A-LR, IPSL-CM5A-MR, IPSL-CM5B-LR, MIROC5, MIROC-ESM, and MIROC-ESM-CHEM), and two RCP scenarios (4.5 and 8.5). These projections are bias-corrected and statistically downscaled with the MACA (Multivariate Adaptive Constructed Analogs) method [25] to a spatial resolution of 4 km that is suitable for climate change impact analysis [26]. For each GCM, three future time slices: 2030s (2010–2039), 2060s (2040–2069), and 2090s (2070–2099) were selected, and a historical period (1980–2009) was used as a baseline. To minimize GCM bias, rather than directly comparing the GCM future simulations with historical observations, we find the ratio of GCM future projections and GCM historical simulations and multiply the ratio with the historical observation baseline to get future projection estimates of variables of interest. Each model in the 15-member ensemble was given equal weight in calculating ensemble averages. The STATSGO2 [27] inventory of soils, was the primary source of soil hydraulic properties. Soil properties were aggregated to 1/24th degree (~4 km) to match the spatial resolution of the meteorological inputs.
2.2. Simulation Scenarios
For each crop, eight future scenarios were simulated (Table 1). This included combinations of two planting modes (fixed planting dates according to most common practice for each crop in the region, and conditional planting dates triggered by a threshold minimum temperature, with the search for conditions starting at the earliest reported planting date) (Table 2), and two future CO2 scenarios (recent contemporary CO2 level of 387 ppm, and elevated CO2 levels in the future based on transient concentrations as given by IPCC for the two RCP scenarios, RCP 4.5 and 8.5) [28,29]. All simulations were conducted using a full irrigation strategy to avoid crop water stress.

Table 1.
Simulation scenarios used in this study.
Table 2.
Traditional planting date and the criteria for conditional planting date for annual crops 1.
Typical planting and harvest dates for the region were based on 20 years of historical data included in the USA field crops report [30]. The middle of the planting date range was selected as the fixed planting date. For conditional planting, the search for suitable temperatures started on the earliest day the crop was planted in the 20-year historical period (Table 2). This allows future planting dates to shift earlier if the weather conditions are suitable but constrains the future planting date to be on after the earliest planting observed historically.
2.3. CropSyst Model
The Cropping Systems Simulation Model, CropSyst [31,32], a well-established model that has been used for many applications [33], was used to simulate crop growth and water use. The model simulates individual crops or crops in rotation to estimate biomass growth and yield in response to weather, soil, water and nutrient availability, and management (planting, tillage, irrigation, and fertilization).
Crop development stages are based on crop-specific non-linear thermal time accumulation (growing degree-days). The non-linear thermal accumulation curve is based on three cardinal temperature points: base and maximum temperatures, outside of which there is no thermal time accumulation and an optimal temperature between the base and maximum temperatures at which thermal accumulation is highest with reduced thermal accumulation on either sides [34,35].
In this study, the focus is on crop consumptive water use as impacted by weather and atmospheric CO2. In CropSyst, crop potential ET (ETcp) is calculated following the FAO56 methodology [6] that is based on a hypothetical well-watered reference crop ET (ETo) with a specific height (determining aerodynamic resistance to vapor flux) and canopy resistance. The value of ETcp is determined as ETcp = ETo × Kc, where Kc is a crop-specific coefficient. FAO56 provides Kc values, determined using observations based on lysimetric measurements for many crops; only the maximum mid-season Kc in FAO56 is used in CropSyst. To distribute mid-season Kc values throughout the growing season, CropSyst calculates the daily unit area fraction of solar radiation intercepted by the green crop canopy (GCC) that evolves from initial to maximum (full canopy) to a minimum at full senescence as a function of cumulative thermal time. Daily GCC is used to partition ETcp into potential transpiration (Tp = ETcp × GCC) and soil water evaporation (Ep = ETcp (1 − GCC)). The actual crop evapotranspiration (ETc) is the sum of actual crop transpiration and actual soil water evaporation and depends on many factors. This includes Tp and the water content and root distribution in the soil profile for actual transpiration, and Ep and the water content of the soil surface for actual soil water evaporation; details are described in [36,37].
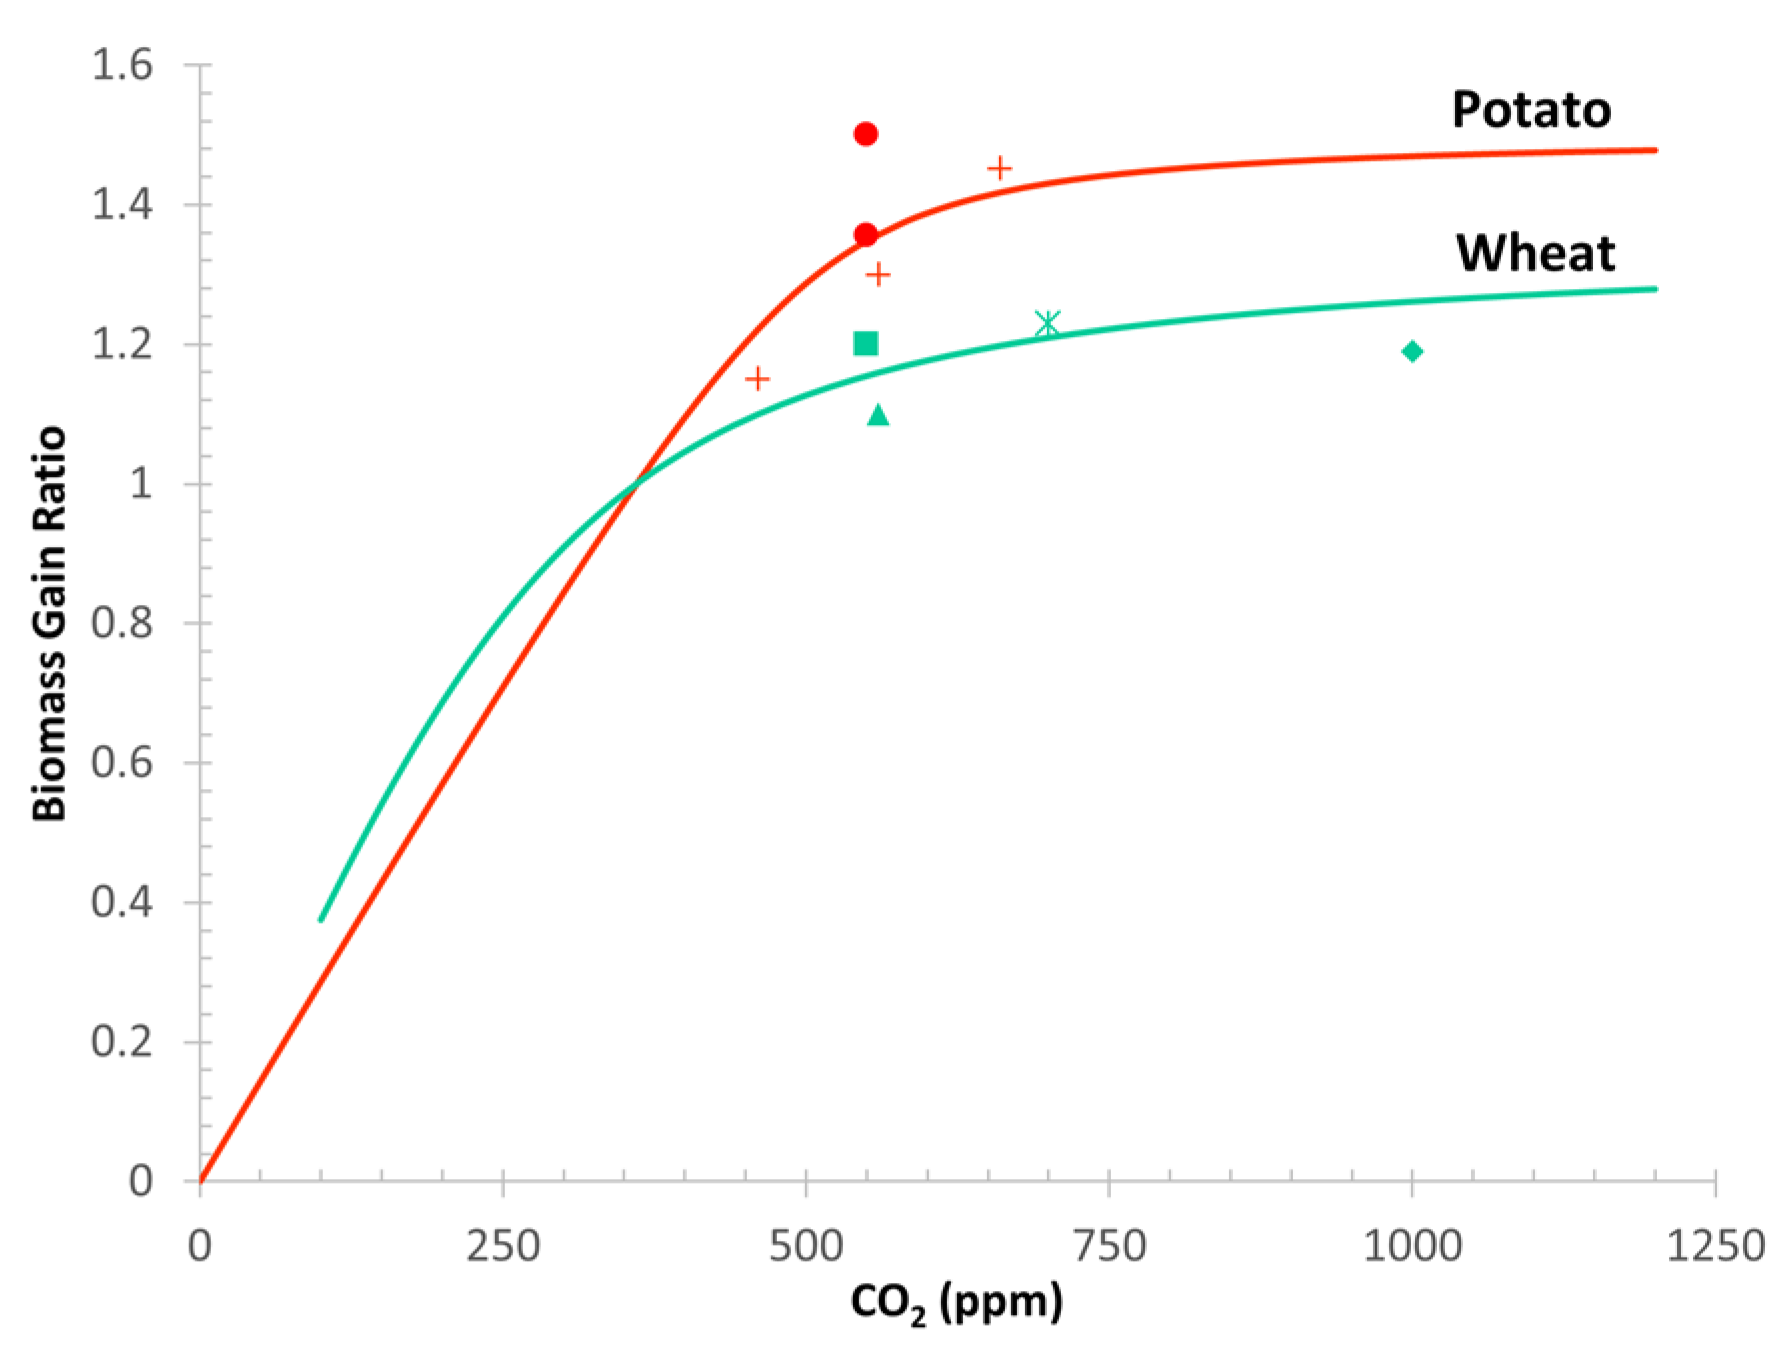
The effect of elevated CO2 involves increased biomass production, decreased canopy conductance that reduces transpiration, and the resulting increased transpiration-use efficiency. We used data from Free-Air Carbon Enrichment (FACE) experiments [38,39,40] to fit the relative change of biomass production as a function of CO2 using a non-rectangular hyperbola (NRH) [41,42]:
where BGR is the biomass gain ratio (biomass at elevated CO2/biomass at baseline CO2), α is the initial slope, β is the asymptote (BGR at CO2 saturation), θ is the co-limitation. The CO2 concentration is specified for each simulation year. Figure 2 shows the NRH curve for potato and wheat, and some experimental data mostly based on FACE experiments. Potato has a larger response to CO2 than wheat, which is closer to other C3 species. For corn, a C4 species with negligible growth response to CO2, a 5% increase of BGR at CO2 saturation was assumed.
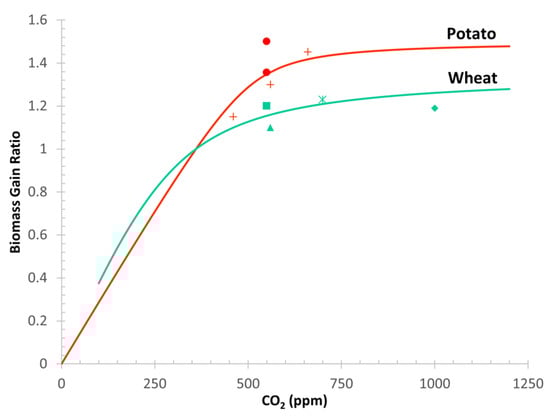
Figure 2.
Biomass gain ratio as a function of atmospheric CO2 concentration relative to CO2 of 360 ppm to potato and wheat. FACE data for potato are from Miglietta et al. [43] and Bindi et al. [44] while FACE data for wheat are from Long et al. [38]; Kimball et al., [40]; Ziskas and Bunce [45] and Reuveni and Bugbee [46].
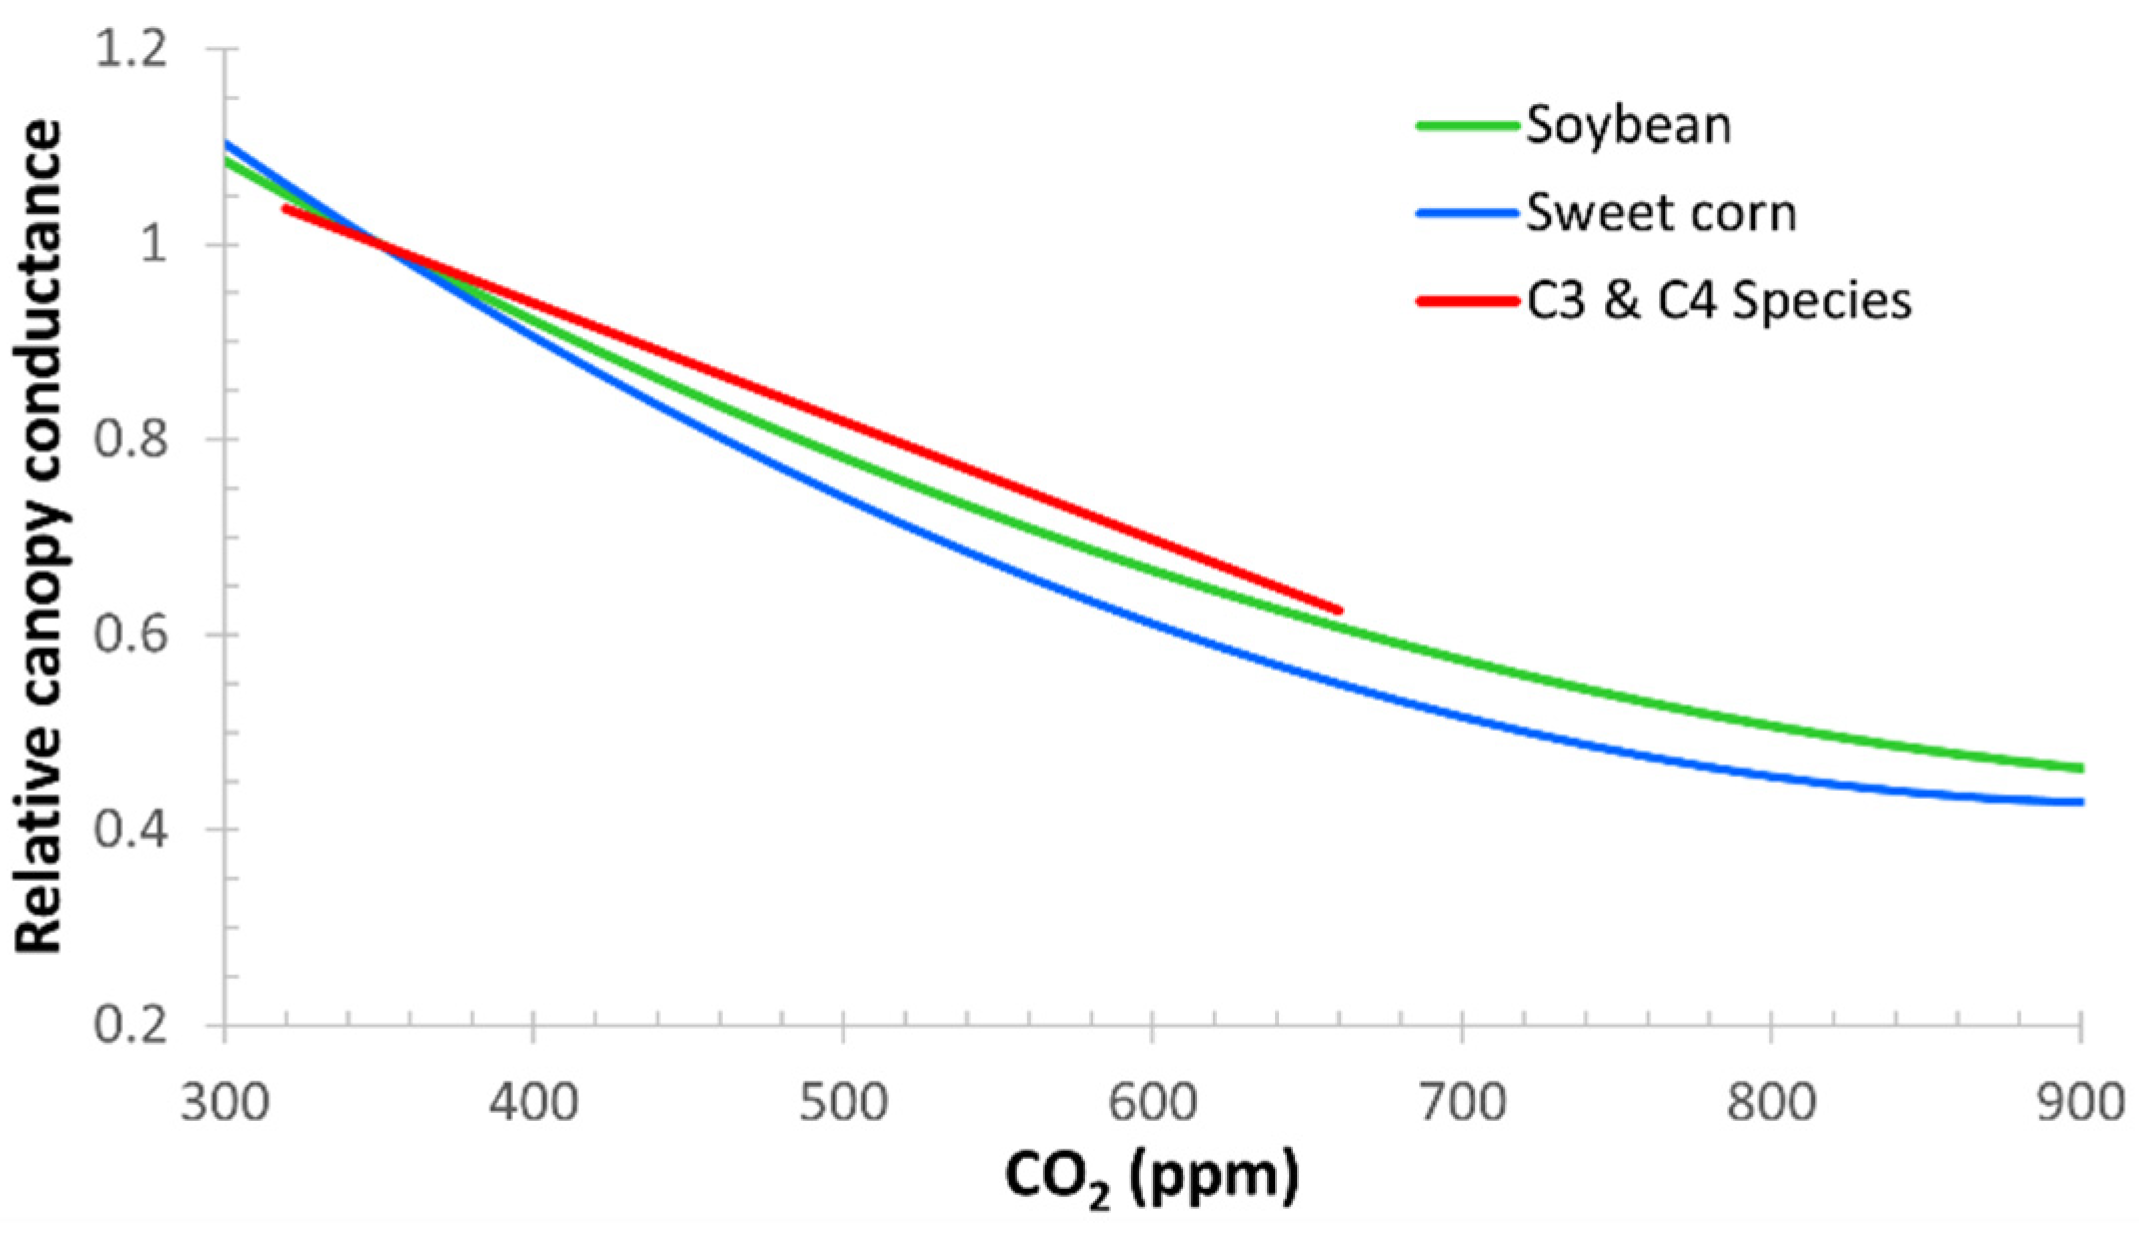
The reduction of canopy conductance with increasing CO2 is well documented, but data amenable to model this response are scarce. Morison [47] presented a linear response of canopy conductance to CO2 levels in the 330–660 ppm range for several C3 and C4 species crops, albeit with significant variation, with conductance decreasing 40% at 660 ppm relative to 330 ppm. However, CO2 elevation towards the end of the 21st century may exceed the upper limit of this range, and as shown by Allen [48], the canopy conductance response is nonlinear with smaller rates of change at high CO2, similar to the relationship between biomass and CO2 elevation (Figure 2). Figure 3 shows the Morison [47] linear relation compared with the nonlinear relation measured by Allen [48] for two crops. For this study, the nonlinear response for soybean, close to that of Morison [47], was implemented.

Figure 3.
Relative canopy conductance under different atmospheric CO2 concentrations for soybean and sweet corn from Allen et al. [48], and a general response for C3 and C4 species (linear in the range 330 to 660 ppm) from Morison [47].
Daily potential transpiration (Tp), is adjusted by a factor accounting for canopy conductance reduction due to elevated CO2 using the following equation:
where Δ is the slope of the saturation vapor pressure function of temperature, γ is the psychrometric constant, is the aerodynamic resistance, is the FAO56 canopy resistance (specified at 359 ppm) adjusted to historical baseline CO2, and is the FAO56 canopy resistance adjusted to future CO2.
2.4. CropSyst Calibration
Crop growth and yield calibration was restricted to the last 10 years (2011–2020) of more recent statistics to minimize the effect of changes in technology. Recent commercial yield records from National Agriculture Statistics Services [49] and Washington Annual Statistical Bulletins [50,51] were the main data source for calibration.
Crop data collected from field trials by the Washington State University Extension, including dates of emergence, flowering, heading, and physiological maturity were used for phenology parameterization. For annual crops, the end of the cycle corresponded to physiological maturity. The potato was an exception with harvest set at a fixed date because the crop canopy, still partially green, must be chemically desiccated before the harvest of tubers. For alfalfa, the only perennial crop in this study, the beginning and end of its cycle were determined by temperatures above and below 2 °C for 5 consecutive days, respectively. The main crop parameters used in the simulation are presented in Table 3.
Table 3.
Main crop parameters used in this study.
2.5. Irrigation Management
All crops and scenarios were simulated assuming full irrigation applied using a center pivot system, the predominant irrigation method in the area. Frequent irrigations were scheduled based on a maximum allowable depletion of 20% of the available water for crop uptake to a soil depth equivalent to half the current root depth.
3. Results and Discussion
Anticipating the potential changes in ETc and NIR as climate change evolves is of paramount importance for managers of irrigated agriculture, at all scales of decision making across the globe. These changes may be at times counterintuitive, as we will show in this section. We will isolate the effect of different factors first and then consider the overall effect.
3.1. Changes in Climate
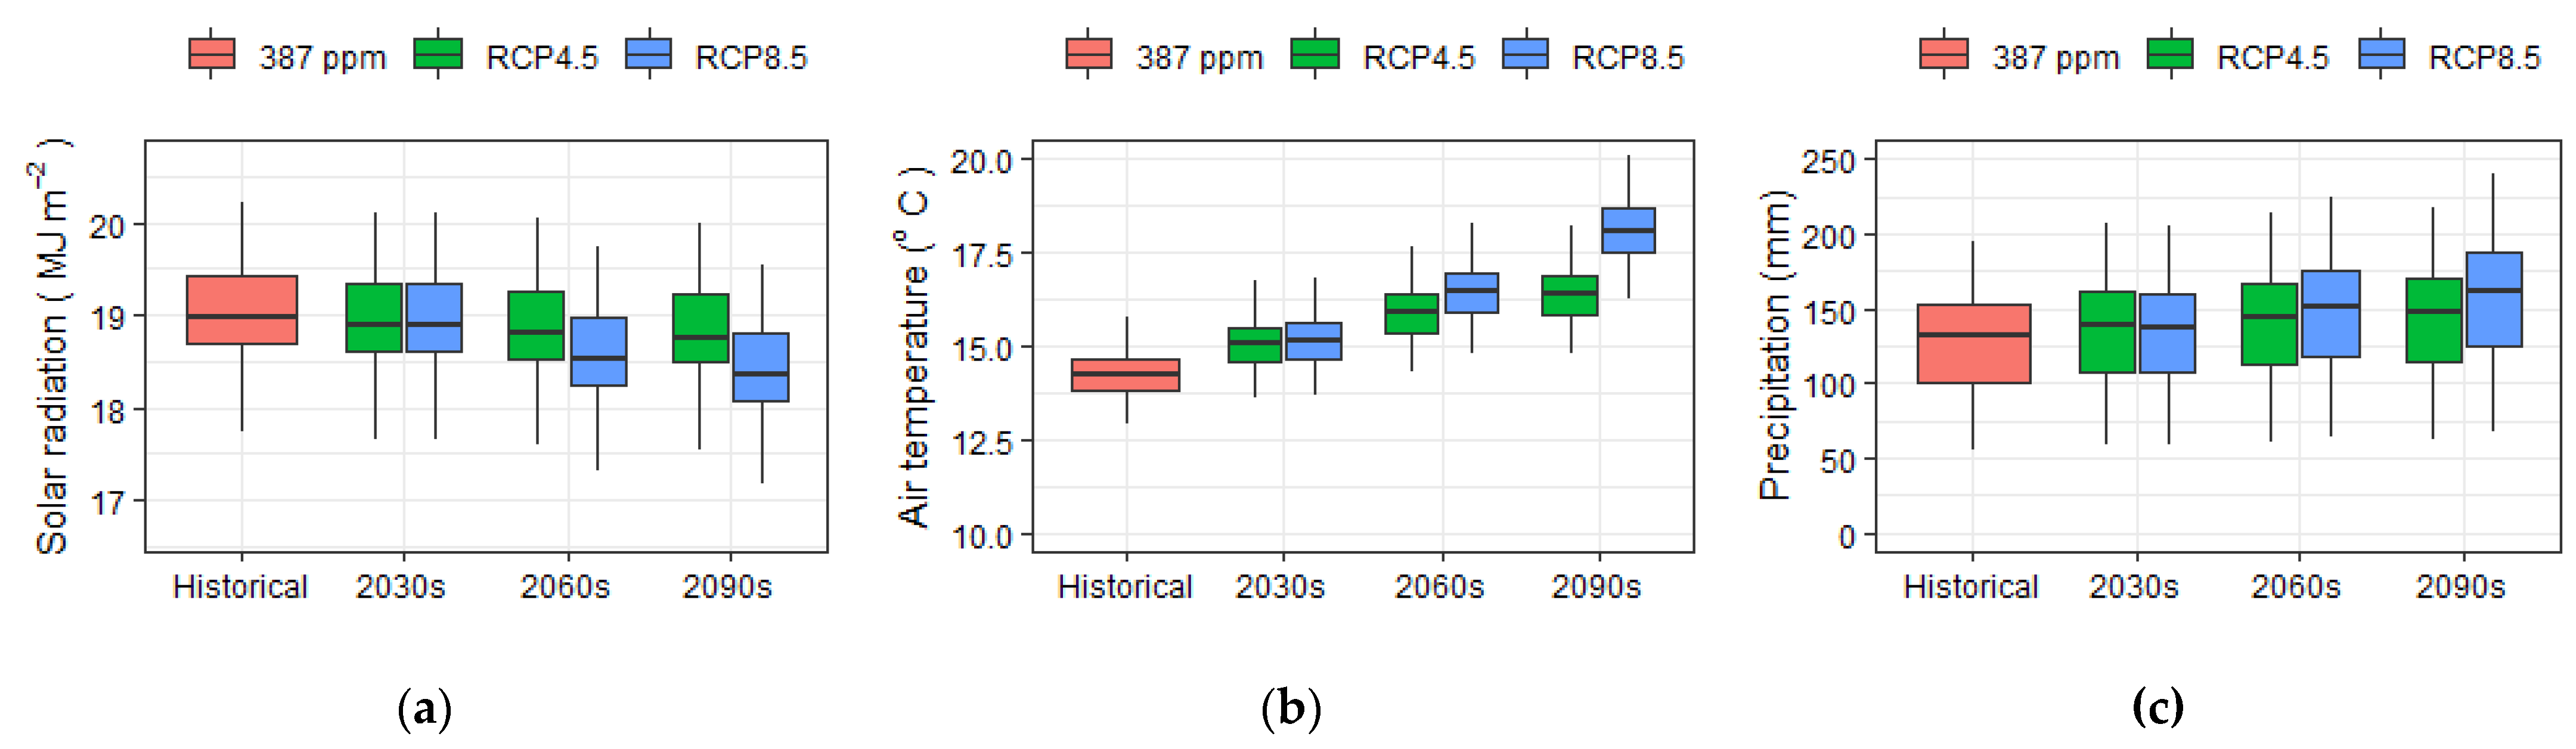
Changes in future climate are a major driver impacting ETc and NIR. Based on the 15 GCM ensemble, Figure 4 depicts the progression of precipitation, air temperature, and incoming shortwave solar radiation projected to the end of this century.
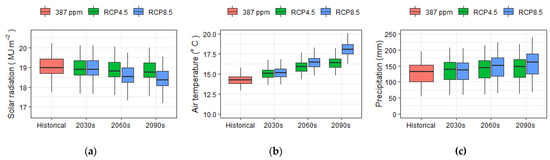
Figure 4.
Projected change of (a) solar radiation (MJ m−2), (b) mean air temperature (°C), and (c) precipitation (mm) based on the 15 GCM ensemble for the alfalfa growing season in the study area.
Solar radiation has a projected minor decline under RCP4.5 (~0.21 MJ m−2 by 2090s), and a bit larger decline under RCP8.5, starting by midcentury and reaching ~0.62 MJ m−2. The reliability of these projections is unclear, but they will contribute to changes in ETc, and the magnitude of these changes is not typically reported in the literature [55]. The average temperature is projected to increase ~2.1 °C (RCP4.5) and ~3.8 °C (RCP8.5) by the 2090s with respect to the historical period. This change will not only affect ETc, but also planting dates, crop development, growth, and yield (data not shown). Precipitation in the region is also projected to increase ~15 mm (RCP4.5) and ~30 mm (RCP8.5) by the 2090s, potentially contributing to the reduction of NIR with a magnitude depending on the timing and fraction of the added precipitation stored in the root zone soil profile.
3.2. Changes in Crop Cycle Length
Rising temperatures will have an impact on the crop cycle length (Table 4), thus changing the number of water consumption days. Our results show cycle length changes of −27 to +36 days depending on the crop, planting mode, period, and RCP. Except for alfalfa and potato, the other three crops have a shortened growing season in the future under the fixed planting mode. The shortening of the annual crop cycle length is abundantly reported in the literature [14,18,56,57] and is a function of accelerated growing degree day accumulation under warmer temperatures. As a perennial crop, alfalfa has a lengthening of the growing cycle due to earlier start (−3 to −5 days) and delayed end of the cycle (+4 to +17 days), resulting in the total cycle length increasing between 7 and 24 days depending on the RCP and future period. In the case of potato, with fixed planting and harvest dates (end of cycle), the cycle length was unchanged.
Table 4.
Start, end, and length of the cycle (± number of days) with respect to historical planting dates (DOY) for alfalfa, corn, dry bean, potato, and spring wheat for future periods under two RCP scenarios.
In addition to fixed planting dates, we shifted planting dates based on temperature thresholds (conditional planting) resulting in earlier planting of about −25 days (corn), −20 days (dry bean), and −37 days (spring wheat), and between −27 and −36 (potato). The cycle length changes with conditional planting are primarily a result of the relative advancement in planting and cycle end relative to the historical period, with corn and dry bean showing shorter cycle lengths, but not as short as with fixed planting, while potato and spring wheat had longer cycle lengths. Our restriction of planting to not advance earlier than the earliest historically observed planting date (as noted in the methods section) constrains the possible amount of shift in planting dates. Relaxing this criterion can lead to larger reductions in cycle length as reported by Rajagopalan et al. [18].
3.3. Changes in Atmospheric Evaporative Demand (ETo)
ETo is modeled based on solar shortwave and longwave radiation, air temperature, wind speed, and humidity; therefore, the effect of increased air temperature and decreased solar radiation may, to a certain extent counterbalance ETo estimations [58,59].
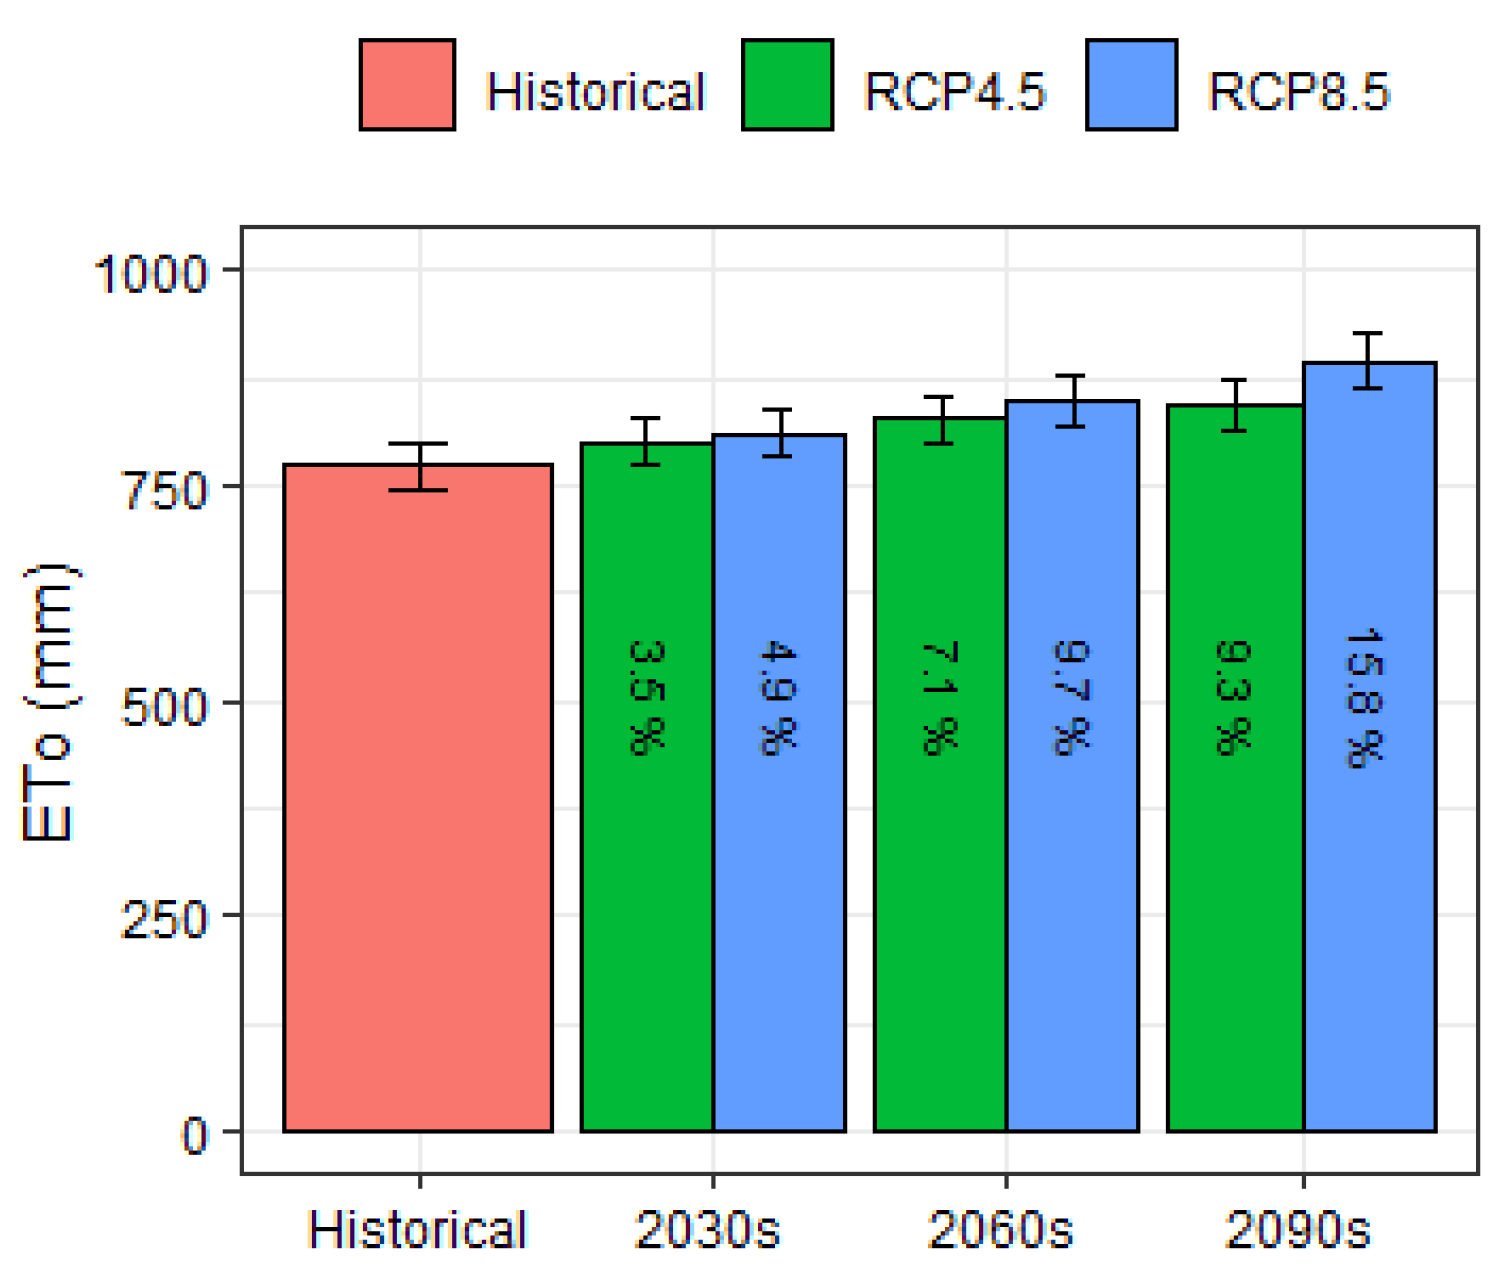
Figure 5 shows the historical and projected average reference crop evapotranspiration (ETo) [6], a reasonable approximation of atmospheric evaporative demand for each period (fixed potato cycle length used as an example). Increasing trends in ETo are generally consistent in the literature [7,8,9,14], although the magnitude can vary. This variation can be a result of competing effects of temperature increases and solar radiation decreases; however, existing literature does not typically summarize changes to solar radiation. As shown in Figure 4, future climate projections in the study area include an increase in temperature (increases ETo) and a decrease in solar radiation (reduce ETo) and the net result of this compensatory effect is a net increase in ETo for our study (Figure 5), ranging from 3.5% to 15.8% compared to the historical period.
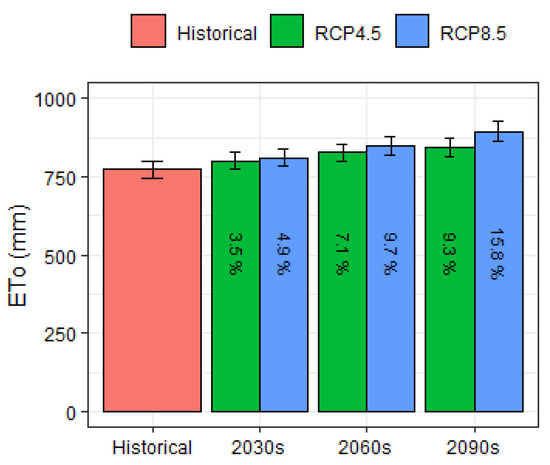
Figure 5.
Historical and projected average total reference crop evapotranspiration (ETo) for the potato fixed cycle length. Percent numbers correspond to change with respect to the historical period.
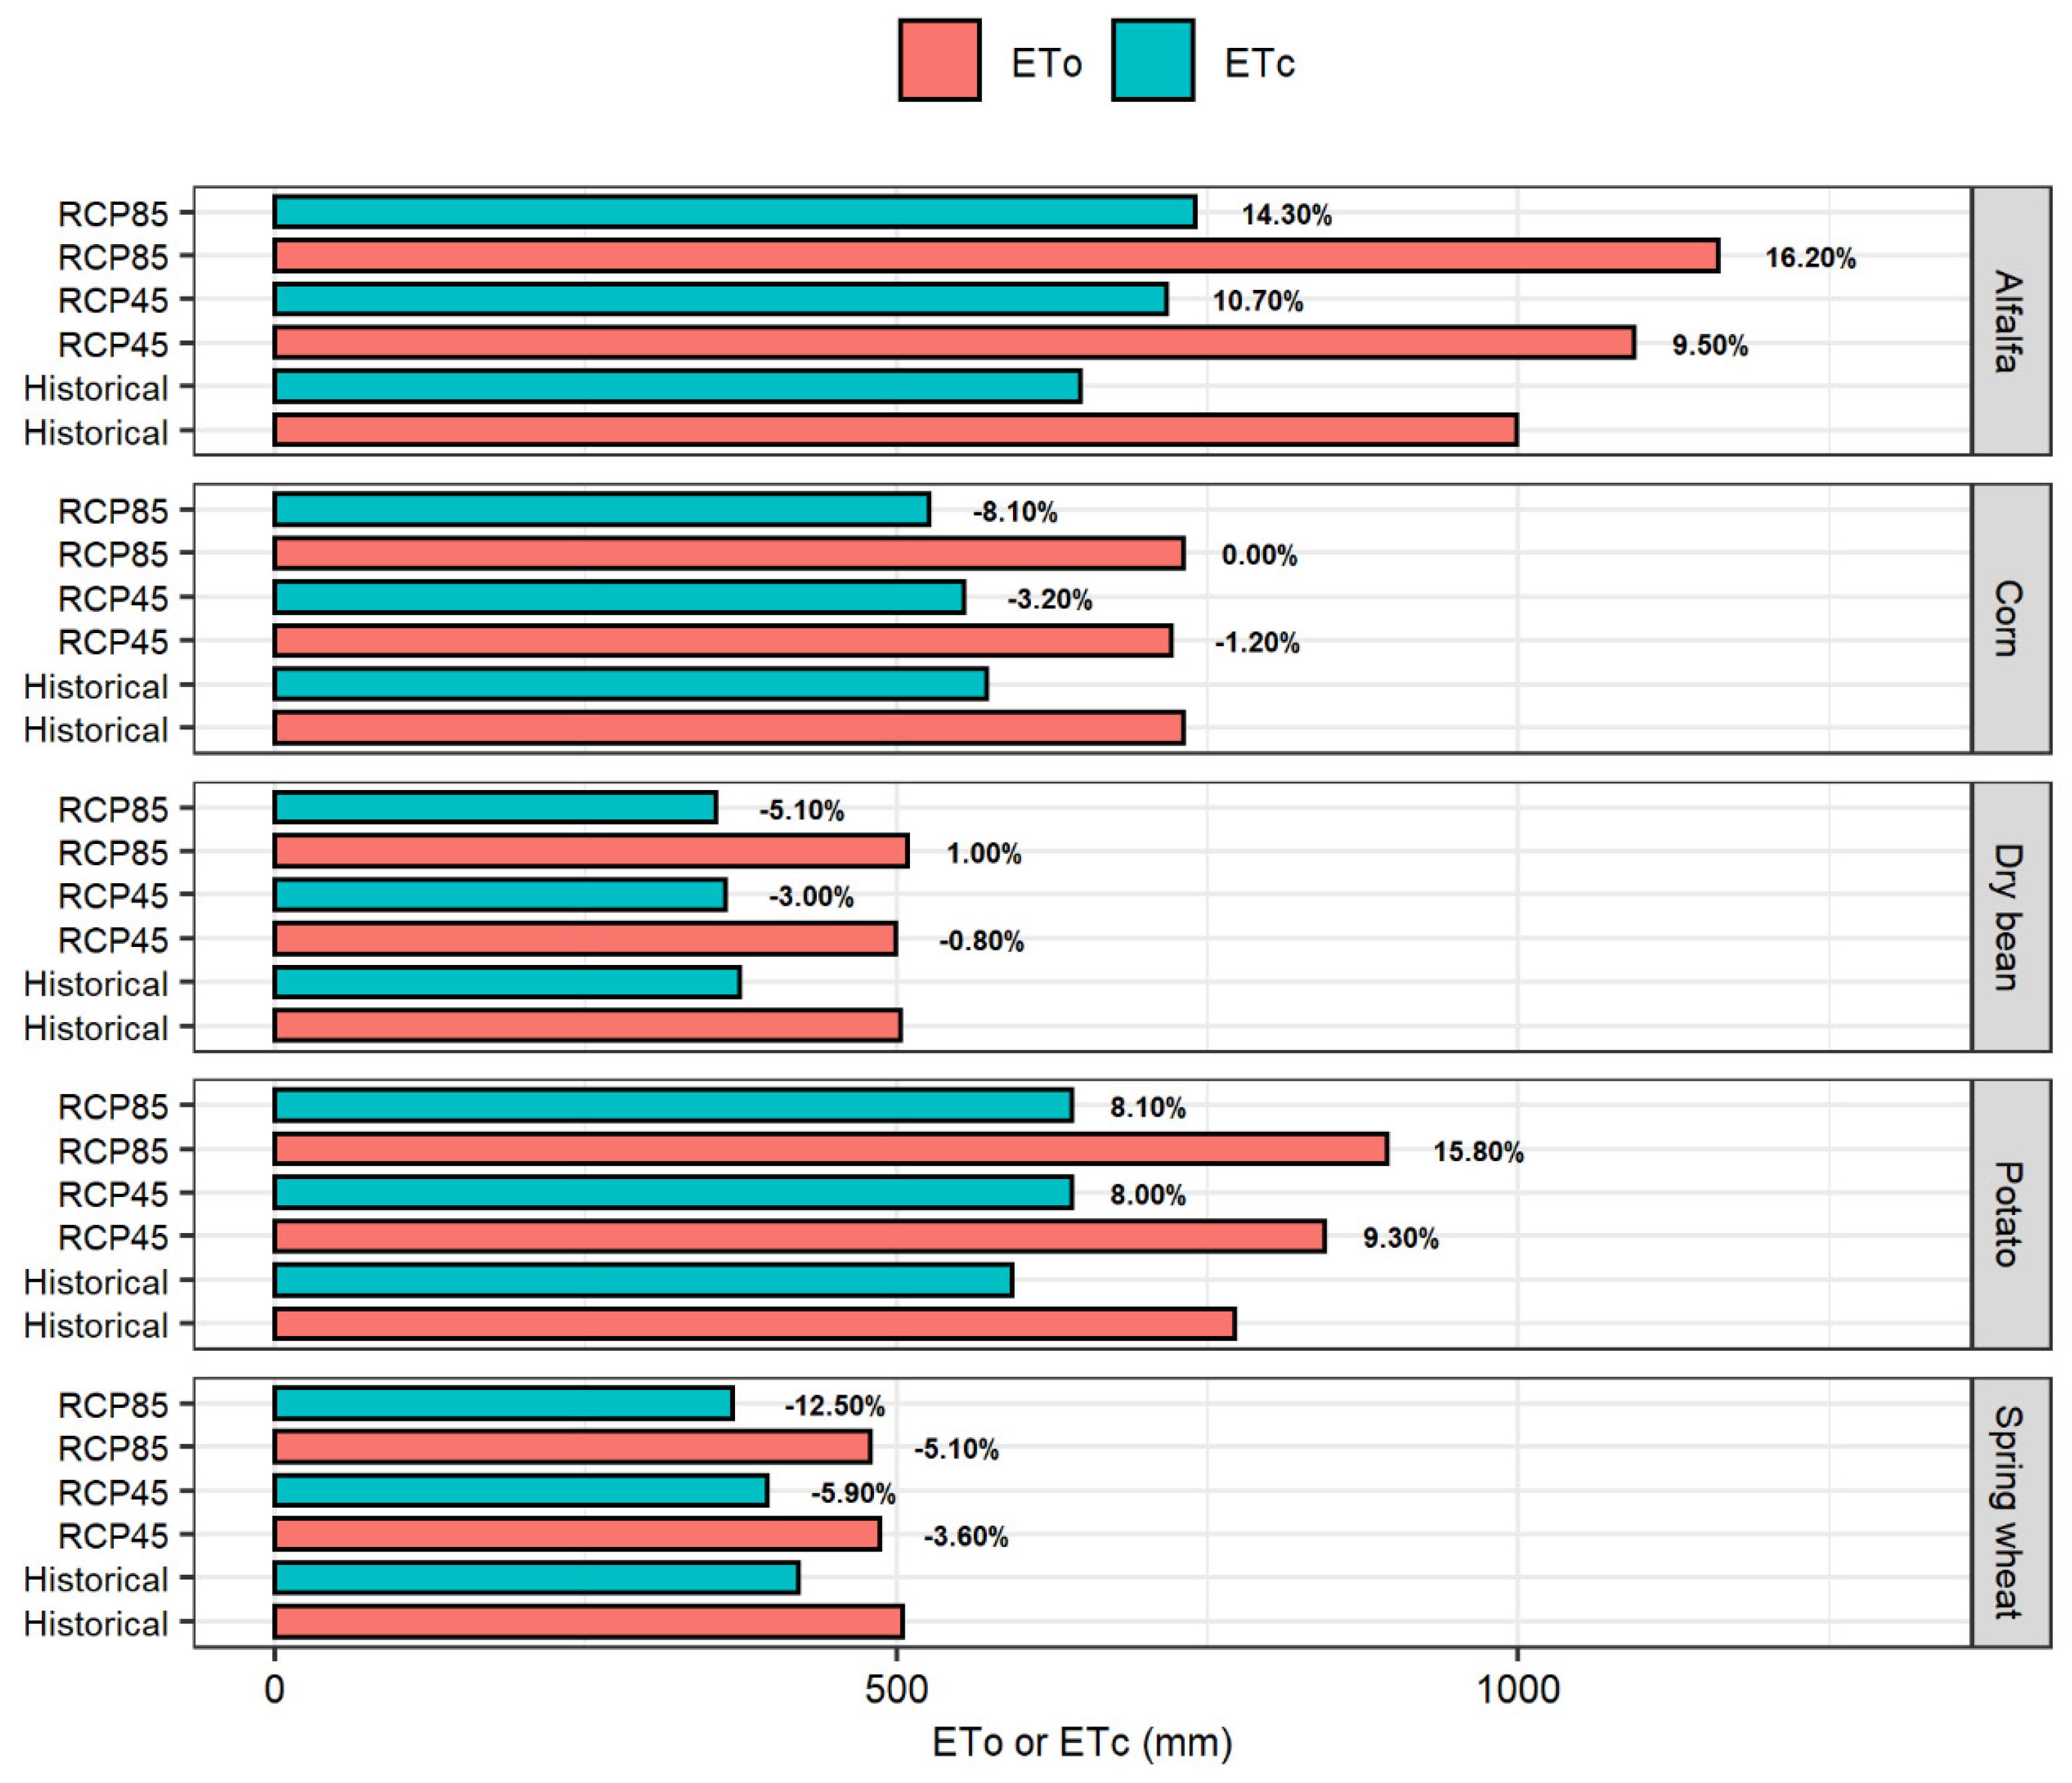
Figure 6 presents ETo and ETc accumulation for the cycle length of five crops for the historical and 2090s periods. Our result shows ETo is substantially larger than ETc, more so for the crops with the largest cycle lengths, with the highest difference for alfalfa (376 mm for RCP4.5 and 420 mm for RCP8.5). The lowest difference (spring wheat) is still considerable (90 mm for RCP4.5 and 110 mm for RCP8.5). These results highlight the difference between ETo and ETc. ETo reflects changes in climate with evaporation coming from a static hypothetical reference crop with well-watered canopy and soil surfaces, while ETc accounts for a climate similar to ETo, but with evaporation modulated by changes in cycle length, the gradual canopy development and senescence during the growing season, the effect of atmospheric CO2 on plant growth (significant increase in the case of C3 species) and stomatal conductance (decrease for C3 and C4 species), and other factors such as episodes of crop water stress that may occur even under well-watered conditions or as a result of deficit irrigation management. Because the level modulation is different in historical and future conditions, the projected percentage changes in ETo and ETc (Figure 6) are also different.
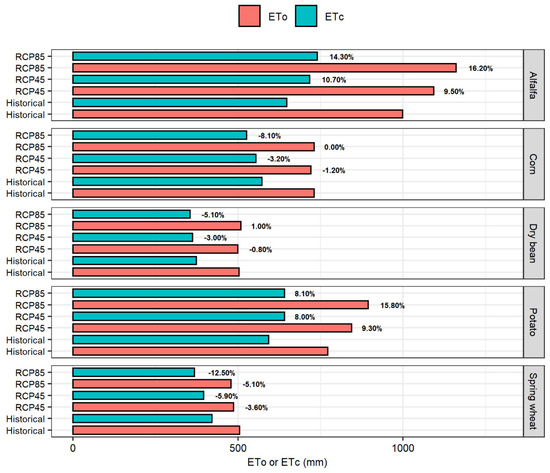
Figure 6.
Reference crop evapotranspiration (ETo) and crop evapotranspiration (ETc) totals for the growing season of five crops during the historical and 2090s periods. Results are for a fixed planting date under transient CO2.
Overall, the difference in the future projection of ETo and ETc highlights that the sole use of ETo when assessing future irrigation requirements could be misleading (overestimating potential changes).
3.4. Atmospheric CO2 Concentration Effect on ETc
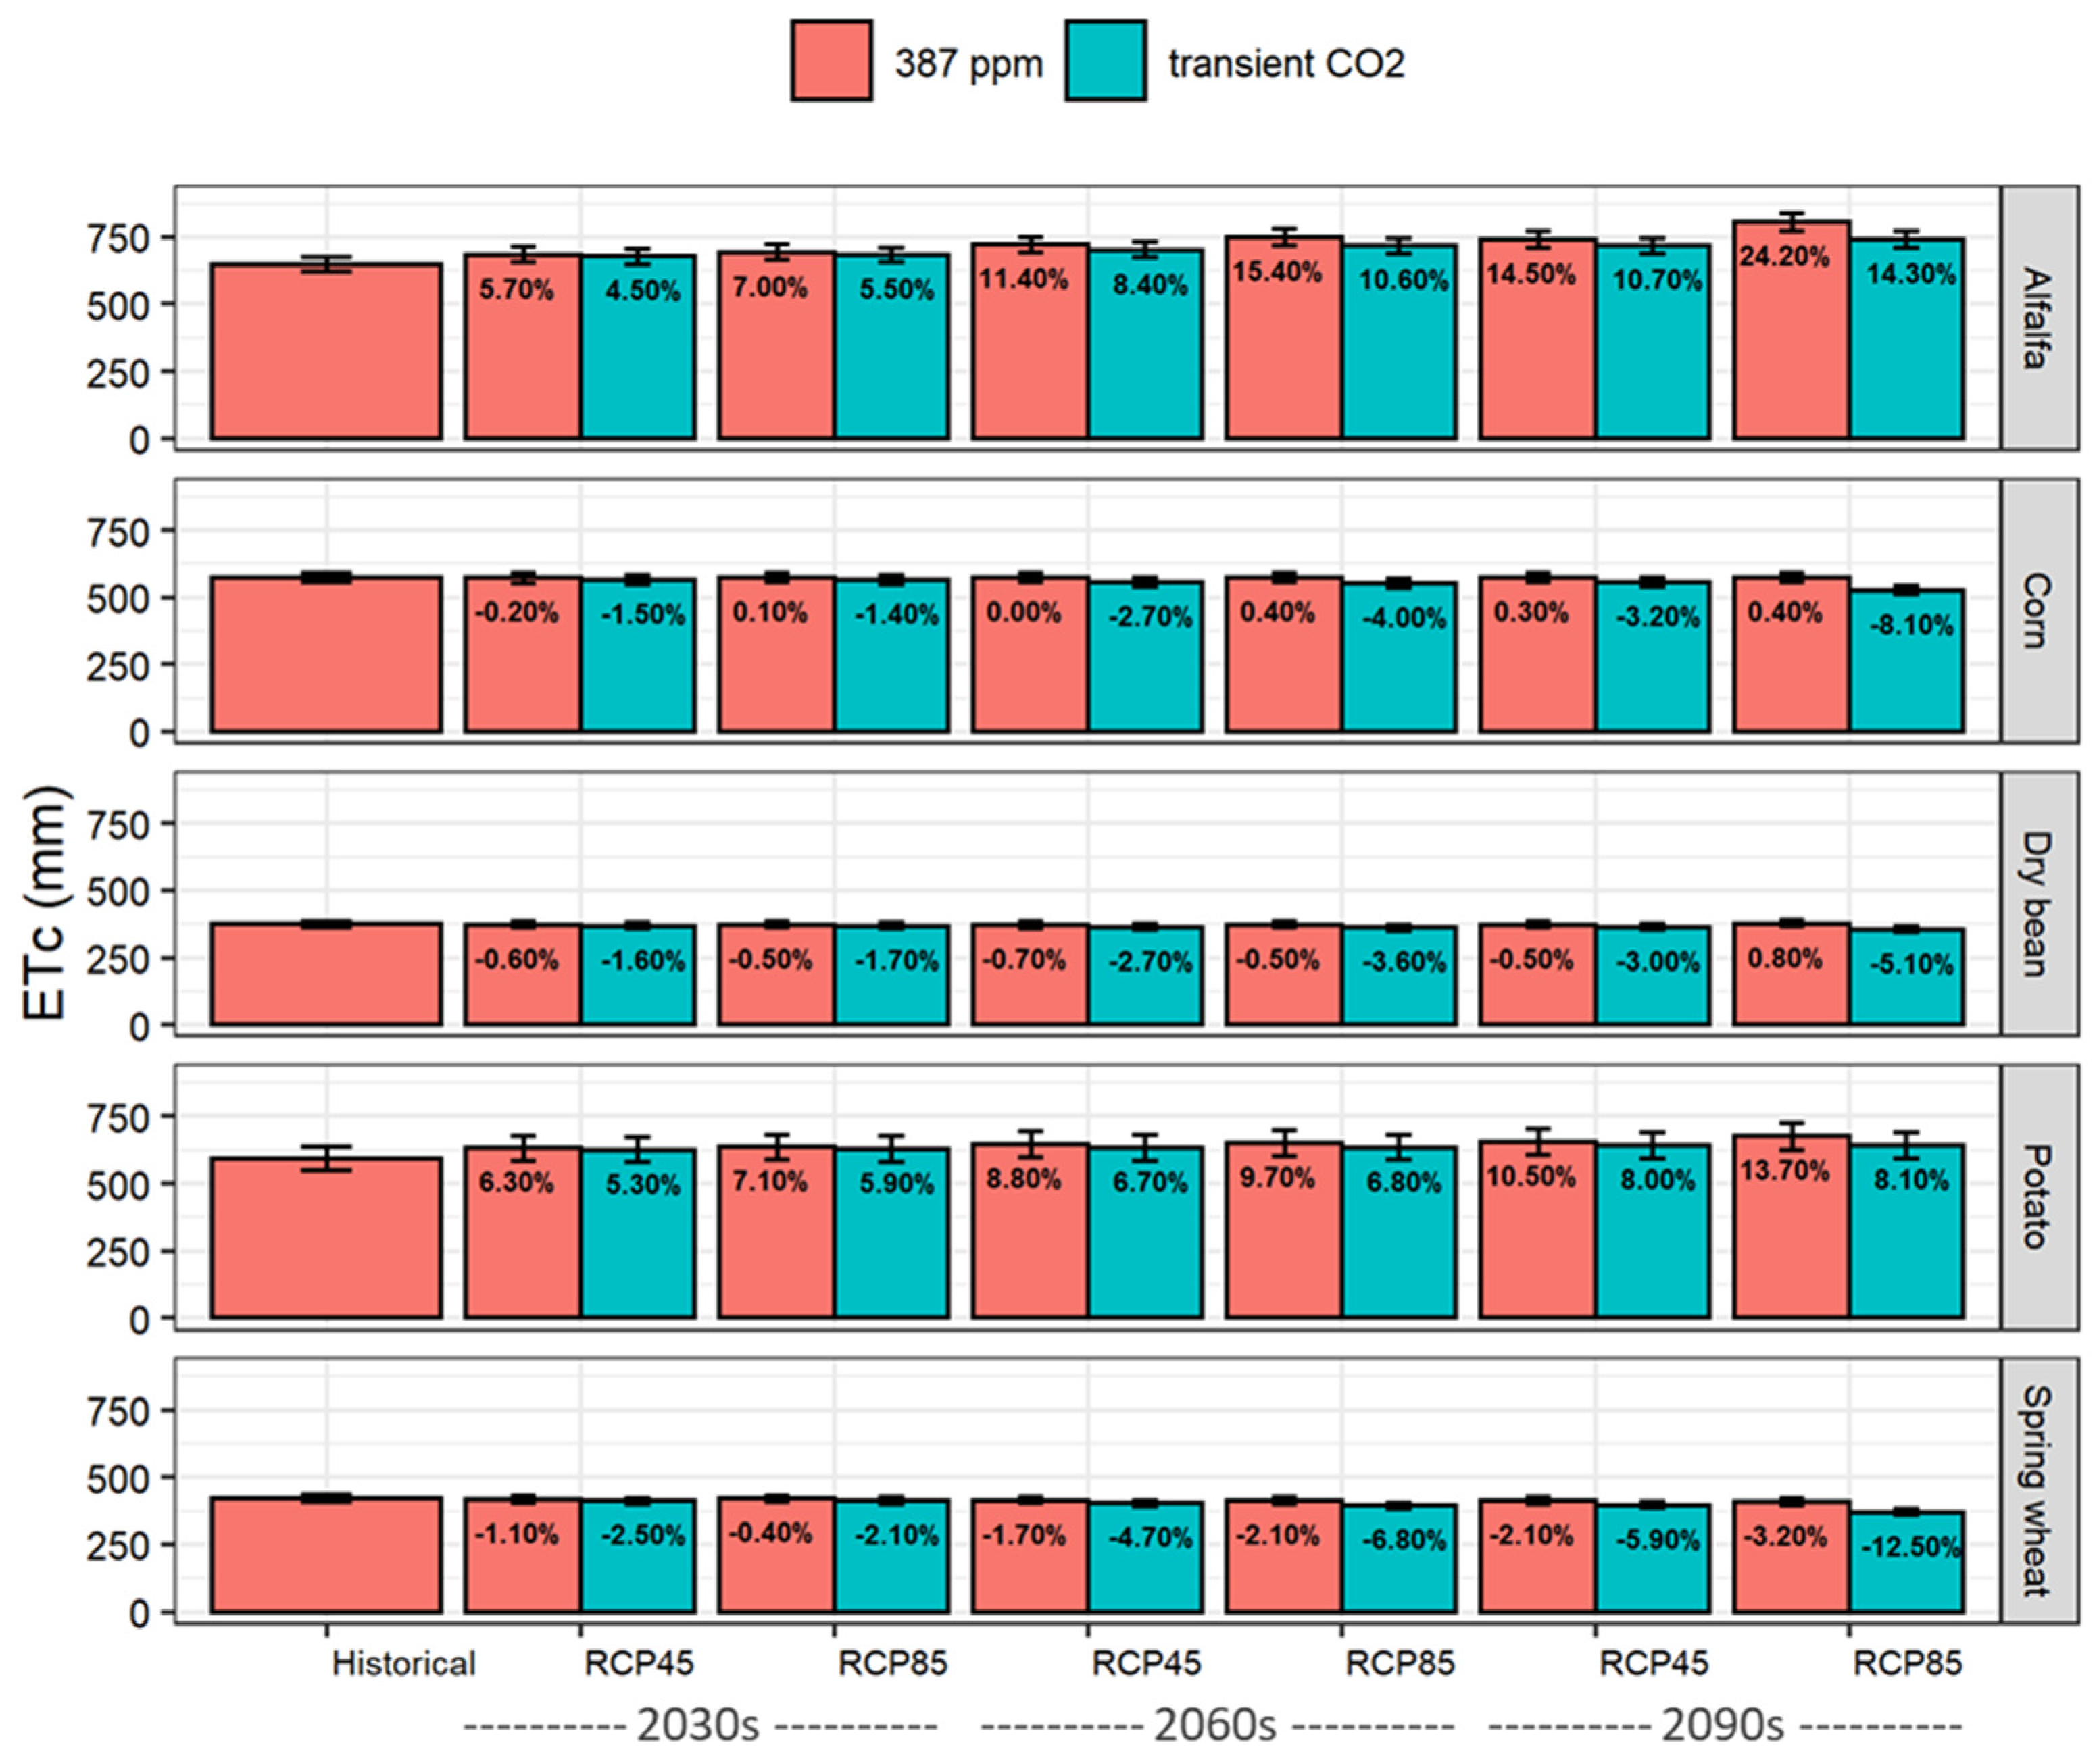
CO2 concentrations impact plant growth, stomatal conductance, and water use, and this effect is often neglected. Therefore, isolating the effect of elevated CO2 on future ETc estimations is important. We accomplish this by comparing future simulated ETc under two conditions: (a) keeping CO2 constant at contemporary levels (i.e., 387 ppm in this study, the average during the historical period, i.e., 1980–2009) and (b) with transient annual CO2 increases until the end of the century (Figure 7, only showing fixed planting date results).

Figure 7.
Comparison of future crop evapotranspiration (ETc) under transient CO2 versus constant contemporary CO2 (387 ppm). Results are for a fixed planting date. Percent numbers correspond to ETc change relative to historical values.
Under constant CO2, with only climate change effects considered, future projected ETc reductions for spring wheat, ranged from −1.1% to −3.2% relative to historical values depending on RCP and future periods. This resulted from warming-caused shortening of the crop cycle length (earlier maturity), counteracting the effect of increased atmospheric evaporative demand. A similar result was obtained for dry bean, except for a small ETc increase of 0.8% during the 2090s. For corn, except for a small ETc decrease in the 2030s (−0.2%), very modest increases from 0% to 0.4% were projected. For potato, with fixed planting and harvest dates, ETc increased in all future periods and RCP (6.3% to 13.7%), illustrating a condition where crop cycle length was not a counteracting factor. Finally, projected ETc increases were largest for alfalfa, a perennial crop whose cycle length increases with warming ranging between 5.7% and 24.2% because both increased atmospheric evaporative demand and cycle length contributed to ETc changes in the same direction.
Elevated CO2 had a mitigating effect on ETc for all crops, RCP, and projection periods resulting in a larger ETc decrease or smaller ETc increase relative to constant CO2. For alfalfa (longest cycle length), elevated CO2 attenuated ETc increase in the range 4.5% to 14.3%, and for potato (fixed cycle length) in the range 5.3% to 8.1%. All other crops had a substantial decrease, fluctuating from −1.5% to −8.1% (corn), −1.6% to −5.1% (dry bean), and −2.5% to −12.5% (spring wheat). This outcome highlights that the CO2 effects cannot be ignored when projecting future ETc and NIR.
The variation of ETc in different directions and intensity according to the specifics of each crop-environment interaction illustrates how crop mixes can be a significant factor in projecting regional irrigation requirements in response to climate change. Elevated CO2 has a substantial contribution along with changes to the climate. However, simulating this effect has uncertainties regarding the magnitude of stomatal conductance reduction for different species. Additionally, increased canopy temperature under a warming climate could enlarge the vapor pressure difference between the plant canopy and surrounding atmosphere and increase ETc, an aspect not accounted for in our simulations. Nevertheless, experimental evidence in fields crops shows that stomatal conductance is reduced by elevated CO2 [40]; reduction is quantified by Ainsworth and Rogers [60] as ~22% averaged across all plant species evaluated in a meta-analysis of FACE experiments with elevated CO2 of 567 ppm compared to ambient levels (366 ppm).
Water consumption is also reduced with elevated CO2. Bindi et al. [44] conducted a FACE experiment in Italy with potato and reported a mean daily ETc of 7.22 (5.90) mm day−1 with ambient CO2 of 360 ppm and 6.58 (4.98) mm day−1 at elevated CO2 of 550 ppm; the numbers in parentheses corresponding to a second experimental year. The reduced daily ETc resulted in seasonal ETc reductions of 8.9% and 15.6% in each year, but any possible effects of growing cycle length reduction were not reported. A FACE experiment with corn in Germany showed that the crop needed approximately one-quarter less water if CO2 increased by 170 ppm [61]. On the other hand, Kimball et al. [40], by conducting FACE experiments with several crops, indicated that the effect of elevated CO2 (~360 ppm ambient and ~550 ppm elevated) on ETc is a combination of reduction of stomatal conductance and increase in leaf area and canopy temperature, resulting in ETc reductions (e.g., <2% in cotton, and ~3.6% to 7% in wheat depending on the method of ETc determination).
FACE reports on changes in stomatal conductance and ETc are usually for CO2 increases of about 190 ppm over ambient levels (~360 ppm), while RCP scenarios project 560 ppm for RCP4.5, similar to elevated CO2 in FACE experiments, but a much larger increase (>1200 ppm) for RCP8.5. The results of this study and the evidence from FACE experiments indicate that CO2 effects cannot be ignored in future projections of ETc and NIR, as also argued by Deryng et al. [22].
3.5. Effect of Planting Dates on ETc
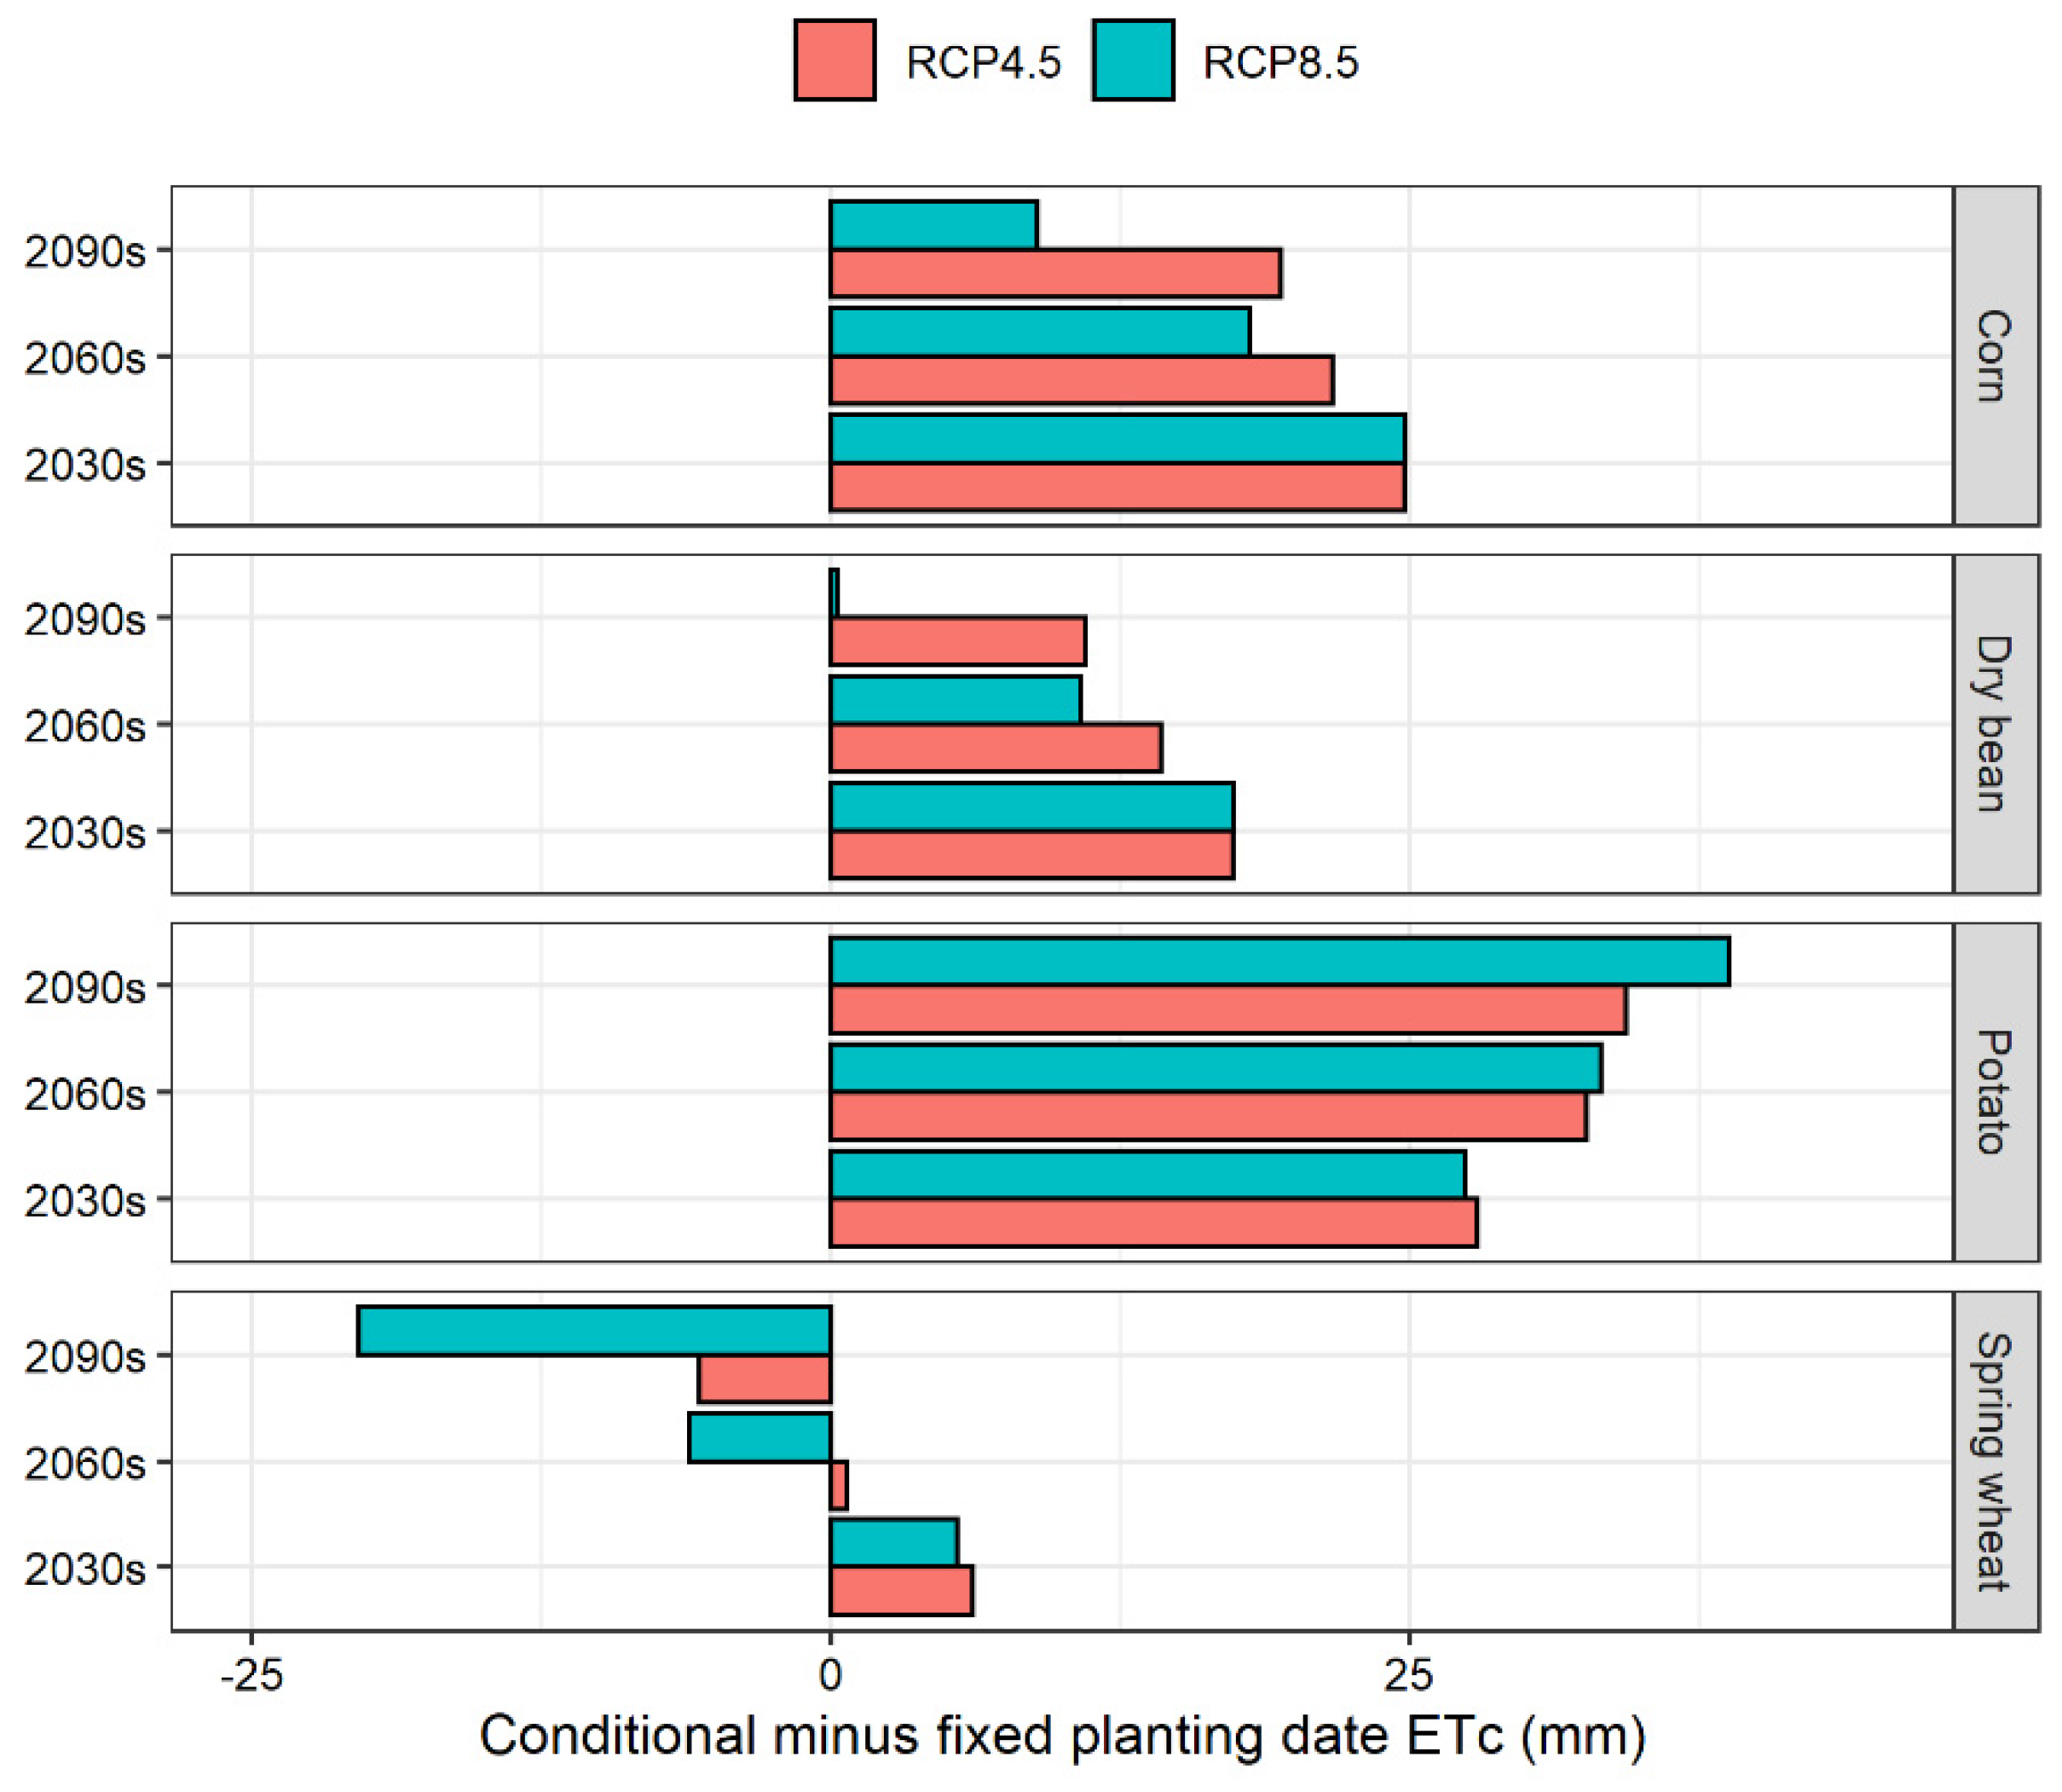
Figure 8 summarizes projected future ETc changes when conditional and fixed planting date scenarios are compared for the four annual crops. Except for some cases with spring wheat, the conditional planting scenario normally causes higher ETc than fixed planting. The magnitude of the increase in ETc by conditional planting depends on the crop: potato > corn > dry bean > spring wheat, the latter switching to lower ETc by midcentury. The position of the growing cycle in the year plays an important role in the ETc differences between the two planting modes. The start of the crop cycle is much earlier with conditional planting: −24 to −25 days (corn), −20 days (dry bean), −27 to −36 (potato), and −36 to −37 days (spring wheat); while the end of the cycle is also earlier, fluctuating from −17 to −41 days for all crops, RCP, and periods, except potato that has a fixed harvest date for both planting modes (Table 4). Despite earlier start and end of cycles under conditional planting, the total length of the cycle for all crops was always larger than under fixed planting mode (Table 4), counteracting the effect of cooler temperatures of the earlier growing season.

Figure 8.
Difference in projected future crop evapotranspiration (ETc) between conditional and fixed planting date (positive values means conditional planting date mode has higher ETc than fixed planting mode, and vice versa).
As illustrated by these results, crop type and planting decisions can have an important influence on ETc, not only on the magnitude but also in the direction of change. The combination of crop type, planting decisions and elevated CO2 produce a variety of different future outcomes that cannot be assessed by ETo alone.
3.6. Changes in Net Irrigation Requirement (NIR)
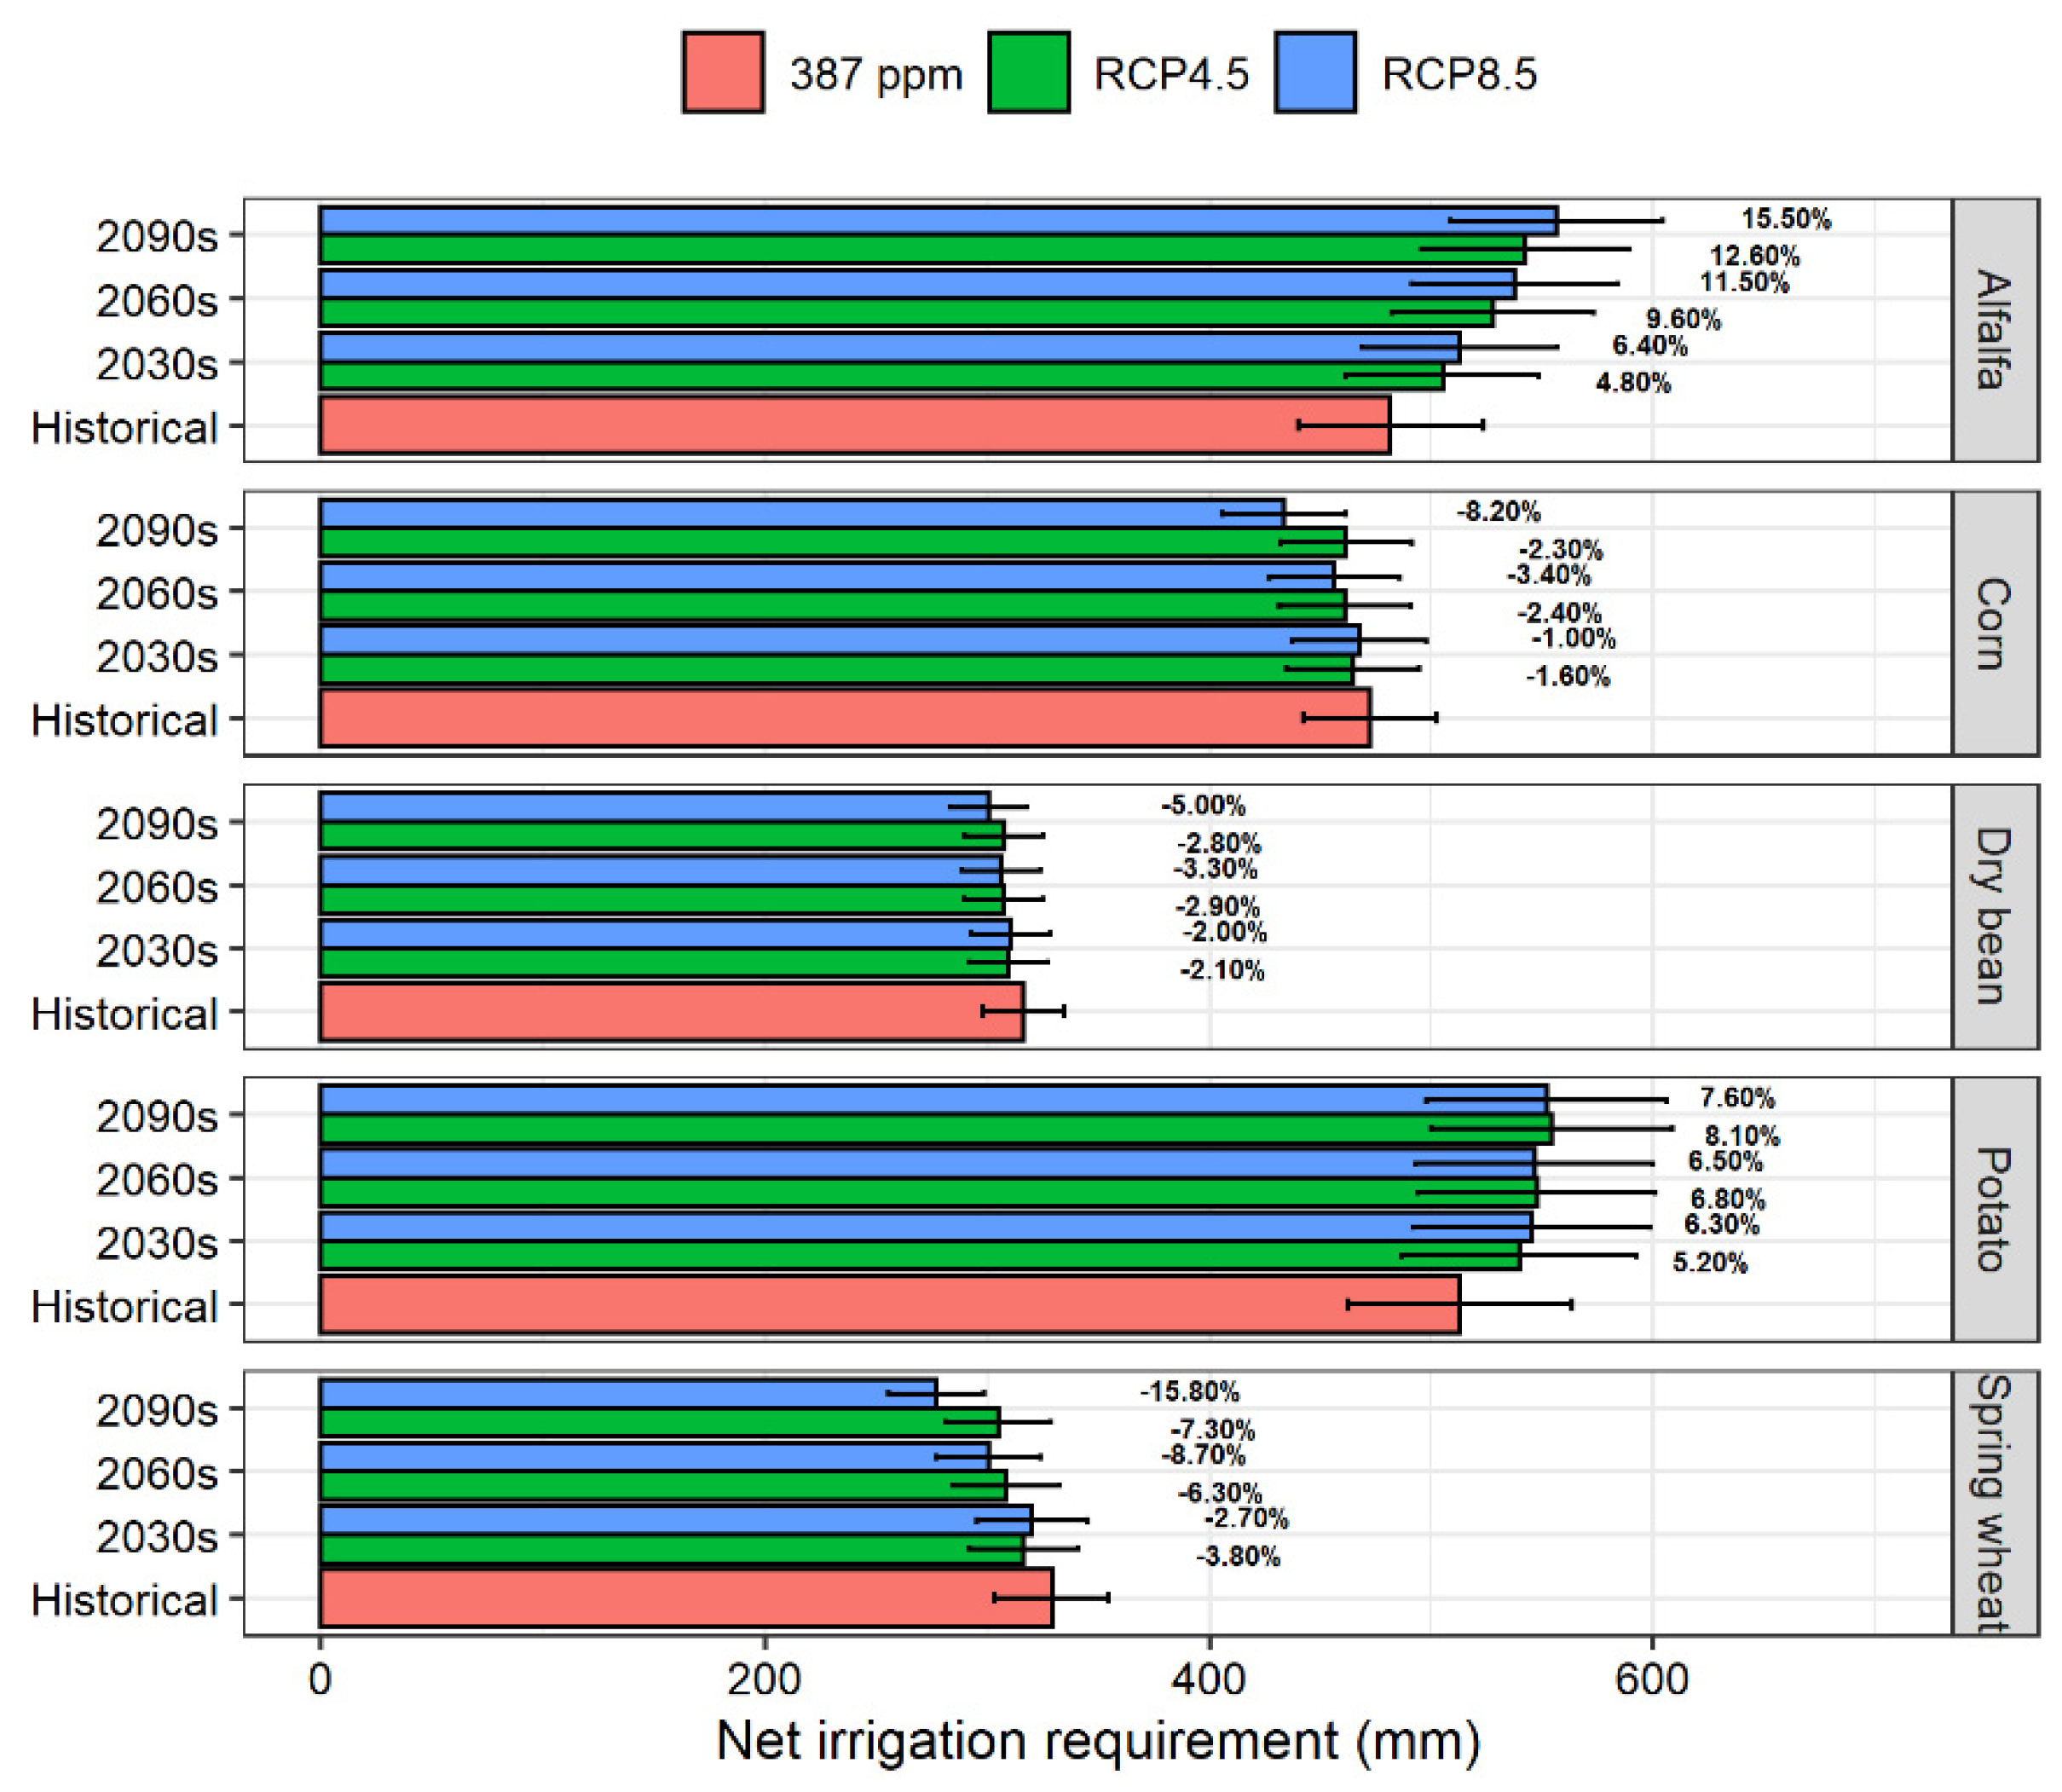
With the background introduced thus far, Figure 9 introduces the changes in NIR expected as a result of climate change and elevated CO2. For simplicity, only the fixed planting date scenario is used. Percent numbers in each bar correspond to changes with respect to the historical period.
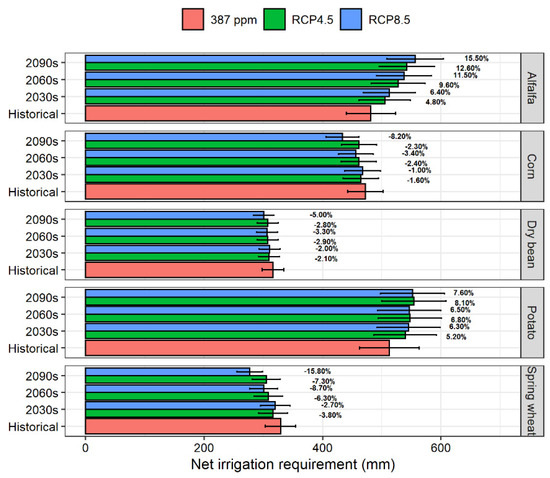
Figure 9.
Historical and future net irrigation requirements for alfalfa, corn, dry bean, potato, and spring wheat. Results are for fixed planting date and transient CO2 concentration under both RCP. Numbers associated with each bar correspond to percent change with respect to historical values.
As expected, NIR (Figure 9) for the five crops follows a similar trend as ETc (Figure 6). Our arid study region receives little precipitation in the growing season (Figure 4), with annual precipitation concentrated in the winter and early spring [62], and with irrigation as a significant contributor to ETc. Therefore, the trends in NIR can be expected to closely track that of ETc. Historically, potato, corn, and alfalfa are the largest water users, while spring wheat and dry bean, the lowest. Projecting towards the end of the century, alfalfa and potato will have the largest increase, 12.6–15.5%, and 7.6–8.1%, respectively, while corn, dry bean, and spring wheat will experience important reductions in their irrigation requirements. All these outcomes are mainly related to changes in the cycle lengths (Table 4), elevated CO2 effects, and a minor contribution from an increase in precipitation. Regions with larger precipitation and with a different annual distribution will see NIR trends that drift away from ETc trends. Regardless, crop mixes and their biophysical responses to climate change and elevated CO2 will require careful consideration when projecting changes in NIR.
3.7. Overall Considerations
Our results indicate that ETc may not necessarily increase under climate change as commonly assumed and generally reported. ETc estimates are a complex result of competing biophysical processes; effects of increasing temperature and reduced solar radiation, shortened crop growth cycles (except alfalfa, a perennial crop) with accelerated plant growth under warmer temperatures, and higher canopy resistance under elevated CO2 conditions that can cumulatively lead to a decreasing trend in ETc. We demonstrate that the variable considered (i.e., ETo, ETc, and NIR), assumptions and restrictions around shifts in planting and harvests dates, and assumptions on ETc responses to elevated CO2 impact both the magnitude and the direction of projected changes to irrigation requirements. Therefore, results from different studies cannot be generalized or compared without scrutiny of these assumptions. A note of caution is that water requirement projections solely based on changes in atmospheric evaporative demand, typically represented by ETo, and ignoring the type of crops on the ground, can be misleading. Factors such as the fraction of the growing season occupied by specific crops, the timing and extent of green canopy development and senescence, root depth and distribution, the type of photosynthesis biochemistry in plant carbon assimilation (C3 versus C4), relative crop responses to CO2, and other factors such as agronomic management, irrigation management, and soil water holding capacity, all play a role in defining responses and outcomes associated with climate change.
Elevated future CO2 levels can be a larger driver of ETc and NIR changes than meteorological variables in certain contexts; therefore, it is important not to ignore these effects despite the uncertainty around the nature of the relationship between elevated CO2 levels and ETc. Net ETc response is affected by competing effects: warmer temperatures increasing atmospheric evaporation demand, reduced solar radiation decreasing atmospheric demand, and changes in both variables varying in space and time. There is minimal discussion in literature around how potential changes in solar radiation drive ETc and NIR shifts, and this aspect needs further consideration. Changes in crop growth cycles are an indirect effect of warming, and careful consideration of assumptions and restrictions around planting and harvest conditions is important to correctly capture the net response. Given the importance of crop growth cycles and the multiple competing/compensating biophysical effects, it is important to use biophysically driven methods that can incorporate these effects.
Since multiple factors can act in compensating ways to get the net effect, there is a need to quantify not just the net effect but isolate the impact of each driver under different contexts. Simulation platforms such as those used in this study lend themselves well to future work that can isolate the contribution of drivers to net changes in ETc and NIR.
As shown, ETc and NIR responses are crop specific and regional crop mixes and expected changes to them will affect aggregated irrigation water requirements. Although not discussed here, potential opportunities for double cropping, as the length of a frost-free season increases under warming, could also play a role in future irrigation requirements.
The selection of irrigation methods and management may also play a role, albeit small. The efficiency of these methods was not a factor in the NIR analysis, but more frequent irrigation can increase soil water evaporation, over canopy irrigation (e.g., center pivots) can reduce crop transpiration via increased air humidity, and drip irrigation can eliminate soil water evaporation, all affecting ETc changes. Furthermore, management strategies such as deficit irrigation, whose economic feasibility must be analyzed case by case, play a role in reducing net irrigation requirements and can be a factor to consider in certain contexts. Also, irrigation applications not intended to provide for crop transpiration, for example, to mitigate summer heat and spring frost events, were not considered in this study, although these extreme events might happen with more frequency in the future.
A final consideration that cannot be ignored is the progression of climate change as given by the choice of IPCC representative concentration pathways (RCP) in irrigation requirement projections. As done in this study, it is customary to evaluate impacts using RCP4.5 and RCP8.5, but other RCP are also available, i.e., RCP6.0 and RCP2.6. The RCP8.5 represents climate change in a world where greenhouse gas emissions are essentially unabated. However, recent agreements such as those obtained from the Paris Accord in 2015 [63] and the Glasgow meeting of world leaders in 2021 [64], provide a more hopeful framework for climate change expectations. The current calls are for the reduction of greenhouse gas emissions, eventually reaching net-zero-emission by midcentury, to stabilize global temperature and not exceed 1.5 °C to 2 °C above pre-industrial levels. However, given that global temperature was 1.2 °C above pre-industrial levels in 2020, and the inherent difficulties in mobilizing the planet behind these goals, it is unclear to what extent humans will succeed in meeting them. Considering that global temperature is projected to increase 2 °C to 3 °C above pre-industrial levels by the end of the century under the RCP4.5 scenario, projections in this study based on this RCP scenario are probably closer to realization if mitigation steps are undertaken.
4. Conclusions
Utilizing climate projections from 15 CMIP5 GCM and factor-control simulation experiments, our study indicates that there can be a wide range of projected changes in ETc as compared to the historical baseline (1980 to 2009). These changes depend on the crop type, assumptions around atmospheric CO2 concentration and adaptation scenario related to planting dates. For example, under the RCP8.5 climate change scenario for the 2090s timeframe (including its corresponding atmospheric CO2 and without planting date adaptation), ETc of potato and alfalfa will increase by +8.1% and +14.3% respectively, while dry bean, corn, and spring wheat will decrease by −5.1%, −8.1%, and −12.5%, respectively. Under the CO2 fertilization effect, all crops will have lower ETc with elevated CO2 scenarios than the fixed CO2 (i.e., average 387 ppm during the period 1980–2009). In the 2090s, the average decrease of ETc due to the CO2 fertilization effect is −4.2%, ranging from the lowest −1.5% (spring wheat) to the highest −6.1% (corn). Adaptation to climate change via earlier planting (i.e., conditional planting date) typically increases ETc, except for spring wheat. On average for the 2090s, the conditional planting scenario increases ETc by +6.4 mm (dry bean), +16.7 mm (corn), and +37.6 mm (potato), while decreasing ETc by −11.7 mm for spring wheat. With conditional planting scenarios for the 2090s, all annual crops can be planted 20 (dry bean) to 36 days (potato and spring wheat) earlier and have an earlier harvest (17 to 41 days earlier) as well. All crops will experience a longer total growing season with conditional planting as compared to fixed planting.
The changes in ETc can be partially explained by the ETo, but not entirely. For example, rising air temperatures and increasing vapor pressure deficit increase ETo by 12.6% in the 2090s from the historical baseline period; this increase does not necessarily transfer into ETc entirely because of the warming effect on the growing season and crop growth, and the CO2 fertilization effect on canopy conductance as mentioned earlier. Therefore, caution is required when using ETo to represent crop water demand in the future. Because of the aridity in our study area, the net irrigation demand closely follows the trends and magnitude of change in ETc.
Our study indicates that planting schedules and crop types, together with future climate change, will control the projected net irrigation demands. Given the crop-specific nature of the response, assumptions around adaptations to climate change (e.g., crop choice and crop mix) can increase the uncertainty in forecasting long-term agricultural water use over large regions. Therefore, integrating economic and agent-based land-use models may help confine the uncertainty scope. The CO2 fertilization effect on crop water use should not be ignored. More field observations and lab experiments to understand its long-term performance and crop-specific response are critical.
Author Contributions
Conceptualization, F.V.S., C.O.S. and M.L.; methodology, F.V.S., C.O.S. and M.L.; software, C.O.S. and R.L.N.; validation, F.V.S., C.O.S. and M.L.; formal analysis, F.V.S., C.O.S., K.R. and M.L.; investigation, F.V.S., C.O.S., K.R. and M.L.; resources, C.O.S.; data curation, R.L.N.; writing—original draft preparation, F.V.S., C.O.S., K.R. and M.L.; writing—review and editing, F.V.S., C.O.S., K.R. and M.L.; visualization, F.V.S., C.O.S., K.R. and M.L.; supervision, C.O.S. project administration, C.O.S., funding acquisition, C.O.S. All authors have read and agreed to the published version of the manuscript.
Funding
This study was funded by the Washington State Department of Ecology’s Office of Columbia River Award No. WROCR1921WASTUN00010 and by the United States Department of Agriculture (USDA), National Institute of Food and Agriculture (NIFA) Grant Number 1016467.
Institutional Review Board Statement
Not applicable.
Informed Consent Statement
Not applicable.
Data Availability Statement
The data presented in this study are available on request from the corresponding author.
Conflicts of Interest
The authors declare no conflict of interest.
Abbreviations
| CBP | Columbia River Project |
| CMIP5 | Coupled Model Intercomparison Project Phase 5 |
| ET | Evapotranspiration |
| ETo | Reference evapotranspiration |
| ETc | Crop evapotranspiration |
| ETp | Potential evapotranspiration |
| FACE | Free-air concentration enrichment |
| FAO | Food and Agriculture Organization of the United Nations |
| GCC | Green crop canopy |
| GCM | General Circulation Models |
| IPCC | Intergovernmental Panel on Climate Change |
| Kc | Crop coefficient |
| NLDAS-2 | Phase 2 of the North American Land Data Assimilation System |
| NIR | Net irrigation requirement |
| NRH | Non-rectangular hyperbola |
| PRISM | Parameter-elevation Relationships on Independent Slopes Model |
| RCP | Representative Concentration Pathways |
| RBG | Relative biomass gain |
| SWAT | Soil & Water Assessment Tool |
References
- Scarpare, F.V.; Hernandes, T.A.D.; Ruiz-Corrêa, S.T.; Picoli, M.P.A.; Scanlon, B.R.; Chagas, M.F.; Duft, D.G.; Cardoso, T.F. Sugarcane land use and water resources assessment in the expansion area in Brazil. J. Clean. Prod. 2016, 133, 1318–1327. [Google Scholar] [CrossRef]
- Marin, F.R.; Jones, J.W.; Singles, A.; Royce, F.; Assad, E.D.; Pellegrino, G.Q.; Justino, F. Climate change impacts on sugarcane attainable yield in southern Brazil. Clim. Chang. 2013, 177, 227–239. [Google Scholar] [CrossRef] [Green Version]
- Stöckle, C.O.; Nelson, R.L.; Higgins, S.; Brunner, J.; Grove, G.; Boydston, R.; Whiting, M.; Kruger, C. Assessment of climate change impact on Eastern Washington agriculture. Clim. Chang. 2010, 102, 77–102. [Google Scholar] [CrossRef] [Green Version]
- Izaurralde, R.C.; Rosenberg, N.J.; Brown, R.A.; Thomson, A.M. Integrated assessment of Hadley Center (HadCM2) climate-change impacts on agricultural productivity and irrigation water supply in the conterminous United States: Part II. Regional agricultural production in 2030 and 2095. Agric. For. Meteorol. 2003, 117, 97–122. [Google Scholar] [CrossRef]
- Katerji, N.; Rana, G.; Ferrara, R.M. Actual evapotranspiration for a reference crop within measured and future changing climate periods in the Mediterranean region. Theor. Appl. Climatol. 2017, 93, 129–923. [Google Scholar] [CrossRef]
- Allen, R.G.; Pereira, L.S.; Raes, D.; Smith, M. Crop Evapotranspiration—Guidelines for Computing Crop Water Requirements-FAO Irrigation and drainage paper 56. Fao Rome 1998, 300, D05109. [Google Scholar]
- Khalil, A.A. Effect of climate change on evapotranspiration in Egypt. Researcher 2013, 5, 7–12. [Google Scholar]
- Tao, X.; Chen, H.; Xu, C.; Hou, Y.; Jie, M. Analysis and prediction of reference evapotranspiration with climate change in Xiangjiang River Basin, China. Water Sci. Eng. 2015, 8, 273–281. [Google Scholar] [CrossRef] [Green Version]
- Sunil, A.; Depthi, B.; Miralkar, A.B.; Adarsh, S. Modeling future irrigation water demands in the context of climate change: A case study of Jayakwadi command area, India. Model. Earth Syst. Environ. 2020, 7, 1963–1977. [Google Scholar] [CrossRef]
- Ashoften, P.S.; Bozorg-Haddad, O.; Loáiciga, H.A. Development of adaptive strategies for irrigation water demand management under climate change. J. Irrig. Drain Eng. 2017, 143, 04016077. [Google Scholar] [CrossRef]
- Liu, Z.; Lu, J.; Huang, J.; Chen, X. Projection of reference crop evapotranspiration under future climate change in Poyang Lake watershed, China. J. Hydrol. Eng. 2021, 26, 05020042. [Google Scholar] [CrossRef]
- Roba, N.T.; Kassa, A.K.; Geleta, D.M. Modeling climate change impacts on crop water demand, middle Awash River basin, case study of Berehet woreda. Water Pract. Technol. 2021, 16, 864–885. [Google Scholar] [CrossRef]
- Gorguner, M.; Kavvas, M.L. Modeling impacts of future climate change on reservoir storages and irrigation water demands in a Mediterranean basin. Sci. Total Environ. 2020, 748, 141246. [Google Scholar] [CrossRef] [PubMed]
- Saadi, S.; Todorovic, M.; Tanasijevic, L.; Prereira, L.S.; Pizzigalli, C.; Lionello, P. Climate change and Mediterranean agriculture: Impacts on winter wheat and tomato crop evapotranspiration, irrigation requirements and yield. Agric. Water Manag. 2015, 147, 103–115. [Google Scholar] [CrossRef]
- Li, Z.; Fang, G.; Chen, Y.; Duan, W.; Mukanov, Y. Agricultural water demands in Central Asia under 1.5 °C and 2.0 °C global warming. Agric. Water Manag. 2020, 231, 106020. [Google Scholar] [CrossRef]
- Woznicki, S.A.; Nejadhashemi, A.P.; Parsinejad, M. Climate change and irrigation demand: Uncertainty and adaptation. J. Hydrol. Reg. Stud. 2015, 3, 247–264. [Google Scholar] [CrossRef]
- Chen, X.; Qi, Z.; Gui, D.; Ma, L.; Zeng, F.; Li, L. Simulating impacts of climate change on cotton yield and water requirement using RZWQM2. Agric. Water Manag. 2019, 222, 231–241. [Google Scholar] [CrossRef]
- Rajagopalan, K.; Chinnayakanahalli, K.J.; Stöckle, C.O.; Nelson, R.L.; Kruger, C.E.; Brady, M.P.; Malek, K.; Dinesh, S.T.; Barber, M.E.; Hamlet, A.F.; et al. Impacts of near-term climate change on irrigation demands and crop yields in the Columbia River Basin. Water Resour. Res. 2018, 54, 2152–2182. [Google Scholar] [CrossRef]
- Kimball, B.A.; Boote, K.J.; Hatfield, J.L.; Ahuja, L.R.; Stockle, C.; Archontoulis, S.; Baron, C.; Basso, B.; Bertuzzi, P.; Constantin, J.; et al. Simulation of maize evapotranspiration: An inter-comparison among 29 maize models. Agric. For. Meteorol. 2019, 271, 264–284. [Google Scholar] [CrossRef]
- Stöckle, C.O.; Kemanian, A.R. Can crop models identify critical gaps in genetics, environment, and management interactions? Front. Plant Sci. 2020, 11, 737. [Google Scholar] [CrossRef]
- Pan, S.; Tian, H.; Dangal, S.R.S.; Yang, Q.; Yang, J.; Lu, C.; Tao, B.; Ren, W.; Ouyang, Z. Responses of global terrestrial evapotranspiration to climate change and increasing atmospheric CO2 in the 21st century. Earth’s Future 2015, 3, 15–35. [Google Scholar] [CrossRef]
- Deryng, D.; Elliott, J.; Folberth, C.; Müller, C.; Pugh, T.A.; Boote, K.J.; Conway, D.; Ruane, A.C.; Gerten, D.; Jones, J.W.; et al. Regional disparities in the beneficial effects of rising CO2 concentrations on crop water productivity. Nat. Clim. Chang. 2016, 6, 786–790. [Google Scholar] [CrossRef] [Green Version]
- Washington State Department of Agriculture. Agricultural Land Use. Maps and Data. Available online: https://agr.wa.gov/departments/land-and-water/natural-resources/agricultural-land-use (accessed on 7 September 2021).
- Abatzoglou, J.T. Development of gridded surface meteorological data for ecological applications and modelling. Int. J. Climatol. 2013, 33, 121–131. [Google Scholar] [CrossRef]
- Abatzoglou, J.T.; Brown, T.J. A comparison of statistical downscaling methods suited for wildfire applications. Int. J. Climatol. 2011, 32, 772–780. [Google Scholar] [CrossRef]
- Climatology Lab. Available online: https://www.climatologylab.org/maca.html (accessed on 24 February 2021).
- United States Department of Agriculture. United States General Soil Map (STATSGO2). Available online: https://data.nal.usda.gov/dataset/united-states-general-soil-map-statsgo2 (accessed on 26 August 2021).
- Meinshausen, M.; Smith, S.J.; Calvin, K.; Daniel, J.S.; Kainuma, M.L.T.; Lamarque, J.F.; Matsumoto, K.; Montzka, A.; Raper, S.C.B.; Riahi, K.; et al. The RCP greenhouse gas concentrations and their extensions 1248 from 1765 to 2300. Clim. Chang. 2011, 109, 213–241. [Google Scholar] [CrossRef] [Green Version]
- IPCC AR5 WG1. Climate Change 2013: The Physical Science Basis. In Working Group 1 (WG1) Contribution to the Intergovernmental Panel on Climate Chang. (IPCC) 5th Assessment Report (AR5); Archived from the Original on 12 August 2014; Stocker, T.F., Ed.; Cambridge University Press: Cambridge, UK, 2013. [Google Scholar]
- United States Department of Agriculture. National Agricultural Statistics Service, Field Crops Usual Planting and Harvesting Dates. Available online: https://www.nass.usda.gov/Publications/Todays_Reports/reports/fcdate10.pdf (accessed on 18 August 2021).
- Stöckle, C.O.; Martin, S.A.; Campbell, G.S. CropSyst, a cropping systems simulation model: Water/nitrogen budgets and crop yield. Agric. Syst. 1994, 46, 335–359. [Google Scholar] [CrossRef]
- Stöckle, C.O.; Donatelli, M.; Nelson, R.L. CropSyst, a cropping systems simulation model. Eur. J. Agron. 2003, 18, 289–307. [Google Scholar] [CrossRef]
- Stöckle, C.O.; Kemanian, A.; Nelson, R.L.; Adam, J.C.; Sommer, R.; Carlson, B. CropSyst model evolution: From field to regional to global scales and from research to decision support systems. Environ. Model Softw. 2014, 62, 361–369. [Google Scholar] [CrossRef]
- Wang, E.; Engle, T. Simulation of Phenological Development of Wheat Crops. Agric. Syst. 1998, 58, 1–24. [Google Scholar] [CrossRef]
- Schoving, C.; Stockle, C.O.; Colombet, C.; Champolivier, L.; Debaeke, P.; Maury, P. Combining simple phenotyping and photothermal algorithm for the prediction of soybean phenology: Application to a range of common cultivars grown in Europe. Front. Plant Sci. 2020, 10, 1755. [Google Scholar] [CrossRef] [Green Version]
- Stöckle, C.O.; Jara, J. Modeling transpiration and soil water content from a corn field: 20 min vs. daytime integration step. Agric. For. Meteorol. 1998, 92, 119–130. [Google Scholar] [CrossRef]
- Jara, J.; Stöckle, C.O. Simulation of corn water uptake using models with different levels of process detail. J. Agron. 1999, 91, 256–265. [Google Scholar] [CrossRef]
- Long, S.P.; Ainsworth, E.A.; Leakey, A.D.B.; Nosberger, J.; Ort, D.R. Food for thought: Lower-than-expected crop yield stimulation with rising CO2 concentrations. Science 2006, 312, 1918–1921. [Google Scholar] [CrossRef]
- Ainsworth, E.A.; Long, S.P. What have we learned from 15 years of free-air CO2 enrichment (FACE)? A meta-analytic review of the responses of photosynthesis, canopy properties and plant production to rising CO2. New Phytol. 2005, 165, 351–371. [Google Scholar] [CrossRef] [PubMed]
- Kimball, B.A.; Kobayashi, K.; Bindi, M. Responses of agricultural crops to free air CO2 enrichment. Adv. Agron. 2002, 77, 293–368. [Google Scholar]
- Lobo, F.D.A.; De Barros, M.P.; Dalmagro, H.J.; Dalmolin, Â.C.; Pereira, W.E.; De Souza, E.C.; Vourlitis, G.L.; Ortíz, C.R. Fitting net photosynthetic light-response curves with Microsoft Excel—A critical look at the models. Photosynthetica 2013, 51, 445–456. [Google Scholar] [CrossRef]
- Thornley, J.H.M. Mathematical Models in Plant Physiology; Academic Press: London, UK, 1976. [Google Scholar]
- Miglietta, F.; Magliulo, V.; Bindi, M.; Cerio, L.; Vaccari, F.P.; Loduca, V.; Peressotti, A. Free Air CO2 Enrichment of potato (Solanum tuberosum L.): Development, growth and yield. Glob. Chang. Biol. 1998, 4, 163–172. [Google Scholar] [CrossRef]
- Bindi, M.; Miglietta, F.; Vaccari, F.; Magliulo, E.; Giuntoli, A. Growth and quality responses of potato to elevated [CO2]. In Ecological Studies; Nösberger, J., Long, S.P., Norby, R.J., Stitt, M., Hendrey, G.R., Blum, H., Eds.; Springer: Berlin, Germany, 2006; Volume 187, pp. 105–119. [Google Scholar]
- Ziska, L.H.; Bunce, J.A. Predicting the impact of changing CO2 on crop yields: Some thoughts on food. New Phytol. 2007, 175, 607–618. [Google Scholar] [CrossRef]
- Reuveni, J.; Bugbee, B. Very high CO2 reduces photosynthesis, dark respiration and yield in wheat. Ann. Bot. 1997, 80, 539–546. [Google Scholar] [CrossRef] [PubMed] [Green Version]
- Morison, J.I.L. Intercellular CO2 concentration and stomatal response to CO2. In Stomatal Function; Zeiger, E., Cowan, I.R., Farquhar, G.D., Eds.; Stanford University Press: Redwood City, CA, USA, 1987; pp. 229–251. [Google Scholar]
- Allen, L.H. Plant Responses to rising carbon dioxide and potential interactions with air pollutants. J. Environ. Qual. 1990, 19, 15–34. [Google Scholar] [CrossRef]
- United States Department of Agriculture. National Agricultural Statistics Service. Quick Stats. Available online: https://www.nass.usda.gov/Statistics_by_State/Washington/Publications/Potatoes/index.php (accessed on 20 August 2021).
- Washington State Department of Agriculture. 2020 Washington Annual Statistical Bulletin. Available online: https://www.nass.usda.gov/Statistics_by_State/Washington/Publications/Annual_Statistical_Bulltin/2020/WA_ANN_2020.pdf (accessed on 26 August 2021).
- Washington State Department of Agriculture. Washington Annual Statistical Bulletin. 2017. Available online: https://s3.wp.wsu.edu/uploads/sites/2073/2014/09/WA_Agriculture_annual-bulletin-2017.pdf (accessed on 26 July 2021).
- Parent, B.; Tardieu, F. Temperature responses of developmental processes have not been affected by breeding in different ecological areas for 17 crop species. New Phytol. 2012, 194, 760–774. [Google Scholar] [CrossRef]
- Kremer, C.; Stöckle, C.O.; Kemanian, A.R.; Howell, T. Using a canopy transpiration and photosynthesis model for the evaluation of simple models of crop productivity. In Advances in Agricultural Systems Modeling 1; Ahuja, L.R., Reddy, V.R., Saseendran, S.A., Yu, Q., Eds.; ASA-SSSA-CSSA: Madison, WI, USA, 2008. [Google Scholar]
- Stöckle, C.O.; Kemanian, A.R. Crop radiation capture and use efficiency: A framework for crop growth analysis. In Crop Physiology: Applications for Genetic Improvement and Agronomy; Sadras, V.O., Calderini, D.F., Burlinggton, N.J., Eds.; Elsevier: Amsterdam, The Netherlands, 2009; pp. 145–170. [Google Scholar]
- Wild, M.; Folini, D.; Henschel, F.; Fischer, N.; Müller, B. Projections of long-term changes in solar radiation based on CMIP5 climate models and their influence on energy yields of photovoltaic systems. Sol. Energy 2015, 116, 12–24. [Google Scholar] [CrossRef] [Green Version]
- Getachew, F.; Bayabil, H.K.; Hoogenboom, G.; Teshome, F.T.; Zewdu, E. Irrigation and shifting planting date as climate change adaptation strategies for sorghum. Agric. Water Manag. 2021, 255, 106988. [Google Scholar] [CrossRef]
- Islan, A.; Ahujaa, L.R.; Garcia, L.A.; Ma, L.; Saseendrana, A.S.; Trout, T. Modeling the impacts of climate change on irrigated corn production in the Central Great Plains. Agric. Water Manag. 2012, 110, 94–108. [Google Scholar] [CrossRef]
- Valipour, M.; Bateni, S.M.; Sefidkouhi, M.A.G.; Raeini-Sarjaz, M.R.; Singh, V.P. Complexity of forces driving trend of reference evapotranspiration and signals of climate change. Atmosphere 2020, 11, 1081. [Google Scholar] [CrossRef]
- King, D.A.; Bachelet, D.M.; Symstad, A.J.; Ferschweiler, K. Estimation of potential evapotranspiration from extraterrestrial radiation, air temperature and humidity to assess future climate change effects on the vegetation of the Northern Great Plains, USA. Ecol. Mol. 2015, 297, 86–97. [Google Scholar] [CrossRef] [Green Version]
- Ainsworth, E.A.; Rogers, A. The response of photosynthesis and stomatal conductance to rising [CO2]: Mechanisms and environmental interactions. Plant Cell Environ. 2007, 30, 258–270. [Google Scholar] [CrossRef] [PubMed]
- Manderscheid, R.; Erbs, M.; Weigel, H.J. Interactive effects of free-air CO2 enrichment and drought stress on maize growth. Eur. J. Agron. 2014, 52, 11–21. [Google Scholar] [CrossRef]
- Hall, S.A.; Adam, J.C.; Yourek, M.A.; Whittemore, A.M.; Yorgey, G.G.; Scarpare, F.V.; Liu, M. 2021 Washington State Legislative Report. Columbia River Basin Long-Term Water Supply and Demand Forecast. Publication No. 21-12-006; Washington Department of Ecology: Olympia, WA, USA, 2021; p. 263. Available online: https://fortress.wa.gov/ecy/ezshare/ocr/SupplyDemandForecast.pdf (accessed on 10 December 2021).
- Paris Agreement to the United Nations Framework Convention on Climate Change. T.I.A.S. No. 16-1104. Available online: https://unfccc.int/sites/default/files/resource/parisagreement_publication.pdf (accessed on 12 December 2015).
- COP26. 2021. Available online: https://ukcop26.org/ (accessed on 21 October 2021).
Publisher’s Note: MDPI stays neutral with regard to jurisdictional claims in published maps and institutional affiliations. |
© 2022 by the authors. Licensee MDPI, Basel, Switzerland. This article is an open access article distributed under the terms and conditions of the Creative Commons Attribution (CC BY) license (https://creativecommons.org/licenses/by/4.0/).