
Effects of Wind Barriers on Wind Fields and Vehicle Stability on Bridges

Abstract
:1. Introduction
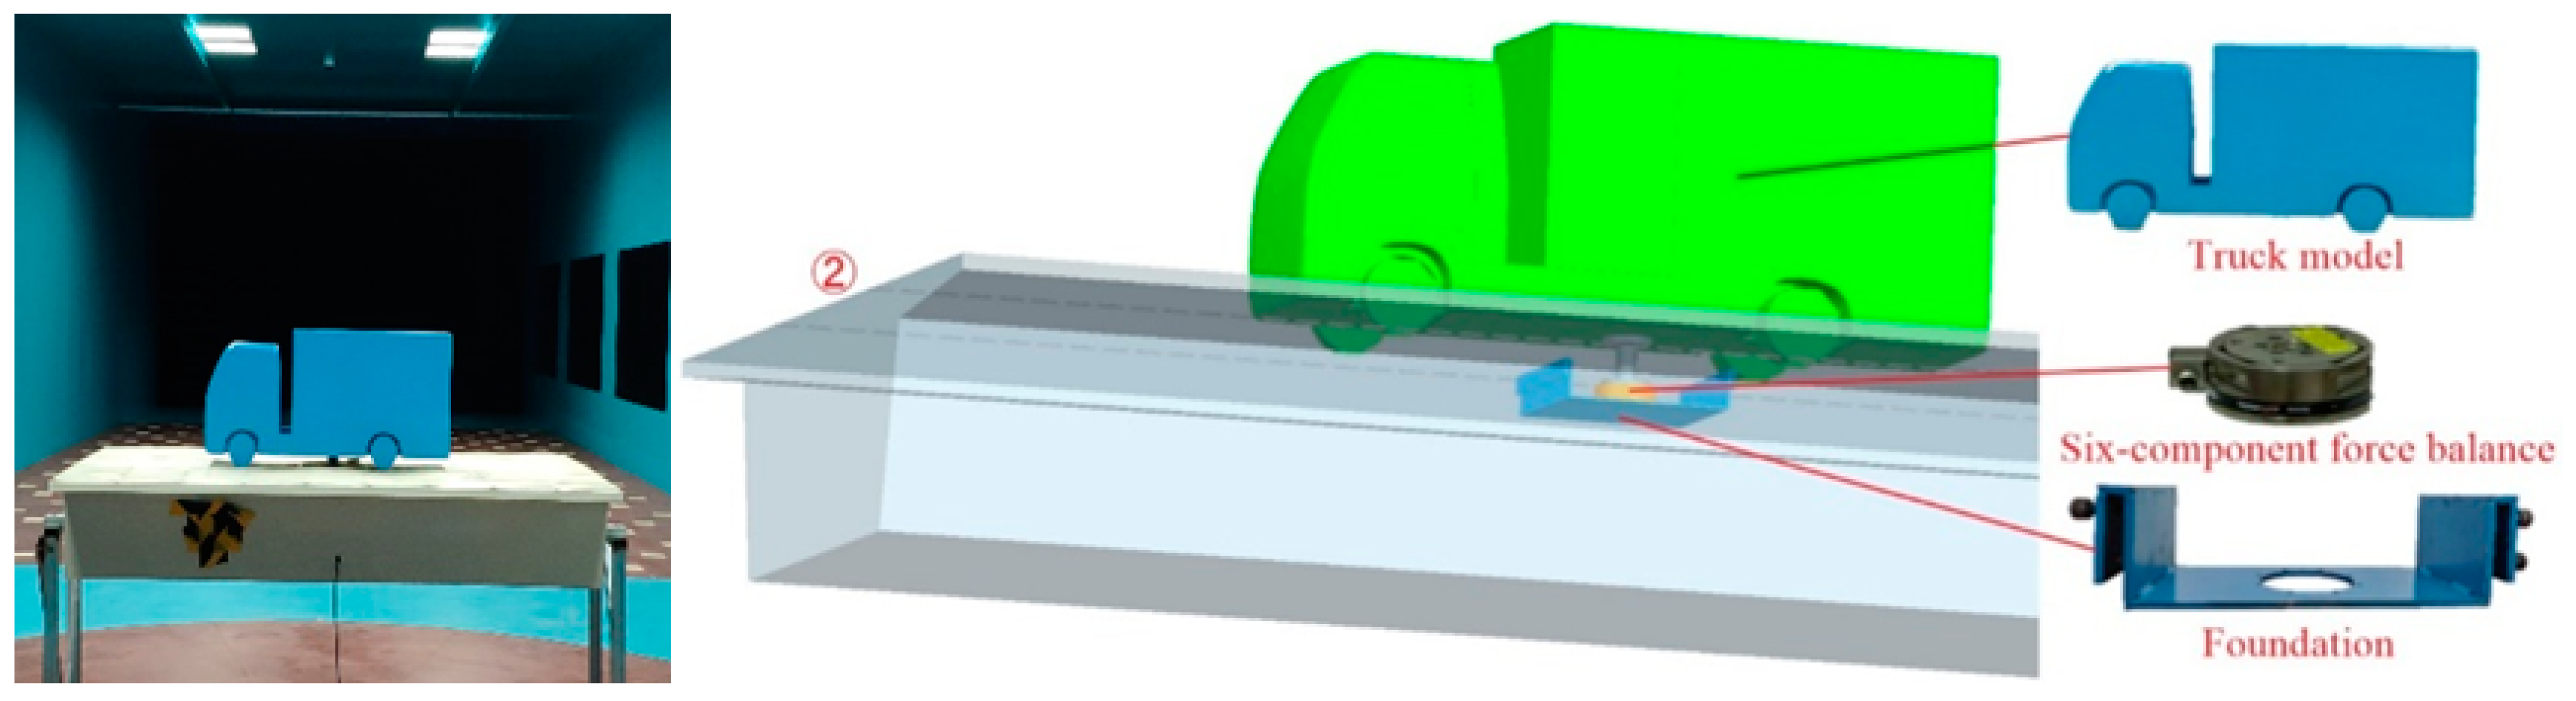
2. Test Model
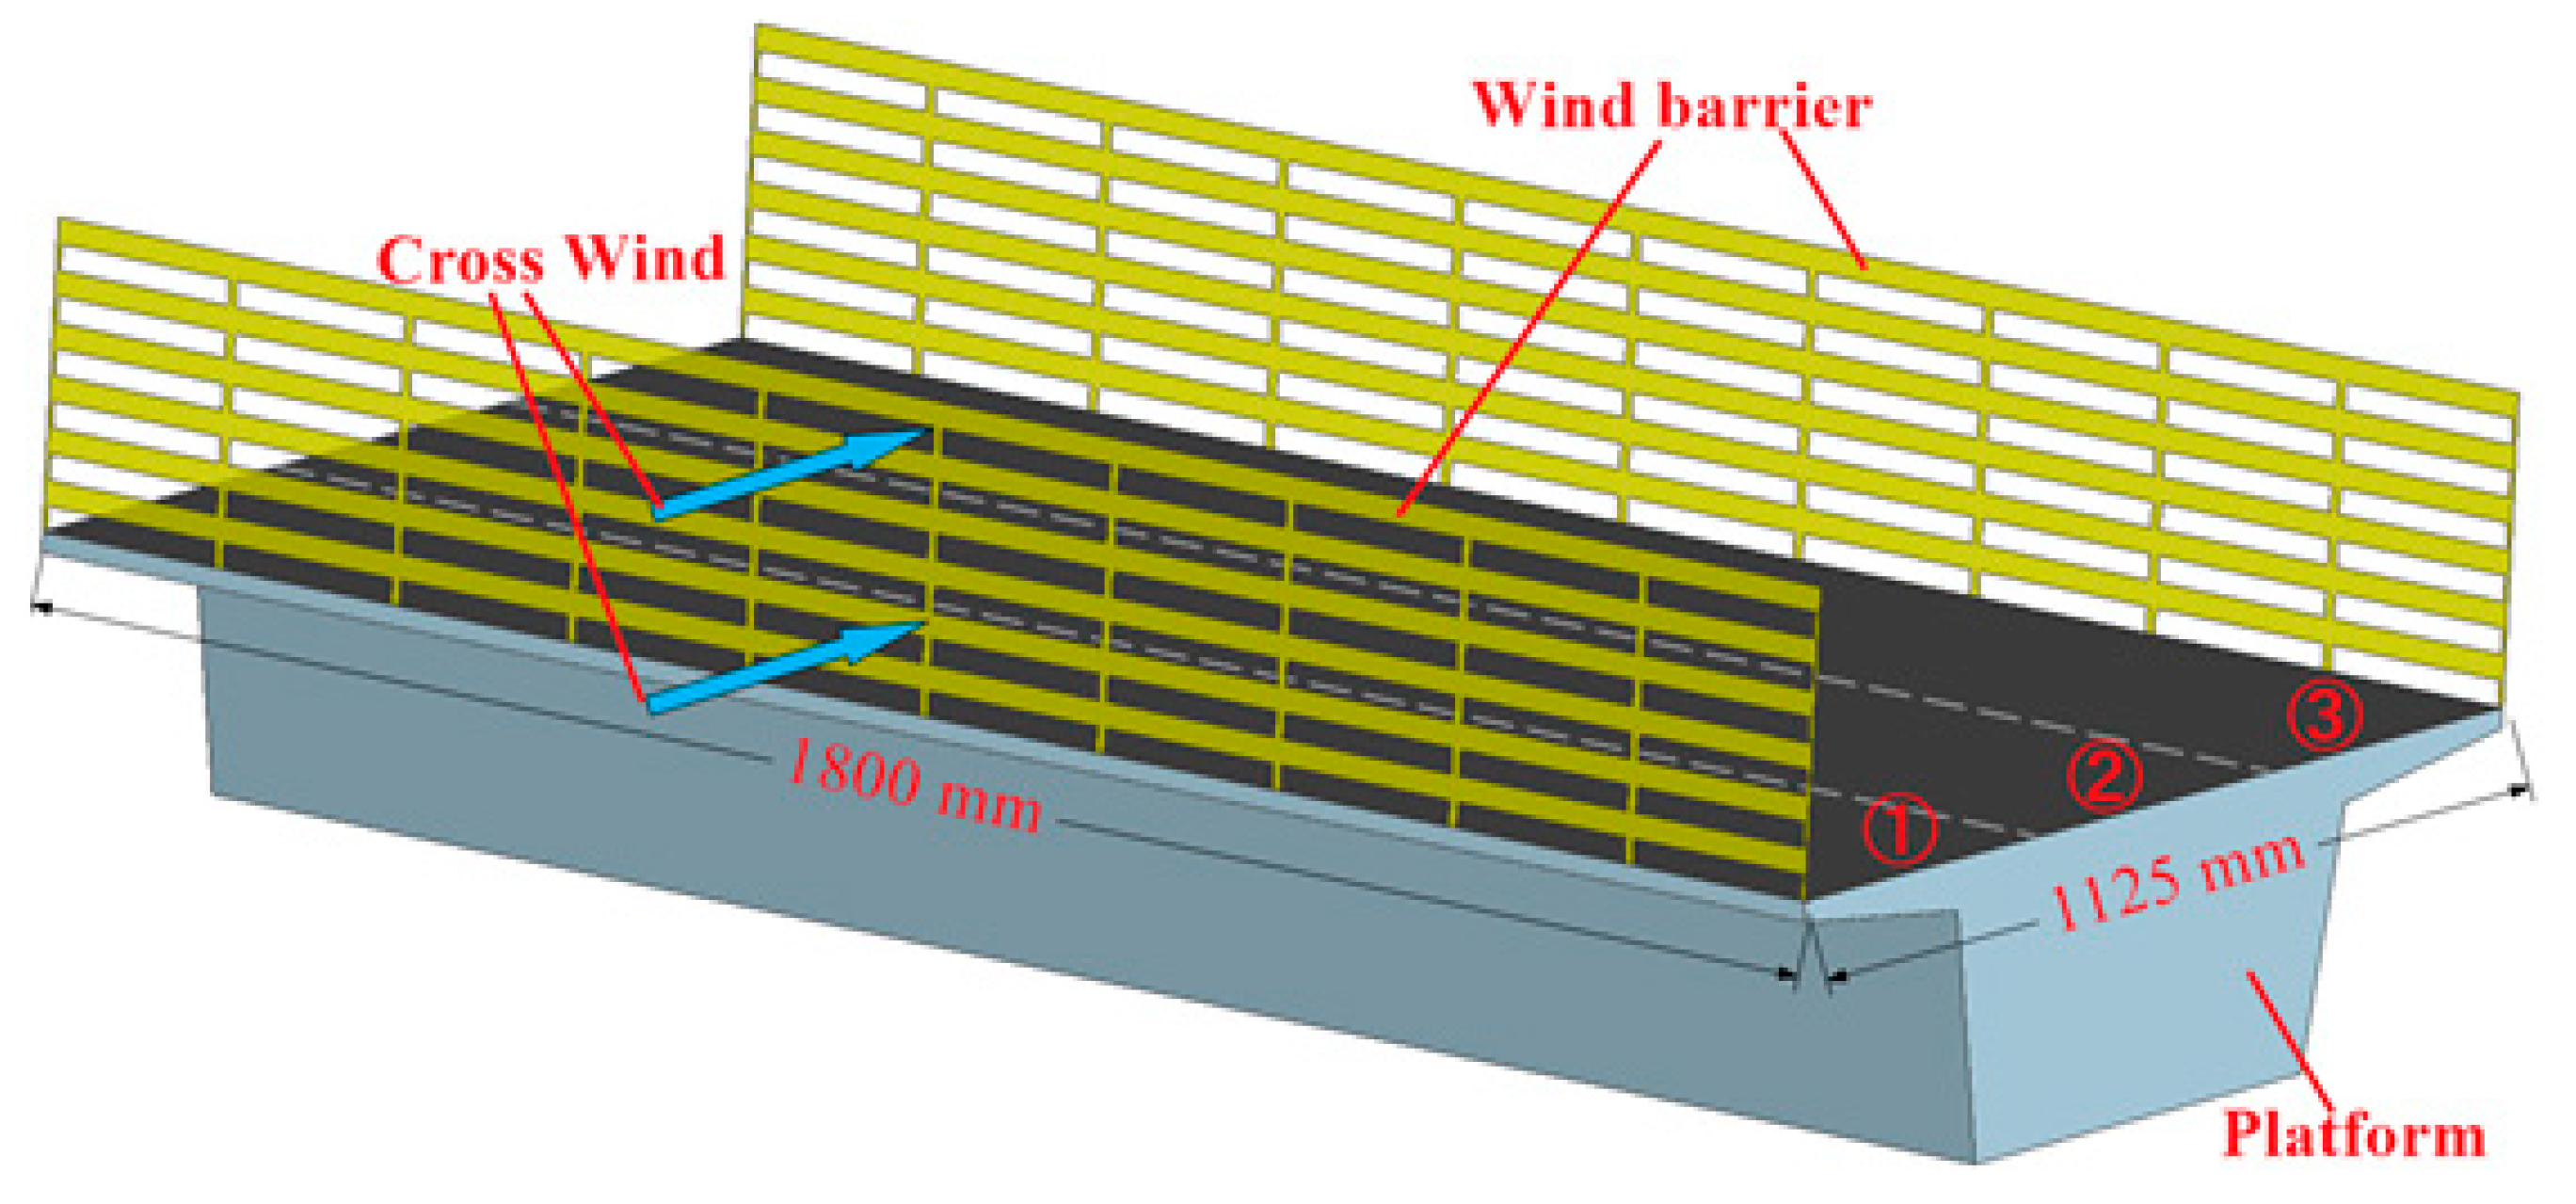
2.1. Model Installation Platform
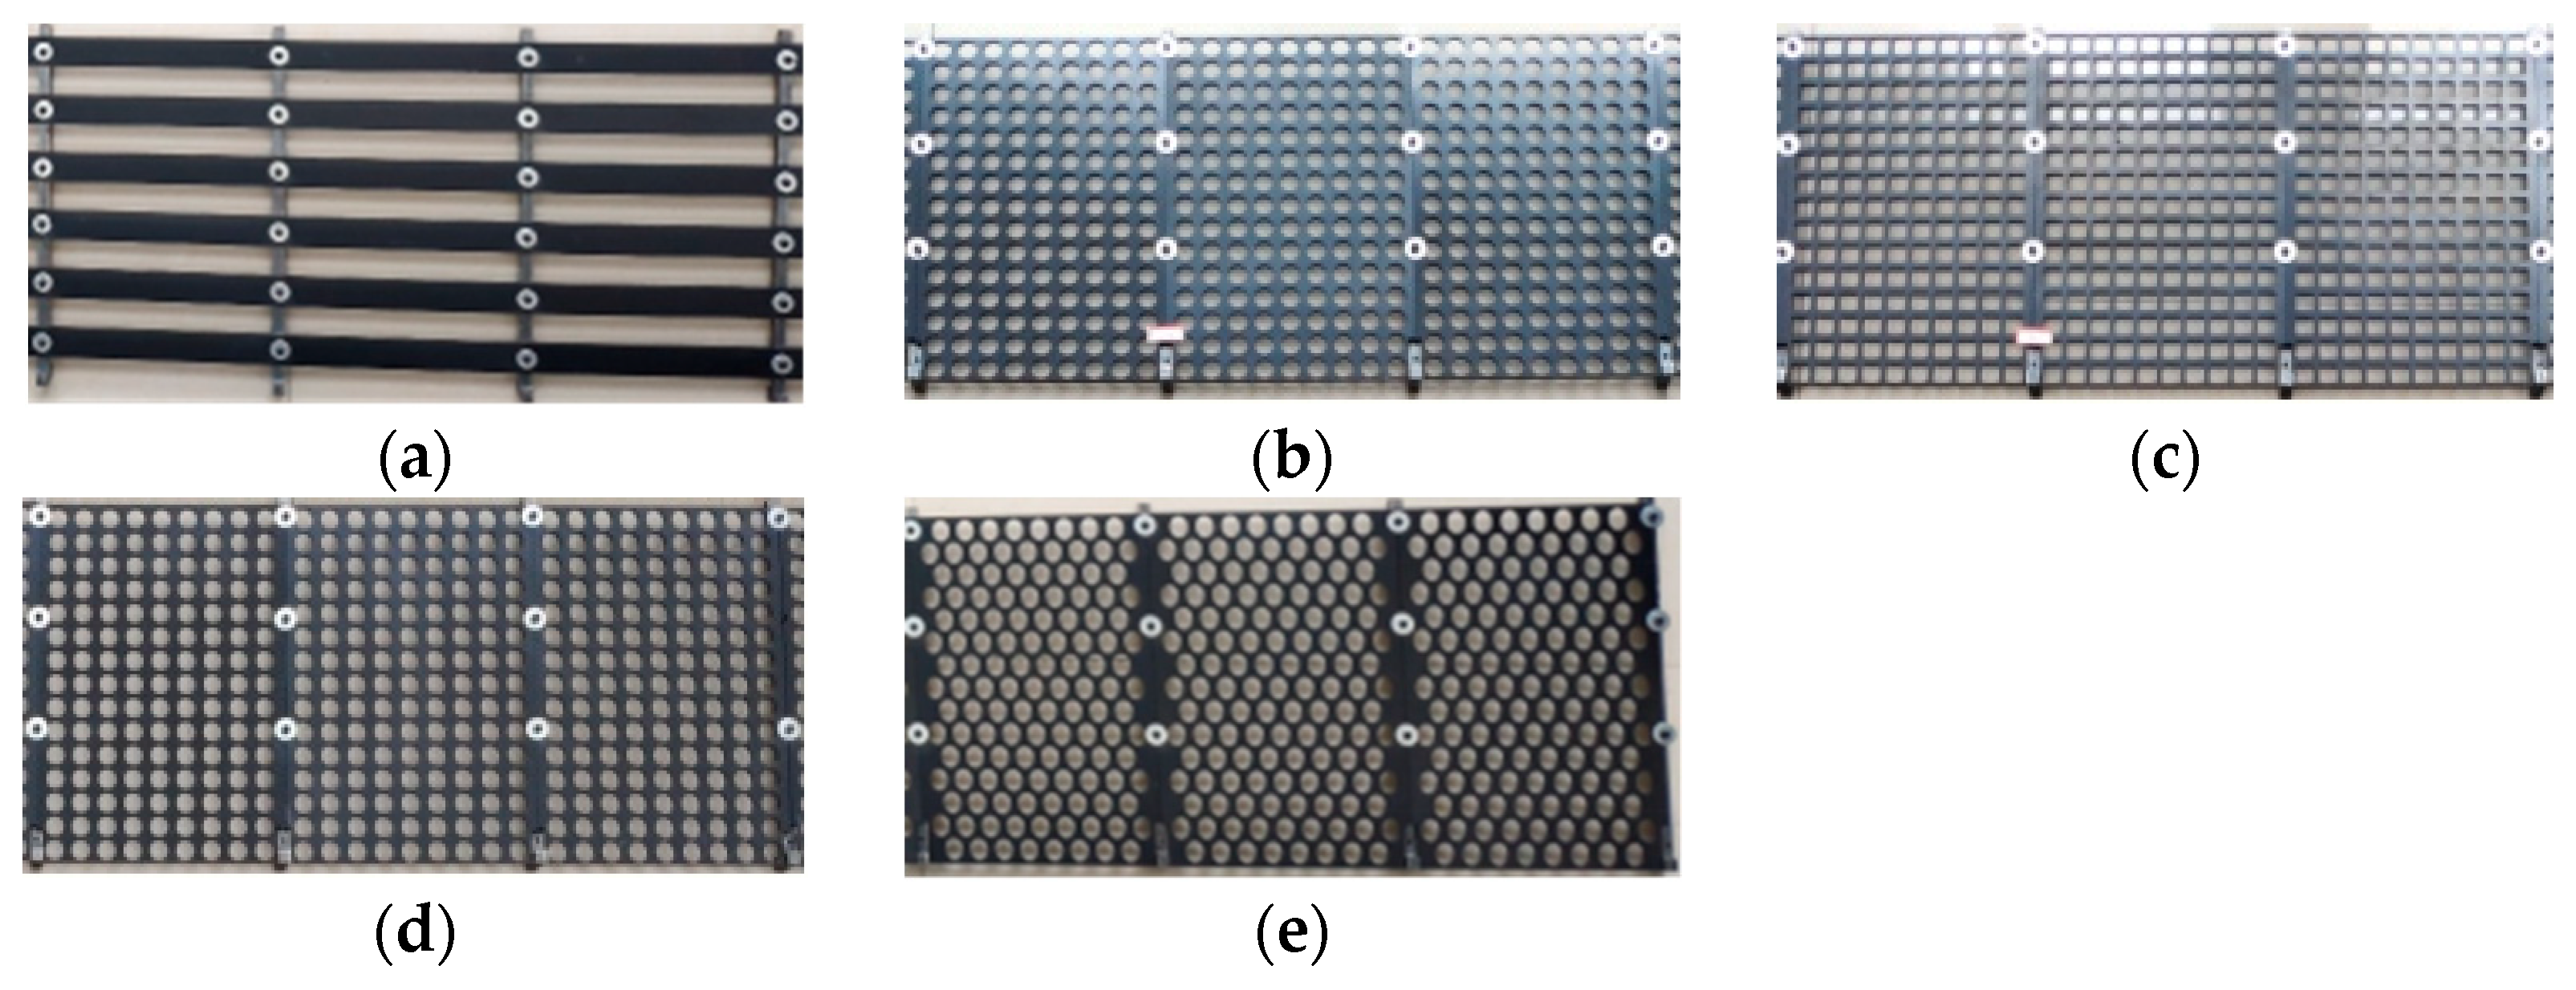
2.2. Wind Barrier Model
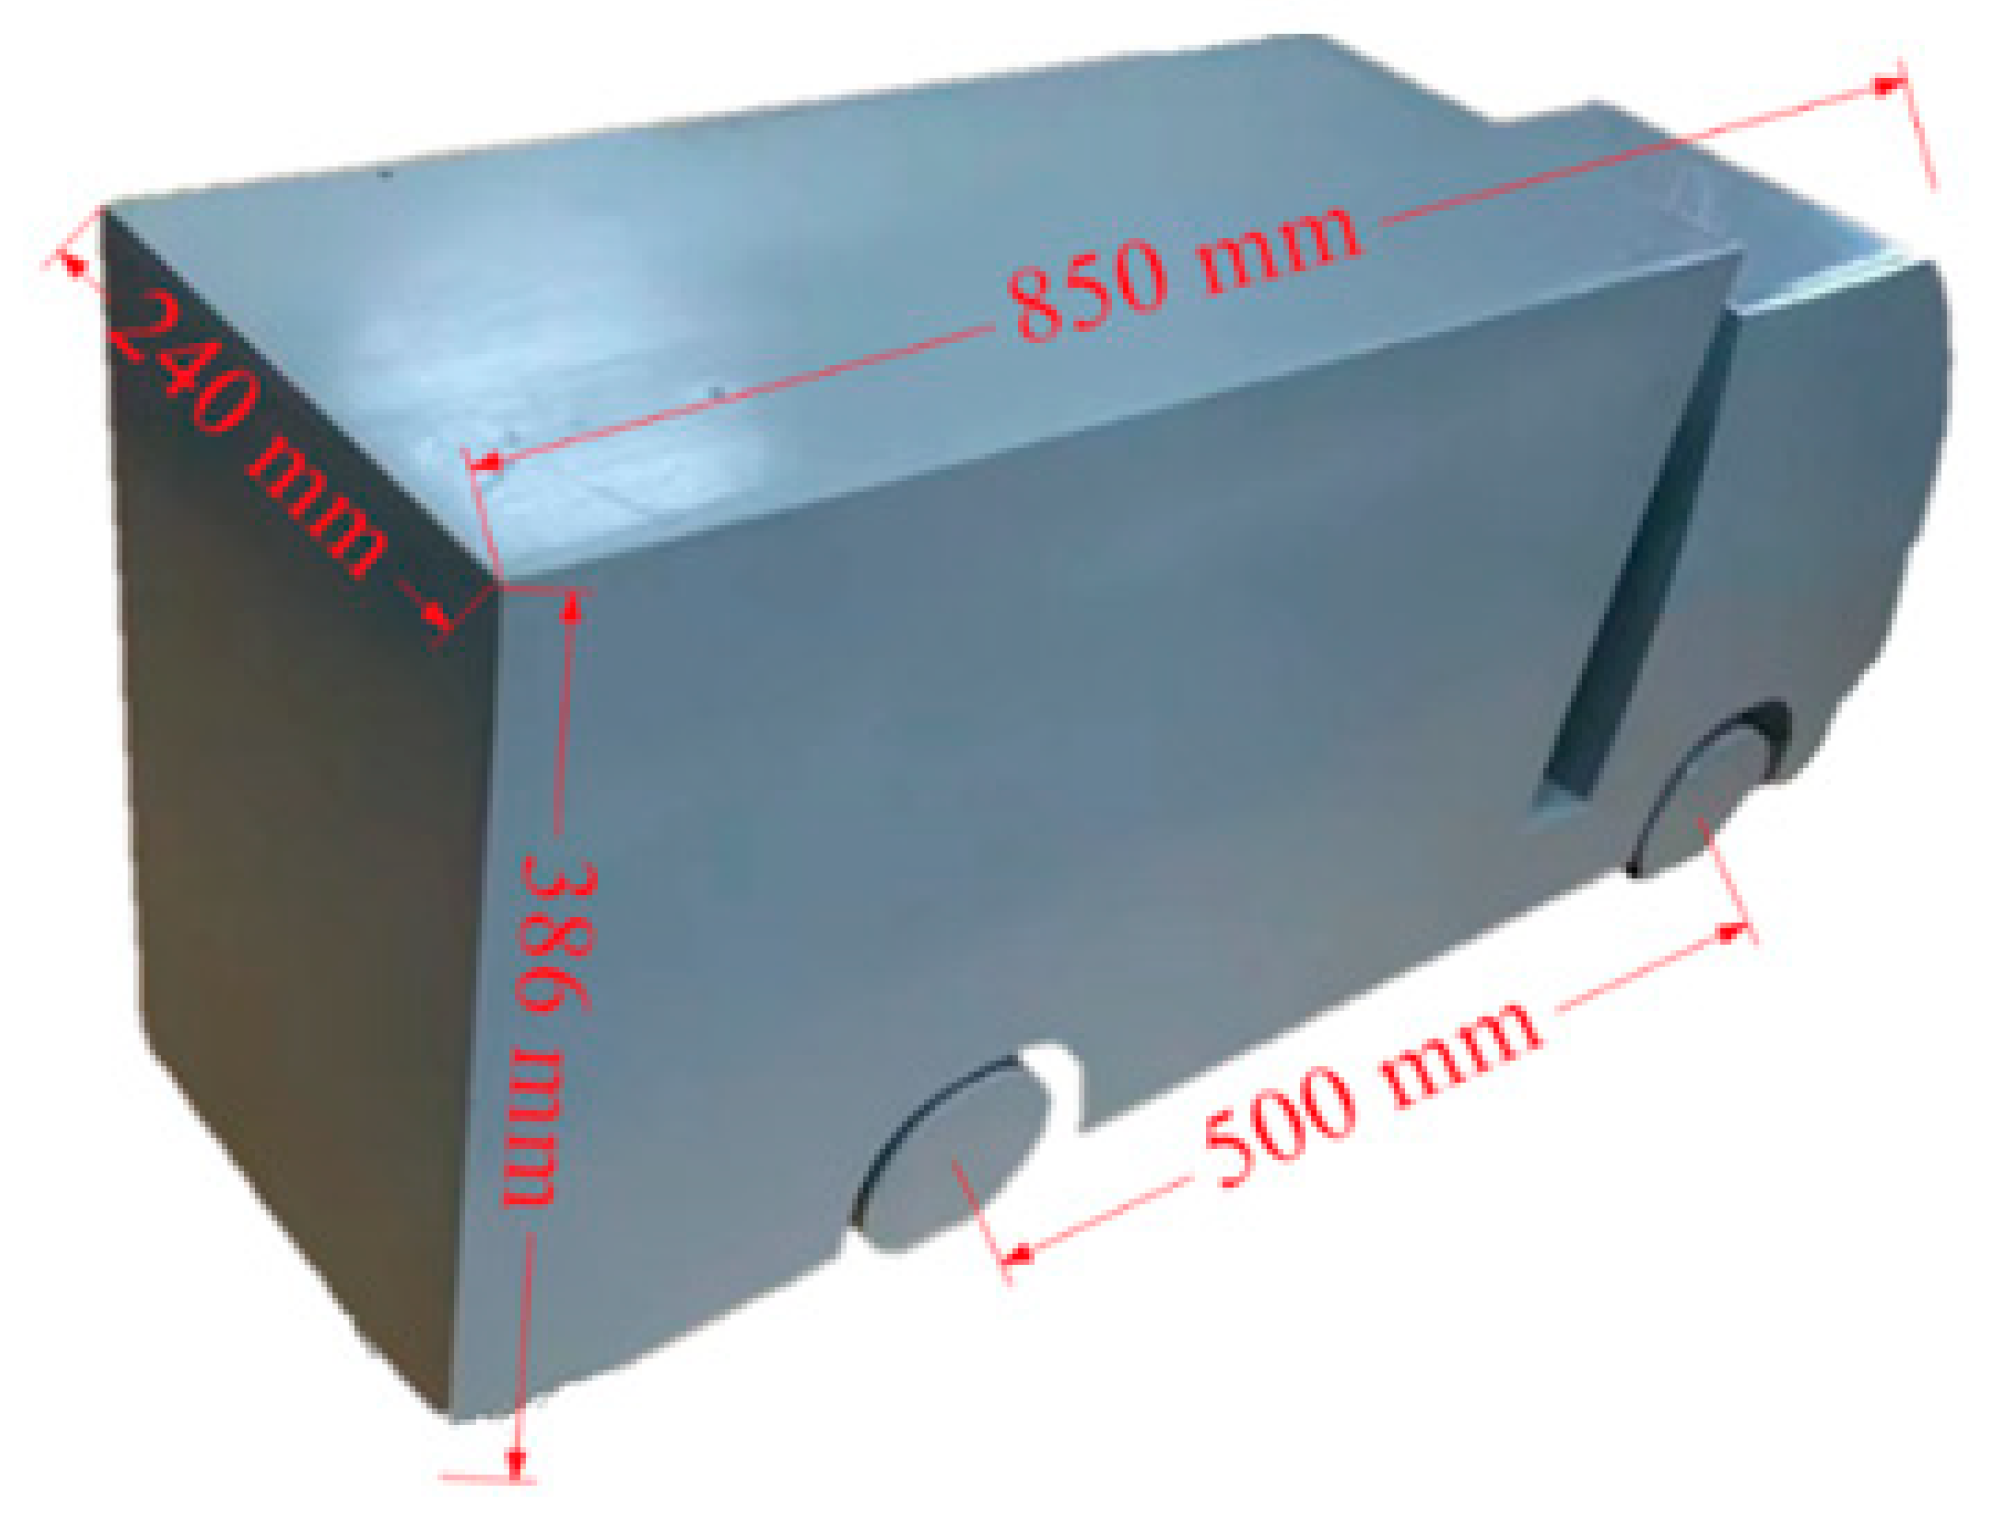
2.3. Vehicle Model
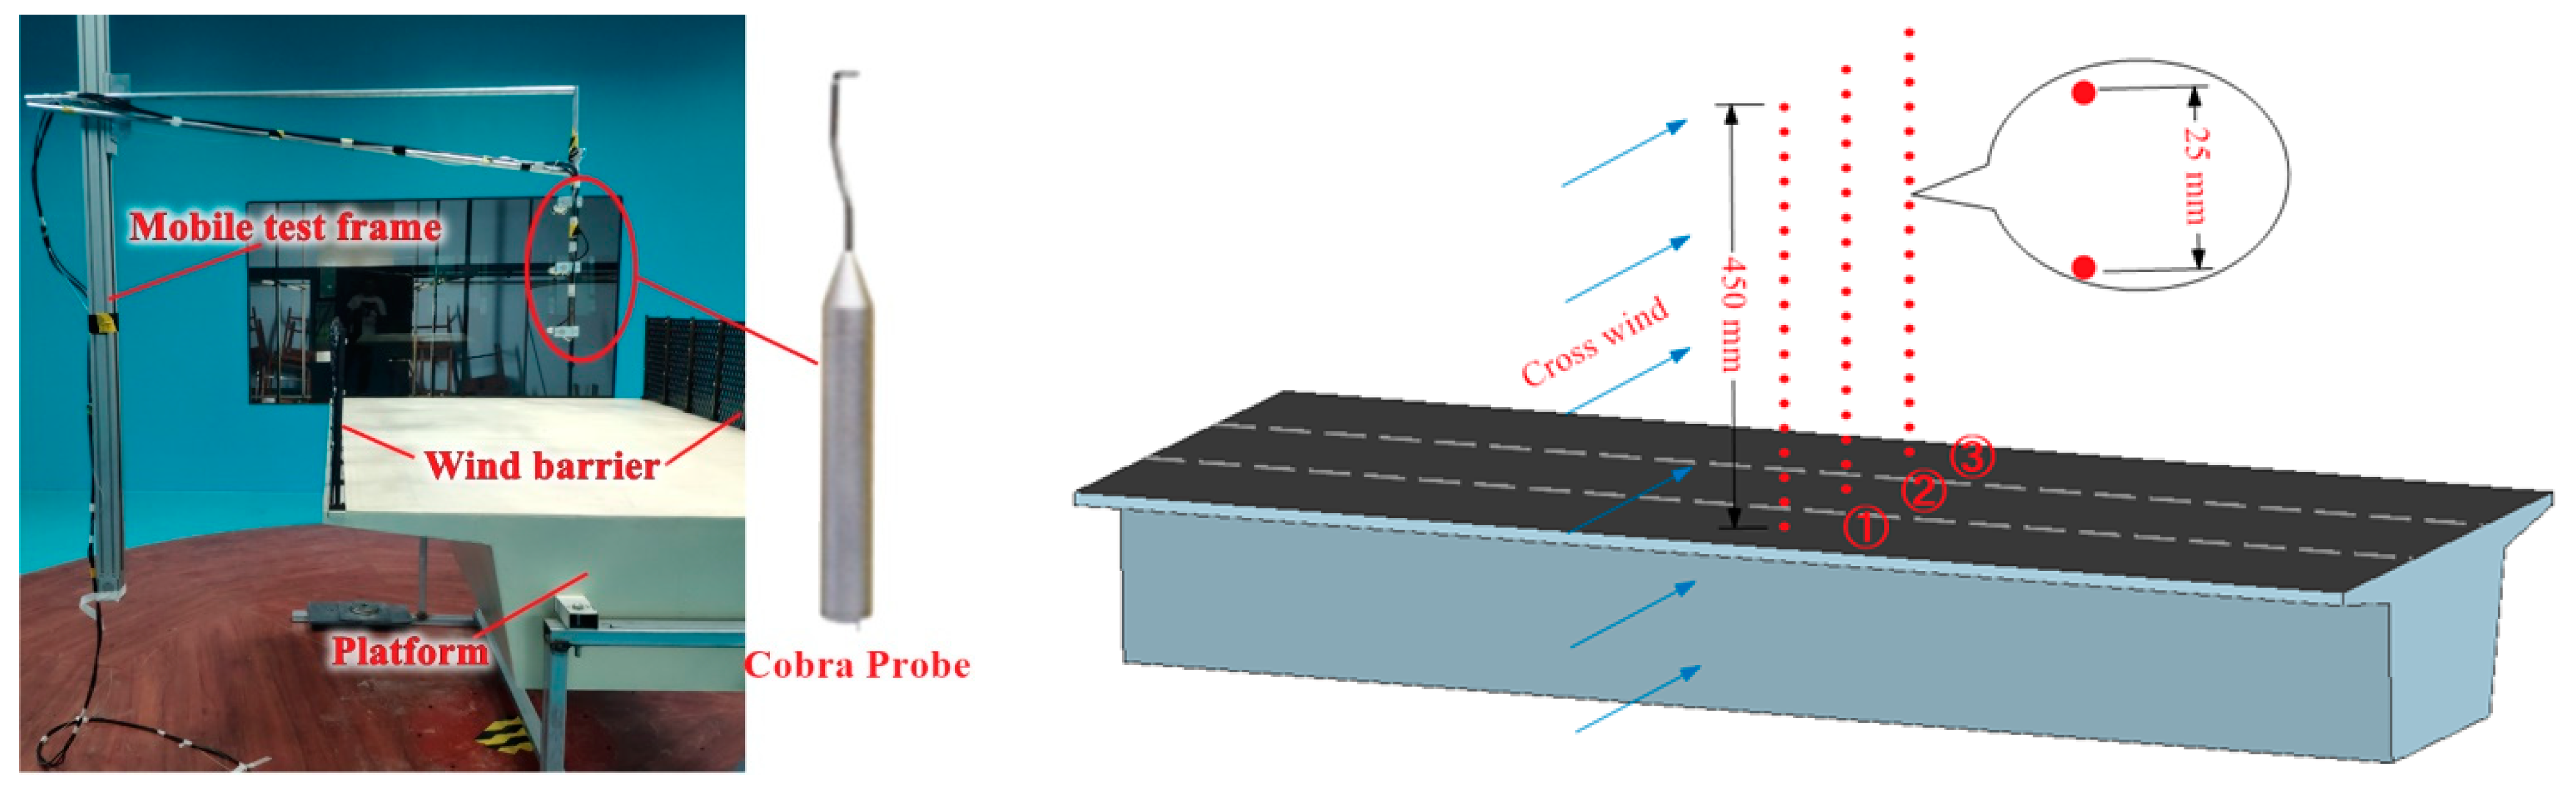
3. Test Setup
3.1. Test Conditions
3.2. Measurement Positions
4. Analysis of Test Results
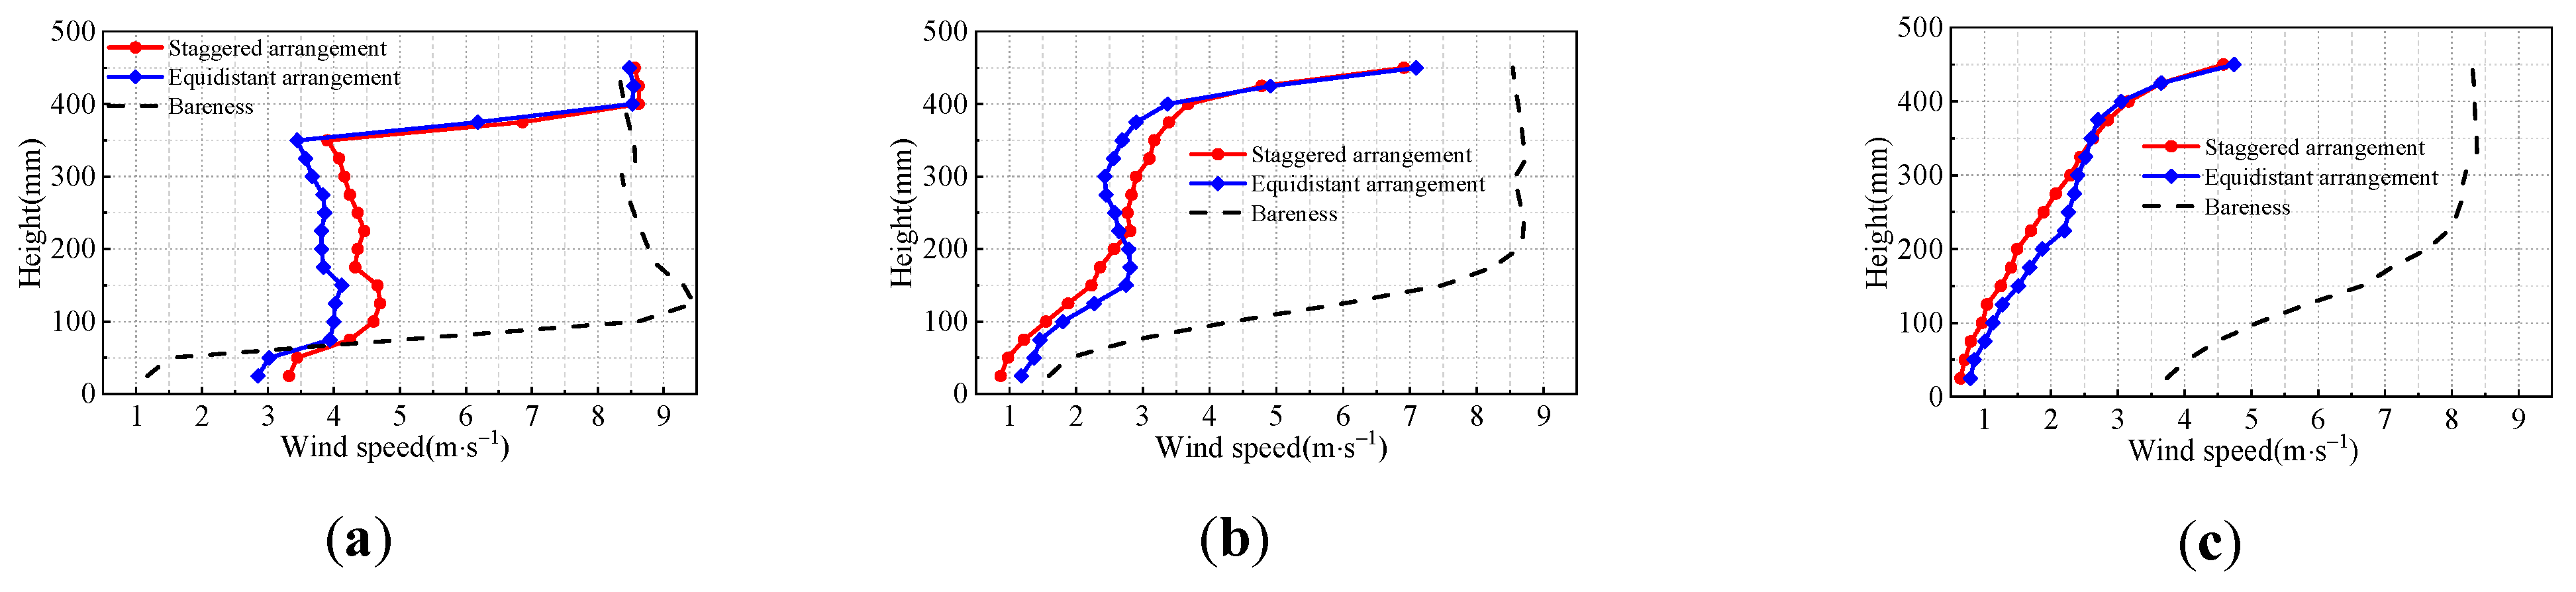
4.1. Influence of Wind Barrier Parameters on the Average Wind Profile
- (1)
- The arrangement of the holes
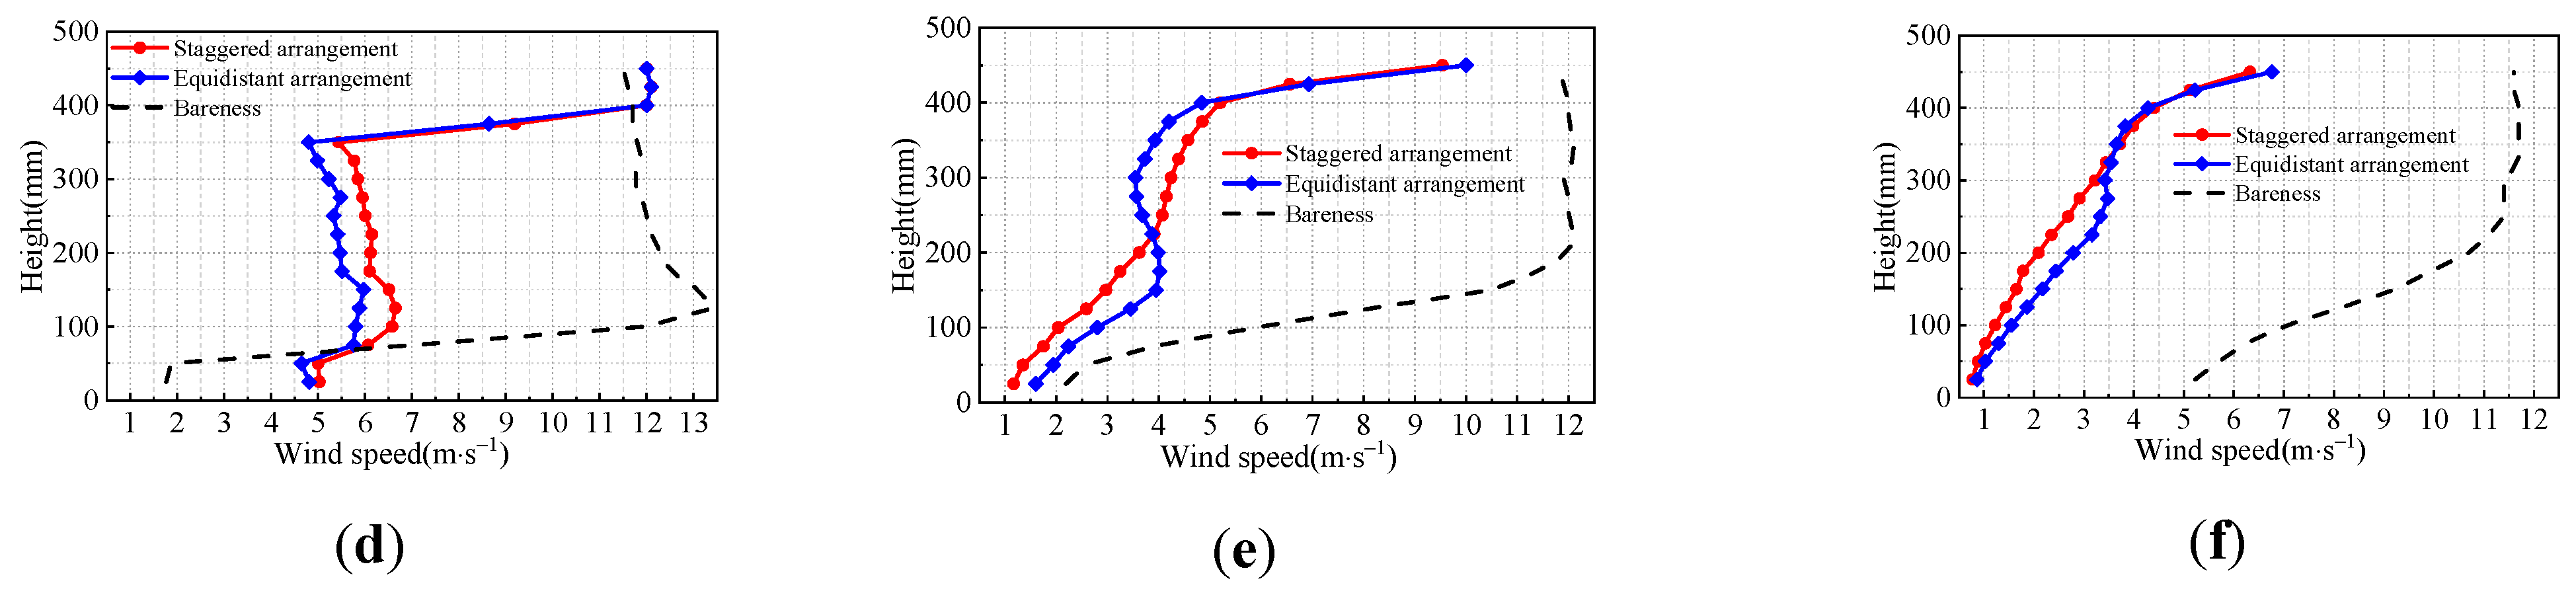
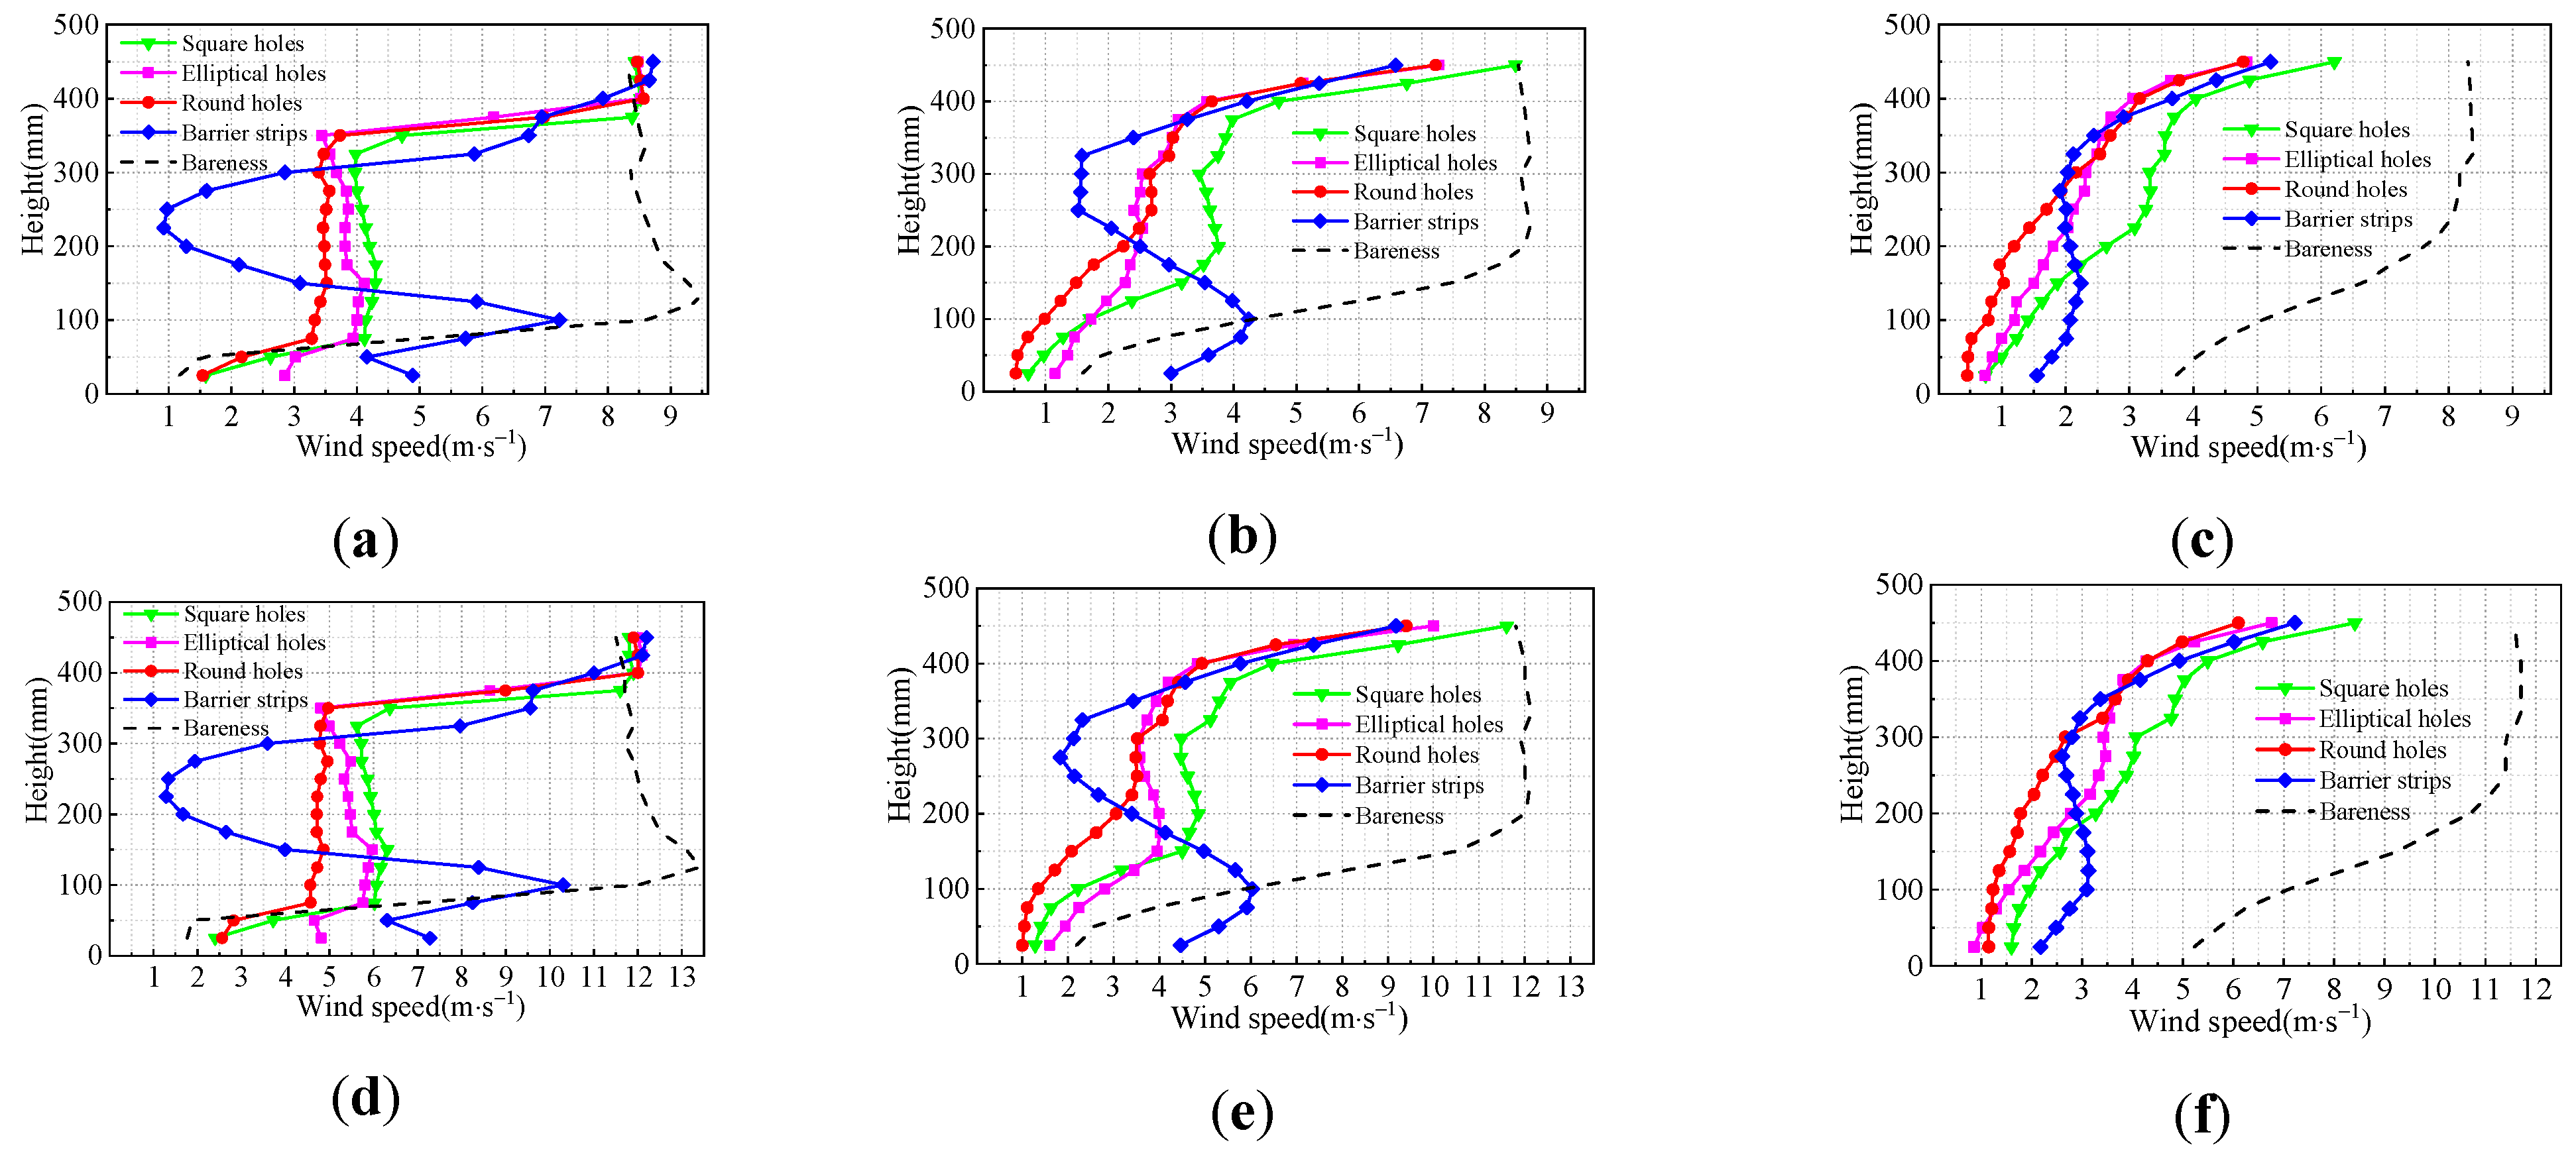
- (2)
- The shape of the holes
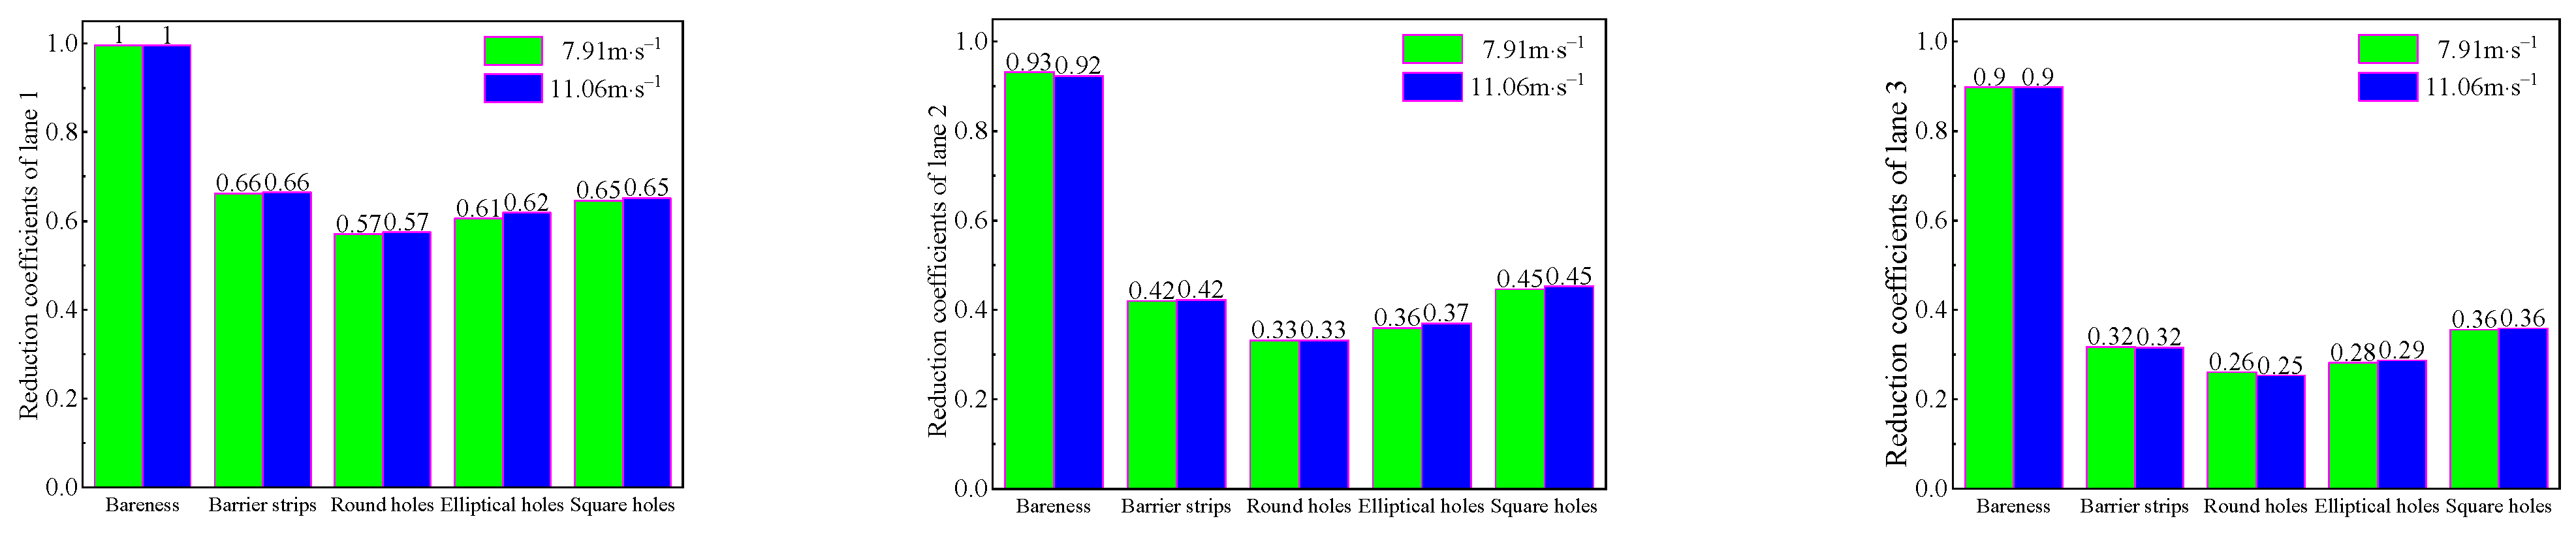
4.2. Analysis of the Influence of the Wind Barrier Parameters on the Wind Choke Efficiency
4.3. Influence of the Wind Barrier Parameters on Driving Stability over Bridges
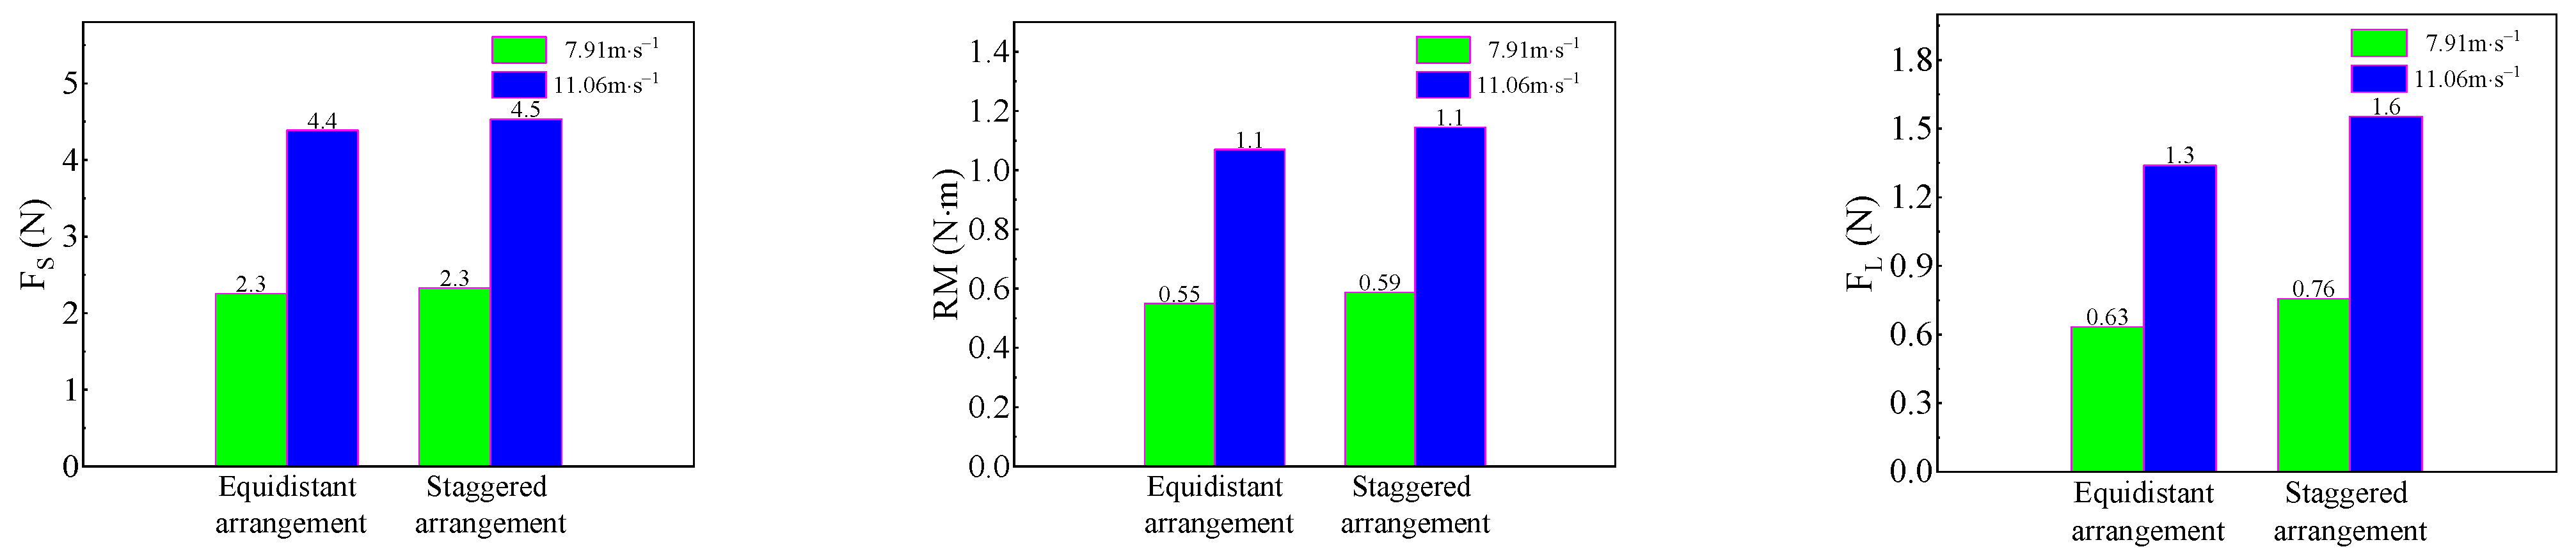
- (1)
- The efficiency of wind barriers with different arrangements
- (2)
- Shielding efficiency of wind barriers with different hole shapes
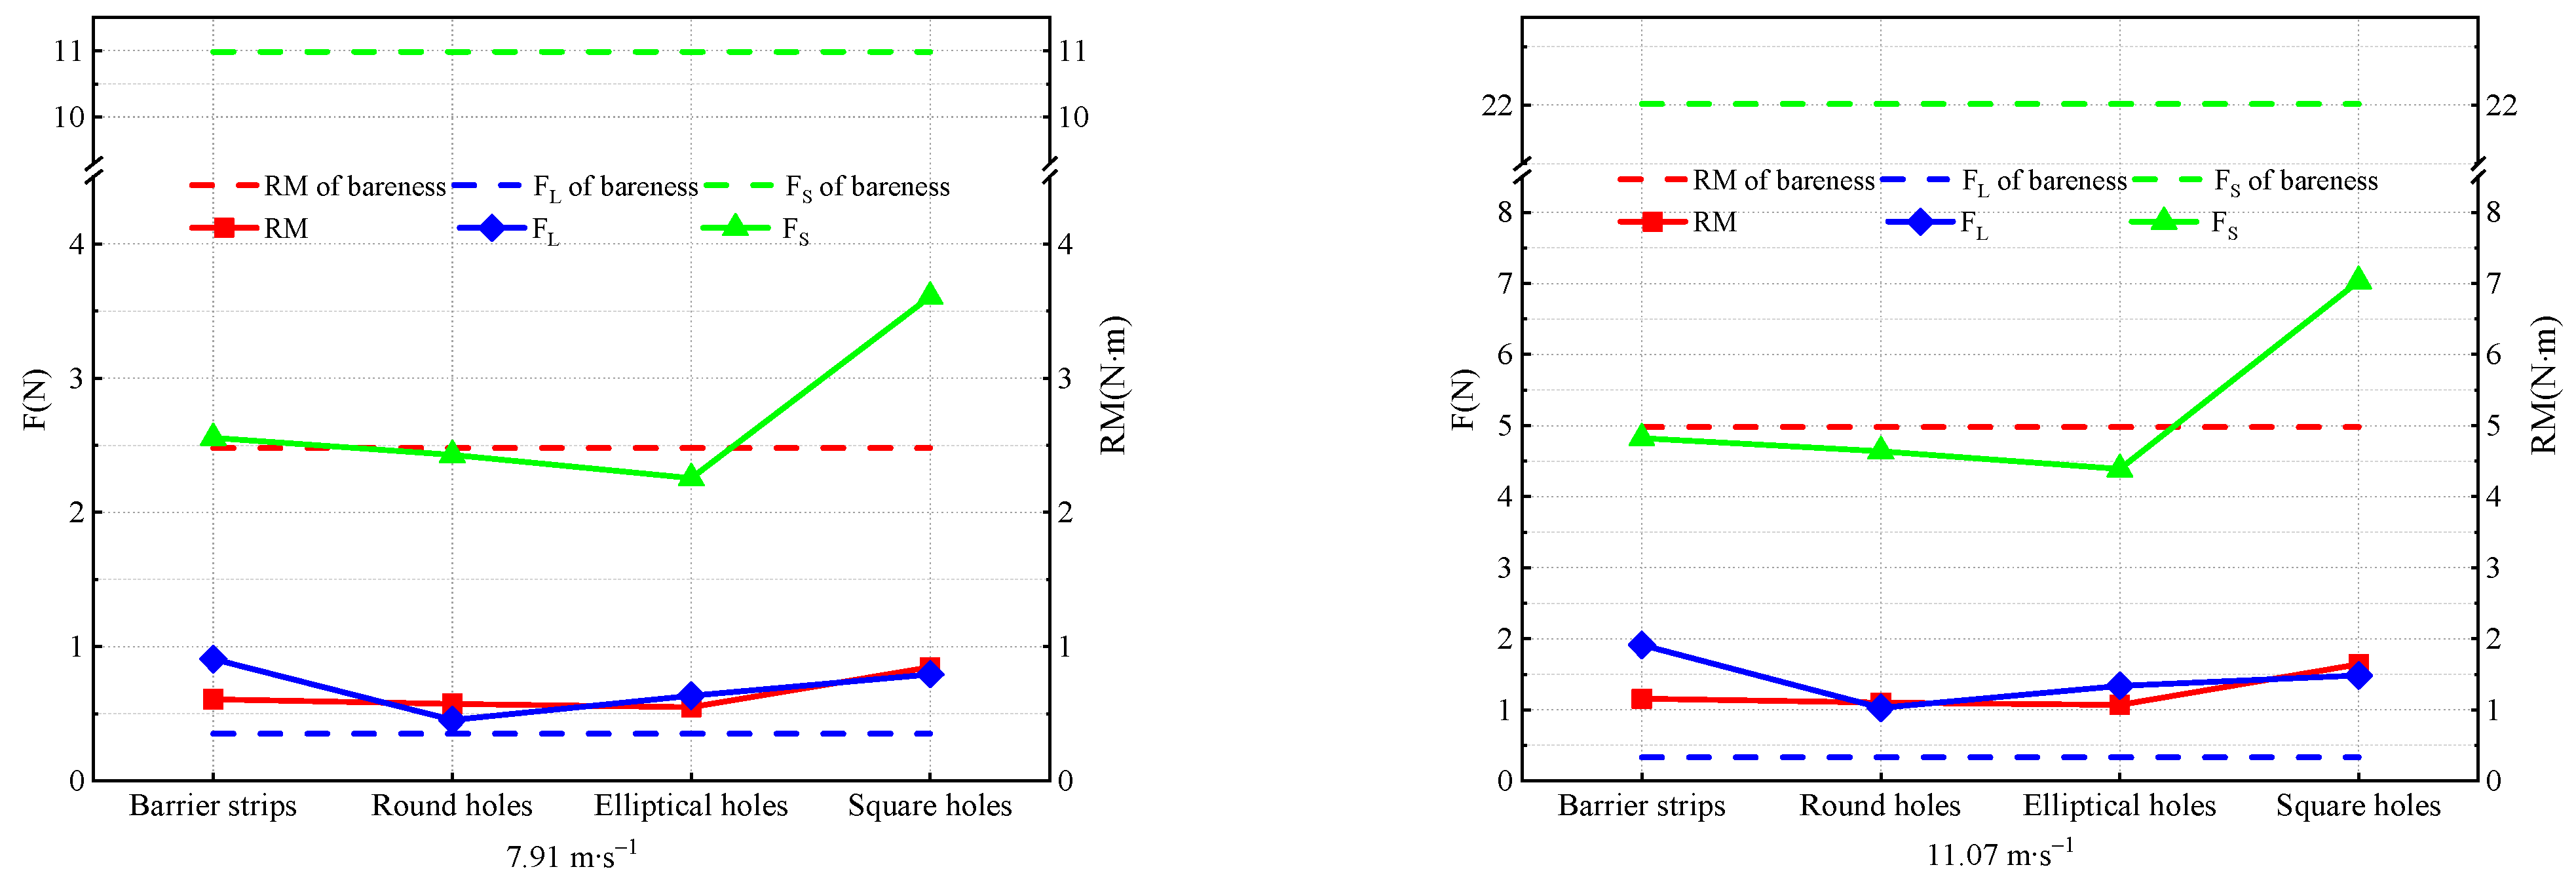
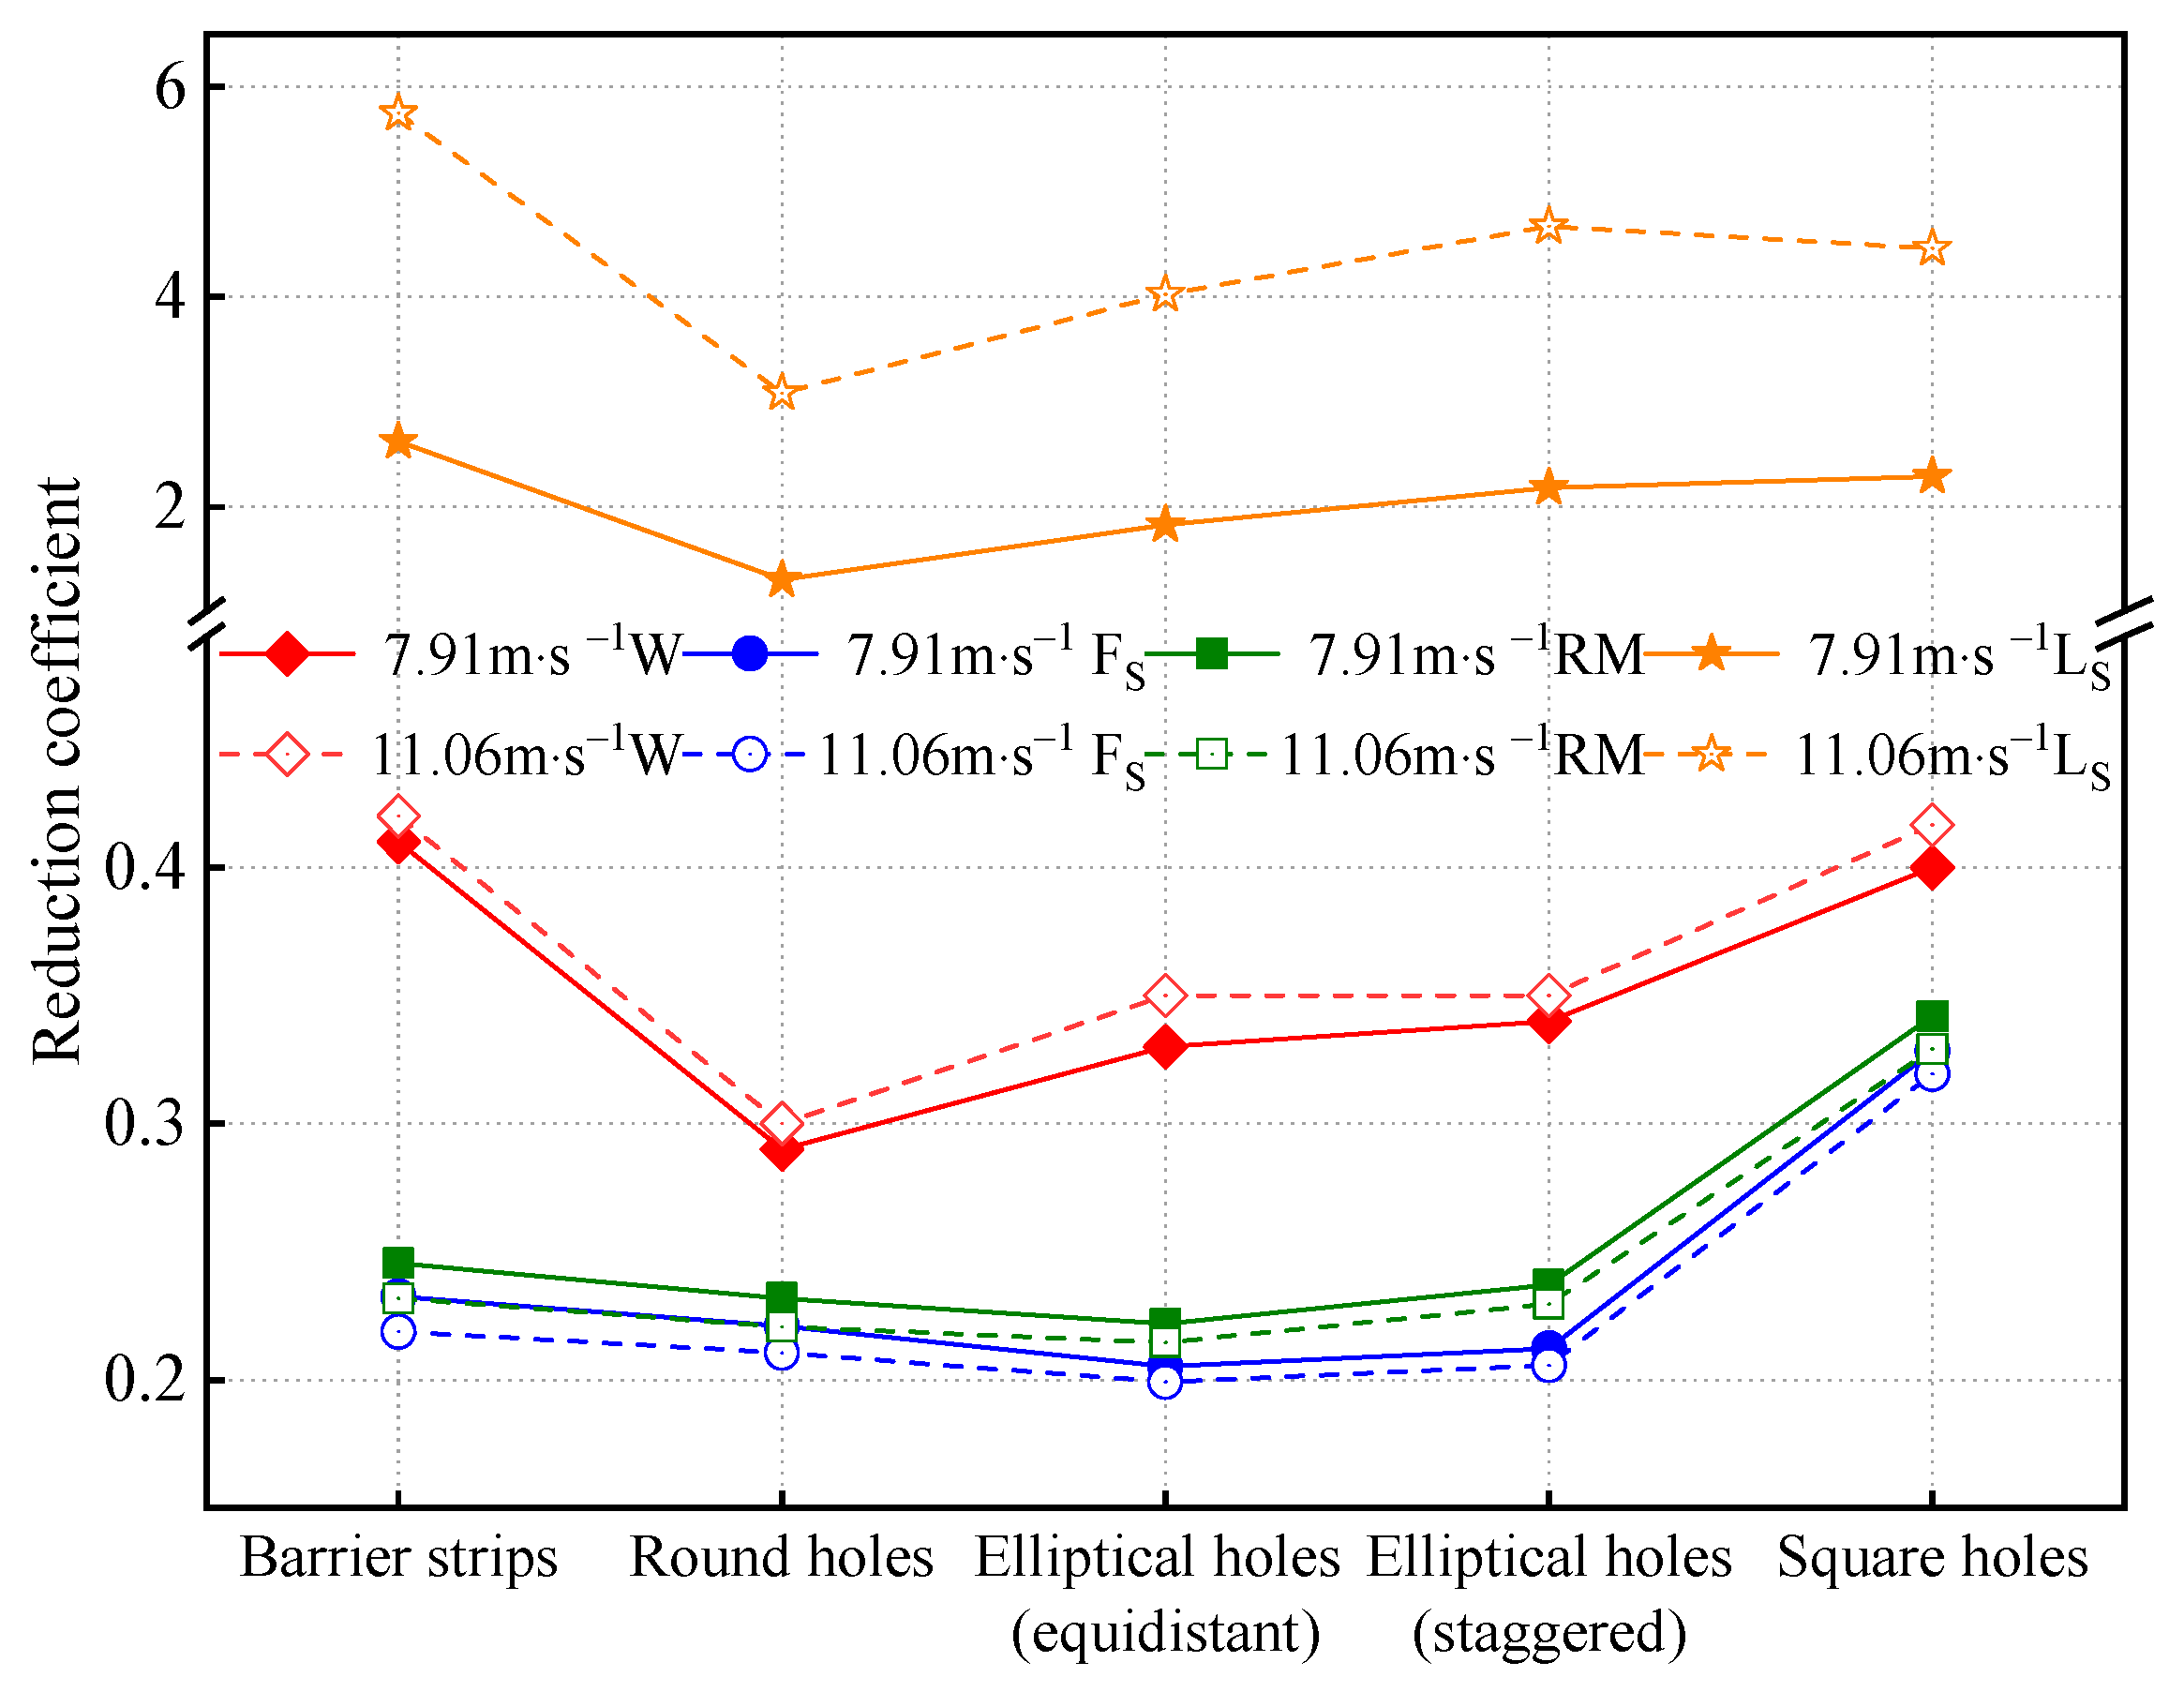
4.4. Comparison of Force Tests and Flow Field Tests Results
5. Conclusions
- (1)
- The wind speed, aerodynamic side force, and roll moment of a vehicle behind a wind barrier on a bridge increase as the incoming wind speed increases. The aerodynamic lift can increase by up to 100%. Under different wind speed and incoming flow conditions, the change in the equivalent wind speed reduction coefficient is consistent with that of the lift reduction coefficient. The speed measurement test can reflect the adverse effects of pressure difference changes at different heights of the bridge wind fields on the aerodynamic lift of vehicles with wind barriers.
- (2)
- The arrangement of wind barrier holes has a relatively small influence on the equivalent wind profile and vehicle six-component force measures. The equidistant grid arrangement is more effective at wind blocking than other arrangements.
- (3)
- From high to low, the wind-shielding efficiencies of wind barriers are: slabs with round holes, slabs with elliptical holes, and slabs with rectangular holes. Near the ground level, the barrier strip scheme performs significantly better than the other schemes. The opening form adopted by the current Chinese standard [25] has blind spots for blocking, and wind barriers can be further optimized.
- (4)
- It is more efficient to use the equivalent wind speed reduction coefficient as the evaluation index of the overall efficiency of a wind barrier.
Author Contributions
Funding
Institutional Review Board Statement
Informed Consent Statement
Conflicts of Interest
References
- Liu, S.; Zhao, L.; Fang, G.; Hu, C.; Ge, Y. Investigation on aerodynamic force nonlinear evolution for a central-slotted box girder under torsional vortex-induced vibration. J. Fluids Struct. 2021, 106, 103380. [Google Scholar] [CrossRef]
- Lin, L.; Chen, K.; Xia, D.; Wanga, H.; Hua, H.; Hea, F. Analysis on the wind characteristics under typhoon climate at the southeast coast of China. J. Wind Eng. Ind. Aerodyn. 2018, 182, 37–48. [Google Scholar] [CrossRef]
- Xia, D.; Dai, L.; Lin, L.; Wang, H.; Hu, H. A field measurement based wind characteristics analysis of a typhoon in near-ground boundary layer. Atmosphere 2021, 12, 873. [Google Scholar] [CrossRef]
- Kozmar, H.; Procino, L.; Borsani, A. Sheltering efficiency of wind barriers on bridges. J. Wind. Eng. Ind. Aerodyn. 2012, 107–108, 274–284. [Google Scholar] [CrossRef] [Green Version]
- Yamamoto, K.; Ejiri, A.; Oya, M. Rollover prevention control of vehicles with crosswind disturbance. Artif. Life Robot. 2021, 26, 250–258. [Google Scholar] [CrossRef]
- Baker, C.; Cheli, F.; Orellano, A.; Nicolas, P.; Carsten, P.; Rocchi, D. Cross-wind effects on road and rail vehicles. Veh. Syst. Dyn. 2009, 47, 983–1022. [Google Scholar] [CrossRef]
- Coleman, S.A.; Baker, C.J. The Reduction of Accident Risk for High Sided Road Vehicles in Cross Winds. J. Wind Eng. Ind. Aerodyn. 1992, 44, 2685–2695. [Google Scholar] [CrossRef]
- Buljac, A.; Kozmar, H.; Macháček, M.; Pospisil, S. Self-excited vibrations of a bridge deck with single and double wind barriers. Lect. Notes Civ. Eng. 2019, 27, 124–132. [Google Scholar]
- Zhu, L.D.; Li, L.; Xu, Y.L. Wind tunnel investigations of aerodynamic coefficients of road vehicles on bridge deck. J. Fluids Struct. 2012, 30, 35–50. [Google Scholar] [CrossRef]
- Dorigatti, F.; Sterling, M.; Rocchi, D.; Belloli, M. Wind tunnel measurements of crosswind loads on high sided vehicles over long span bridges. J. Wind Eng. Ind. Aerodyn. 2012, 107–108, 214–224. [Google Scholar] [CrossRef]
- Han, Y.; Cai, C.S.; Zhang, J.; Chen, S. Effects of aerodynamic parameters on the dynamic responses of road vehicles and bridges under cross winds. J. Wind Eng. Ind. Aerodyn. 2014, 134, 78–95. [Google Scholar] [CrossRef]
- Chen, N.; Li, Y.; Wang, B. Effects of wind barrier on the safety of vehicles driven on bridges. J. Wind Eng. Ind. Aerodyn. 2015, 143, 113–127. [Google Scholar] [CrossRef]
- Kim, S.; Shim, J.; Kim, H. How wind affects vehicles crossing a double-deck suspension bridge. J. Wind Eng. Ind. Aerodyn. 2020, 206, 104329. [Google Scholar] [CrossRef]
- Chu, C.; Chang, C.; Huang, C.; Chih-Jung, H.; Tso-Ren, W.; Chung-Yue, W.; Ming-Yi, L. Windbreak protection for road vehicles against crosswind. J. Wind Eng. Ind. Aerodyn. 2013, 116, 61–69. [Google Scholar] [CrossRef]
- He, X.; Zou, S. Crosswind effects on a train-bridge system: Wind tunnel tests with a moving vehicle. Struct. Infrastruct. Eng. 2021, 1–13. [Google Scholar] [CrossRef]
- Xue, F.R.; Han, Y.; Zou, Y.F.; He, X.; Chen, S. Effects of wind-barrier parameters on dynamic responses of wind-road. J. Wind Eng. Ind. Aerodyn. 2020, 206, 104367. [Google Scholar] [CrossRef]
- Buljac, A.; Kozmar, H.; Pospíil, S.; Macháček, M.; Kuznetsov, S. Effects of wind-barrier layout and wind turbulence on aerodynamic stability of cable-supported bridges. J. Bridge Eng. 2020, 25, 04020102. [Google Scholar] [CrossRef]
- Li, B.; Zhang, J.; Yang, Q. Experimental study on wind-shielding performance of bridge wind barriers. Vib. Shock 2016, 35, 78–82. [Google Scholar]
- Kozmar, H.; Procino, L.; Borsani, A. Optimizing height and porosity of roadway wind barriers for viaducts and bridges. Eng. Struct. 2014, 81, 49–61. [Google Scholar] [CrossRef]
- Zhan, K.; Lin, X.; Yang, Y. Experimental study on bridge wind barrier performance under different structural parameters. J. Fuzhou Univ. 2021, 49, 217–224. [Google Scholar]
- Lin, X.; Hou, H.; Lian, J. Analysis on the influence parameters of wind barrier performance of double beam bridges. J. Fuzhou Univ. 2021, 49, 87–94. [Google Scholar]
- Su, Y.; Li, Y.; Peng, D.; Chen, K.; Meng, X. Wind tunnel test study of full-scale model of highway wind barrier flow field characteristics and its own wind load. Eng. Mech. 2017, 34, 87–94. [Google Scholar]
- Ge, Y. Bridge Wind Tunnel Test Guide; China Communications Press: Beijing, China, 2018. [Google Scholar]
- Wei, G. Research on Numerical Methods of Safety Countermeasures for Side Wind driving on Highways and Bridges; Chang’an University: Xi’an, China, 2013. [Google Scholar]
- China MOT. Wind Barrier for Bridges; China Communications Press: Beijing, China, 2013. [Google Scholar]
- Zhou, Q.; Zhu, L.; Guo, Z. Numerical simulation for curve windshield barrier effects on wind environment around bridge deck. J. Wuhan Univ. Technol. 2010, 32, 38–44. [Google Scholar]
- Yu, Z. Automobile Theory; Mechanical Industry Press: Beijing, China, 2000. [Google Scholar]
- Wang, F.; Fu, L.; Hu, X. Transient numerical simulation of the influence of different intensities of crosswinds on car aerodynamic characteristics. J. Jilin Univ. 2008, 38, 19–22. [Google Scholar]


| Name | Place of Production | Model | Range | Accuracy | |
|---|---|---|---|---|---|
| TFI Cobra Probe pulsation anemometer | Australia | Series 100 | v/2–100 m∙s−1 | ±0.5 m∙s−1 | |
| ATI six-component balance | America | SI-130-10 | Fx,Fy/(±N) | 130 | ±0.025 N |
| Fz/(±N) | 400 | ±0.05 N | |||
| Tx,Ty/(±N∙m) | 10 | ±0.00125 N∙m | |||
| Tz/(±N∙m) | 10 | ±0.00125 N∙m | |||
Publisher’s Note: MDPI stays neutral with regard to jurisdictional claims in published maps and institutional affiliations. |
© 2022 by the authors. Licensee MDPI, Basel, Switzerland. This article is an open access article distributed under the terms and conditions of the Creative Commons Attribution (CC BY) license (https://creativecommons.org/licenses/by/4.0/).
Share and Cite
Lin, X.; Lin, B.; Xia, D.; Lin, L.; Yuan, Z. Effects of Wind Barriers on Wind Fields and Vehicle Stability on Bridges. Atmosphere 2022, 13, 318. https://doi.org/10.3390/atmos13020318
Lin X, Lin B, Xia D, Lin L, Yuan Z. Effects of Wind Barriers on Wind Fields and Vehicle Stability on Bridges. Atmosphere. 2022; 13(2):318. https://doi.org/10.3390/atmos13020318
Chicago/Turabian StyleLin, Xiaobo, Bin Lin, Dandan Xia, Li Lin, and Zhiqun Yuan. 2022. "Effects of Wind Barriers on Wind Fields and Vehicle Stability on Bridges" Atmosphere 13, no. 2: 318. https://doi.org/10.3390/atmos13020318