Abstract
Dust storms are meteorological hazards associated with several adverse health impacts including eye irritations, respiratory and cardiovascular disorders, and vehicular road accidents due to poor visibility. This study investigated relations between admissions from a large, public hospital that serves people living in Northern Cape and Free State provinces, South Africa during 2011 to 2017, and meteorological variables (temperature and air quality) during two dust storms, one in October 2014 (spring) and the second in January 2016 (summer), identified from the media as no repository of such events exists for South Africa. Distributed nonlinear lag analysis and wavelet transform analysis were applied to explore the relationships between hospital admissions for respiratory and cardiovascular diseases, eye irritation, and motor vehicle accidents; maximum temperature, and two air quality ‘proxy measures,’ aerosol optical depth and Ångström exponent, were used as ground-based air quality data were unavailable. Eye irritation was the most common dust-related hospital admission after both dust storm events. No statistically significant changes in admissions of interest occurred at the time of the two dust storm events, using either of the statistical methods. Several lessons were learnt. For this type of study, ground-based air quality and local wind data are required; alternative statistical methods of analysis should be considered; and a central dust storm repository would help analyze more than two events. Future studies in South Africa are needed to develop a baseline for comparison of future dust storm events and their impacts on human health.
1. Introduction
The frequency and intensity of dust storms has been increasing over the past decade [1,2,3]. Forecasts project that their incidence will continue to increase because of both climate change and anthropogenic activities [4]. Dust storms occur from the combination of strong winds and loose dry soil surfaces in arid and semi-arid areas. Fine dust particles may be lifted high into the atmosphere and swept by strong winds in large amounts over long distances including across continents [5]. Depending on the weather conditions and particle size, dust can remain in the atmosphere for a few hours up to more than a week. Human activities, including changes in land-use and agricultural practices leading to erosion, influence the frequency and intensity of dust storms [6].
Dust storms can reduce visibility due to large concentrations of particulate matter (PM) and increase exposure to microorganisms, pollens, and harmful pollutants, such as toxic metals, e.g., in dust coming from mines [7]. PM and its chemical constituents may cause, worsen, and/or lead to increased hospital admissions due to respiratory symptoms (cough and wheezing) and diseases (asthma and pneumonia); cardiovascular diseases (myocardial infarction, stroke, heart failure, and arrhythmias); conjunctivitis, skin irritation, and meningococcal meningitis [5,7]. Population subgroups such as children, pregnant women, neonates, people with chronic cardiopulmonary diseases, and the elderly are especially vulnerable to these effects [4]. Dust storms have also been associated with transport accidents involving motor vehicles and aircraft [8].
In South Africa, there is no available repository or database of dust storms. Use of satellite data to detect dust storms has been reported sporadically by the South African Weather Service (SAWS). For example, in September 2013, one dust storm was identified over the Free State [9], a province that has large agricultural areas that are sometimes left exposed or are overgrazed, leading to dry, loose, and bare sandy soil [6]. During the storm, the suspended dust was present for four hours with observed wind gusts up to 65 km/h. The long-range transport over the South African interior affected the Gauteng province that houses more than 15 million people. Dust storms captured via satellite imagery over the interior of South Africa have shown an increase in occurrence between 2006 and 2016 [6]. Additionally captured via satellite imagery, dust plumes turned skies red in September 2019 in Alexander Bay in the Northern Cape province [10]. SAWS also reported large dust storms that swept across most parts of the country in October 2014 [11] and January 2016 [12].
In these dust storm reports, no mention of any health impacts was made. This may not be surprising, given that, despite the known negative effects that such dust storms can have on the environment, climate system, and atmospheric chemistry, previous studies of dust storm events on health have shown mixed evidence, including small or no effects [13,14,15]. Given the dearth of these studies in South Africa, we aimed to consider the relationships between meteorological variables, namely temperature, tropospheric column aerosol optical depth, and Ångström Exponent (as a proxy of ‘air quality’) observed during dust storm events of October 2014 and January 2016, and hospital admissions for respiratory and cardiovascular diseases, eye irritation, and motor vehicle accidents from a large, public hospital on the border of the Free State and Northern Cape provinces.
2. Materials and Methods
2.1. Study Setting and Design
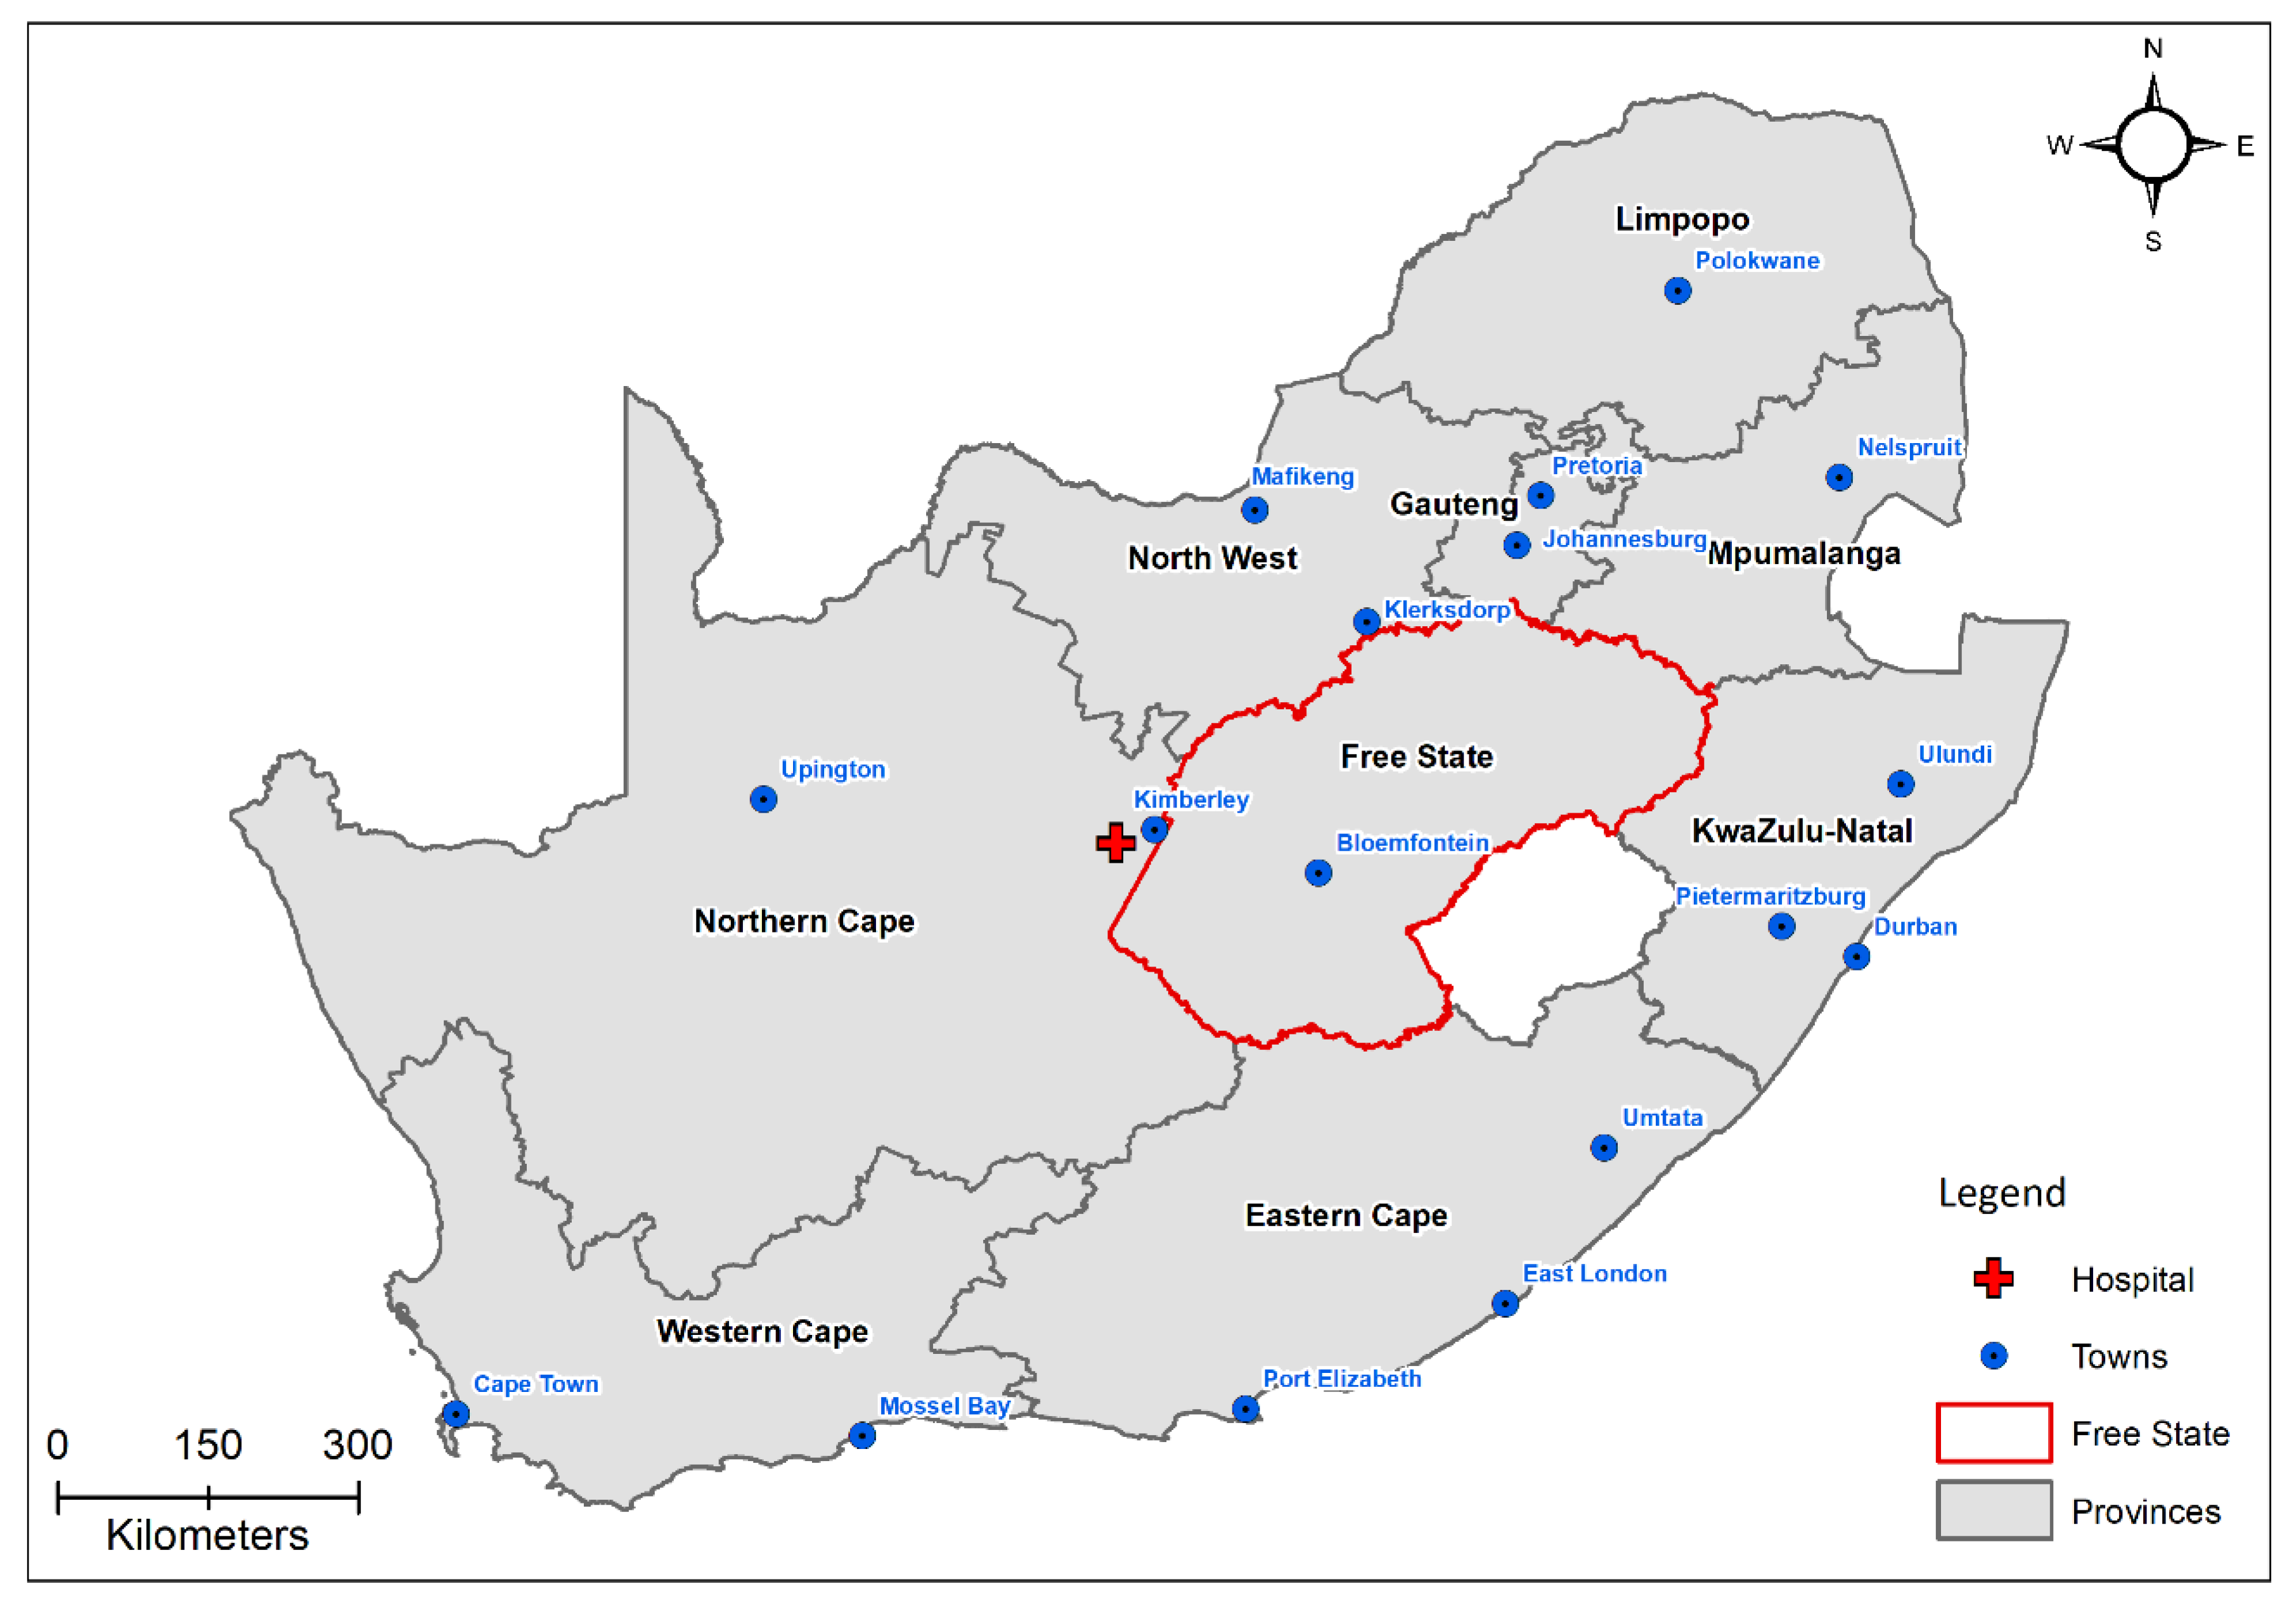
The study was a retrospective analysis of cause-specific hospital admissions at a large, district hospital in Kimberley (28.72° S, 24.74° E) in the Northern Cape province of South Africa (Figure 1) but which also serves people living in the Free State province. The province has a continental climate with warm summers (December–February) and cool winters (June–August). Summer average minimum and maximum temperatures are 21 °C and 32 °C, respectively, while winter average minimum and maximum temperatures are 7 °C and 18 °C, respectively. Average annual rainfall in the area is 350 mm.
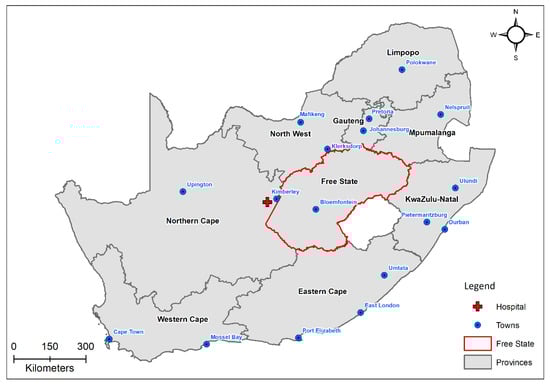
Figure 1.
The study area showing Kimberley and the location of the hospital in relation to the Northern Cape and Free States provinces in South Africa.
The dates of the dust storms of interest were determined from online media reports as no repository of dust storm events is maintained in South Africa. Large dust storms reportedly occurred around 16 October 2014 and 13 January 2016 in the Northern Cape province. Hospital admissions for ~three years prior to the first dust storm and one year after the date of the second dust storm were retrieved from the hospital’s records.
We attempted to confirm the occurrence of the dust storms using data obtained from the European Organization for the Exploitation of Meteorological Satellites (EUMETSAT) to create Red Green Blue (RGB) composite images to investigate the presence of the 2014 and 2016 dust storms occurring around the time of the media’s report (Figure A1 in Appendix A). However, due to cloud contamination, it was not possible to confirm the occurrence of the dust storms in this manner.
2.2. Hospital Admissions Data
Handwritten, nondigitized, daily hospital admission records for January 2011 to December 2017 were collected from Kimberley Hospital. The Kimberley hospital is frequented by people living in both the Northern Cape and Free State provinces as it is located very near to the provincial border, hence the selection of this large, public hospital for the study. Research ethics clearance to obtain the data for the analyses was granted by the South African Medical Research Council (EC012-6/2017).
The data were collected by the scanning of medical admission record books using an SV 600 overhead snap scanner. The scanned medical record book pages were saved as soft copies in PDF format and were printed and captured into EpiData software by data capturers. Respiratory and cardiovascular diseases, eye irritation, and motor vehicle accident outcomes were extracted from the hospital admissions records using criteria and terms from the dataset (see Table A1 in Appendix A for these terms). Unfortunately, some admissions books were missing, providing a dataset of N = 8184 daily admissions for data analysis.
2.3. Meteorological Data
The meteorological datasets used in this study were obtained from reanalysis data and/or satellite observations as no ground-based meteorological (not freely available) or air quality data (no stations in study area) were available in the study area. Each dataset was obtained for an area over Kimberly and for the period 2011 to 2017.
Temperature datasets were obtained from the Copernicus Atmosphere Monitoring Service (CAMS) reanalysis dataset. Daily values from 12:00 UTC were used throughout.
Daily aerosol optical depth (AOD) data at 388 nm were obtained from the Ozone Monitoring Instrument (OMI) through the Giovanni Data Portal. The data from OMI have a spatial resolution of 0.25° [16]. Daily Ångström Exponent (AE) data from the Moderate Resolution Imaging Spectroradiometer (MODIS) were obtained for the same period and have a spatial resolution of 1° [17]. AE gives a qualitative indication of the aerosol particle size. Both AOD and AE are for the tropospheric column and not only ground-level pollutants. However, during a dust storm, it would be expected that the dust dominates the column, and these are appropriate proxies for ground-level ‘air quality.’ Temperature and ‘air quality’ (i.e., AOD and AE) records used for the analysis were daily averages of collected records.
2.4. Statistical Analyses
Several statistical techniques were applied to the data to assess the possible association between meteorology and air pollution and cause-specific hospital admissions. These included Poisson Generalized Linear Regression models within the Distributed Lag Non-linear Model (DLNM) framework [18] and Poisson Regression Analyses. However, these did not yield significant results, due to the large proportion of missing data (71%) for AOD, which was used as the air pollution parameter.
Secondly, wavelet transform (WT) analysis was used to explore the relationship between climate and cause-specific hospital admissions. The WT method has proven effective to identify links and temporal relations (timings and delays) between changes in meteorological or air quality variables and the changes in number of hospital admissions in our previous work [19].
The WT method was introduced to expand the limits of Fourier transform analysis, specifically to achieve better signal localization in time and frequency [20]. In general, WT performs two-dimensional time (or space, depending on the nature of data series; in this paper, we refer only to time decomposition as we used WT for time series analysis) and time scale decomposition with functions constructed by expanding by time scale and translating along real time of a specifically chosen original wavelet function [21], also called the mother wavelet. In this way, the wavelet transforms of a discrete data series are defined as:
In Equation (1), the function is the mother wavelet, (*) marks the complex conjugate, while and are scale (dilatation) and coordinate (translation) parameters, respectively. We do not present the general wavelet theory or mathematical criteria set for mother wavelets here—for those, we refer to original articles such as Morlet [22] or Grossmann and Morlet [23], or to reviews, practical and tool guides, in Asaf’eva [24], Torrence and Compo [21], or Addison [25]. In theory, and according to the definition given in Equation (1), wavelet coefficients contain information about both the investigated data series and analyzing wavelet function. It is therefore important to carefully choose the mother wavelet prior to the statistical analysis, as adequate for data series and the goals of the analysis.
We used Morlet wavelets of the 6th order [26] as the analyzing wavelet basis. As other mother wavelet functions, Morlet wavelets are oscillatory functions that, unlike Fourier harmonics used for Fourier transform analysis, decay rapidly toward infinity [21]. This property allows for the ability to investigate local (in real time) changes of analyzed records [21]. To achieve this, we calculated local wavelet power spectra (LWTS), defined as relative contributions of the analyzed time series’ energy at a specific scale and a point in time :
A plot of is usually presented as a color map of intensities in relation to real time (x-axis) and time scale (y-axis). This enables detailed inspection of the change in wavelet coefficients on different time scales, over real time.
We also calculated local wavelet cross-correlation spectra (LCWTS), to investigate possible effects of meteorological and environmental variables on hospital admission data. For any pair of data series and (), LCWTS are defined [21,25] as:
As LCWTS are given in Equation (3) complex functions, we used their absolute values that can be presented as color maps in the same way as LWTS, in relation to real time (x-axis) and cross-correlation time lag (y-axis). LCWTS thus inform the local covariance, or local energy coincidence, of different time series at each moment in time, and of the time lag between those coincidences [27]. Assessments of wavelet cross-correlations are usually followed by assessments of phase differences between the two records and . We did not calculate phase differences in this study, because we assumed that the public health outcomes follow (that is, at least partly result from) specific meteorological or environmental variations [28]. Thus, the time lag that appeared in our results was presumed to inform on the delay (or duration of time intervals) between the onset of changes in meteorological or air quality variables and specific related health outcomes.
To obtain statistically significant results and avoid effects of records’ finite sizes on WT statistics, we calculated LWTSs and LCWTSs between the time scales of and [29]. For our dataset of a time series length of daily admissions, this limits our investigation to a maximum of approximately 27 months. Finally, to assess the significance of LWTS and LCWTS results, we used the significance test developed in [21], where local wavelet (or cross-correlation wavelet) spectra of time series are compared with the spectrum of the stochastic univariate lag-1 autoregressive (AR (1), or Markov) red noise process. If, at any point, the local spectrum of the time series is outside the AR (1) spectrum with the 95% confidence level, it is assumed that this feature of the time series is different from the background noise [21].
3. Results
3.1. Hospital Data Description
There were 33,424 admissions collected from the hospital records for the period 1 January 2011 to 31 December 2017. Among all hospital admission records, the four outcomes of interest relating to dust storm human health impacts accounted for 8184 of the total admissions collected (Table 1). There were relatively equal numbers of females and males, and equal numbers of individuals per age category. Table 2 considers the admission outcomes of interest for the time of the two dust storms, as well as several days thereafter.

Table 1.
Descriptive findings for the hospital admissions by gender, age, and outcomes of interest for admission for 1 January 2011 to 31 December 2017 (data available n = 8 173, missing data for 11 individuals).
Table 2.
Study outcomes of interest from the hospital admissions from the date of the two dust storm events and up to 40 days after the events. Motor vehicle accidents are not included. It is important to note that motor vehicle accidents in the days after the dust storms may not be connected to these events, bearing in mind that poor visibility may occur for only a few days after a dust storm event. Hence, we did not include them in this table.
3.2. Findings of the Wavelet Transform Analyses
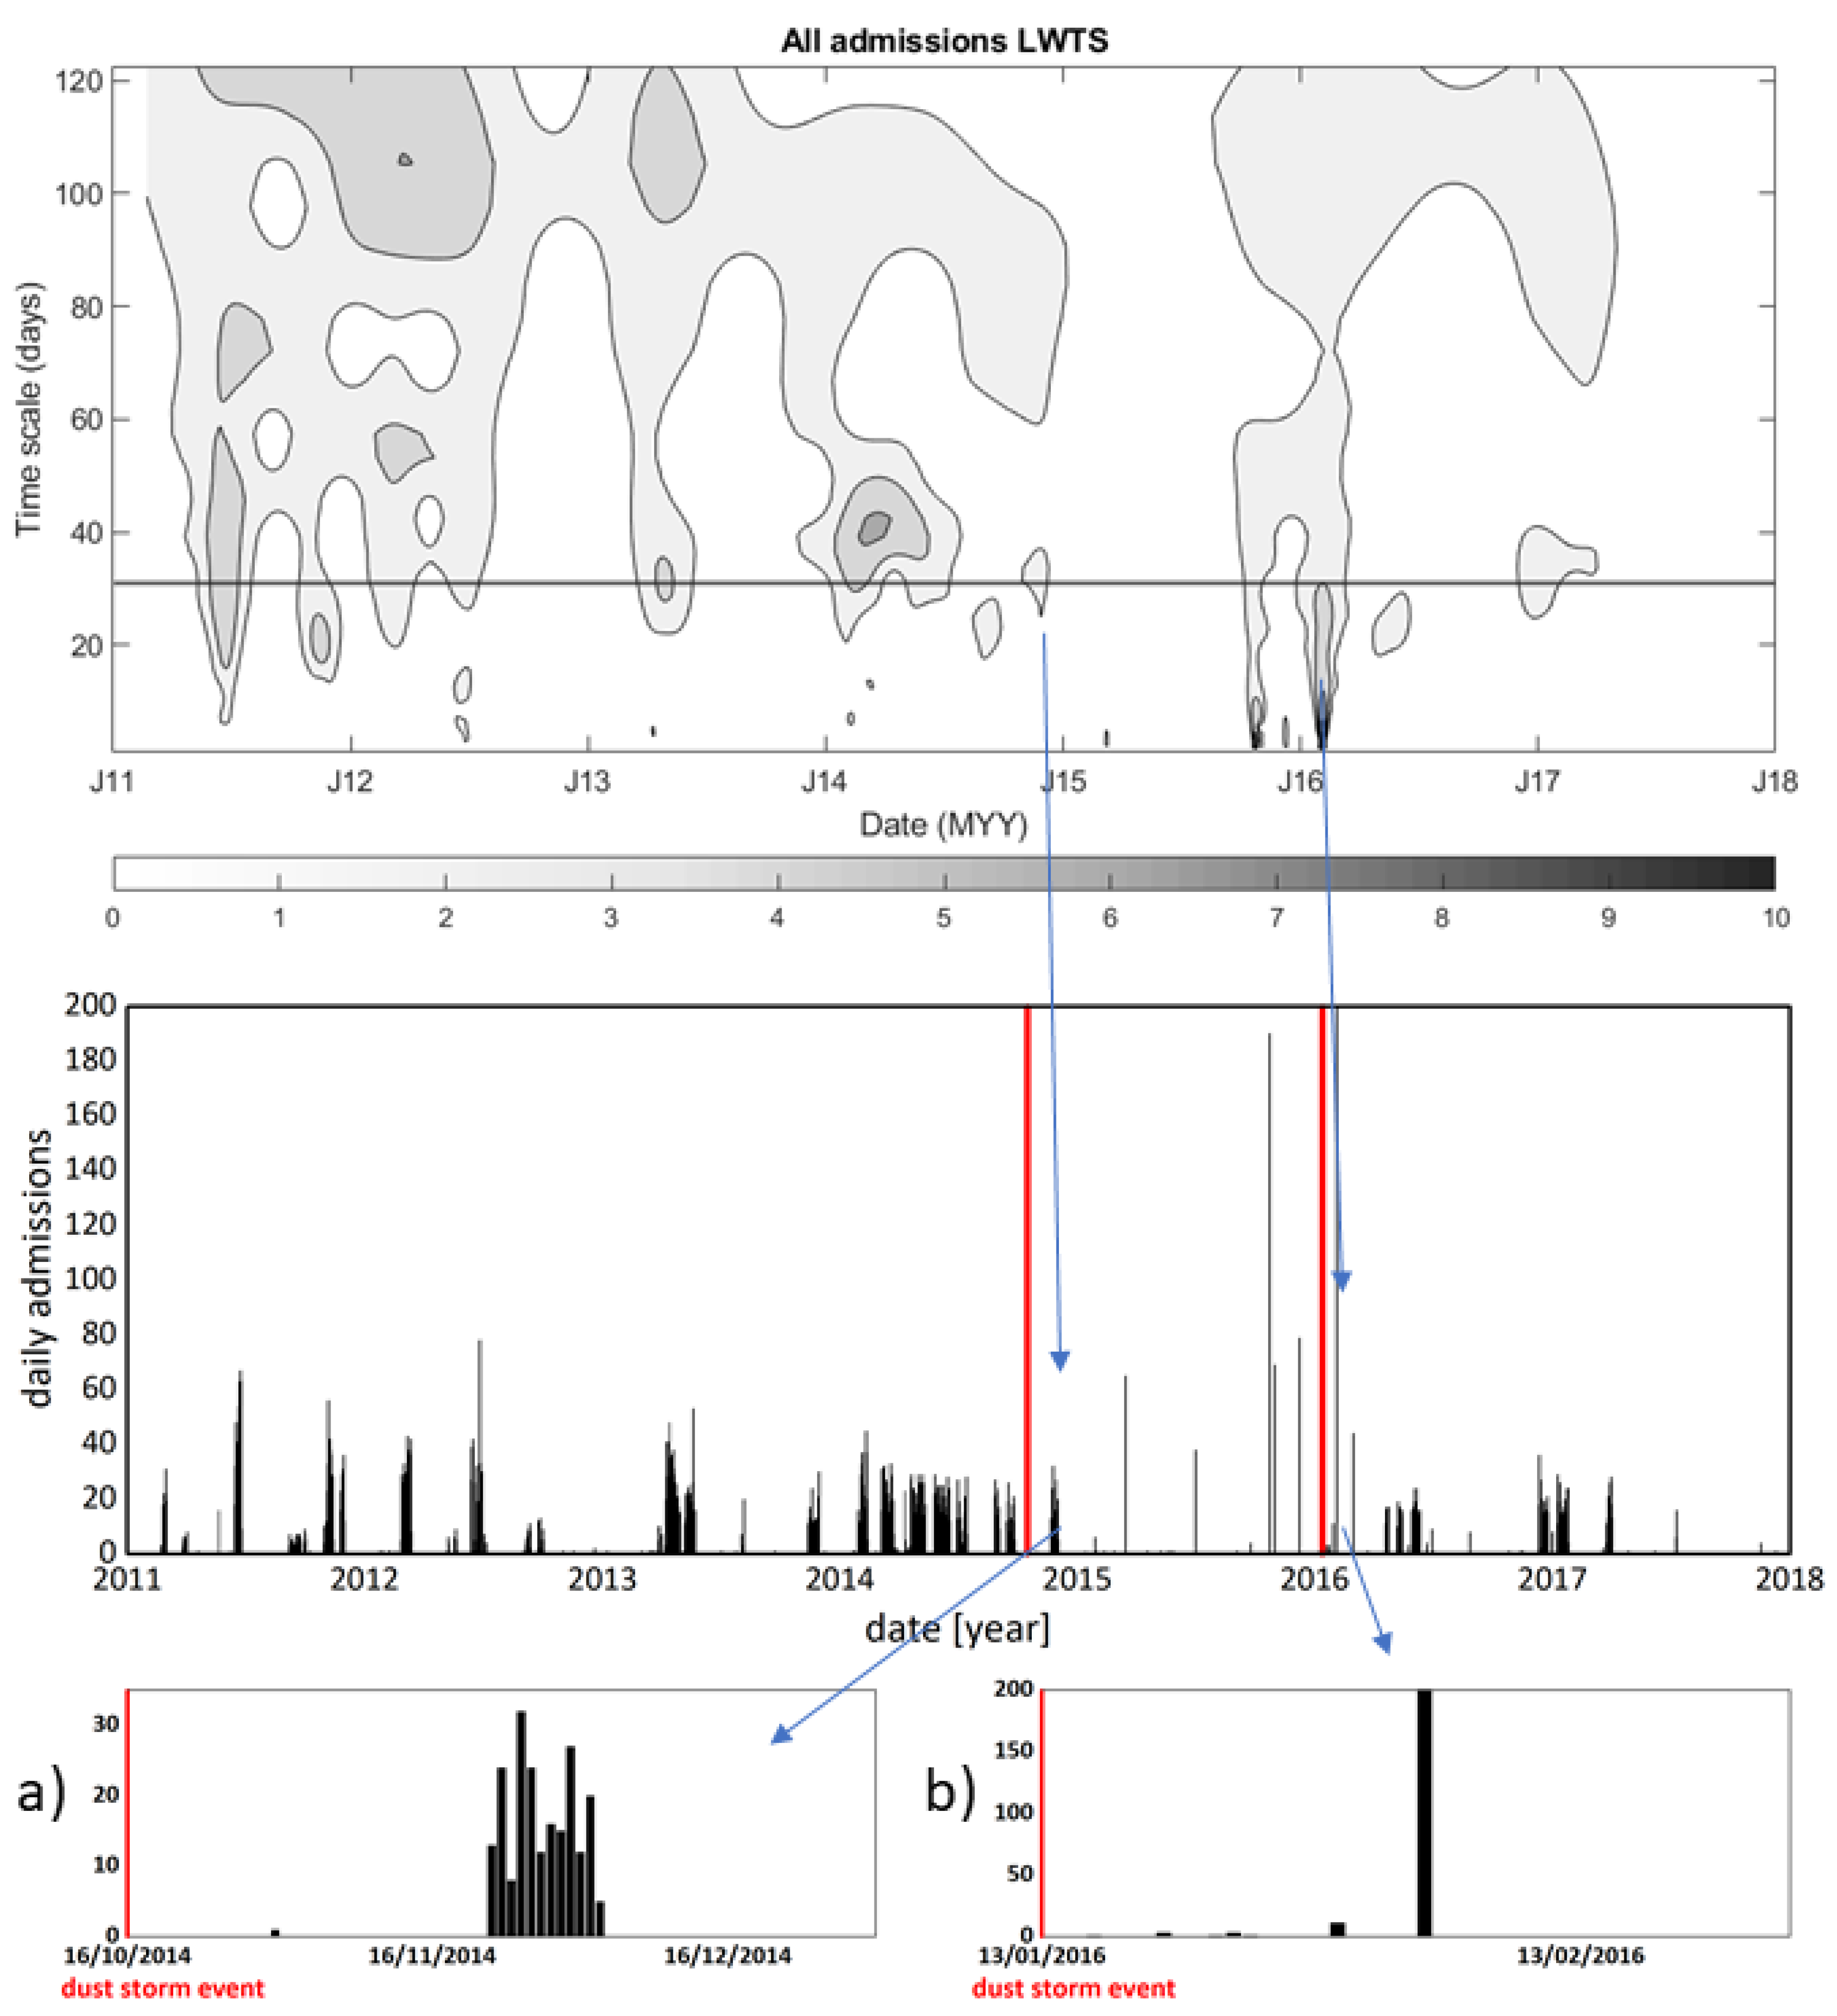
In Figure 2, a local wavelet transform spectrum (LWTS) for all admissions’ data series is presented, together with all admissions series’ original (raw) data. The LWTS for all admissions does not present any significantly different change in the values of WT coefficients at or around the time of the dust storm event on 16 October 2014 in comparison to the rest of the series. What is visible from the LWTS of all admissions (Figure 2, top row) is that, at the time of this dust storm event, the LWTS presents with a cluster of WT coefficient values at time scale intervals from approximately 25 to 40 days. This may be an indication of a change in all admissions data that is delayed and takes place after the date of the dust storm event, for the duration of 25–40 days [21].
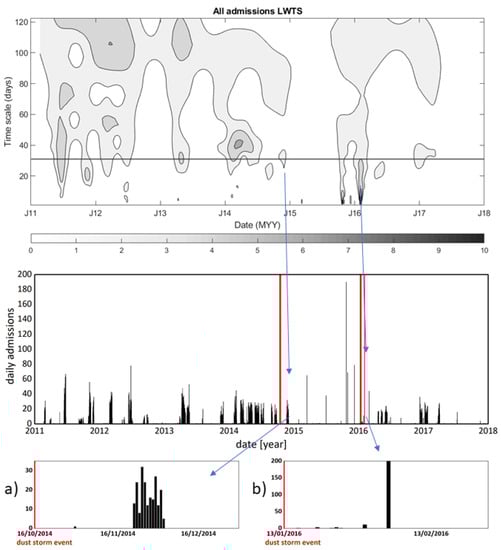
Figure 2.
Top row: LWTS data, and Middle row: raw data of the hospital admissions records. Horizontal line at the time scale of 31 days (one month) in LWTS is given as a visual guide. Blue arrows connect changes in LWTS that appear at dates of dust storms with changes in all admissions data that appeared after the dust storm events. These changes are further connected with blue arrows to the corresponding outsets: Bottom row (a); and Bottom row (b): the admissions original record that present only groups of admissions that may be related to dust storms. Red vertical lines in the raw data graph and the outsets graphs indicate the dates of the dust storm events.
There is a cluster of daily admissions in the raw data series (Figure 2, bottom a)) that starts on 22 December 2014, 36 days after the dust storm event, and lasts for 12 days. This is (as shown in the outset (a) graph in the bottom row of Figure 2) also the first increased admissions event that follows this dust storm. In that respect, the LWTS change that appears on the date of the dust storm event of October 2014 may be partly a health-related consequence of a dust storm and was further investigated.
The event from 13 January 2016 also presents as significantly important in the admissions’ LWTS in Figure 2. Namely, the visible change in WTS values starts about three days from the onset of the y-axis, at the date of the dust storm event, and builds up in a vertical structure that reaches high values of time scales, with visibly high values of WT coefficients to up to scales of approximately 20 to 30 days.
It is apparent from the raw data (middle row of Figure 2 and bottom row b) that hospital admissions start three days after this event, and present with one significant peak 21 days after the event on 4 February 2016. This peak is, at the same time, the maximal number of single-day admissions entries for the entire data record.
Clusters of admissions after the dust storm events, depicted in Figure 2, contain 208 entries over 12 days (for the October 2014 event) and 327 entries over 21 days (for the January 2016 event) (Table 2). Those do not differ statistically from the rest of the dataset in relation to the age or gender at admission. The significant statistical differences that both data groups present are an elevated number of admissions for eye irritation.
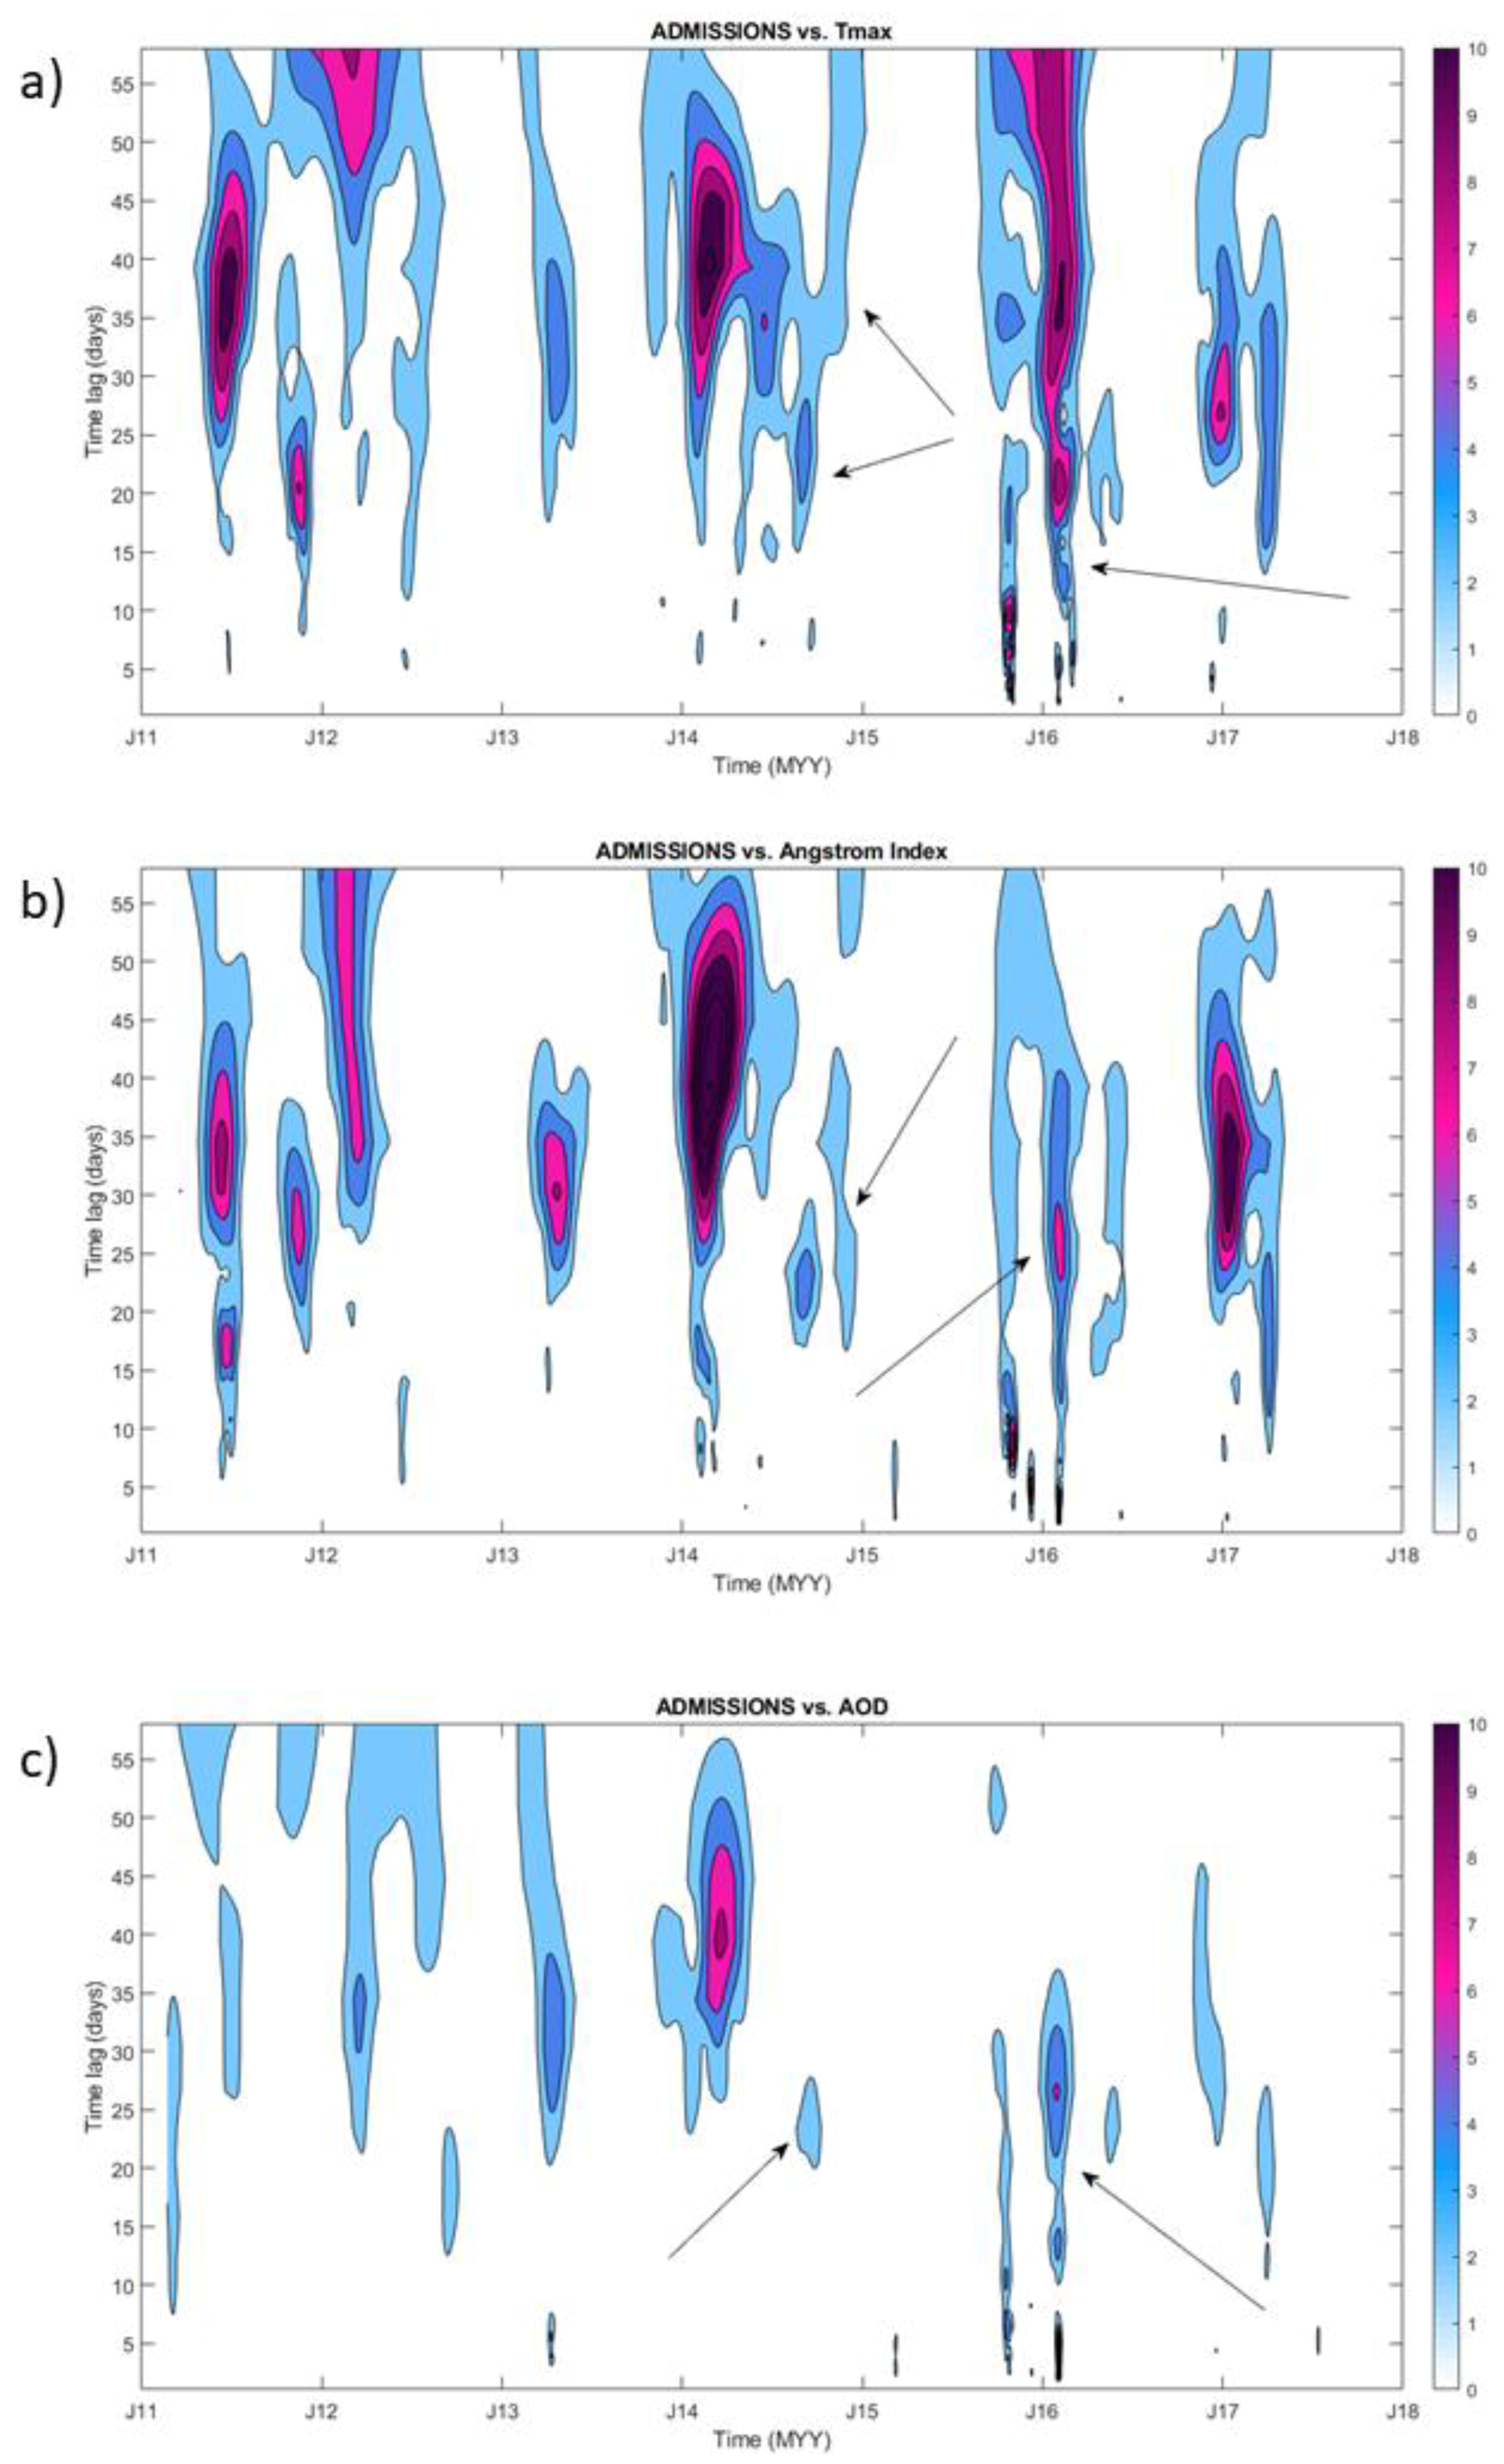
To further examine possible drivers of these changes in the LWTS of all admissions presented in Figure 2, we calculated local wavelet cross-correlation spectra (LCWTS) of hospital admissions versus Tmax, AOD, and AE data, for the entire period of the hospital admissions time series record. The LCWTS results shown in Figure 3 give information about coincidences of changes in values of daily numbers of hospital admissions with a change in Tmax, AOD, and AE. Positions of these changes on the y-axis inform the time lag, or the delay, between changes in Tmax or ‘air quality’ proxies and changes in admissions. It is visible from Figure 3 that cross-correlations between Tmax, ‘air quality,’ and hospital admissions do appear at the time of both dust storm events.
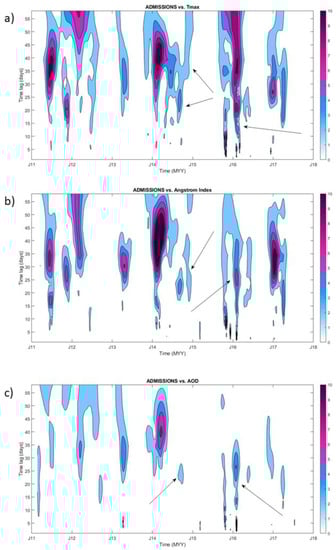
Figure 3.
Local cross-correlation wavelet spectra of all admissions records versus (a) Tmax, (b) AE, and (c) AOD data, for the entire period of hospital admissions recording. Arrows point to values in local cross-correlations space that appear at the time of the dust storm event. The color scale codes the values of wavelet cross-correlation coefficients .
For the event in October 2014, this appears with a time lag of approximately 15 to approximately 40 days, while for the January 2016 event, local wavelet cross-correlations start almost at the onset of the y-axis, i.e., at the date of the event, and build up into a vertical structure up the y-axis.
Coincidences in changes with all admissions records are more prominent for Tmax and AE data and less prominent for AOD. In Figure A2, we present the cross-correlation wavelet spectra of hospital admissions with Tmax, and AEs are given together with the 95% confidence level that was derived as in [21] using the red-noise spectral background. Cross-correlations for all variables are more prominent for the January 2016 dust storm event.
Finally, we calculated LCWTSs of Tmax and ‘air quality’ variables. We were interested to examine dates of coincidences in those variables in relation to the date of the dust storms. In that respect, we were looking only at x-axis values of the onsets (start of LCWTS vertical structures) of LCWTS events and were less interested in how those evolve over time scale (y-axis).
We present results for local cross-correlations of AE with Tmax and AE with AOD data for the entire period of hospital admissions (Figure A3). It is apparent that the coincidence in changes in AE and Tmax slightly precedes the dust storm event (for the interval of one to two days) in October 2014.
Coincidences are not visibly present right before or at the date of the dust storm event of January 2016, while the coincidence of ‘air quality’ variables occur at larger time lags for both dust storm events. Changes in AE in the days preceding the October 2014 dust storm could be because of the change in aerosol particle size that AE represents. The lack of changes before the January 2016 dust storm could be due to data gaps in the satellite observations.
We found a small increase in hospital admissions for eye irritation, an outcome that may be caused by dust exposure such as that experienced during a dust storm, up to 30 days after the occurrence of the dust storm.
4. Discussion
Using local wavelet transform analysis, we identified a cluster of hospital admissions for respiratory and cardiovascular diseases, and eye irritation (and motor vehicle accidents) that were recorded in time periods of 3 to 40 days after the two dust storm events. Adverse health impacts of dust exposure have been seen at lag 0 and 1 days up to lag 7 days or longer in different regions around the world [30,31].
The reasons for our results presenting with possible admissions of interest at up to 40 days of lag vary but may include outcomes that are different from previous studies, e.g., motor vehicle accidents that are probably not associated with dust storm events, as poor visibility that may cause these accidents may occur for only a few days after a dust storm event. Motor vehicle accidents are also common in South Africa for different reasons, including reckless driving and unfit vehicles among others [32].
Other factors such as high levels of aerosols in the atmosphere may arise from other sources beside dust storms, including regional transportation and, during October, wide-scale biomass burning in southern Africa [33,34,35]. These reasons may also explain why there appeared to be relatively high numbers of hospital admissions even before the dust storm events. South Africa is known for having high background levels of dust, as well as anthropogenic sources, e.g., from domestic solid fuel burning.
Using a different technique to most previous studies on dust storms and morbidity, we showed that our admissions of interest may be the result of the specific combination of Tmax and AE variations at the onset of the dust storm events. In this way, we were able to quantify and relate local meteorological and environmental conditions at the dust storm events with possible health outcomes.
A closer examination of the nature of health outcomes that followed the dust storms showed that the WT analysis singled out incidences of eye irritations after the dust storms in a small but statistically significant way. Epidemiological studies have reported that increases in hospital visits for conjunctivitis are significantly associated with air pollution [36,37], and previous research has shown that air pollution is higher during dust storm days compared to non-dust storm days [38]. This association could explain our finding that admissions for eye irritations were elevated during both dust storm events because the eye is one of the few organs that are constantly exposed to the external environment. Eye irritation is one of the most common health outcomes associated with hospital admission at the time of dust storms in Asia and the Middle East [5,39]. In a recent study in the southwestern US in which sound meteorological and PM data were available, small but statistically significant effects were found between sand and dust storms and hospitalizations for a range of health outcomes on the day and within a seven-day period after dust exposure [40]. Other studies have shown short-term effects of dust storms on the risk of mortality in Kuwait [41], Taipei [42], and Iran [43].
The reason why increased eye irritation admissions in our dataset were seen so relatively far after the dust storm events requires consideration bearing in mind that those are acute health outcomes. This remains for future work to be investigated, but there could be several possible reasons: increased levels of dust that remain in the atmosphere after the dust storms; incorrect data admission entry practices in local hospitals; or build-up of inflammation post-exposure.
It is believed that the prevalence of dust storms is likely to increase in places in South Africa that will experience reduced rainfall and increased periods of water scarcity/drought [44]. While various model projections for rainfall show little coherence, positive trends in annual rainfall totals over the southern interior in summer rainfall areas is expected with drying in the north and south-west [45]. Public awareness and actions, including early warning detection systems of a dust storm event, avoiding outdoor activities during the dust storm, and keeping the indoor air free from environmental dust, are needed in South Africa to protect human health. In that respect, further research is needed that will seek to understand the nature of specific changes in meteorological or air quality variables, as well as the PM concentrations in a dust storm, as they can be large and do effect human health, together with improved forecasting, so that early warning systems could be tailored around those health impacts.
We applied time series analysis, in a form of WT analysis, of available relevant climate and health data that enabled the identification of links between changes in climate data and changes in incidences of specific health outcomes that allowed for the quantification of time delays between these two outcomes. To further assess uncertainties related to provided associations between the hospital admissions and meteorological or air quality variables on a case-to-case basis, it is necessary to extend our work from time series analysis to event-based event coincidence analysis [46].
Several study limitations were considered. The hospital count for admissions is not necessarily the total admissions at that hospital for that day/month/year, but rather a total of the admissions that were captured by the hospital staff, available in hard copy and collected by the researchers and entered by the data enterers. In lieu of hospital admissions, mortality data might be worth exploring in the future if dust storm events were systematically recorded. As no database of dust storm events exists for South Africa, we relied on media reports to identify events.
In addition, as there were no freely available ground-based meteorological stations, and no nearby air quality-monitoring stations, we used satellite meteorological data to consider coincidences of changes in such data in relation to our health outcomes of interest at the time of and days thereafter the identified dust storm events. Other phenomena, such as strong winds or an event leading to motor vehicle accidents, may be the reason for increased admissions during the periods under investigation. It was not possible to investigate confounders in this study.
Critical lessons learned include that for this type of study, ground-based air quality and wind data are required. This highlights the need for continuous air quality and meteorological monitoring outside of only highly industrialized or urbanized areas. It is important to monitor air quality in areas, such as this site, that are impacted by natural sources (e.g., dust, biomass burning) especially as these sources’ impacts will be impacted by a changing climate. Regarding lag effects between dust storm events and eye irritations, one should investigate precipitation in the study area to assess whether conditions were dry or wet. Given that our study area receives its rainfall during summer/spring, this is an important consideration, as is the presence of the El Nino Southern Oscillation that can affect southern Africa.
Alternative statistical methods of analysis should be considered. For example, Tam et al. [38] used data from several hospitals over a period of 5 years and investigated the relations between PM10 concentrations and hospital admissions due to respiratory diseases using case-crossover analysis and Poisson regression. A central dust storm repository in South Africa would help identify and analyze more than two events. The definition of a dust storm should be considered and applied to distinguish dust storms from dusty conditions. A possible definition could be related to a locally appropriate air pollution index, although this would need to be developed, tested, and implemented. It is important to understand how dust exposure is associated with several disorders, and many of these causal associations remain to be elucidated.
5. Conclusions
Climate change is likely to lead to an increase in extreme events, including dust storms. Adverse health effects of exposure to excessive levels of dust are associated with mortality and morbidity, the latter usually captured by an increase in hospital admissions. In studying two dust storm events, we found some evidence of increased hospital admissions for eye irritation at the time of the dust storms. No other statistically significant findings were observed. Past studies’ findings have been mixed, showing some, little, or no effects between sand and dust storm events and health outcomes, warranting the need for additional research. Given the potential health threats, well-executed studies on the impacts of dust storms and health impacts will assist in setting up early warning systems to ensure clinical health preparedness and raising public awareness for appropriate safety measures ahead of dust storm events.
Author Contributions
Conceptualization: A.M. and V.N.; methodology: A.M. and V.N.; project administration: V.N. and Z.K.; supervision: A.M.; analyses: S.B.; writing—original draft: V.N. and C.Y.W.; writing—review and editing: All authors. All authors have read and agreed to the published version of the manuscript.
Funding
This research was funded by the South African Medical Research Council.
Institutional Review Board Statement
The study was conducted in accordance with the Declaration of Helsinki and approved by the Research Ethics Committee of the South African Medical Research Council (protocol code EC012-6/2017).
Informed Consent Statement
Written informed consent has been obtained from the hospitals to publish this paper.
Data Availability Statement
Data are available from the hospitals with appropriate permissions and ethics clearance in place.
Acknowledgments
We thank the hospital management and staff for granting access to the admissions data, the fieldworkers for collecting the data, and Copernicus Atmosphere Monitoring Information Service for provision of satellite data.
Conflicts of Interest
The authors declare no conflict of interest.
Appendix A
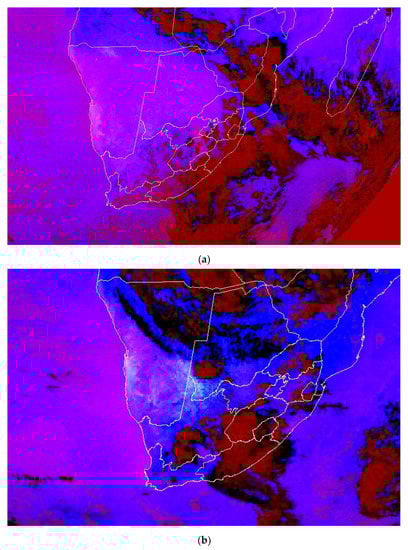
Figure A1.
EUMETSAT dust RGB image for (a) 16 October 2014 16:00 UTC and (b) 13 January 2016 15:00 UTC (©EUMETSAT) using these three different colors to identify atmospheric properties: Red discriminates dust from ice and water, discriminates thick and thin clouds, and detects moisture boundaries. Green detects cloud phase, identifies optical properties, and detects dusts and moisture features. Blue detects cloud top temperatures. Dust clouds are generally at a low level and have a high contribution of blue. Therefore, the contribution of red and blue means that dust is represented by a magenta color. In the event of 2016, it is not possible to detect dust beneath the cloud.
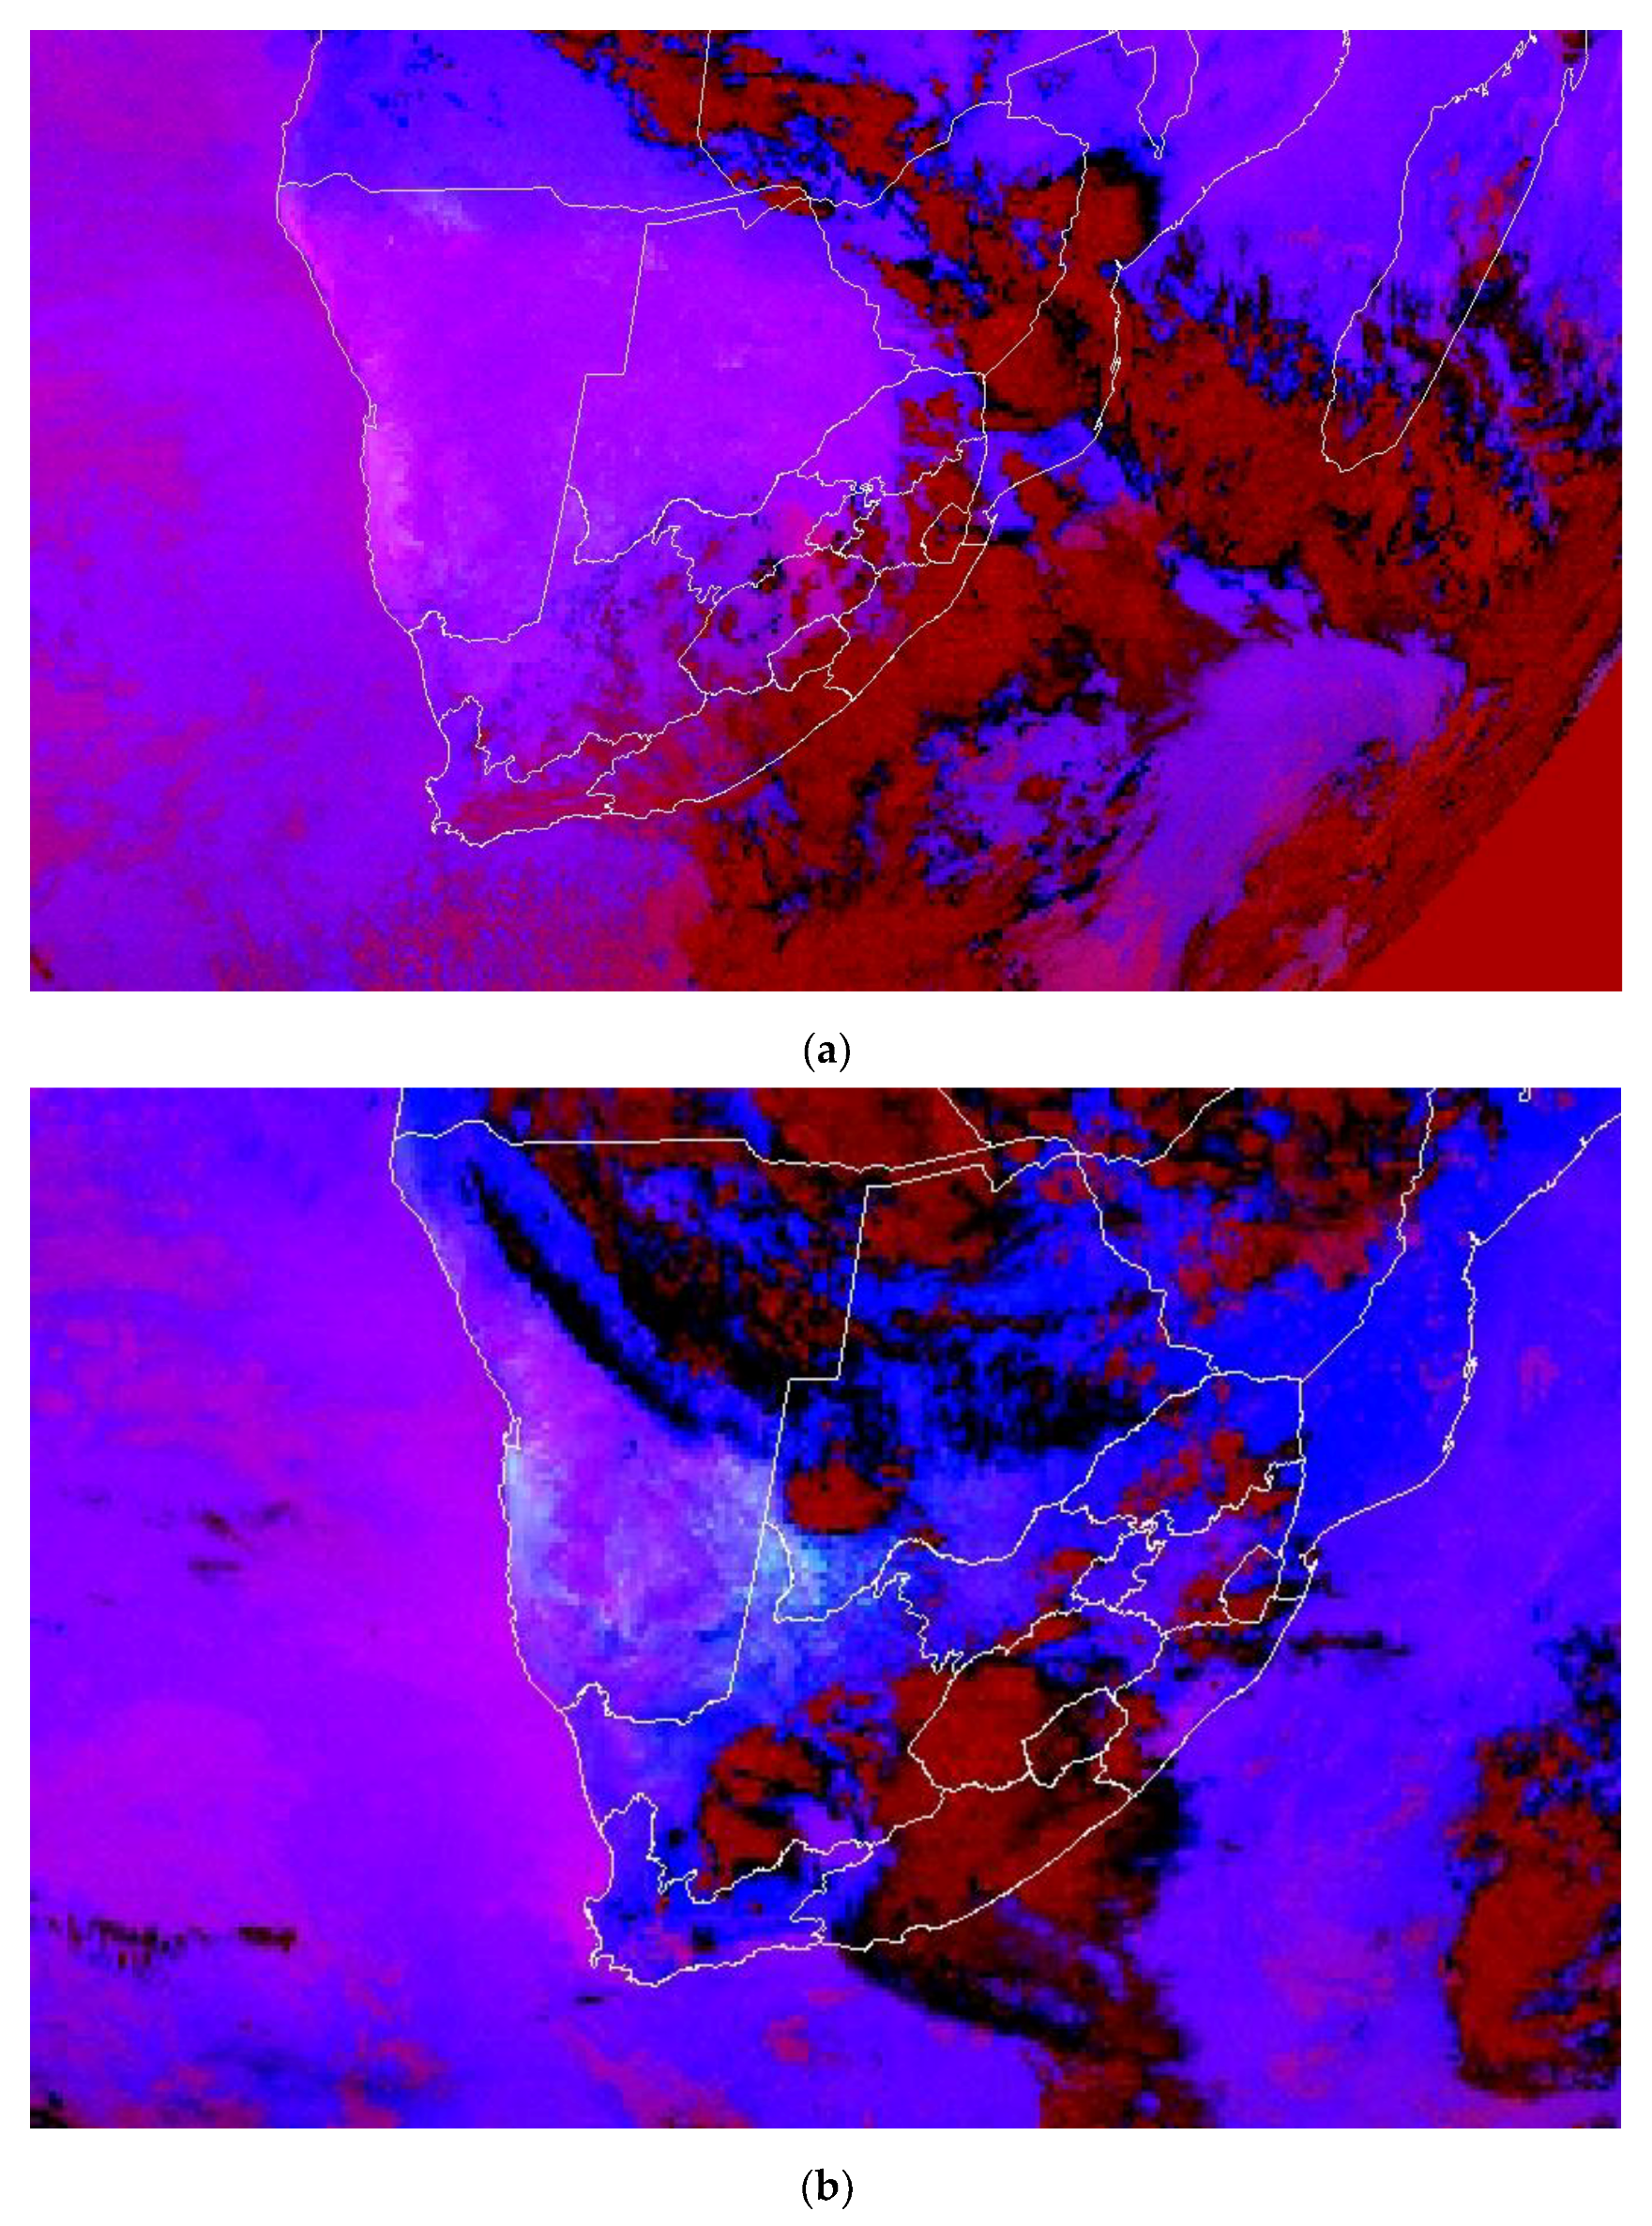
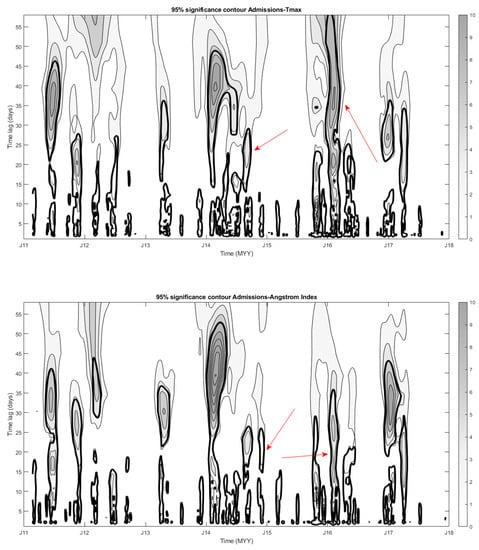
Figure A2.
Cross-correlation wavelet spectra of hospital admissions and Tmax (top) and hospital admissions and AE (bottom). Tick contours are 95% confidence against AR(1) red noise. Arrows point to the values of wavelet cross-correlations at the time of dust storms.
Figure A2.
Cross-correlation wavelet spectra of hospital admissions and Tmax (top) and hospital admissions and AE (bottom). Tick contours are 95% confidence against AR(1) red noise. Arrows point to the values of wavelet cross-correlations at the time of dust storms.
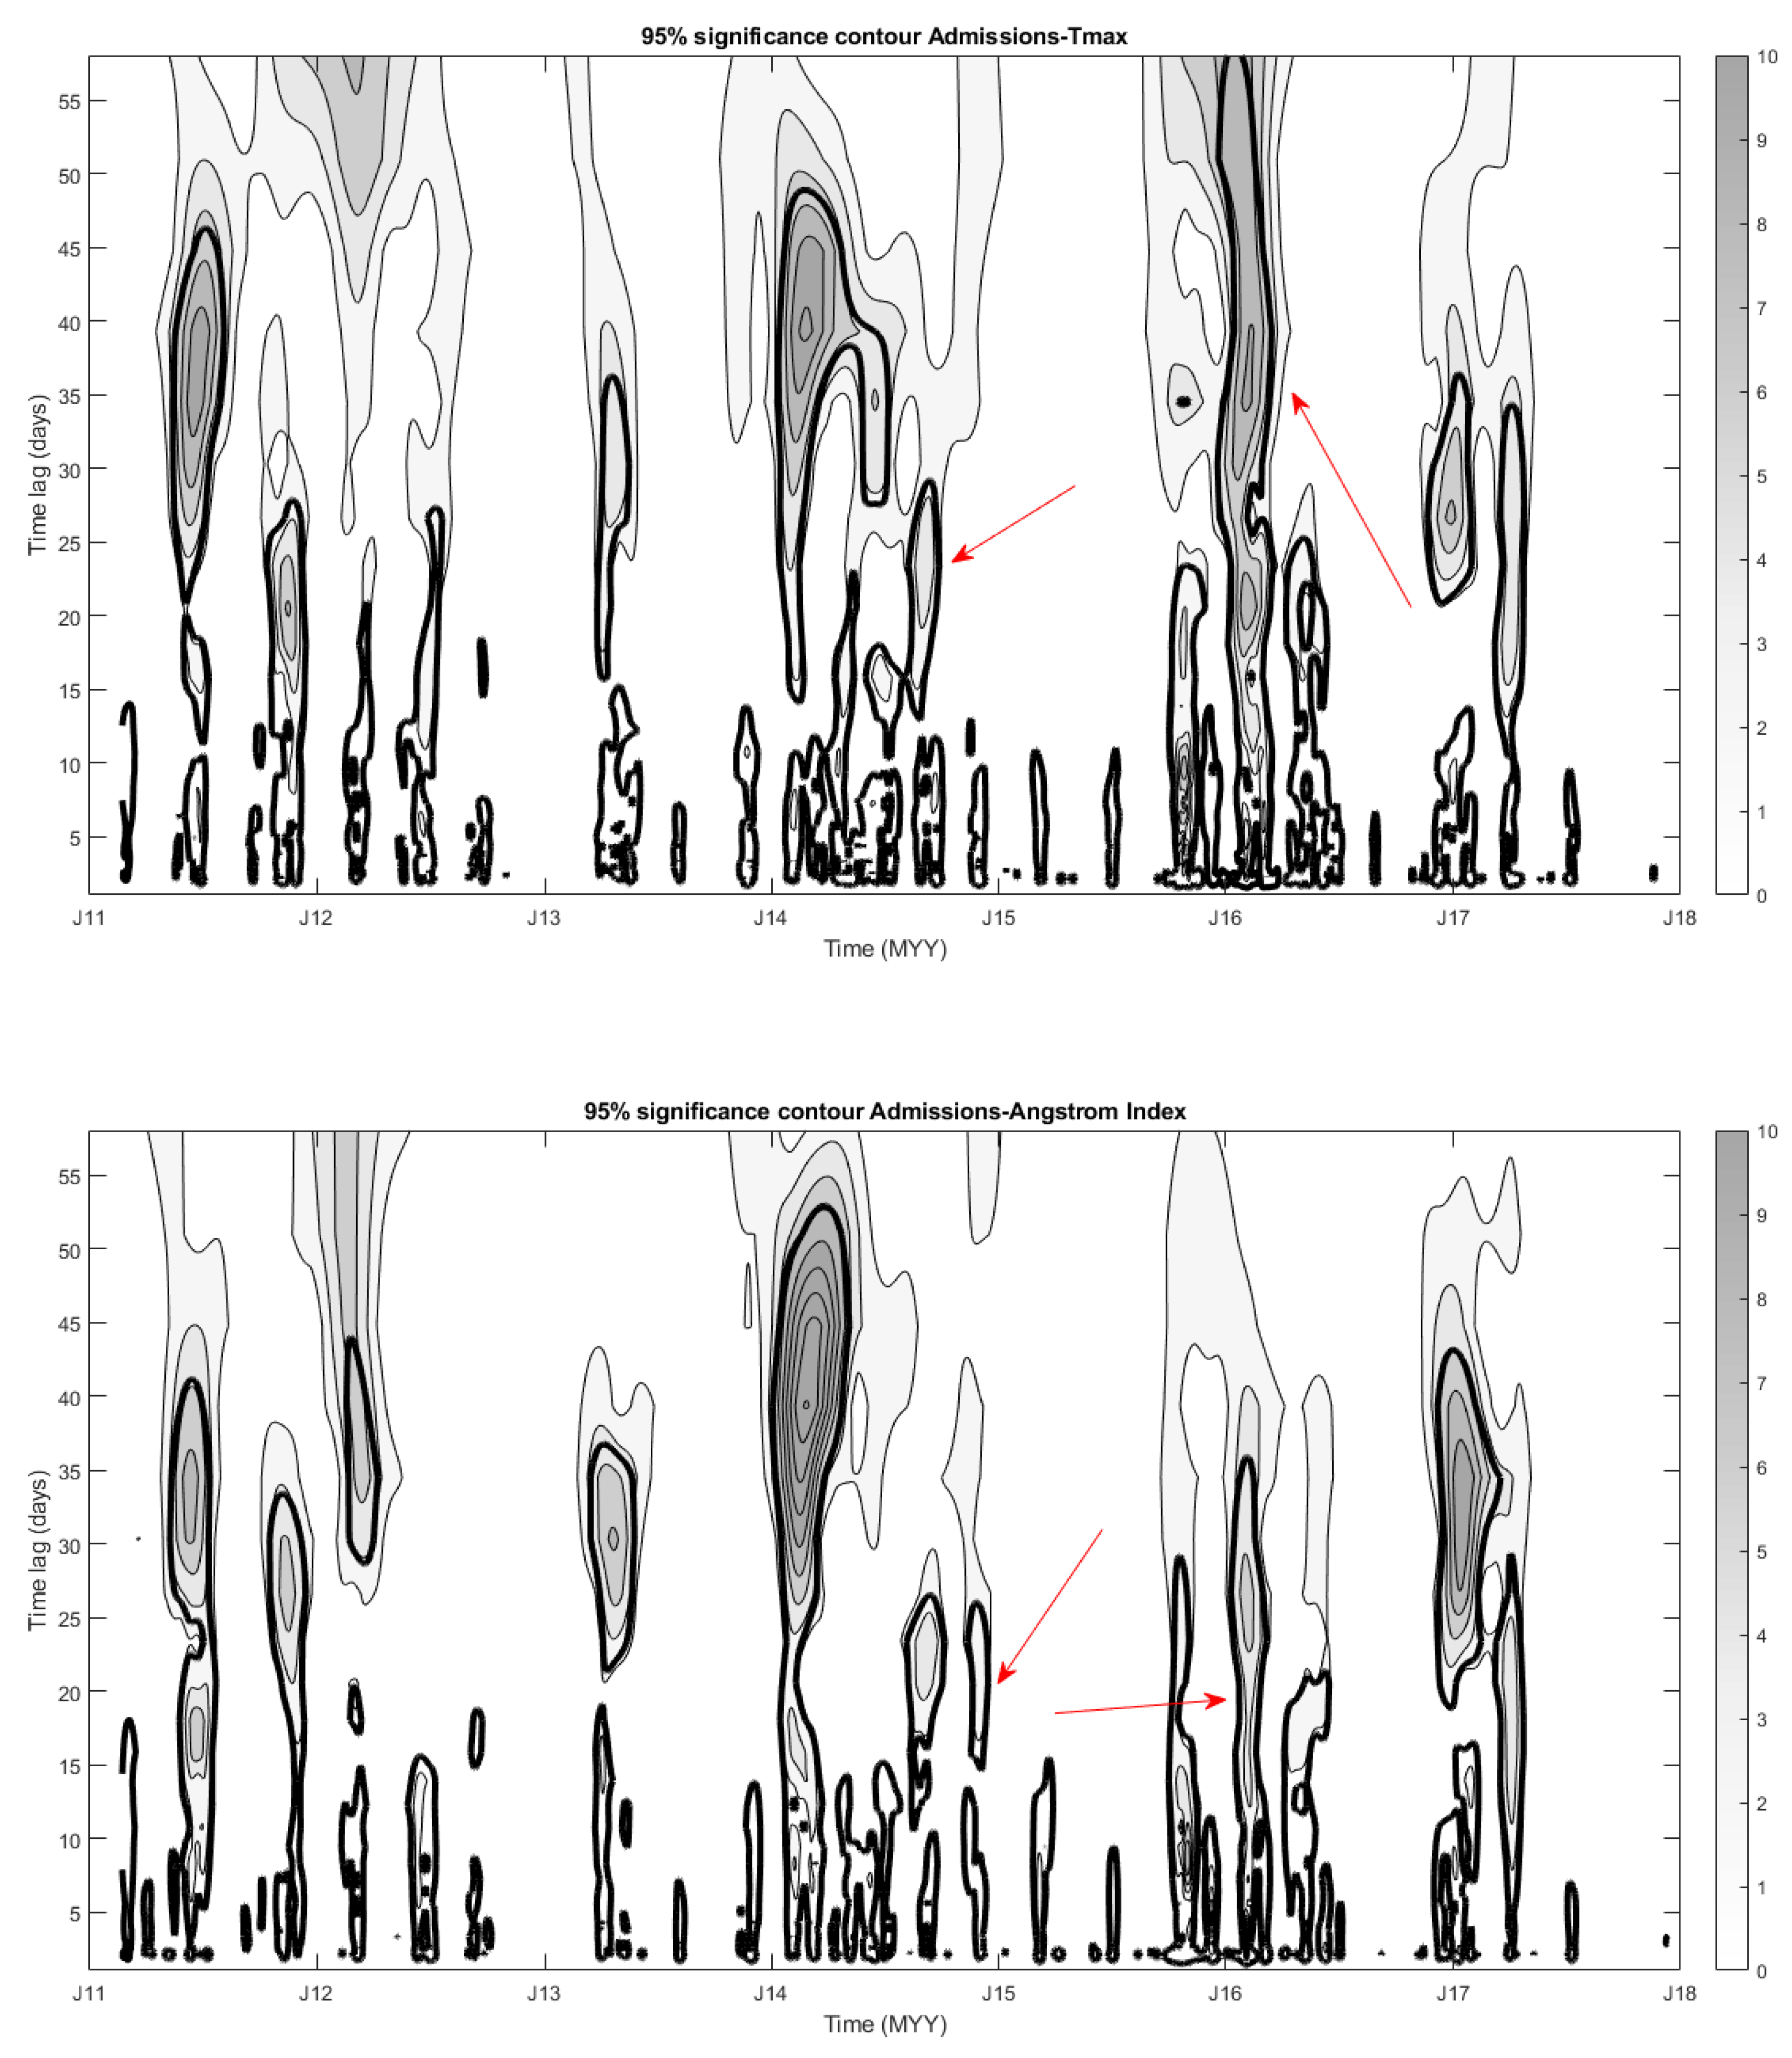
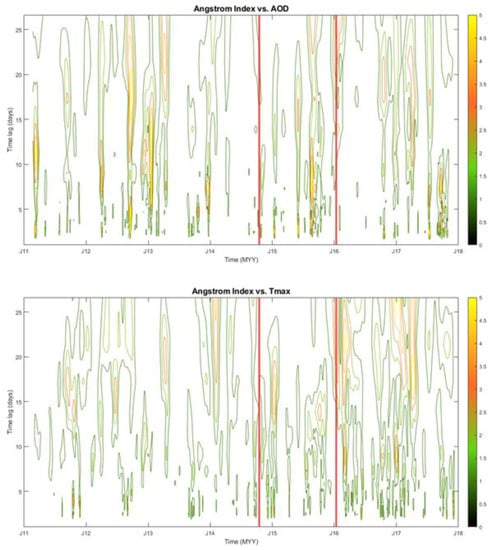
Figure A3.
Local cross-correlation wavelet spectra for Ångström index data versus Tmax (top) and AOD (bottom) records. To examine dates of cross-correlations, we were looking only at x-axis positions of vertical lines on LCWTS graphs. Red vertical lines mark the date of the dust storm. The color scale codes the values of wavelet cross-correlation coefficients .
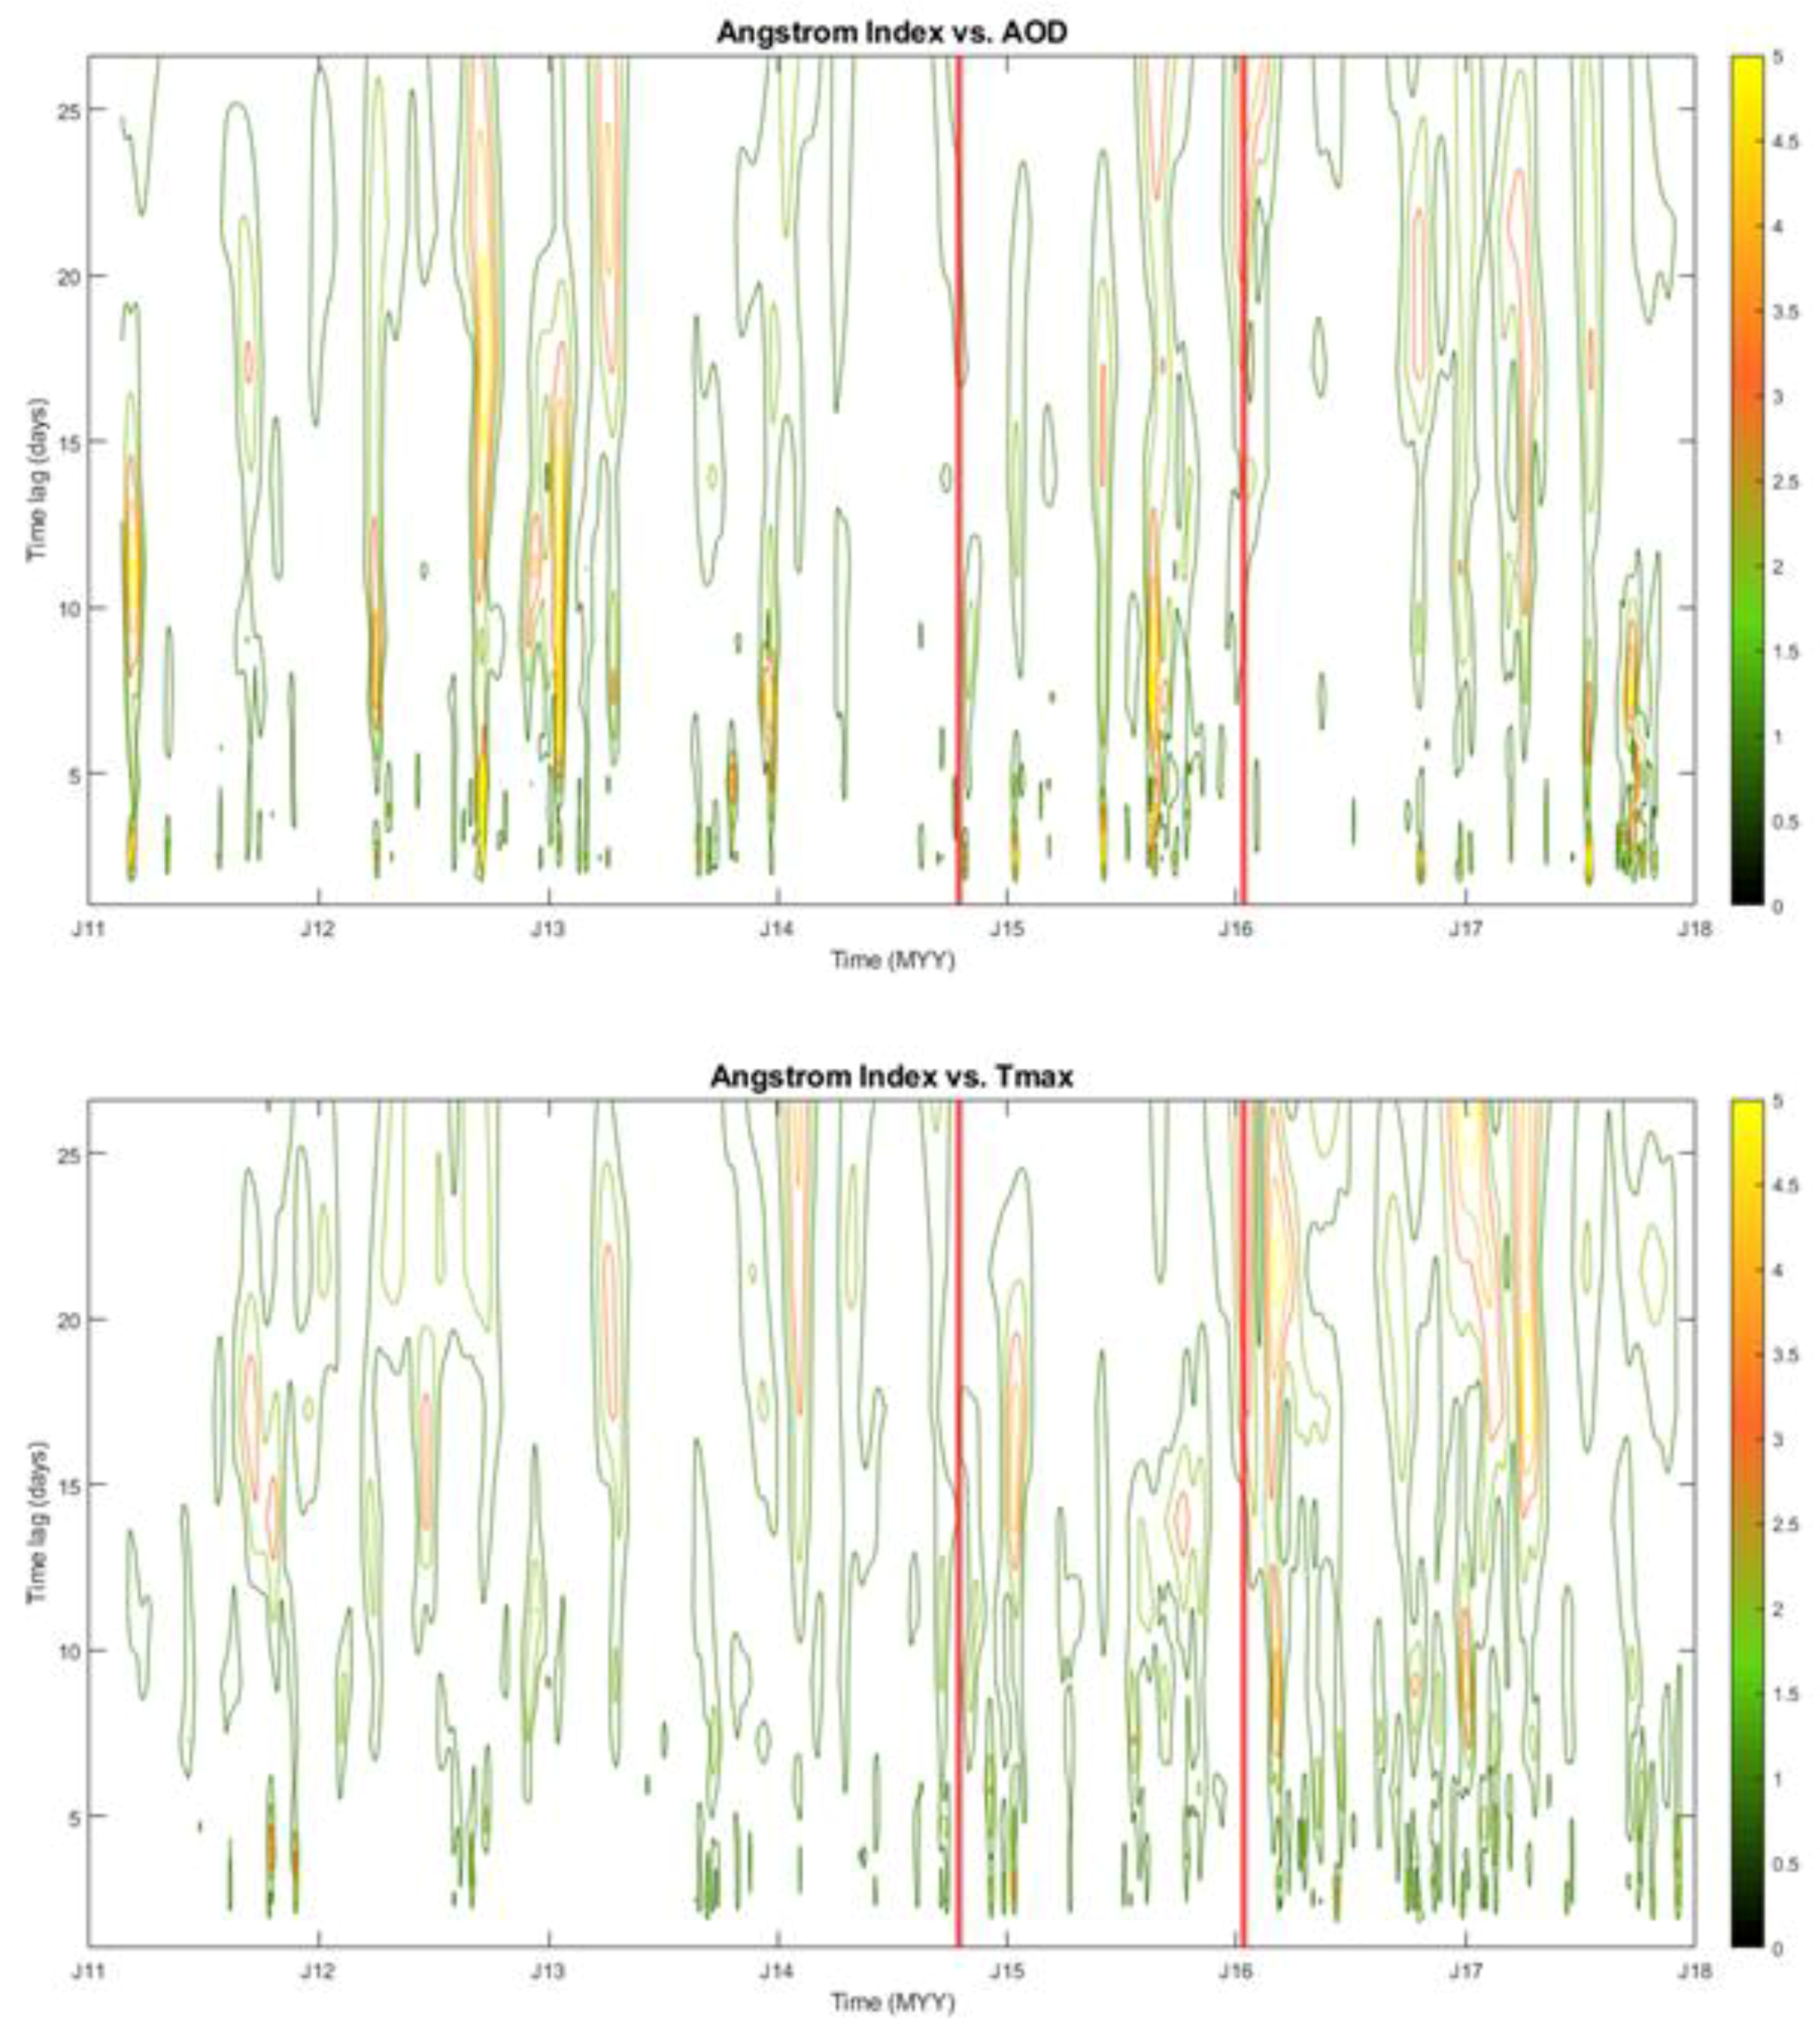
Table A1.
Terms used for each of the health outcomes of interest in the study.
Table A1.
Terms used for each of the health outcomes of interest in the study.
| Respiratory Diseases and Symptoms | Cardiovascular Diseases | Motor Vehicle Accidents | Eye Irritation |
|---|---|---|---|
| Lower Respiratory Tract Infection (LRTI) Upper Respiratory Tract Infection (URTI) Chronic Obstructive Pulmonary Disease (COPD) Pulmonary TB Acute asthma Chronic asthma Asthma Tightness in the chest Bilateral pneumonia Pneumonia Emphysema Bronchitis Bronchiectasis Breathlessness Shortness of breath Wheeze Cough (wet, dry, acute, and chronic) Pleural effusion Chest pain Tuberculosis Influenza Bronchospasm Destructive lung disease Lung cancer Pulmonary oedema Pulmonary embolism | Cardiogenic shock Pericarditis Aortic Aneurism Pulmonary stenosis Cardiomegaly Cardiomyopathy Arrhythmia Mitral valve stenosis Peripheral vascular disease Coronary artery disease Angina Myocardial infarction Stroke Heart failure Hypertensive heart failure Rheumatic heart failure Cardiomyopathy Heart murmurs Congenital heart failure Valvular heart disease Carditis aortic aneurism Peripheral artery disease Thromboembolic dieses Congestive cardiac failure (CCF) Cerebrovascular accident (CVA) Atherosclerosis High blood pressure Hypertension High cholesterol/cholesterol Deep Vein Thrombosis/Venous thrombosis/DVT | Car accident Motor vehicle accident Motor accident injury Motorcycle accident | Red eye Eye irritation Painful eyes Foreign particles in the eyes Eye allergy Conjunctivitis |
References
- Baghbanan, P.; Ghavidel, Y.; Farajzadeh, M. Spatial analysis of spring dust storms hazard in Iran. Theory Appl. Clim. 2020, 139, 1447–1457. [Google Scholar] [CrossRef]
- Tong, D.Q.; Wang, J.X.L.; Gill, T.E.; Wang, B. Intensified dust storm activity and Valley fever infection in the southwestern United States. Geophys. Res. Lett. 2017, 44, 4304–4312. [Google Scholar] [CrossRef] [PubMed] [Green Version]
- Wang, X.; Dong, Z.; Zhang, J.; Liu, L. Modern dust storms in China: An overview. J. Arid. Environ. 2004, 58, 559–574. [Google Scholar] [CrossRef]
- Schweitzer, M.D.; Calzadilla, A.S.; Salamo, O.; Sharifi, A.; Kumar, N.; Holt, G.; Campos, M.; Mirsaeidi, M. Lung health in era of climate change and dust storms. Environ. Res. 2018, 163, 36–42. [Google Scholar] [CrossRef] [PubMed]
- Gross, J.E.; Carlos, W.G.; Dela Cruz, C.S.; Harber, P.; Jamil, S. Sand and dust storms: Acute exposure and threats to respiratory health. Am. J. Respir. Crit. Care Med. 2018, 198, 13–14. [Google Scholar] [CrossRef]
- Bekiswa, S.O. Master’s Thesis, Department of Environmental and Geographical Science, University of Cape Town, Cape Town, South Africa, 2018. Available online: https://open.uct.ac.za/handle/11427/31241 (accessed on 20 January 2022).
- Griffin, D.W. Atmospheric movement of microorganism in clouds of desert dust and implications for human health. Clin. Microbiol. Rev. 2007, 20, 459–477. [Google Scholar] [CrossRef] [Green Version]
- Goudie, A.S. Dust Storms and Human Health. In Extreme Weather Events and Human Health; Akhtar, R., Ed.; Springer International Publishing: Berlin/Heidelberg, Germany, 2020. [Google Scholar] [CrossRef]
- EUMETSAT. Dust in the Free State (South Africa). 2013. Available online: https://www.eumetsat.int/website/home/Images/ImageLibrary/DAT_2091101.html (accessed on 20 January 2022).
- NASA Earth Observatory. Dust Storm in Southern Africa. 2019. Available online: https://earthobservatory.nasa.gov/images/145659/dust-storm-in-southern-africa (accessed on 20 January 2022).
- IOL. Sandstorms Sweep through Social Media. 2014. Available online: https://www.iol.co.za/news/south-africa/northern-cape/sandstorms-sweep-through-social-media-1766400 (accessed on 20 January 2022).
- Two OV News. Pictures from the Epic Free State Sandstorm. 2016. Available online: https://www.2oceansvibe.com/2016/01/14/pics-from-the-epic-free-state-sandstorm-yesterday-gallery/; https://www.news24.com/news24/travel/pics-epic-free-state-sandstorm-will-literally-scratch-at-your-eyes-20160115 (accessed on 20 January 2022).
- Yang, C.Y.; Chen, Y.S.; Chiu, H.F.; Goggins, W.B. Effects of Asian dust storm events on daily stroke admissions in Taipei, Taiwan. Environ. Res. 2005, 99, 79–84. [Google Scholar] [CrossRef]
- Samoli, E.; Kougea, E.; Kassomenos, P.; Analitis, A.; Katsouyanni, K. Does the presence of desert dust modify the effect of PM10 on mortality in Athens, Greece? Sci. Total Environ. 2011, 1, 2049–2054. [Google Scholar] [CrossRef]
- Bell, M.L.; Levy, J.K.; Lin, Z. The effect of sandstorms and air pollution on cause-specific hospital admissions in Taipei, Taiwan. Occup. Environ. Med. 2008, 65, 104–111. [Google Scholar] [CrossRef]
- Stein-Zweers, D.; Veefkind, P. OMI/Aura Multiwavelength Aerosol Optical Depth and Single Scattering Albedo L3 1 Day Best Pixel in 0.25 degree x 0.25 degree V3, NASA Goddard Space Flight Center, Goddard Earth Sciences Data and Information Services Center (GES DISC); NASA Goddard Space Flight Center, Goddard Earth Sciences Data and Information Services Center (GES DISC): Greenbelt, MD, USA, 2012. [CrossRef]
- Platnick, S.; Hubanks, P.; Meyer, K.; King, M.D. MODIS Atmosphere L3 Monthly Product (08_L3). NASA MODIS Adaptive Processing System, Goddard Space Flight Center. 2015. Available online: https://doi.org/10.5067/MODIS/MOD08_M3.006 (accessed on 20 January 2022).
- Gasparrini, A.; Leone, M. Attributable risk from distributed lag models. BMC Med. Res. Method 2014, 14, 55. [Google Scholar] [CrossRef] [Green Version]
- Kapwata, T.; Wright, C.Y.; du Preez, D.J.; Kunene, Z.; Mathee, A.; Ikeda, T.; Landman, W.; Maharaj, R.; Sweijd, N.; Minakawa, N.; et al. Exploring rural hospital admissions for diarrhoeal disease, malaria, pneumonia, and asthma in relation to temperature, rainfall and air pollution using wavelet transform analysis. Sci. Total Environ. 2021, 791, 148307. [Google Scholar] [CrossRef] [PubMed]
- Wilczok, E. New Uncertainty Principles for the Continuous Gabor Transform and the Continuous Wavelet Transform. Doc. Math. 2000, 5, 207–226. Available online: https://eudml.org/doc/48549 (accessed on 20 January 2022).
- Torrence, C.; Compo, G.P. A Practical Guide to Wavelet Analysis. Bull. Am. Meteorol. Soc. 1998, 79, 61–78. [Google Scholar] [CrossRef] [Green Version]
- Morlet, J. Sampling Theory and Wave Propagation. In Issues in Acoustic Signal—Image Processing and Recognition; Chen, C.H., Ed.; NATO ASI Series (Series F: Computer and System Sciences); Springer: Berlin/Heidelberg, Germany, 1983; Volume 1. [Google Scholar] [CrossRef]
- Grossmann, A.; Morlet, J. Decomposition of Hardy Functions into Square Integrable Wavelets of Constant Shape. SIAM J. Math. Anal. 1984, 15, 723–736. [Google Scholar] [CrossRef]
- Astaf’eva, N.M. Wavelet analysis: Basic theory and some applications. Phys.-Uspekhi. 1996, 39, 1085. [Google Scholar] [CrossRef]
- Addison, P.S. The Illustrated Wavelet Transform Handbook: Introductory Theory and Applications in Science, Engineering, Medicine and Finance, Napier University, Edinburgh, United Kingdom, 1st ed.; Napier University: Edinburgh, UK, 2002; Available online: https://www.routledge.com/The-Illustrated-Wavelet-Transform-Handbook-Introductory-Theory-and-Applications/Addison/p/book/9780367574000 (accessed on 20 January 2022).
- Goupillaud, P.; Grossmann, A.; Morlet, J. Cycle-octave and related transforms in seismic signal analysis. Geoexploration 1984, 23, 85–102. [Google Scholar] [CrossRef]
- Aguiar-Conraria, L.; Soares, M.J. The continuous wavelet transform: Moving beyond uni- and bi-variate analysis. J. Econ. Surv. 2014, 28, 344–375. [Google Scholar] [CrossRef]
- Godsmark, C.N.; Irlam, J.; van der Merwe, F.; New, M.; Rother, A. Priority focus areas for a sub-national response to climate change and health: A South African provincial case study. Environ. Intern. 2019, 122, 31–51. [Google Scholar] [CrossRef]
- Koscielny-Bunde, E.; Kantelhardt, J.W.; Braun, P.; Bunde, A.; Havlin, S. Long-term persistence and multifractality of river runoff records: Detrended fluctuation studies. J. Hydro. 2006, 322, 120–137. [Google Scholar] [CrossRef] [Green Version]
- Ma, Y.; Xiao, B.; Liu, C.; Zhao, Y.; Zheng, X. Association between Ambient Air Pollution and Emergency Room Visits for Respiratory Diseases in Spring Dust Storm Season in Lanzhou, China. Int. J. Environ. Res. Public Health 2016, 13, 613. [Google Scholar] [CrossRef]
- Hashizume, M.; Kim, Y.; Ng, C.F.S.; Chung, Y.; Madaniyazi, L.; Bell, M.L.; Guo, Y.L.; Kan, H.; Honda, Y.; Yi, S.-M. Health Effects of Asian Dust: A Systematic Review and Meta-Analysis. Environ. Health Perspect. 2020, 128, 66001. [Google Scholar] [CrossRef] [PubMed]
- Verster, T.; Fourie, E. The good, the bad and the ugly of South African fatal road accidents. S. Afr. J. Sci. 2008, 114, 63–69. [Google Scholar] [CrossRef]
- Tesfaye, M.; Sivakumar, V.; Botai, J.; Mengistu Tsidu, G. Aerosol climatology over South Africa based on 10 years of Multiangle Imaging Spectroradiometer (MISR) data. J. Geophys. Res. 2011, 116, D20216. [Google Scholar] [CrossRef] [Green Version]
- Swap, R.J.; Annegarn, H.J.; Suttles, J.T.; King, M.D.; Platnick, S.; Privette, J.L.; Scholes, R.J. Africa burning: A thematic analysis of the Southern African Regional Science Initiative (SAFARI 2000). J. Geophys. Res.-Atmos. 2003, 108, D13. [Google Scholar] [CrossRef]
- Horowitz, H.M.; Garland, R.M.; Thatcher, M.; Landman, W.A.; Dedekind, Z.; van der Merwe, J.; Engelbrecht, F.A. Evaluation of climate model aerosol seasonal and spatial variability over Africa using AERONET. Atmos. Chem. Phys. 2017, 17, 13999–14023. [Google Scholar] [CrossRef] [Green Version]
- Fu, Q.; Mo, Z.; Lyu, D.; Zhang, L.; Qin, Z.; Tang, Q.; Yin, H.; Xu, P.; Wu, L.; Lou, X. Air pollution and outpatient visits for conjunctivitis: A case-crossover study in Hangzhou, China. Environ. Pollut. 2017, 231, 1344–1350. [Google Scholar] [CrossRef]
- Szyszkowicz, M.; Kousha, T.; Castner, J. Air pollution and emergency department visits for conjunctivitis: A case-crossover study. Int. J. Occup. Med. Environ. Health 2016, 29, 381–393. [Google Scholar] [CrossRef]
- Tam, W.W.; Wong, T.W.; Wong, A.H.; Hui, D.S. Effect of dust storm events on daily emergency admissions for respiratory diseases. Respirology 2012, 17, 143–148. [Google Scholar] [CrossRef]
- Soleimani, Z.; Teymouri, P.; Boloorani, A.D.; Mesdaghinia, A.; Middleton, N.; Griffin, D.W. An overview of bioaerosol load and health impacts associated with dust storms: A focus on the Middle East. Atmos. Environ. 2020, 223, 117187. [Google Scholar] [CrossRef]
- Herrera-Molina, E.; Gill, T.E.; Ibarra-Mejia, G.; Jeon, S. Associations between Dust Exposure and Hospitalizations in El Paso, Texas, USA. Atmosphere 2021, 12, 1413. [Google Scholar] [CrossRef]
- Al-Taiar, A.; Thalib, L. Short-term effect of dust storms on the risk of mortality due to respiratory, cardiovascular and all-causes in Kuwait. Int. J. Biometeorol. 2014, 58, 69–77. [Google Scholar] [CrossRef] [PubMed]
- Wang, Y.C.; Lin, Y.K. Mortality associated with particulate concentration and Asian dust storms in Metropolitan Taipei. Atmos. Environ. 2015, 117, 32–40. [Google Scholar] [CrossRef]
- Shahsavani, A.; Tobías, A.; Querol, X.; Stafoggia, M.; Abdolshahnejad, M.; Mayvaneh, F.; Guo, Y.; Hadei, M.; Hashemi, S.S.; Khosravi, A.; et al. Short-term effects of particulate matter during desert and non-desert dust days on mortality in Iran. Environ. Int. 2020, 134, 105299. [Google Scholar] [CrossRef] [PubMed]
- Niang, I.; Ruppel, O.C. Africa. In Climate Change 2014: Impacts, Adaptation, and Vulnerability. Part B: Regional Aspects. Contribution of Working Group II to the Fifth Assessment Report of the Intergovernmental Panel on Climate Change; Barros, V.R., Ed.; Cambridge University Press: Cambridge, UK; New York, NY, USA, 2014; Available online: https://www.ipcc.ch/site/assets/uploads/2018/02/WGIIAR5-Chap22_FINAL.pdf (accessed on 20 January 2022).
- Daron, J.D. Regional Climate Messages: Southern Africa. CARIAA Adaptation at Scale in Semi-Arid Regions. Climate Systems Analysis Group. 2014. Available online: http://www.assar.uct.ac.za/sites/default/files/image_tool/images/138/RDS_reports/climate_messages/Southern%20Africa%20Climate%20Messages%20-%20Version%201%20-%20Regional%20Level.pdf (accessed on 20 January 2022).
- Donges, J.F.; Schleussner, C.F.; Siegmund, J.F.; Donner, R.V. Event coincidence analysis for quantifying statistical interrelationships between event time series. Eur. Phys. J. Spec. Top. 2016, 225, 471–487. [Google Scholar] [CrossRef] [Green Version]
Publisher’s Note: MDPI stays neutral with regard to jurisdictional claims in published maps and institutional affiliations. |
© 2022 by the authors. Licensee MDPI, Basel, Switzerland. This article is an open access article distributed under the terms and conditions of the Creative Commons Attribution (CC BY) license (https://creativecommons.org/licenses/by/4.0/).