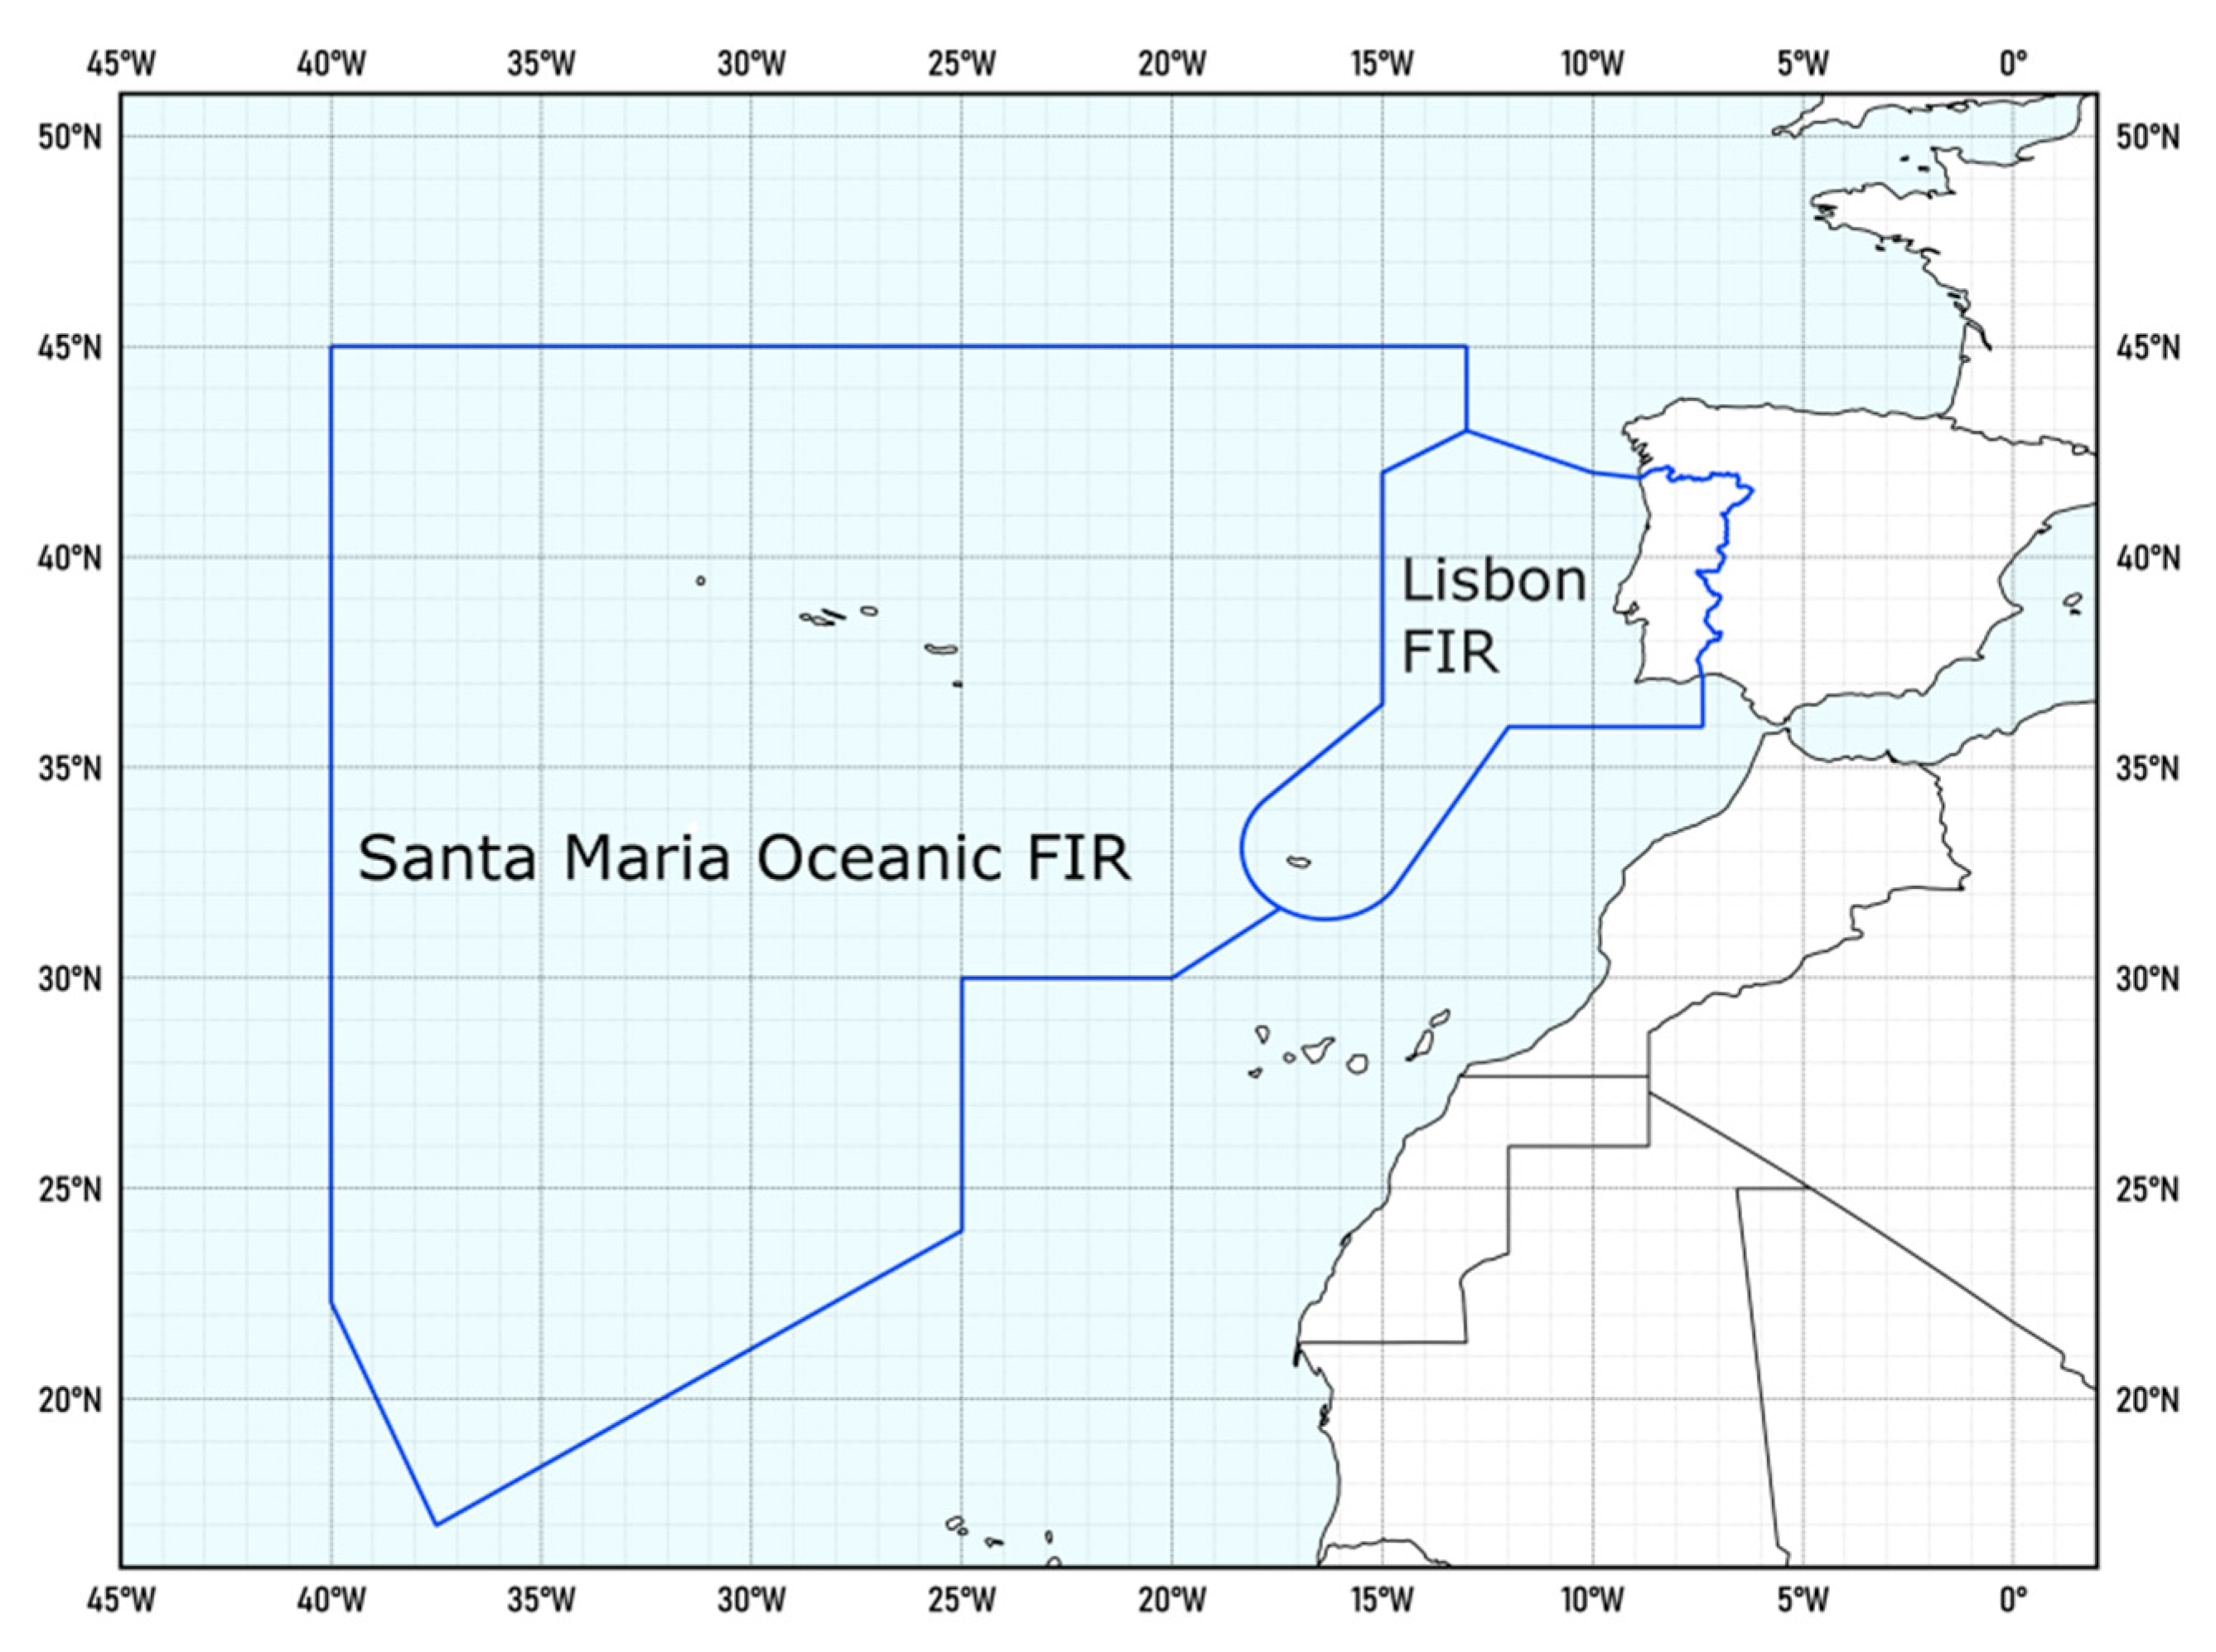
Figure 1.
Portuguese flight information regions.
Figure 1.
Portuguese flight information regions.
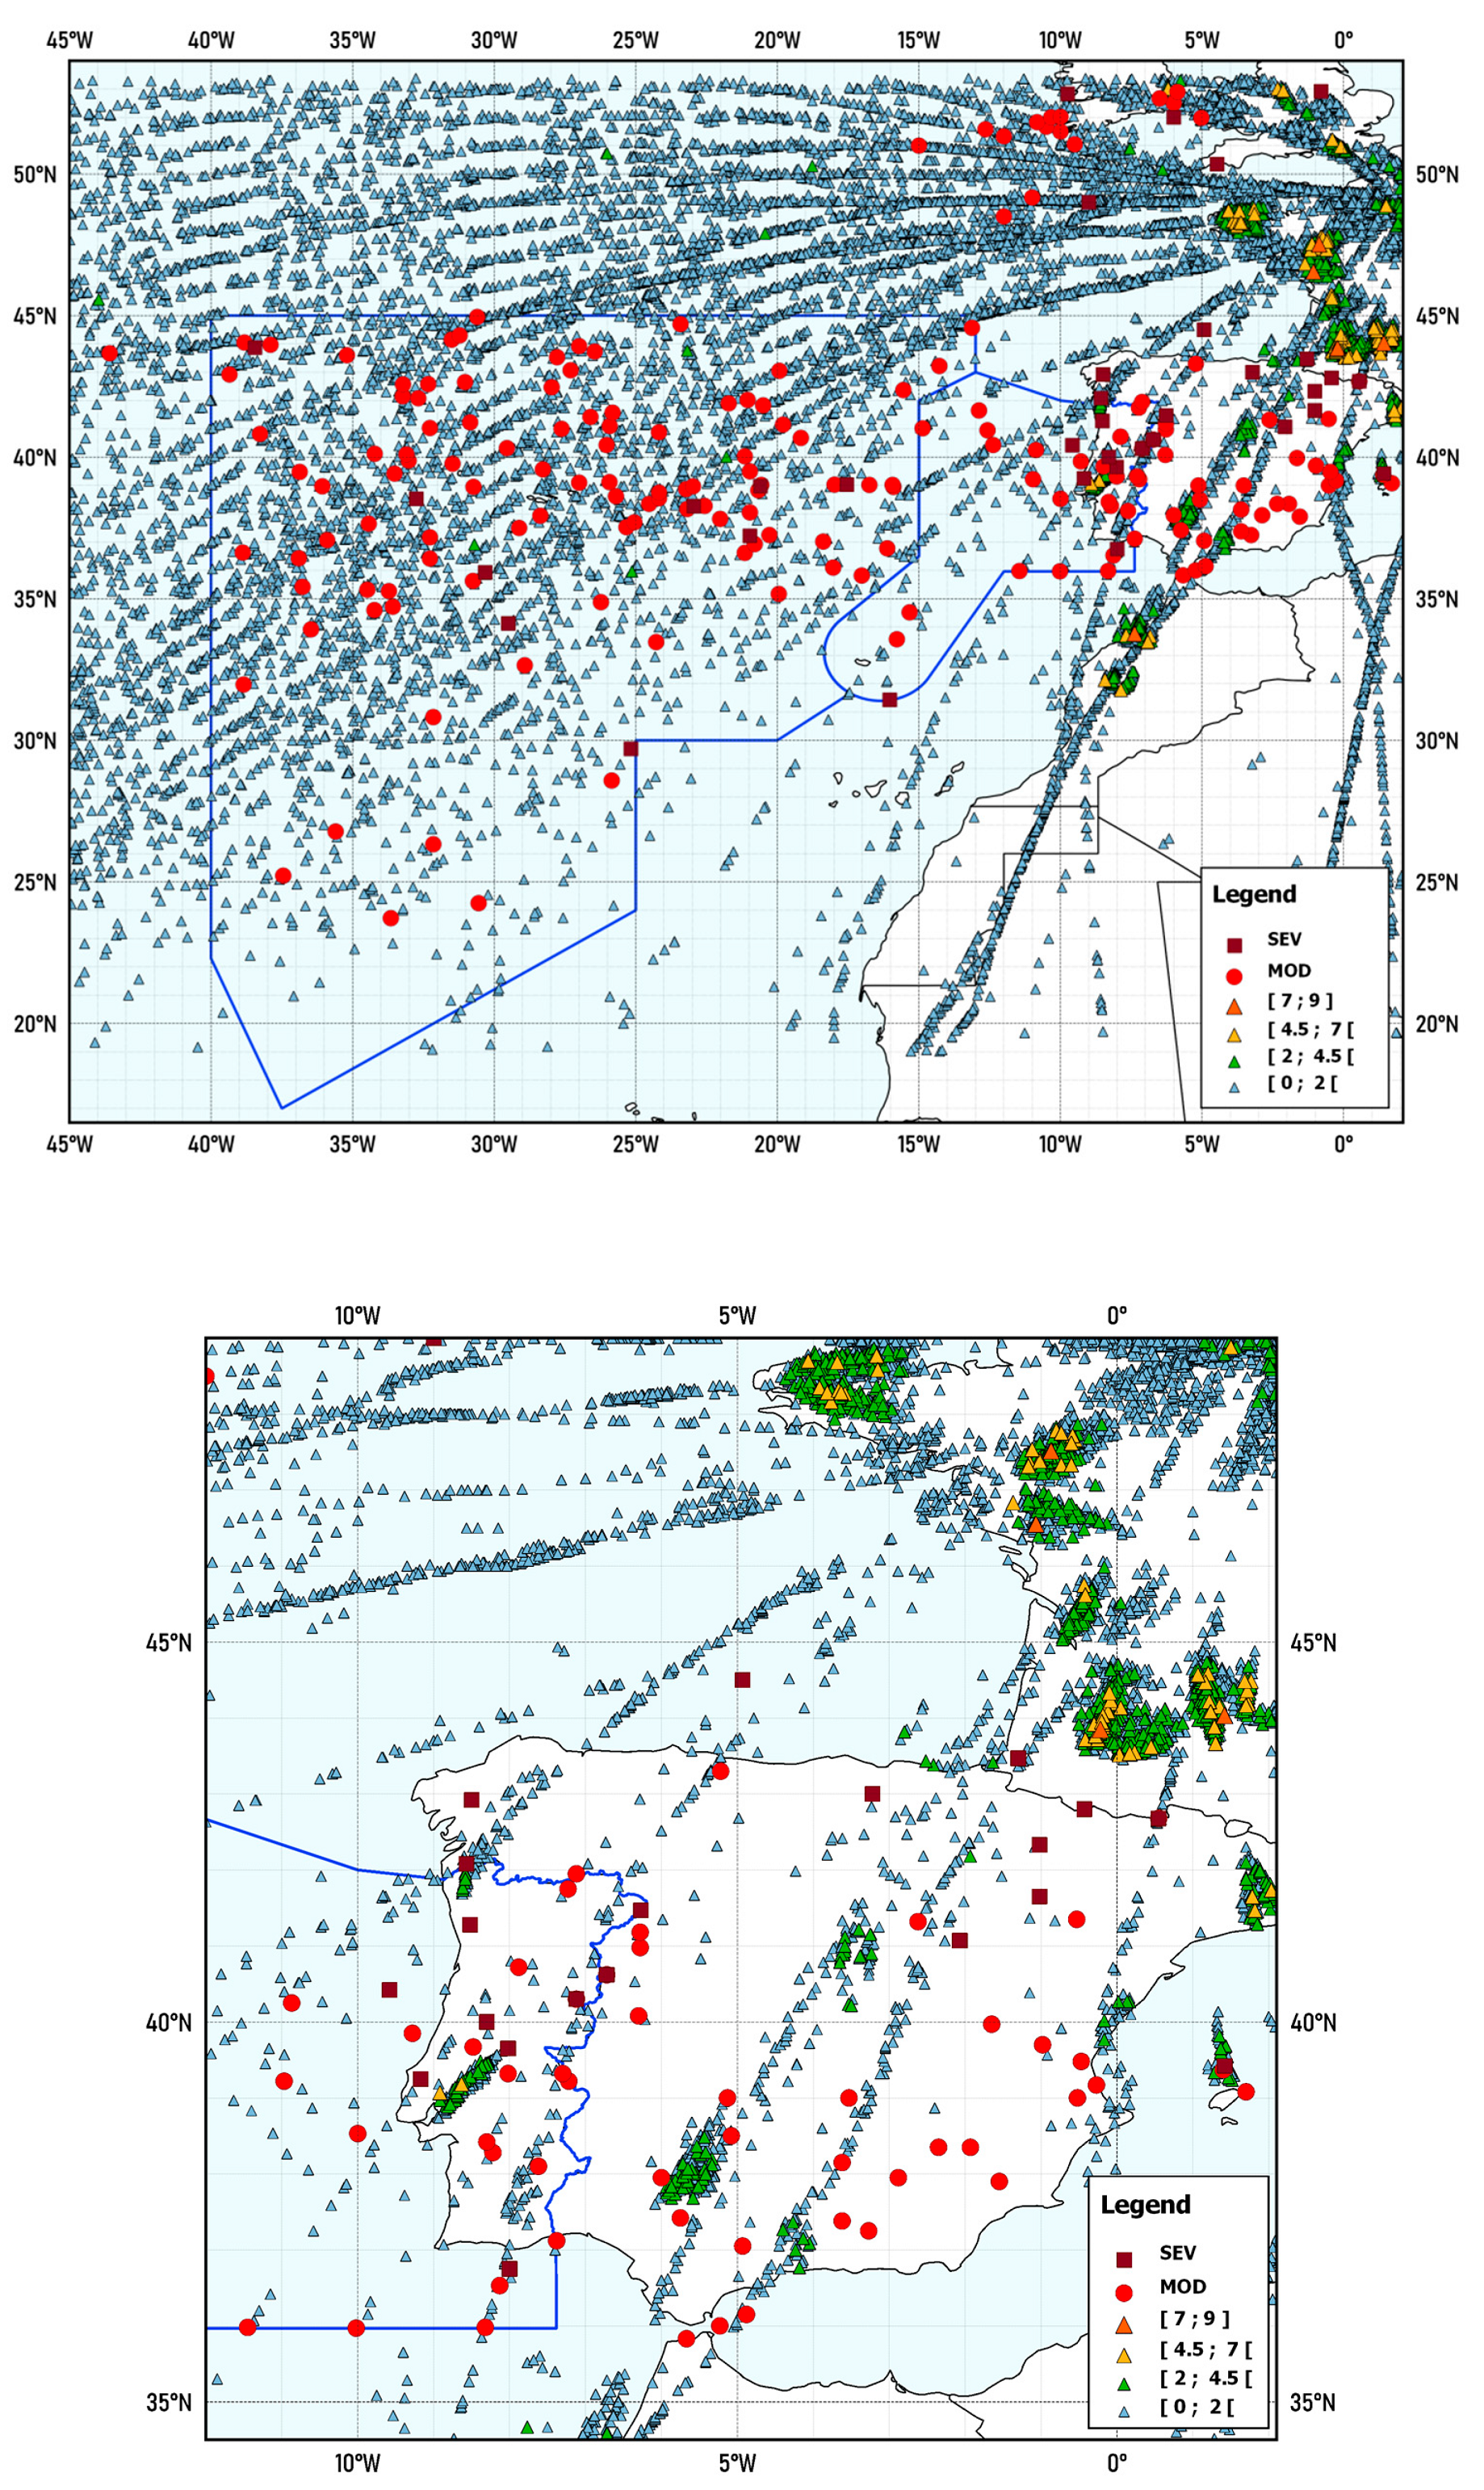
Figure 2.
Geographical locations of turbulence encounters, from AIREPs and AMDAR (DEVG values), at altitudes above FL150 (>5 km) for the period from February 2020 to March 2021, excluding May and June. The square and circles represent AIREP data and the triangles represent the DEVG (m s−1) values.
Figure 2.
Geographical locations of turbulence encounters, from AIREPs and AMDAR (DEVG values), at altitudes above FL150 (>5 km) for the period from February 2020 to March 2021, excluding May and June. The square and circles represent AIREP data and the triangles represent the DEVG (m s−1) values.
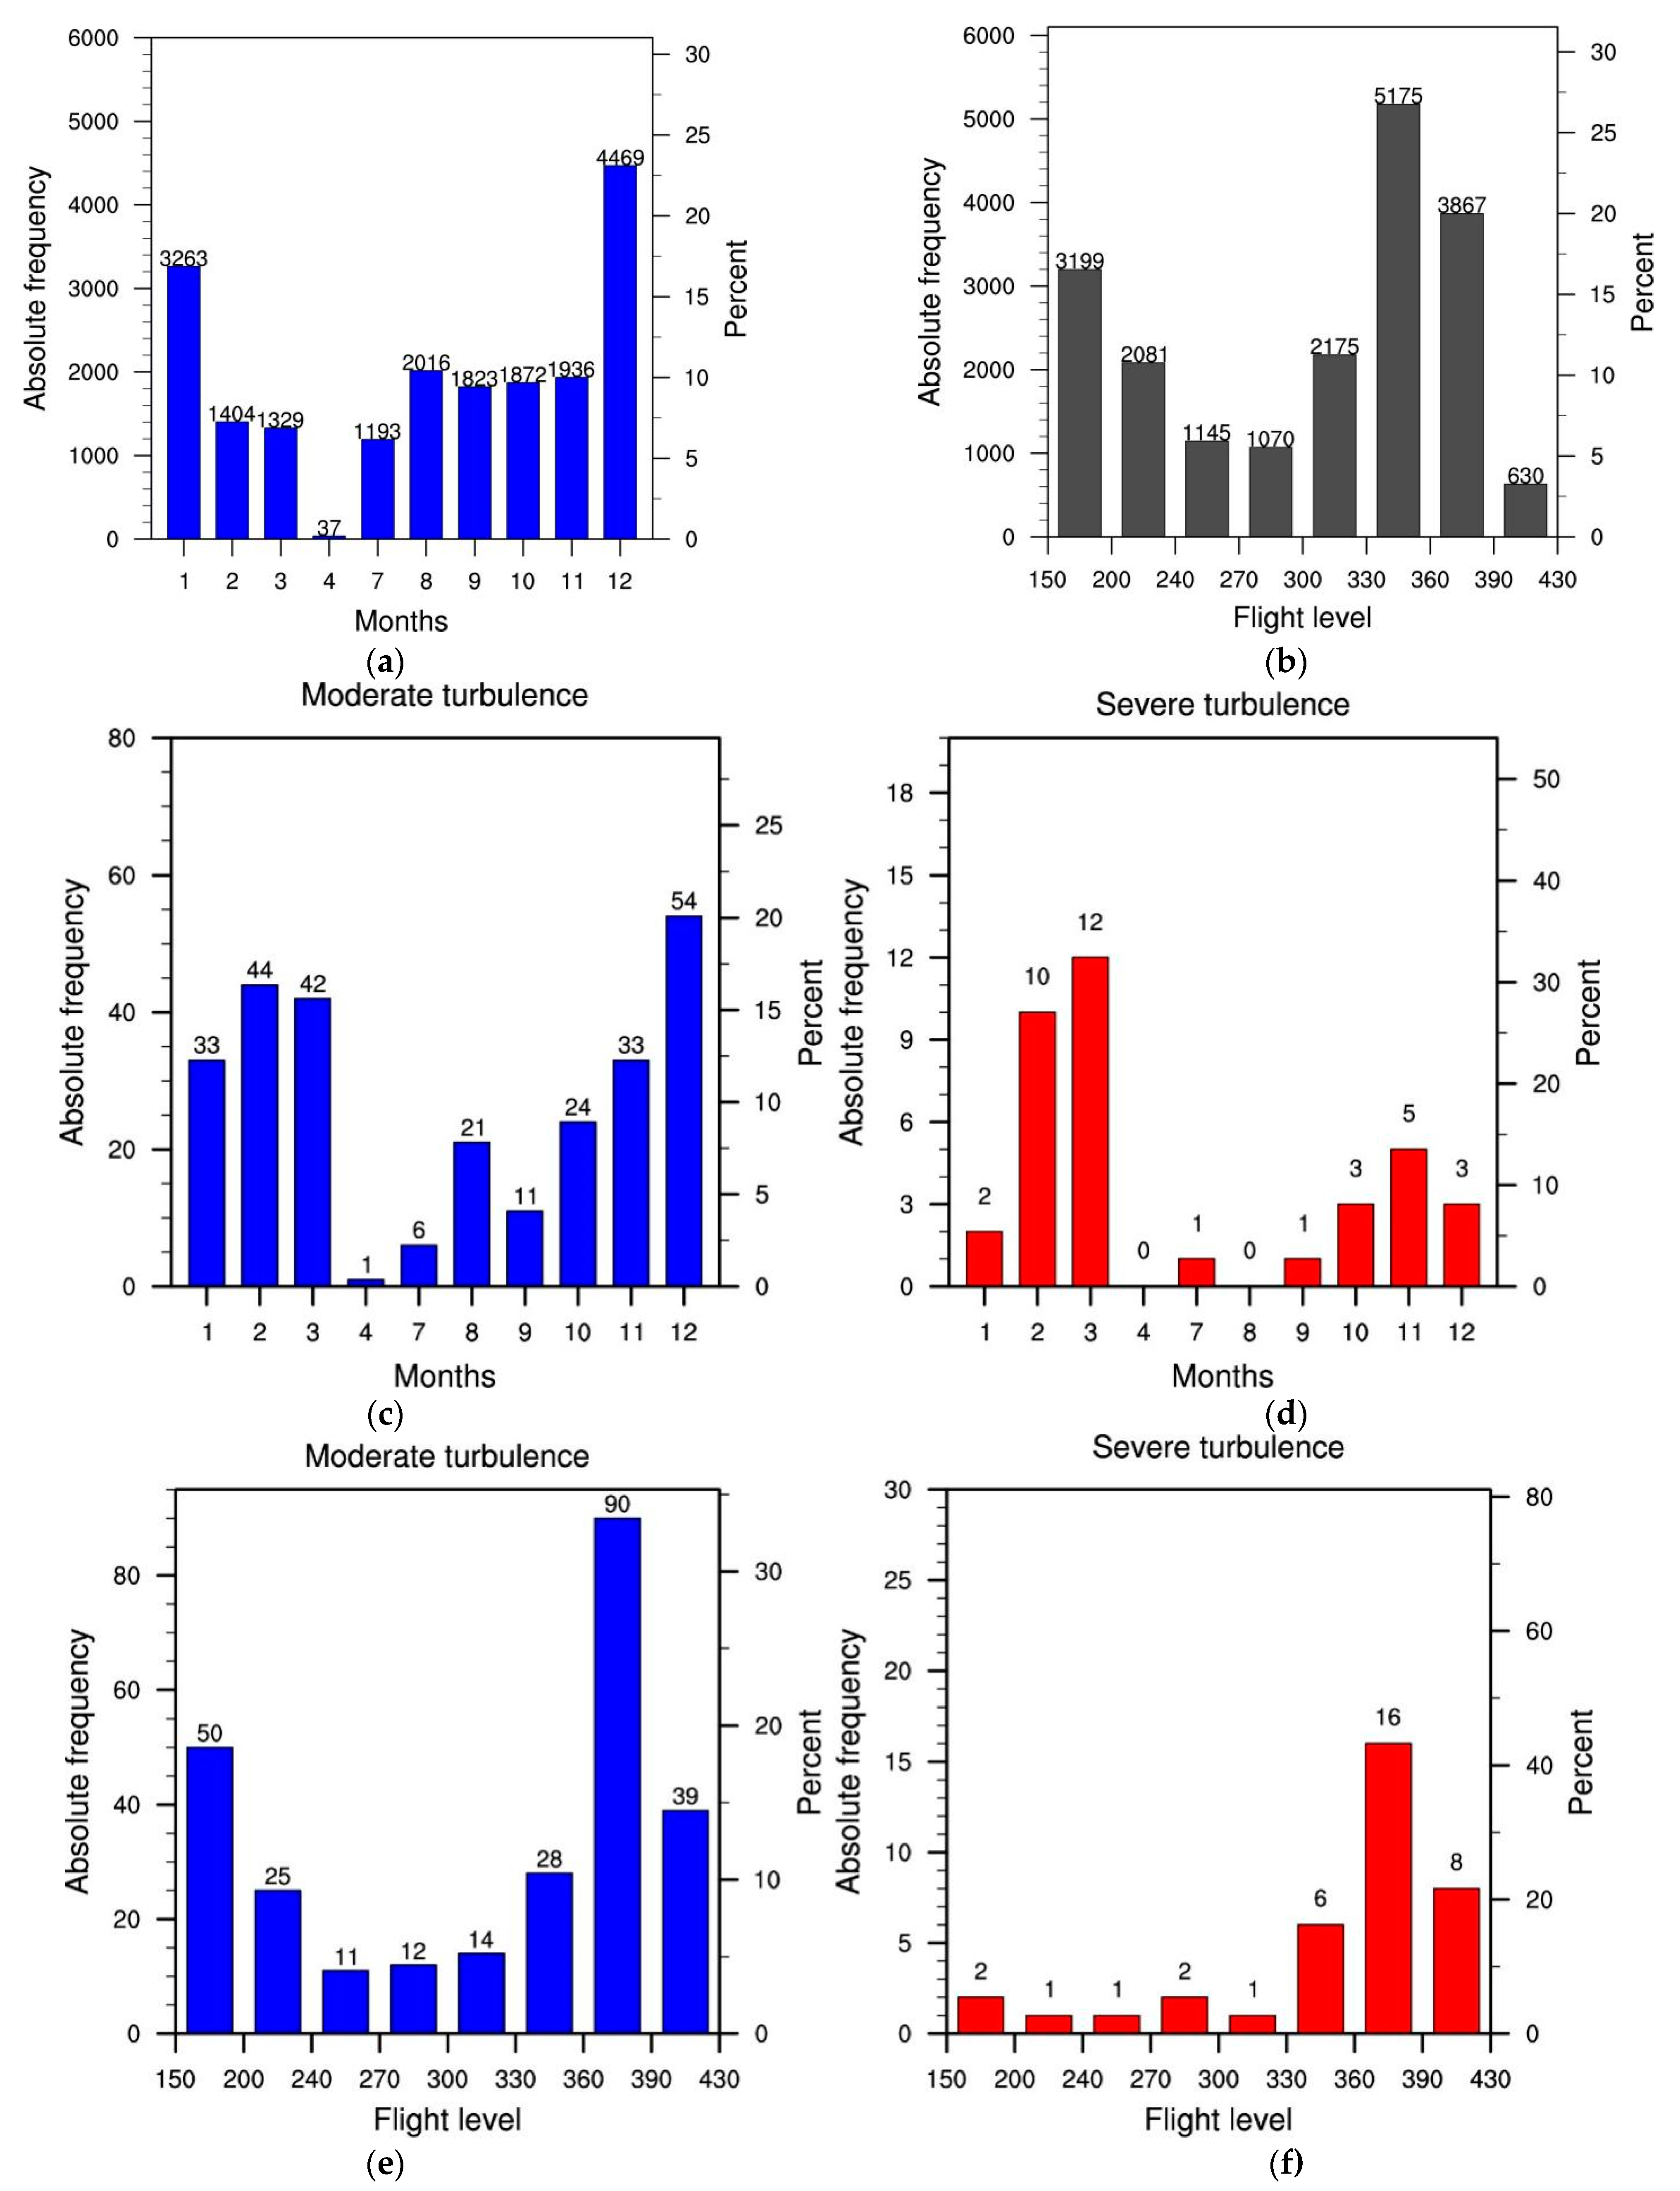
Figure 3.
Distribution of turbulence observations by (a) months and (b) altitude. Distribution of moderate turbulence encounters by (c) months and (e) altitude. Distribution of severe turbulence encounters by (d) months and (f) altitude. The number of reports is also included in each figure.
Figure 3.
Distribution of turbulence observations by (a) months and (b) altitude. Distribution of moderate turbulence encounters by (c) months and (e) altitude. Distribution of severe turbulence encounters by (d) months and (f) altitude. The number of reports is also included in each figure.
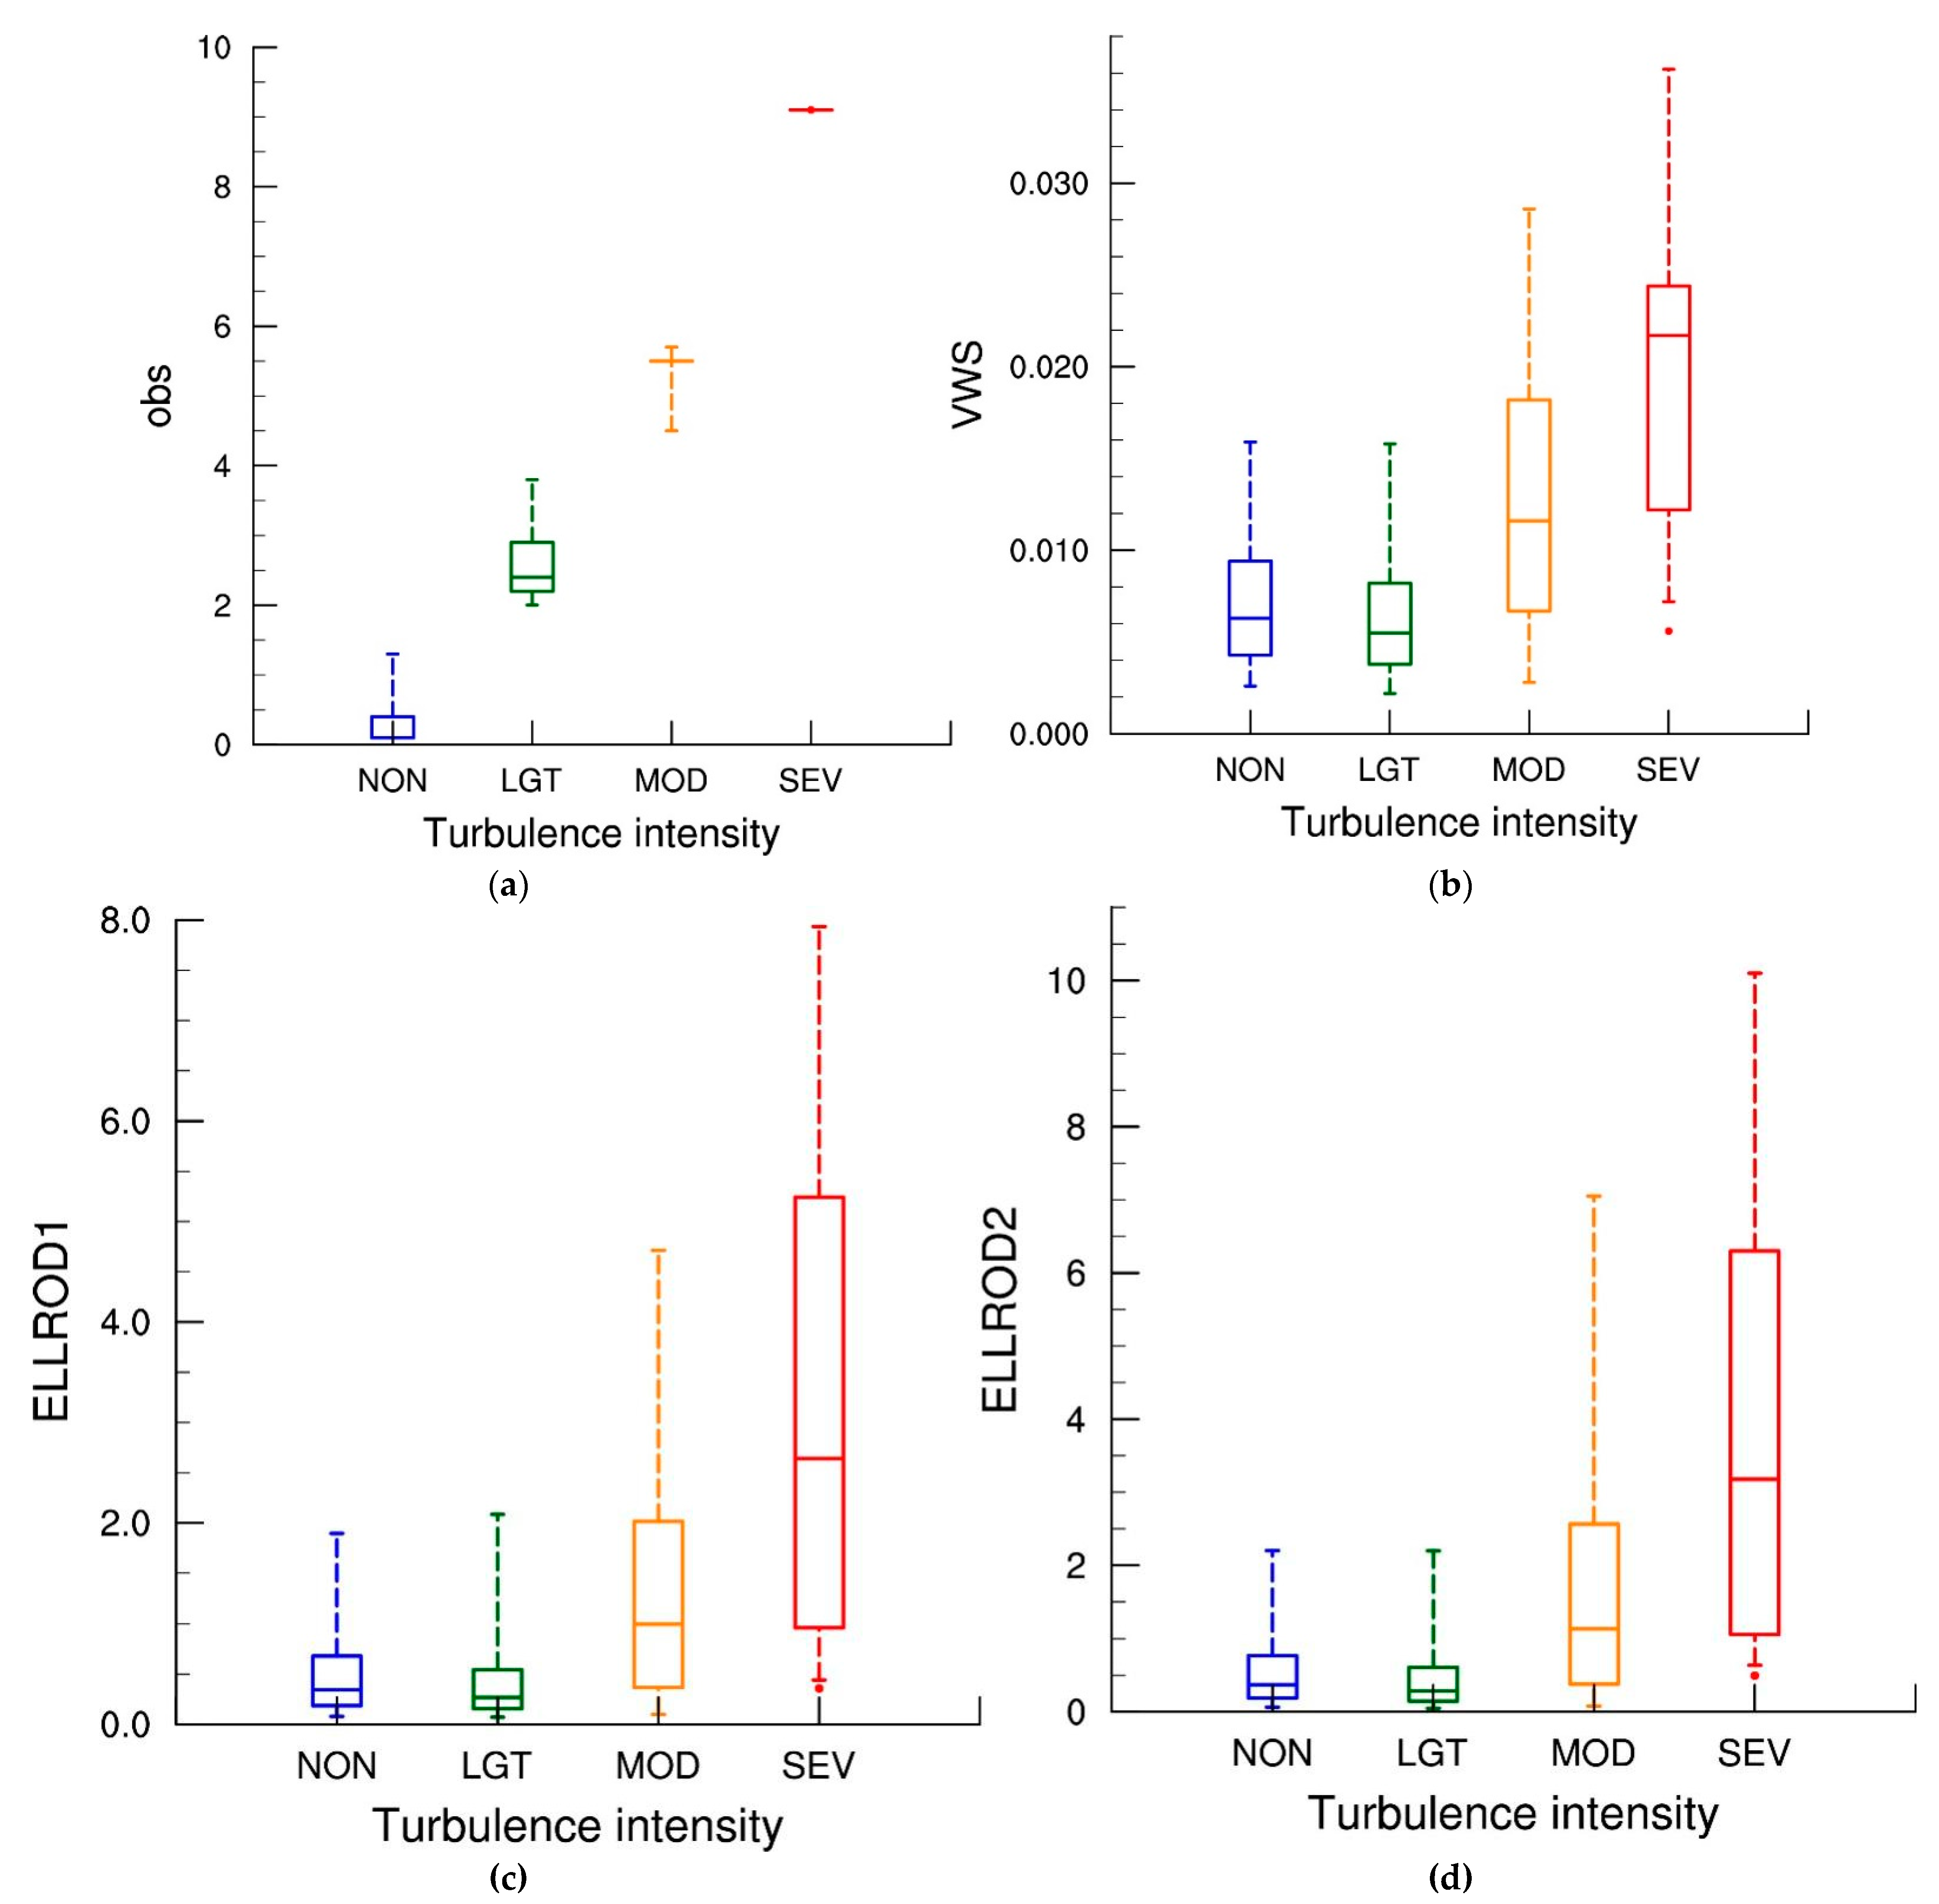
Figure 4.
Box-plots of the distribution of: (a) turbulence observations (m s−1), (b) VWS (s−1), (c) ELLROD1 (10−6 s−2), and (d) ELLROD2 (10−6 s−2). These box-plots were constructed for four classes of turbulence (NON, LGT, MOD, and SEV). Statistical parameters in the box-plot are the 95th and 5th percentiles (upper and lower tick marks, respectively), 75th and 25th percentiles (upper and lower boundaries, respectively), and median (line inside the boxes).
Figure 5.
Box-plots of the distribution of: (a) EE (10−9 m2 s−3), (b) DUTTON (m s−1 km−1), (c) Richardson number, and (d) DEF (10−6 s−1). These box-plots were constructed for four classes of turbulence (NON, LGT, MOD, and SEV). Statistical parameters in the box-plot are the 95th and 5th percentiles (upper and lower tick marks, respectively), 75th and 25th percentiles (upper and lower boundaries, respectively) and median (line inside the boxes).
Figure 6.
Quantiles of observations and (a) SQRT(VWS) and (b) log(CAT1 + 1). The scatters correspond to quantiles (25 and 50 for null turbulence; 50 for LGT; 50, 75, 80, 90, and 95 for MOD and SEV turbulence). The Pearson correlation () is also indicated.
Figure 6.
Quantiles of observations and (a) SQRT(VWS) and (b) log(CAT1 + 1). The scatters correspond to quantiles (25 and 50 for null turbulence; 50 for LGT; 50, 75, 80, 90, and 95 for MOD and SEV turbulence). The Pearson correlation () is also indicated.
Figure 7.
Variation of 1/, RICH1, and RICH2 with .
Figure 7.
Variation of 1/, RICH1, and RICH2 with .
Figure 8.
(a) ROC curves, (b) SEDI, (c) SEDS, and (d) POFD as a function of the threshold for several individual turbulence indicators (lines). The closer the ROC curve is to the upper left corner of the graph, the more skillful the index is. The ROC curves are defined by pairs of POD and POFD, computed for the various thresholds of the NWP-based turbulence indicators.
Figure 9.
(a) SEDI and SEDS, regarding the ability to predict MOG turbulence, for different combined indices with coef = 0.25. The values of these scores correspond to their maximum for the threshold that has a BIAS close to 1. (b) Performance of the indices as a function of the value of coef.
Figure 9.
(a) SEDI and SEDS, regarding the ability to predict MOG turbulence, for different combined indices with coef = 0.25. The values of these scores correspond to their maximum for the threshold that has a BIAS close to 1. (b) Performance of the indices as a function of the value of coef.
Figure 10.
(a) ROC curves, (b) TSS, (c) SEDI, and (d) SEDS as function of the threshold. The AUC values are in parentheses in (a).
Figure 10.
(a) ROC curves, (b) TSS, (c) SEDI, and (d) SEDS as function of the threshold. The AUC values are in parentheses in (a).
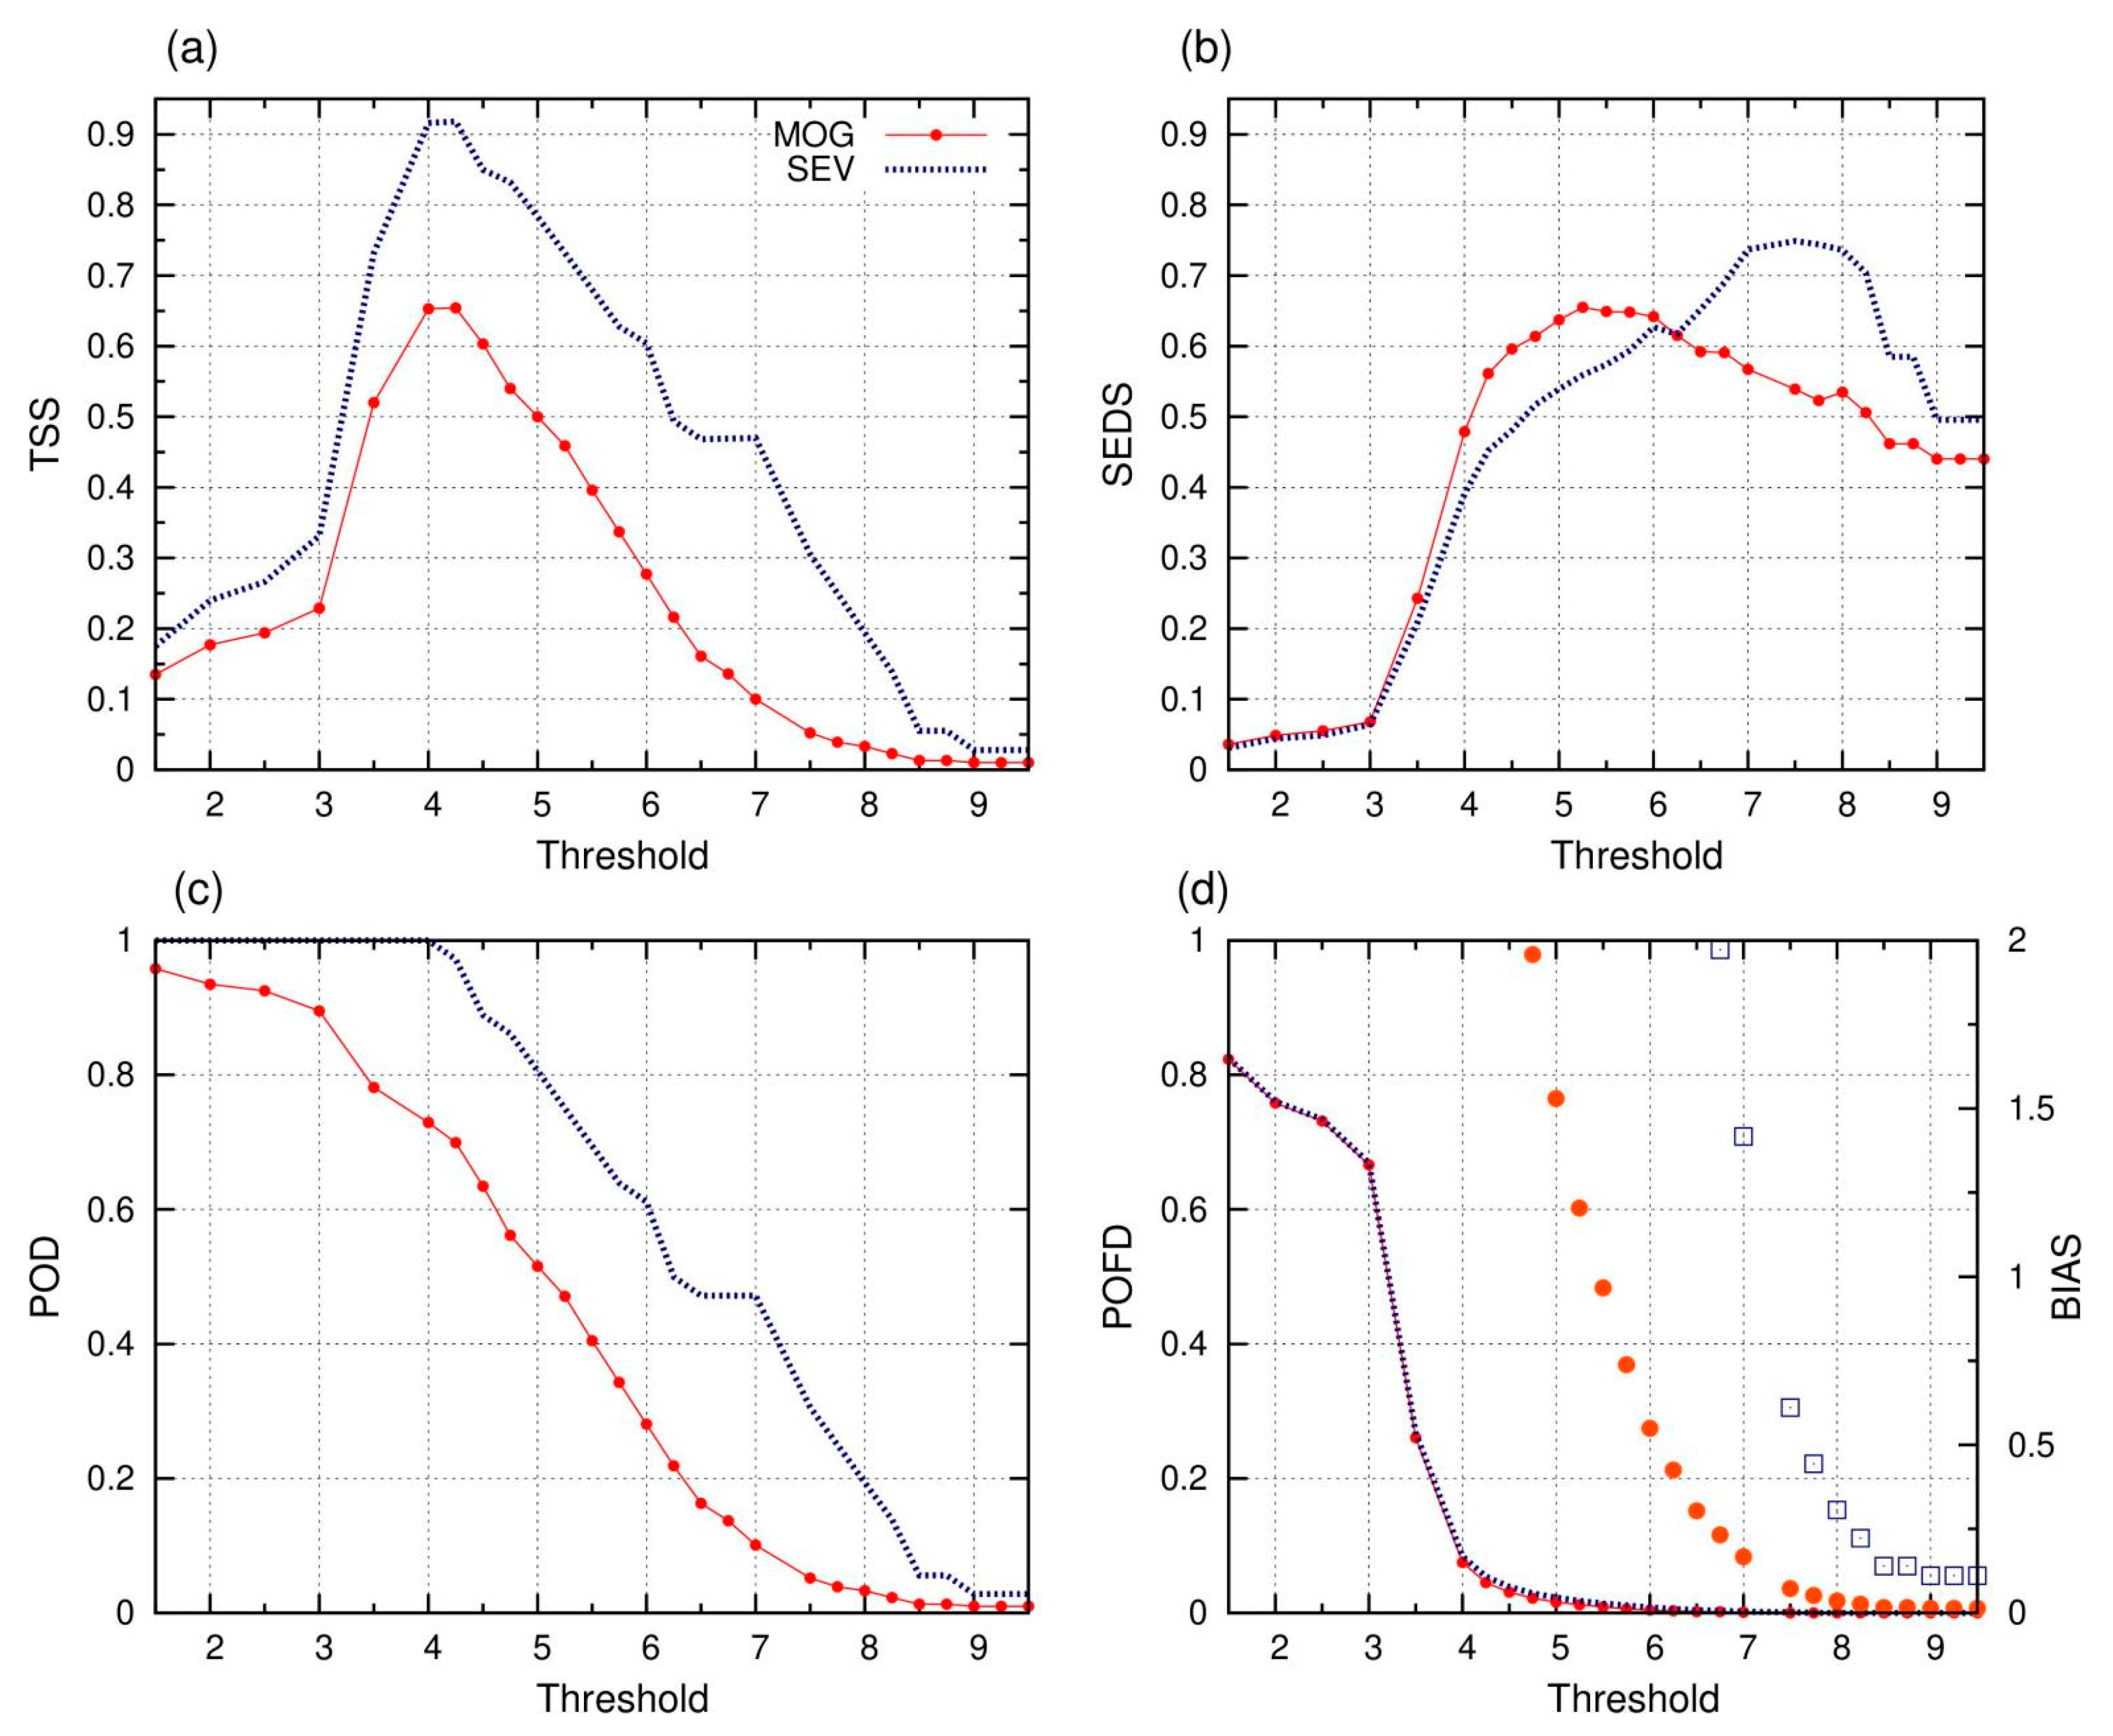
Figure 11.
Skill of regarding the ability to predict MOG and SEV turbulence. (a) TSS, (b) SEDS, (c) POD, and (d) POFD for different thresholds. In (d) BIAS should read on the right y-axis for MOG (circles) and SEV (open squares) turbulence.
Figure 11.
Skill of regarding the ability to predict MOG and SEV turbulence. (a) TSS, (b) SEDS, (c) POD, and (d) POFD for different thresholds. In (d) BIAS should read on the right y-axis for MOG (circles) and SEV (open squares) turbulence.
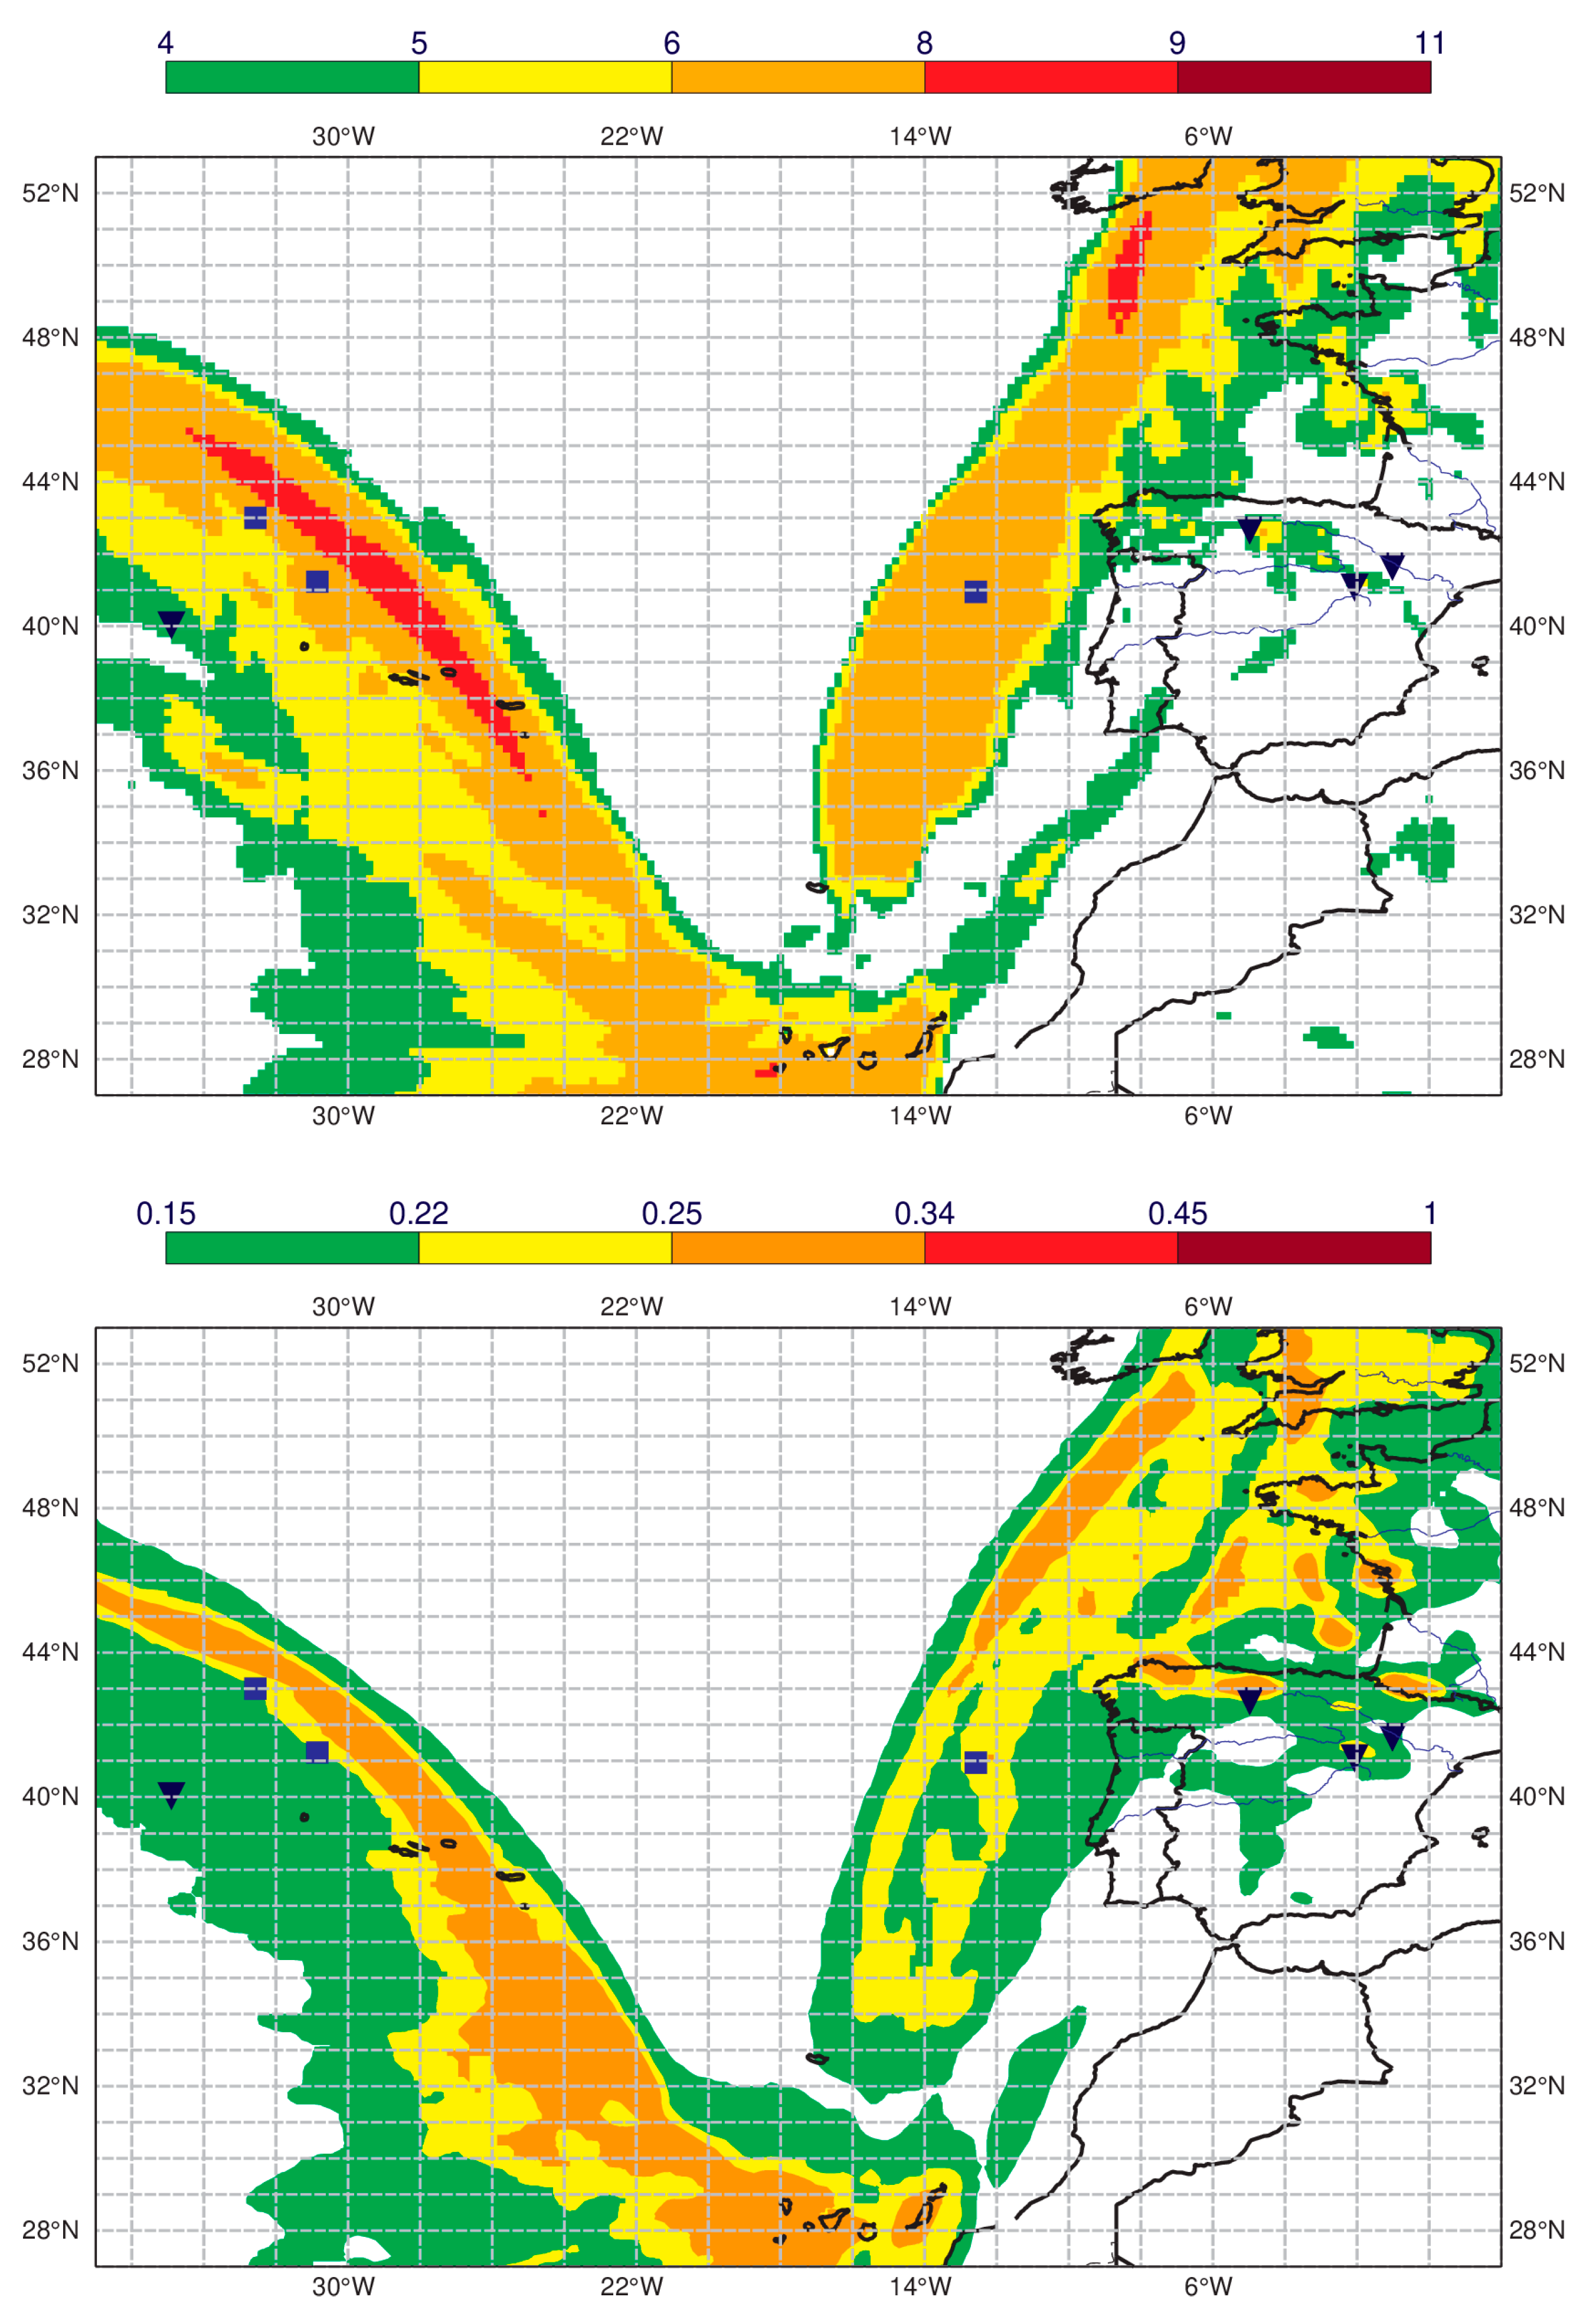
Figure 12.
TURBLAYER (top panel) and EDR product from London WAFC (bottom panel), for the FL300/390 layer. Both forecasts are valid at 15UTC on 20 February 2021. The square and the inverted triangle represent, respectively, moderate (MOD) and severe (SEV) turbulence reports above FL350.
Figure 12.
TURBLAYER (top panel) and EDR product from London WAFC (bottom panel), for the FL300/390 layer. Both forecasts are valid at 15UTC on 20 February 2021. The square and the inverted triangle represent, respectively, moderate (MOD) and severe (SEV) turbulence reports above FL350.
Table 1.
A simple 2 × 2 contingency table, expressing the joint occurrence of a turbulence index greater than or less than some threshold value fi and an observation greater or less than threshold value oi.
Table 1.
A simple 2 × 2 contingency table, expressing the joint occurrence of a turbulence index greater than or less than some threshold value fi and an observation greater or less than threshold value oi.
| Forecast | Observation |
|---|
| Obs < oi (No)
| Obs ≥ oi (Yes)
|
|---|
| Index < fi (No) | NN | NY |
| Index ≥ fi (Yes) | YN | YY |
Table 2.
Absolute frequency of DEVG and AIREP data. The turbulence observations total 19,342 cases.
Table 2.
Absolute frequency of DEVG and AIREP data. The turbulence observations total 19,342 cases.
| AMDAR DEVG (m s−1) | AIREP |
|---|
| NON (0–2) | LGT (2–4.5) | MOD (4.5–7) | MOD-SEV (7–9) | MOD | SEV |
| 17,659 | 1377 | 76 | 8 | 185 | 37 |
Table 3.
Parameters and functions used in the regression for each turbulence indicator in Equation (3).
Table 3.
Parameters and functions used in the regression for each turbulence indicator in Equation (3).
| | | | | |
|---|
| EE | log | 4.313 | 1 | 1 | 1.604 |
| ELLROD1 | log | 4.603 | 1 | 1 | 0.601 |
| ELLROD2 | log | 4.107 | 1 | 1 | 0.658 |
| VWS | SQRT | 7.239 | 100 | 0 | −3.995 |
| DUTTON | SQRT | 0.547 | 1 | 0 | −0.131 |
| CAT1 | log | 3.533 | 1 | 1 | 0.488 |
| DEF | SQRT | 2.14 | 1 | 0 | −2.773 |
| GRADT | SQRT | 4.697 | 100 | 0 | −2.549 |
| CAT2 | SQRT | 2.335 | 100 | 0 | −1.503 |
Table 4.
Combined turbulence indices and their weighting factors.
Table 4.
Combined turbulence indices and their weighting factors.
| Predictor | AUC | Combined Turbulence Index |
|---|
| MULTI | MULTI6 | MULTI5 | MULTI3 |
|---|
| EE | 0.744 | = AUC2 | = AUC2 | = AUC2 | = AUC2 |
| ELLROD1 | 0.735 | = AUC2 | = 0 | = AUC2 | = 0 |
| ELLROD2 | 0.730 | = AUC2 | = AUC2 | = AUC2 | = AUC2 |
| VWS | 0.756 | = AUC2 | = AUC2 | = AUC2 | = 0 |
| DUTTON | 0.746 | = AUC2 | = AUC2 | = AUC2 | = AUC2 |
| CAT1 | 0.703 | = AUC2 | = AUC2 | = 0 | = 0 |
| DEF | 0.669 | = AUC2 | = AUC2 | = 0 | = 0 |
| GRADT | 0.655 | = AUC2 | = 0 | = 0 | = 0 |
| CAT2 | 0.620 | = AUC2 | = 0 | = 0 | = 0 |
Table 5.
Scores of concerning the forecast of MOD and SEV turbulence.
Table 5.
Scores of concerning the forecast of MOD and SEV turbulence.
| Scores | Thresholds for MOD Turbulence | |
| 4 | 4.5 | 5 1 | 5.25 | 5.5 |
| POD | 0.73 | 0.64 | 0.52 | 0.47 | 0.41 |
| POFD | 0.08 | 0.03 | 0.02 | 0.01 | 0.01 |
| BIAS | 5.42 | 2.58 | 1.53 | 1.20 | 0.97 |
| SEDI | 0.82 | 0.80 | 0.76 | 0.74 | 0.70 |
| SEDS | 0.48 | 0.60 | 0.64 | 0.66 | 0.65 |
| Scores | Thresholds for Severe Turbulence | |
| 4.25 | 7.0 | 7.5 | 7.75 | 8 |
| POD | 0.97 | 0.47 | 0.31 | 0.25 | 0.19 |
| POFD | 0.05 | 0.00 | 0.00 | 0.00 | 0.00 |
| BIAS | 30 | 1.42 | 0.61 | 0.44 | 0.31 |
| SEDI | 0.98 | 0.81 | 0.74 | 0.71 | 0.68 |
| SEDS | 0.45 | 0.74 | 0.75 | 0.74 | 0.74 |
Table 6.
A 2 × 2 contingency table for the verification of the index for a threshold of 5. MOG turbulence is considered an event. In this case, the base rate is 0.016.
Table 6.
A 2 × 2 contingency table for the verification of the index for a threshold of 5. MOG turbulence is considered an event. In this case, the base rate is 0.016.
| Forecast | Observation |
|---|
| No | Yes |
|---|
| < 5 (No) | 18,727 | 148 |
| ≥ 5 (Yes) | 310 | 158 |


