Article

Spatiotemporal Variation and Circulation Characteristics of Extreme Maximum Temperature Events in East China (1961–2020)

1
Jiangxi Provincial Climate Centre, Nanchang 330000, China
2
Jiangxi Eco-Meteorological Center, Nanchang 330000, China
*
Author to whom correspondence should be addressed.
Atmosphere 2022, 13(4), 609; https://doi.org/10.3390/atmos13040609
Submission received: 15 March 2022 / Revised: 2 April 2022 / Accepted: 7 April 2022 / Published: 10 April 2022
(This article belongs to the Section Climatology)

Abstract

:
This study analyzed the spatiotemporal variation characteristics of extreme maximum temperature events (EMTEs) in East China in the last 60 years and investigated the relationship between EMTEs and atmospheric circulation. The arithmetic mean, linear trend, and the Mann–Kendall test were applied to daily maximum temperature (DMT) data (1961–2020) from 345 meteorological observation stations with complete observation records in East China to compile four characteristic indexes of EMTEs: intensity, consecutive days, first days, and last days. The analysis of these indexes revealed the following: (1) The annual number of days with a DMT ≥ 35 °C increased at the rate of 1.45 d/decade (p ≤ 0.05); the mutation occurred in 2009 with a growth rate before and after the mutation of 0.4 and 2.8 d/10a, respectively. Most of the region showed an increasing trend, with the most significant increase to the east of the Yangtze River Delta, in coastal areas of Zhejiang and Fujian, and south of Jiangxi. (2) The EMTE intensity rose at the rate of 0.15 °C/decade (p ≤ 0.05). Most areas showed a significant upward trend, and the historical extreme values of EMTEs mostly appeared in the 21st century. (3) The annual mean growth rate of consecutive EMTE days was 0.24 d/10a, which increased significantly after 2003. In comparison with 1961–2002, consecutive EMTE days increased by 35% during 2003–2020. The rate of increase was significant (p ≤ 0.05) for most areas east of the Yangtze River Delta, coastal areas of Zhejiang and Fujian, and areas south of Jiangxi. The mean mutation time was 2003, and the growth rate before and after the mutation was 0.4 and 1.4 d/10a, respectively. (4) The mean first EMTE day advanced and the mean last EMTE day became delayed, especially in the 21st century. Over the study period, the mean first EMTE day advanced by 12 days and the mean last EMTE day became delayed by 7 days. (5) The analysis of National Centers for Environmental Prediction/National Center for Atmospheric Research reanalysis data indicated that an increasing number of EMTEs have occurred in East China. The reason is that this region experiences atmospheric subsidence resulting from the intensification and westward extension of the subtropical high coupled with the weakening and northward displacement of the mid-latitude westerly trough.

1. Introduction

According to the Sixth Assessment Report of the Intergovernmental Panel on Climate Change (IPCC), the 50 years since 1970 have been the warmest 50 years of the previous 2000 years. The change in global mean surface temperature over the period 2001–2010, relative to that of 1850–1900, was 0.9 °C, while the mean temperature change over the period 2011–2020, relative to that of 1850–1900, was 1.09 °C, with a rate of temperature increase of 0.19 °C over the final decade [1]. The Sixth Assessment Report of the IPCC describes the climatic state change of global surface temperature over different periods and indicates that the global temperature has risen considerably since the 1970s. Regions worldwide are experiencing profound changes primarily characterized by global warming, while extreme events such as heat waves, heavy precipitation, drought, and typhoons are occurring frequently and will continue to occur. The impact of global warming on the entire climate system has been unprecedented within the past few centuries or even within the past several thousand years. In the wake of global temperature increases, the frequency and intensity of extreme high temperatures and heat waves relevant to agricultural and ecological droughts will increase in some regions [2,3]. The disaster risk of compound and concurrent extreme events such as heat waves and droughts will increase, exerting influence on human health, agriculture, and energy. In China, the rapid development of the urbanization process and the sustained warming of the climate will further interact and bring about ever more prominent influences [4,5,6]. For example, the combination of urbanization and extreme high-temperature events will aggravate the severity of urban heat waves, posing substantial challenges regarding urban electricity consumption.
East China, located in a monsoon climate zone with significant interdecadal climate variations, is an area at high risk of heat waves [7]. Additionally, East China is one of the regions in China with the densest population and cities with the highest economic agglomeration. In this region, the climate effects of urbanization are remarkable [8,9], and meteorological disasters and disasters resulting from extreme weather and climate events cause large absolute economic losses and have a wide scope of influence [10]. For example, in 1988, there were 292 deaths from heatstroke caused by heat waves in Jiangxi Province. During the period from mid-July to early August 2003, the daily maximum temperatures (DMTs) exceeded the historical records at more than half of the meteorological stations in Jiangxi Province. In 2003, DMT values of ≥40 °C occurred at 141 out of 335 national meteorological stations in East China. In particular, the number of days with DMT ≥ 40 °C in Xinchang County (Shaoxing City, Zhejiang Province) reached up to 20 days for the first time since observational records began. There have been many studies on the characteristics of DMT values of ≥35 °C across China, in specific regions or at the provincial level [11,12,13,14,15,16,17,18,19,20,21,22,23,24,25,26,27,28]. For example, Shi et al. analyzed the spatiotemporal dynamics of heat waves and the daily mean maximum temperature and the causes of high temperatures in East China; their analysis was based on daily maximum surface temperature data from meteorological stations in this region during the period 1960–2005, combined with the western Pacific subtropical high circulation index, equatorial Pacific sea surface temperature, and number of typhoons landing in East China and in the entire country during the same period [11]. Additionally, Wang et al. selected 16 extreme-temperature indexes based on daily temperature data from 115 meteorological stations in the Yangtze River Basin during the period 1962–2011; using the selected indexes, they analyzed the temporal trends and spatial distributions of extreme temperatures within the region [12]. Ju et al. analyzed the spatiotemporal features of extreme climate in East China using the RClimdex software for extreme climatic indexes coupled with multiple climate statistical diagnostic methods, e.g., linear tendency estimation, the Mann–Kendall (M-K) mutation test, and probability density functions of the normal distribution [13]. Mao et al. also discussed the temporal variations of extreme maximum temperature event (EMTE) indexes in Wuhan using the maximum and minimum temperature data of eight cities (Wuhan, Chongqing, Fuzhou, Hangzhou, Nanchang, Changsha, Nanjing, and Hefei) in the period 1951–2016 [14]. Zhu et al. investigated the spatiotemporal variations of EMTEs in Hunan Province using data from 1960–2014 [15]. Analyzing monthly maximum temperature data from 603 meteorological stations in mainland China for the period 1983–2012, Wu et al. found that the variations in annual extreme high temperature showed substantial regional differences [16]. Wang et al. explored the extreme change in climate using maximum/minimum temperatures from 549 meteorological stations in China for the period 1960–2008 [25]. Guan et al. studied extreme temperatures in the Yangtze River Basin and found a decreasing temperature trend prior to the mid-1980s, which was followed by an increasing trend; they also detected a close relationship between temperature trends and elevation [27]. Niu et al. analyzed the spatiotemporal variations of extreme temperatures and their association with geographical locations and atmospheric circulation in the basins of the Yellow and Yangtze rivers for the period 1961–2014 [28].
Since 2000, with global warming, the frequency of EMTEs in East China has increased, the time of occurrence of high-temperature weather has advanced, the end time of such weather has become delayed, and the duration of high-temperature weather has increased, affecting the growth of regional crops, energy supply, and human health. Although many earlier studies have considered the spatiotemporal variation characteristics of high-temperature weather, most analyses of EMTE variations have been based on a DMT of ≥35 °C, while the intensity, number of consecutive days, and first and last days of EMTEs have rarely been investigated. Different indexes reflect different variation characteristics of EMTEs, and the use of a single index cannot accurately and comprehensively describe the characteristics of EMTEs. Accordingly, to comprehensively analyze the spatiotemporal variations of EMTEs in East China over the previous 60 years, this study selected four characteristic EMTE indexes: hot days (DMT ≥ 35 °C), intensity (annual maximum temperature of EMTEs), consecutive days with DMT ≥ 35 °C, and the first and last days with DMT ≥ 35 °C. We used the National Centers for Environmental Prediction (NCEP)/National Center for Atmospheric Research (NCAR) reanalysis data to explore the relationship between years with abnormally high summer temperatures and the atmospheric circulation over East China. The results of this study could provide a reference for strategic planning intended to help East China cope with the increased risk of EMTEs in this region, possibly caused by global warming, and to implement advanced measures to preserve human health and energy security, while dealing with the agricultural implications of high temperatures and drought.

2. Materials and Methods
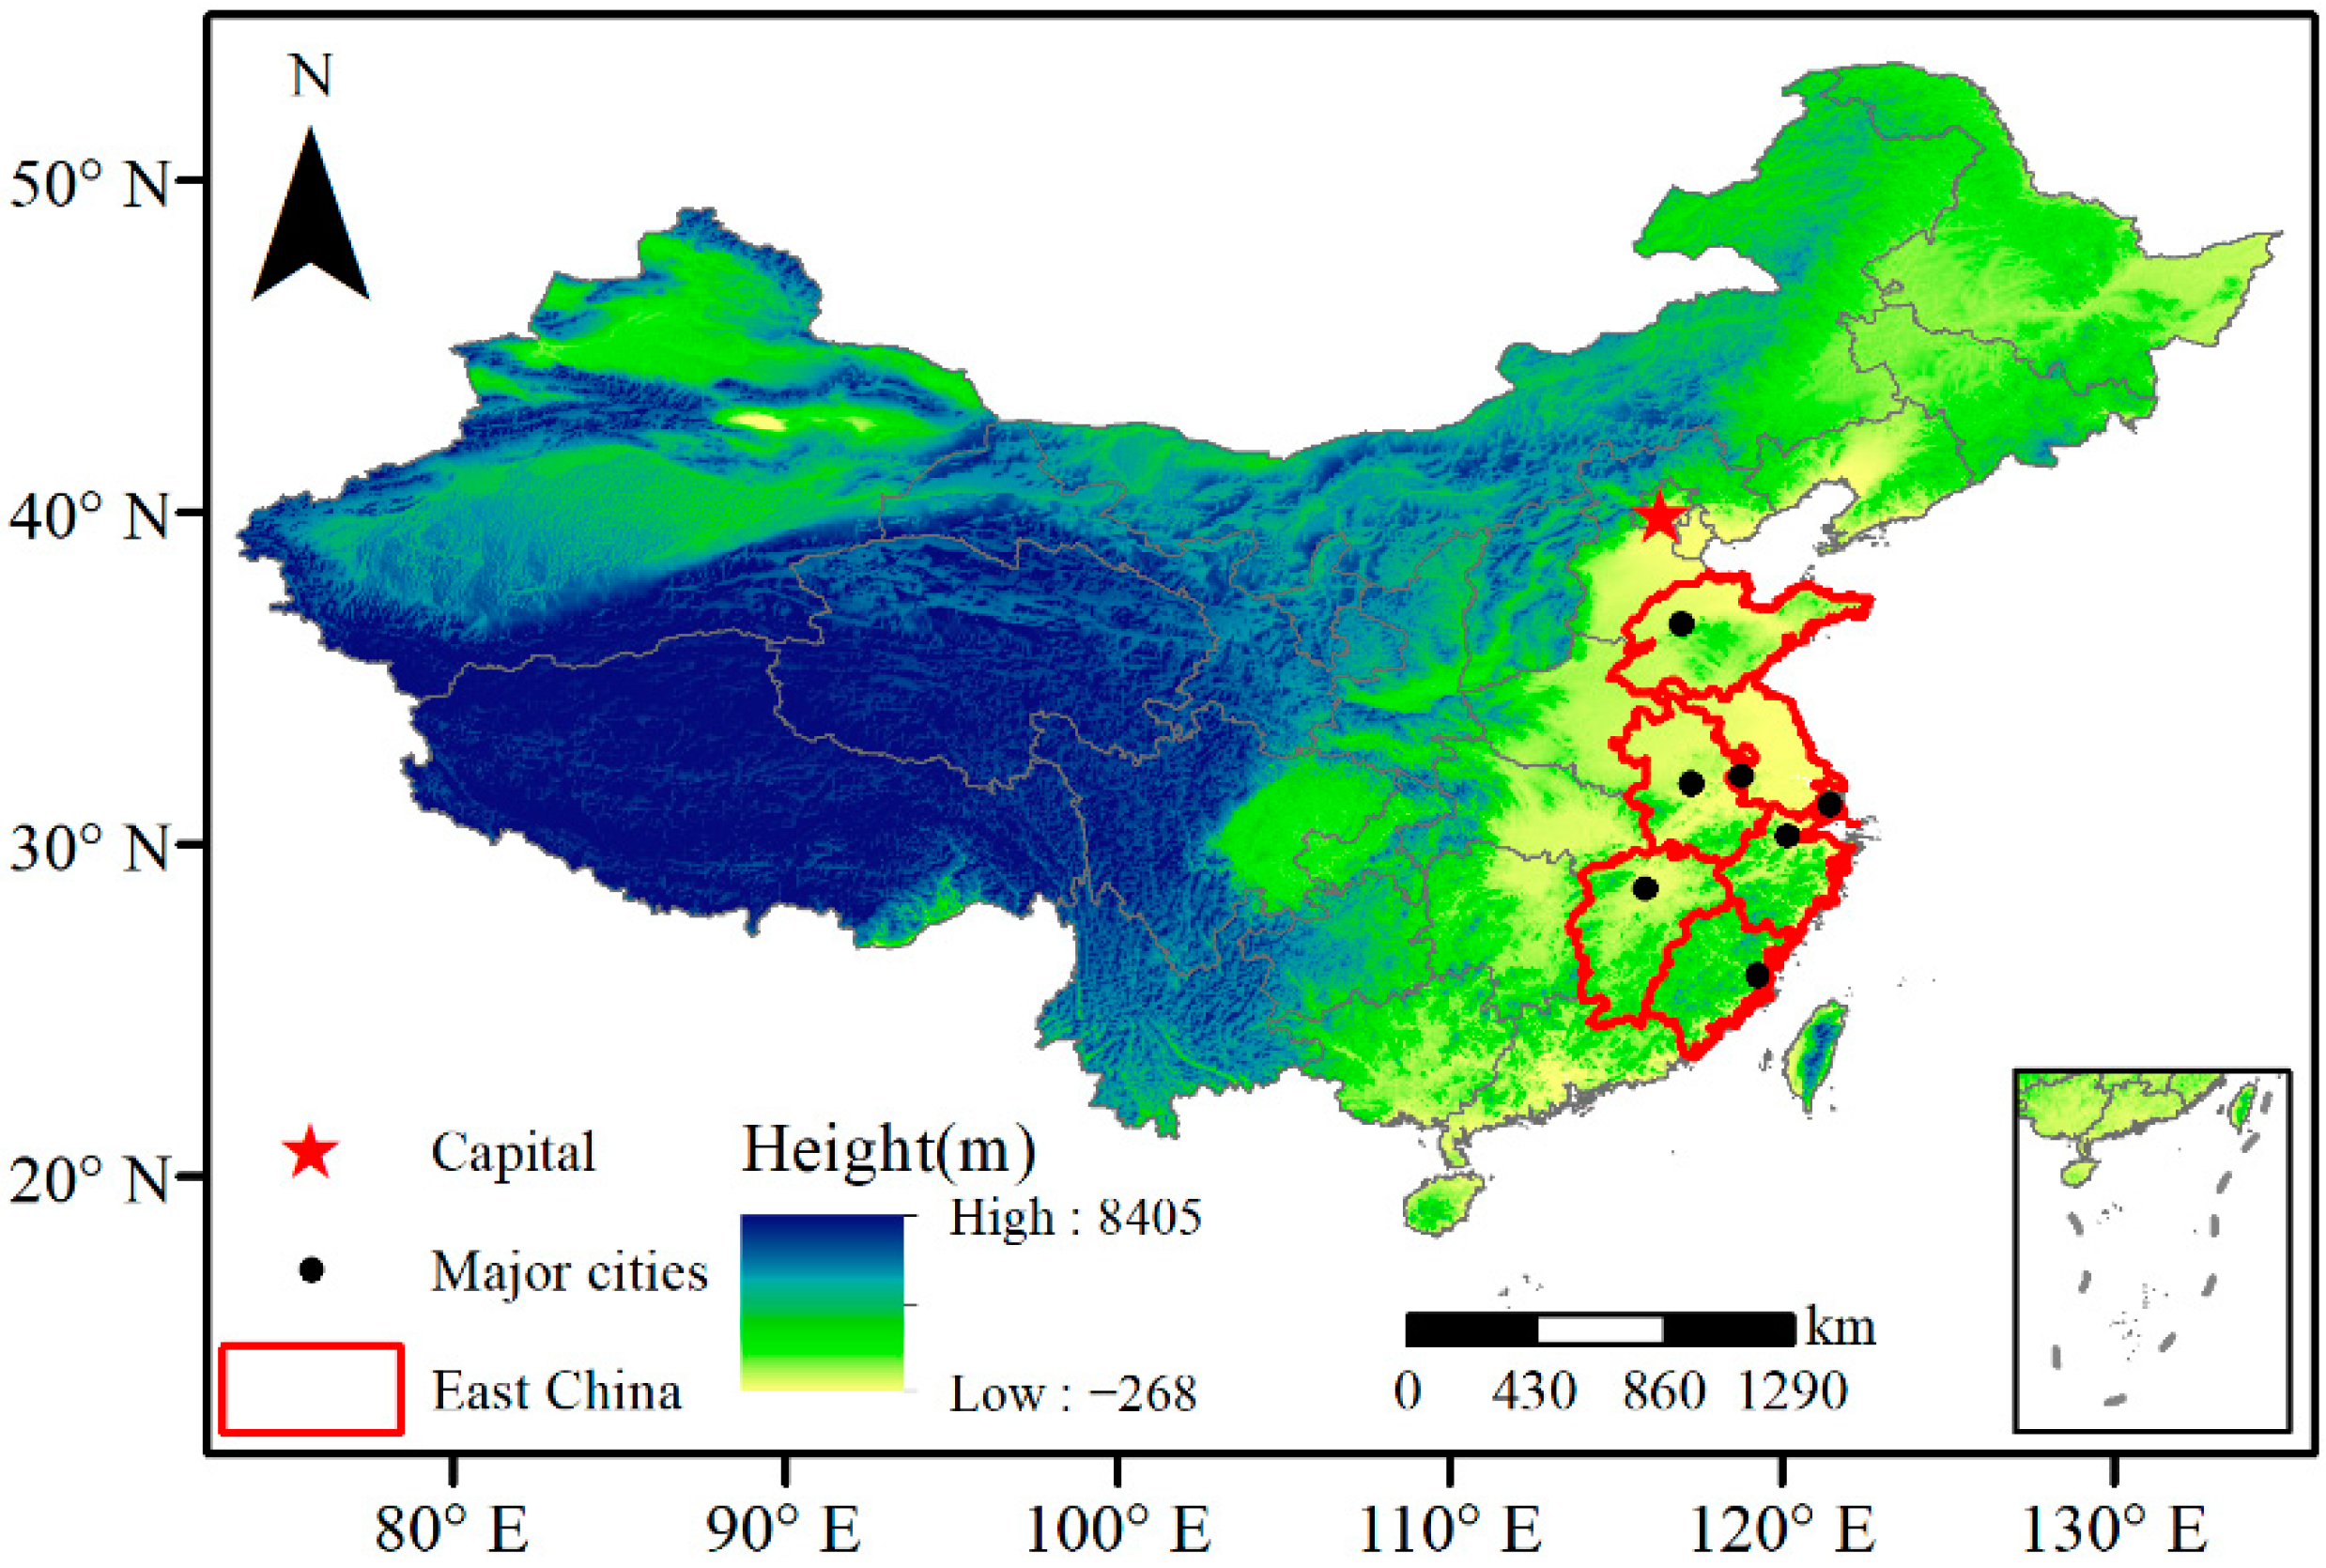
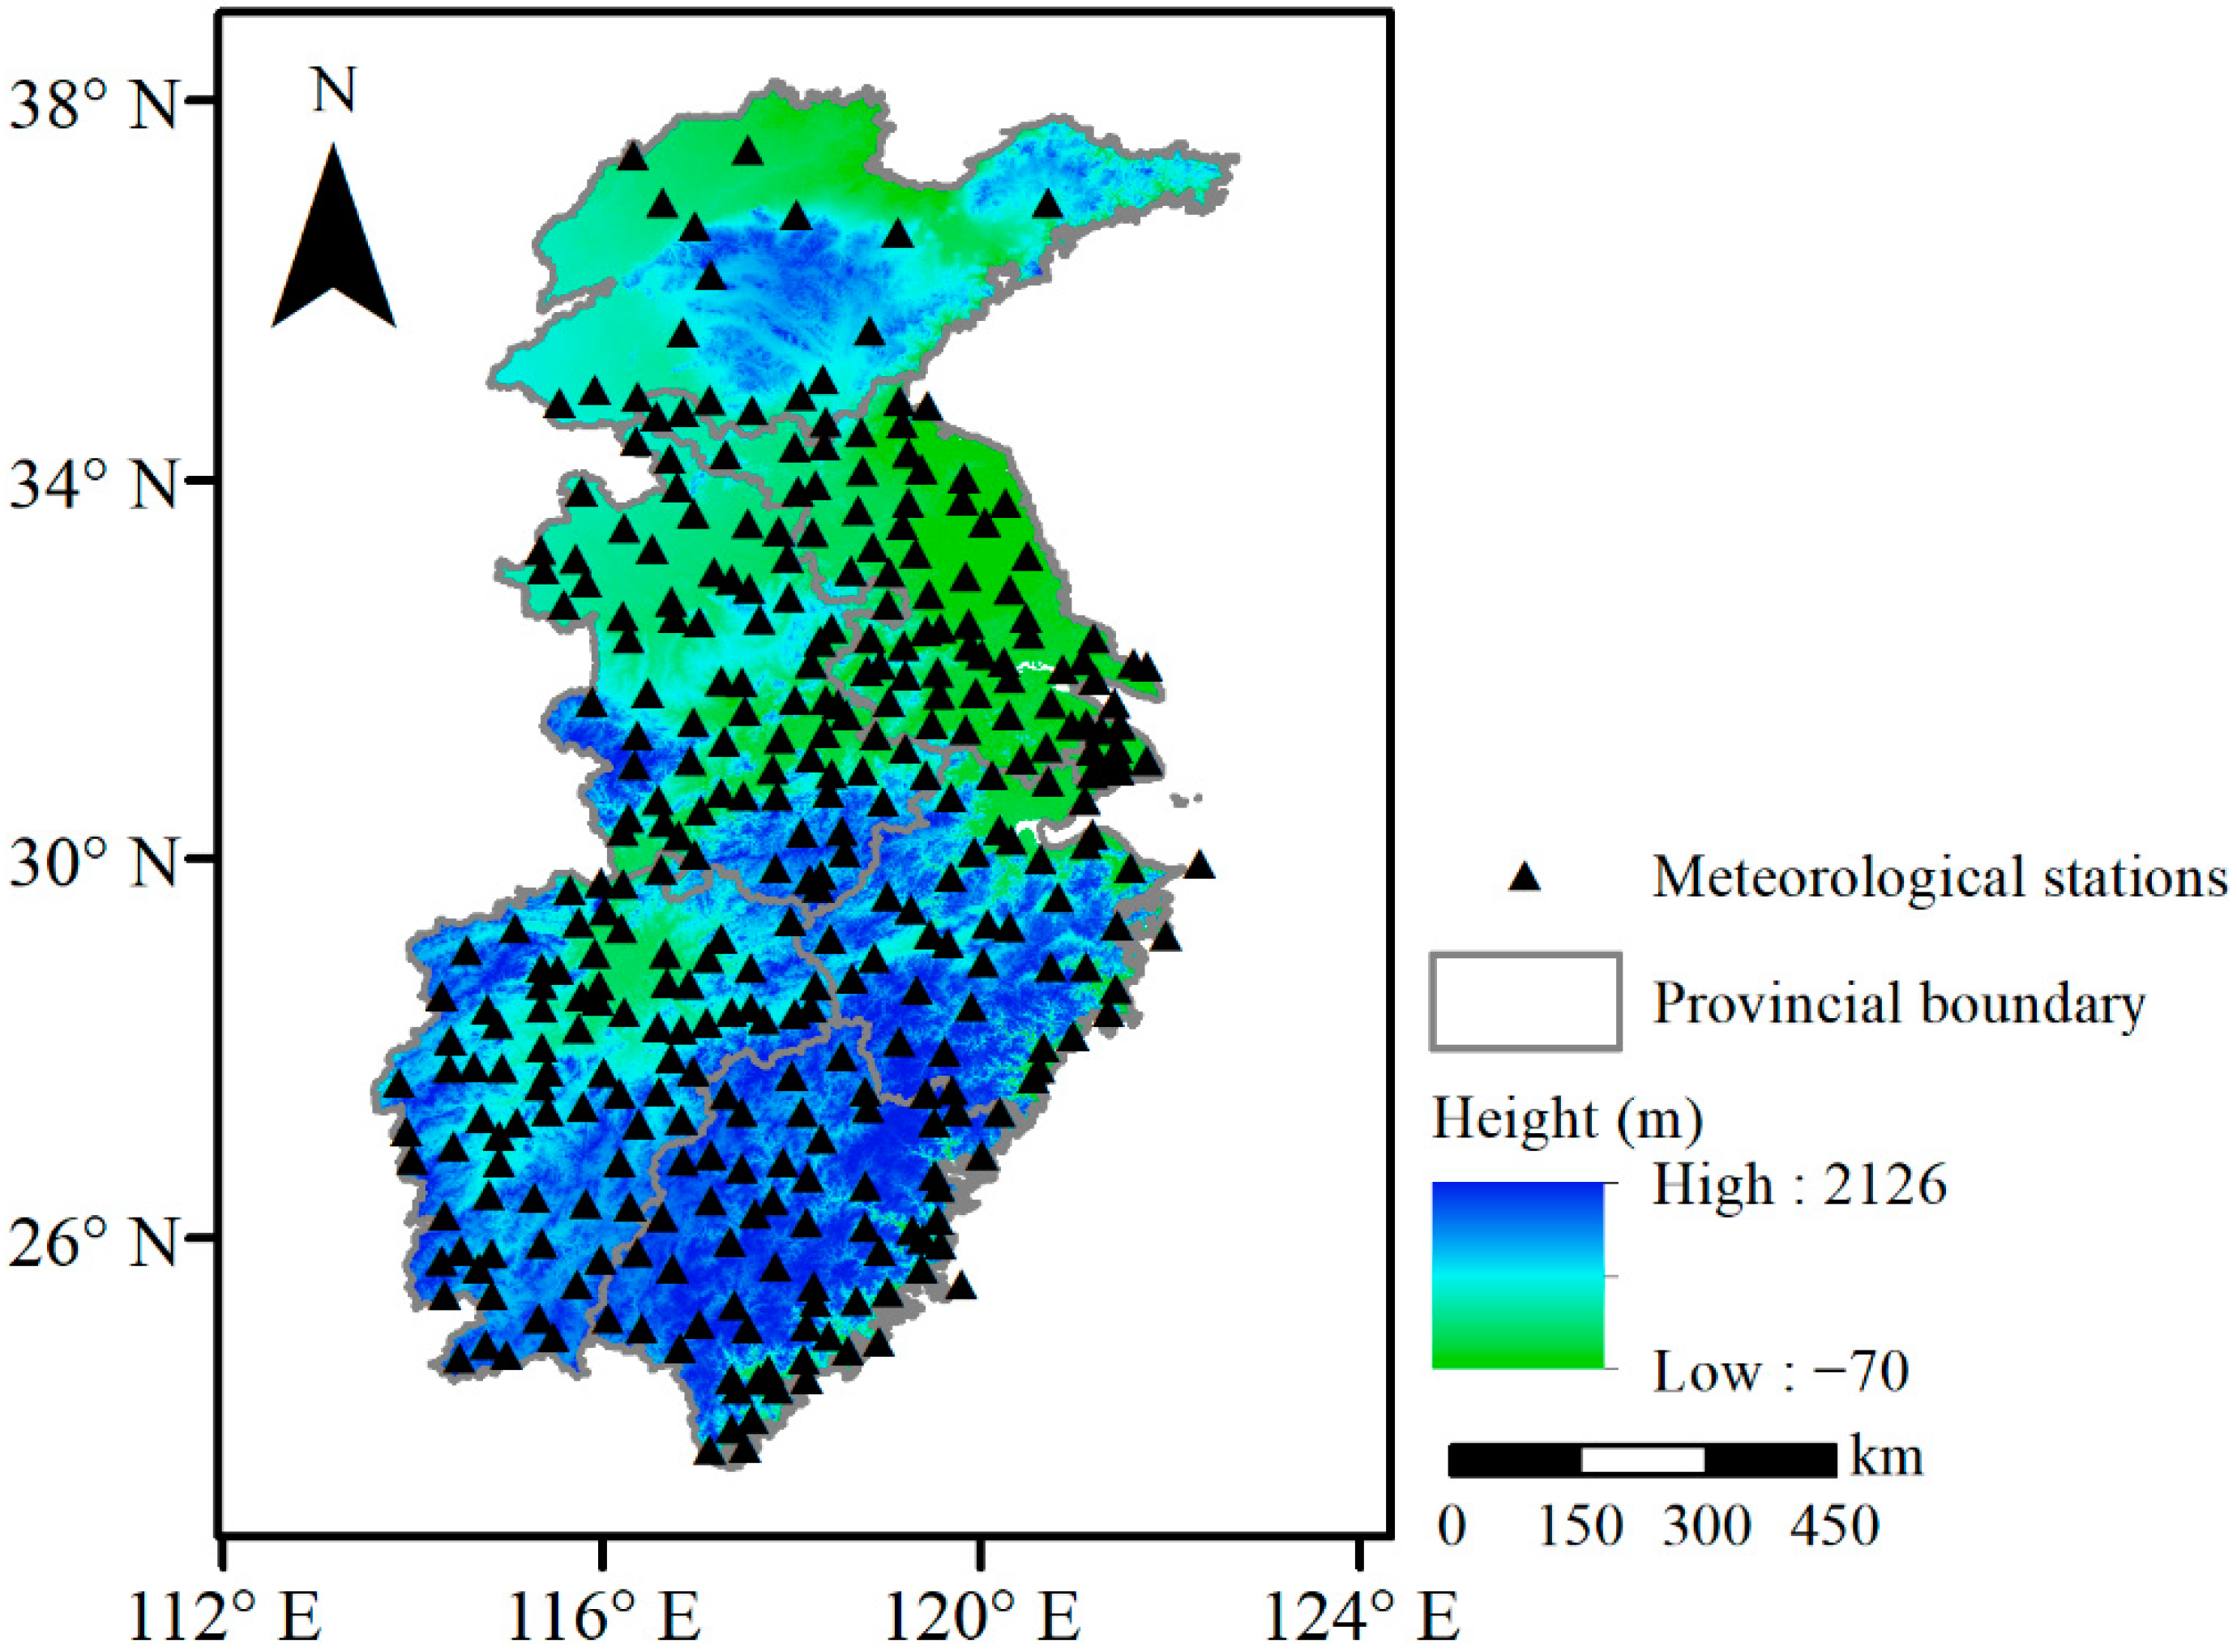
2.1. Study Area

From the north to the south, East China includes Shandong, Jiangsu, Anhui, Shanghai, Zhejiang, Jiangxi, and Fujian Provinces, of which Jiangxi Province is the largest and Shanghai is the smallest. The area of East China (834,300 km2) accounts for approximately 8.7% of the total area of China. Southern parts of East China are dominated by hills and mountains, while northern parts are comparatively flat and largely dominated by plains. East China has a subtropical humid monsoon climate and a temperate monsoon climate. The climate of East China is divided in the region of the Huaihe River; areas to the north have a temperate monsoon climate, while areas to the south have a subtropical monsoon climate (Figure 1). Annual average temperature in East China is 15−18 °C.

2.2. Data Sources

The data used in this study were derived from the National Meteorological Information Center of the China Meteorological Administration, which issues quality-controlled DMT datasets (Figure 2). High-elevation stations (>800 m above sea level) and stations with missing records, blank data, or an anomaly rate of >1% in the corresponding period were excluded for quality control reasons. Ultimately, DMT data from 345 national ground meteorological stations in East China were selected as basic data. To obtain equal-length data samples and to facilitate statistical analyses, we selected daily data from January 1961 to December 2020, with the mean values of the most-recent 30 years (1991–2020) designated as normal year values. Then, anomaly values were calculated from the differences between historical values and normal year values. Significance testing of the linear trends and correlation coefficients was performed following a previous study [29]. The atmospheric circulation data were selected from the 200, 500, and 700 hPa geopotential height fields, horizontal wind field, and other variables of the July–August NCEP/NCAR reanalysis data, with the horizontal resolution of 2.5° × 2.5°.

2.3. Identification of Extreme Maximum Temperature Events (EMTEs)

Extreme temperature events are often described using different standards. In China, it is common for a DMT of 35 °C to be classified as an EMTE [29]. The following four characteristic indexes were selected to analyze the spatiotemporal variations of EMTEs in East China during the period 1961–2020: the annual number of EMTE days, the EMTE intensity, the number of consecutive EMTE days, and the first and last EMTE days.

2.4. Analysis Methods

The regional station arithmetic mean method was used to generate annual series of the four characteristic indexes for East China based on the 1961–2020 DMT monitoring data from the 345 selected stations in the study region. To obtain the inherent law between data, it is necessary to use a continuous curve to approximately describe the functional relationship between the discrete point group on the plane. The most commonly used methods are climate statistical diagnostic techniques, including linear trend and polynomial fitting analyses [30,31], which were chosen in this study to analyze the interannual, interdecadal, and spatial variation trends and the abrupt change characteristics of the EMTE days, intensity, consecutive days, and first and last days in East China at station and regional scales. The purpose of the M-K test is to statistically determine whether a monotonic upward or downward trend exists for the variable of interest over time. The M-K test can be used in place of a parametric linear regression analysis, which can be used to test whether the slope of the estimated linear regression line is different from zero. Regression analysis requires that the residuals from the fitted regression line be normally distributed, which is an assumption not required by the M-K test, i.e., the M-K test is a nonparametric (distribution-free) test [32].

3. Results

3.1. Variations in the Annual Number of EMTE Days

3.1.1. Temporal Variations

The interannual variations in the mean annual number of EMTE days in East China are shown in Figure 3. During 1961–2020, the total number of days with DMT ≥ 35 °C tended to increase in East China. In particular, the number of EMTE days showed a significant increasing trend at the rate of 1.45 d/decade, with a total increase of 8.7 days over the 60-year period, which passed the t-test at a significance level of 0.05. With regard to the number of days, the mean values in the 2000s and 2010s were higher than the recent 30-year mean value, while the mean values in the 1960s, 1970s, 1980s, and 1990s were lower than the recent 30-year mean value. The highest number of EMTE days was recorded in 2013, i.e., 37.4 days. The number of days with DMT ≥ 38 °C reached its maximum (9.1 days) in 2003, with the second highest number of days occurring in 2013 (8.7 days).
Against the background of climate change, the number of days with an EMTE has an obvious increasing trend. It can be seen from the M-K test that the mutation of EMTE days occurred in 2009 and that the growth rate before and after the mutation was 0.4 and 2.8 d/10a, respectively. There was an obvious increasing trend after the mutation (Table 1).

3.1.2. Spatial Variations

The distribution of the high-temperature days is presented in Figure 4. During 1961–2020, the mean annual number of EMTE days showed an increasing trend in eastern, southern, and coastal areas of East China, while a weak decreasing trend was observed in northern and western areas. The eastern area of the Yangtze River Delta and coastal areas of Zhejiang and Fujian Provinces showed the most profound increase at the rate of 3–6 d/decade. High rates of increase of >6 d/decade were recorded in eastern parts of Fujian Province. The highest rate of increase was found in eastern parts of Fujian Province, at 9.3 d/decade. All results for the abovementioned areas passed the t-test at a significance level of 0.05. The number of EMTE days in western areas of East China decreased slightly; however, this trend was not significant.

3.2. Variations in EMTE Intensity

The interannual variation in EMTE intensity in East China is displayed in Figure 5. During 1961–2020, the intensity showed an upward trend at the rate of 0.15 °C/decade, and it increased by 0.9 °C over the 60-year period, passing the t-test at a significance level of 0.05. The interdecadal variation in intensity was also remarkable, with the 1960s, 2000s, and 2010s being high-value periods and the 1970s–1990s being a low-value period. The intensity in 1999 was the lowest, i.e., 36.0 °C; the largest values were observed in 2003 and 2013, i.e., 39.4 °C for both years.
The linear variation trends of the intensity in East China were between −0.2 and 0.8 °C/decade during the period 1961–2020, with upward trends in most areas. The rates of increase were 0.2–0.6 °C/decade in Shanghai, central and southern Jiangsu, northern Zhejiang, eastern Anhui, southern Jiangxi, and coastal areas of Zhejiang and Fujian, while the rates reached 0.6–0.8 °C/decade in Shanghai, southern Jiangsu, and eastern Fujian. All results passed the t-test at a significance level of 0.05. In the other areas of the study region, the rates of increase and decrease were not substantial and failed to pass the t-test at a significance level of 0.05 (Figure 6).
Considering the years with extreme maximum temperatures during the past 60 years at stations in East China, the historical maximum-temperature extremes in most areas occurred in the 21st century. In the 20th century, extreme maximum temperatures only occurred in a few areas in northern Jiangsu, northern Anhui, and northeastern Jiangxi, as well as in the Fujian and Zhejiang Provinces. The extreme maximum temperatures were primarily concentrated in 2003 (Station 93), 2013 (Station 69), and 2017 (Station 32; Figure 7).

3.3. Variations in the Maximum Consecutive EMTE Days

The maximum consecutive EMTE days show that the earliest year of mutation was 1977, the latest was 2009, and the average appearance time was 2003 (Table 2). Taking 2003 as the boundary, the slope of the longest continuous EMTE days during 1961–2003 was only 0.4 d/10a, whereas the slope increased to 1.4 d/10a during 2004–2020.
The distributions of the consecutive EMTE days in East China during 1961–2020 are displayed in Figure 8. Overall, the number of consecutive days was larger in the south than in the north. Specifically, there were 10–15 consecutive EMTE days concentrated mainly in Jiangxi, most areas of Zhejiang, central Fujian, and parts of Anhui, 5–10 consecutive EMTE days concentrated mainly in most areas of Anhui, southern Jiangsu, parts of Shanghai, most areas of Fujian, northern Jiangxi, and northern Zhejiang, but no more than 5 consecutive EMTE days in Shandong, most areas of Jiangsu, most areas of Shanghai, southern Jiangxi, and coastal areas of East China. The regional linear variation trends were between −1.3 and 2.1 d/decade. It can be seen from Figure 8 that most of the region showed an upward trend, except for western Zhejiang and a small part of Jiangxi, which showed a decreasing trend. Among the regions with an upward trend, Shanghai, southern Jiangsu, the northern area and eastern coast of Zhejiang, eastern coast of Fujian, southern Jiangxi, and individual stations in Anhui and Shandong (within areas of rapid urbanization) passed the M-K test at a significance level of 0.05. In other areas of the study region, the rates of increase or decrease were not significant (Figure 8).

3.4. Variations in the First and Last EMTE Days

The mean first EMTE day was 20 June, and the mean last EMTE day was 22 August in East China during the 60-year study period. The linear trend and mutation detection results are shown in Figure 9. It can be seen that the mean first EMTE day shows an early trend and that the mean last EMTE day shows a late trend; significant changes and mutation points appeared in the 21st century. The mean first EMTE day was 23 June during 1961–1999 and 11 June during 2000–2020, which means it advanced by 12 days since the beginning of 21st century; M-K mutation detection also found that the year 2000 was a mutation point. Similarly, the mean last EMTE day was 20 August during 1961–1999 and 27 August during 2000–2020, i.e., a delay of 7 days since the beginning of the 21st century; the M-K mutation point appeared in 2015.
Based on the linear variation trends for the previous 60 years, the mean first day advanced by 1–10 days in most areas of the study region, except northern Jiangsu and most areas of Shandong. The rate of advance in some areas passed the t-test at a significance level of 0.05. Additionally, the mean last day became delayed by 1–10 days in most areas of East China, but by 10–20 days in eastern coastal areas. The rate of delay in most areas passed the t-test at a significance level of 0.05 (Figure 10).

4. Relationship between EMTEs and Atmospheric Circulation

Previous research has indicated that influence by the western Pacific subtropical high is one of the main reasons for the formation of EMTEs in central and eastern China [33,34,35,36,37,38,39]. Generally, the stronger the subtropical high and the longer the duration of its control over the region, the more severe and persistent the EMTEs. Yin et al. found that an abnormally strong subtropical high was the primary cause of the rare high temperatures in Jiangxi in the summer of 2003, and that 79–82% of summer high-temperature days (above 35 °C) in Jiangxi occurred under the control of the subtropical high [34,40].
To analyze the differences in the circulation characteristics of years with abnormally high summer temperatures, we calculated the mean 500 hPa height field from July to August in years with more EMTEs (i.e., 1967, 1971, 1978, 2003, 2013, and 2017) and years with fewer EMTEs (i.e., 1973, 1975, 1982, 1997, 1999, and 2015) in East China using NCEP/NCAR reanalysis data. The average field for July is shown in Figure 11. In years with more EMTEs, the mid-latitude westerly trough near 110°E was located further northward with low intensity, the subtropical high in the Northern Hemisphere was intense, the ridgeline of the Northwest Pacific subtropical high was further northward, and the center of the subtropical high was over the East China Sea. The ridgeline of the subtropical high was located at 26°–28° N over mainland China, the 586-line was over eastern regions of China, and the 584-line was near 35° N. In years with fewer EMTEs, the mid-latitude westerly trough near 110°E was located further southward with comparatively high intensity, the subtropical high in the Northern Hemisphere was weak, the ridgeline of the Northwest Pacific subtropical high was further southward, and the westward extension of the 588-line was located further eastward. Moreover, in comparison with years with more EMTEs, the 586-line was found over the southeast coast of mainland China, and the 584-line was located near 31°–32° N to the east of China. Analysis of the August mean field revealed similar conditions. To further analyze the differences in the circulation characteristics between high temperatures and juvenile high temperatures in East China, we calculated the average fields of the 700 hPa and 850 hPa height fields. The average 700 hPa height field is shown in Figure 12. The intensity of the subtropical high in East China was obviously stronger in years with more high temperatures than in years with fewer high temperatures. For years with more high temperatures, the 312-line controlled the area south of the Yangtze River in eastern China and the ridgeline was located near 27°–28° N, whereas the 312-line was obviously further to the southeast in years with fewer high temperatures; the average 850-hPa height field revealed similar results. In terms of the 200-hPa mean field (figure not shown), years with more EMTEs were characterized by the South Asian high being located further eastward and northward with high intensity, and the 1252-line extending eastward to the western Pacific Ocean. Conversely, years with fewer EMTEs were characterized by the South Asian high being located further westward and southward with low intensity, and the eastward extension of the 1252-line being near 110° E. Accordingly, more EMTEs occurred in East China because the study region was under intense atmospheric subsidence resulting from the intensification and westward extension of the subtropical high coupled with the weakening and northward displacement of the mid-latitude westerly trough.

5. Discussion and Conclusions

On the basis of time series and spatial analyses of several characteristic EMTE indexes, EMTEs were found to have increased significantly since 2000 in China, especially in East China. Lin et al. also found that the summer temperature in East China has had an increasing trend since 2000 [41]. Similarly, Wu concluded that the trend of temperature increase was most evident in parts of southern Jiangsu Province and coastal areas of Zhejiang Province [30]. It is important consider why anomalies of temperature increase have occurred since 2000 in East China, especially in the Yangtze River Delta. A previous study showed that this phenomenon might be associated with the development of the economy, continuous growth of the urban population, and constant increase in the level of urbanization within this region [42]. Changes in the urban underlying surface might enhance the urban “heat island effect.” Many studies in China and other countries have investigated heat wave weather caused by the urban heat island effect. For example, Zhang et al. simulated a high-temperature process in Beijing (2020) using the Weather Research and Forecast model; they found that a prominent urban heat island effect formed on the urban underlying surface of Beijing, which increased the intensity of extreme high-temperature events in the urban area [43]. Moreover, Ao et al. found a synergistic effect between urban heat islands and heat waves [44]. Mitchell demonstrated a strong positive correlation between the maximum urban heat island intensity and the square root of the urban population using data from 77 cities in the United States [45]. Furthermore, Oke proposed a linear relationship between the maximum heat island intensity and the urban population based on data from many cities in North America and Europe [46]. Therefore, it is reasonable to believe that, because of high economic growth, the increased concentration of the human population, and accelerated urbanization, the resulting urban heat island effect might have led to the continuous increase in summer high temperatures in the Yangtze River Delta since 2000. Accordingly, it is essential to consider regional differences in extreme high-temperature events, which will be the focus of future research.
Because the representativeness of the high-temperature characteristic indexes selected in this paper deserves further study, and because the selected weather stations are distributed unevenly in some areas, the representativeness of our statistical conclusions requires further research, together with the consideration of other relevant research conclusions.
(1)
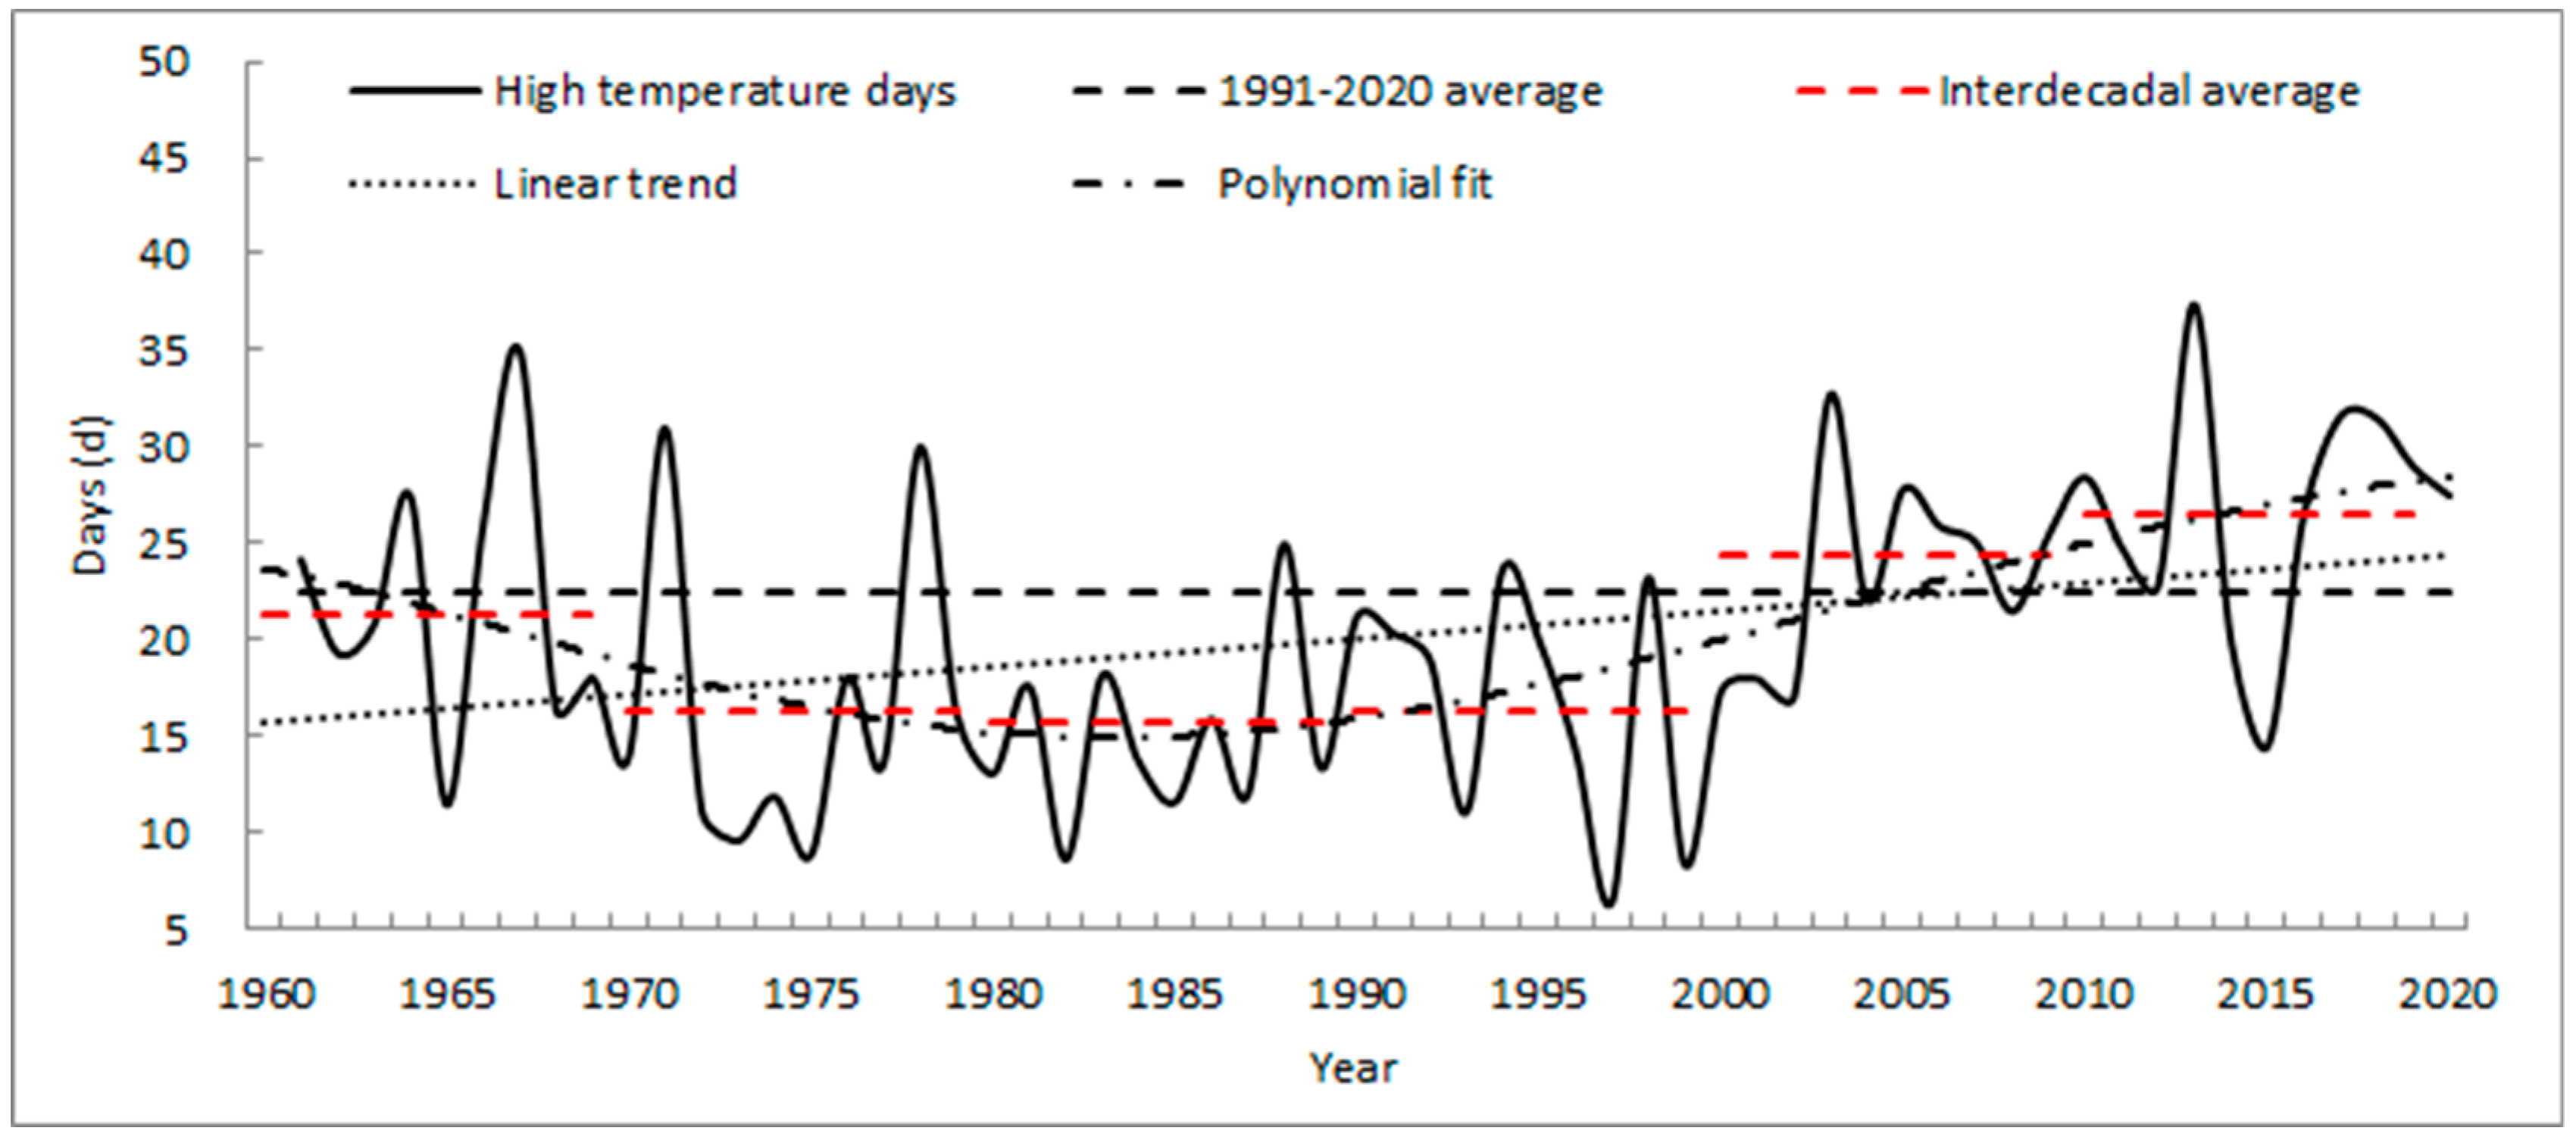
Within the past 60 years, the annual number of EMTE days in East China increased at a substantial rate, passing the t-test at a significance level of 0.05. The number of days increased by 1.45 d/decade. The numbers of EMTE days in the 1970s and 1990s were remarkably lower than the normal year means, but then increased considerably in the 21st century. In comparison with the normal year means, the EMTE days changed from relatively low to substantially higher at the beginning of the 21st century, showing abrupt change points. The mutation of EMTE days occurred in 2009, and the growth rate before and after the mutation was 0.4 and 2.8 d/10a, respectively.
(2)
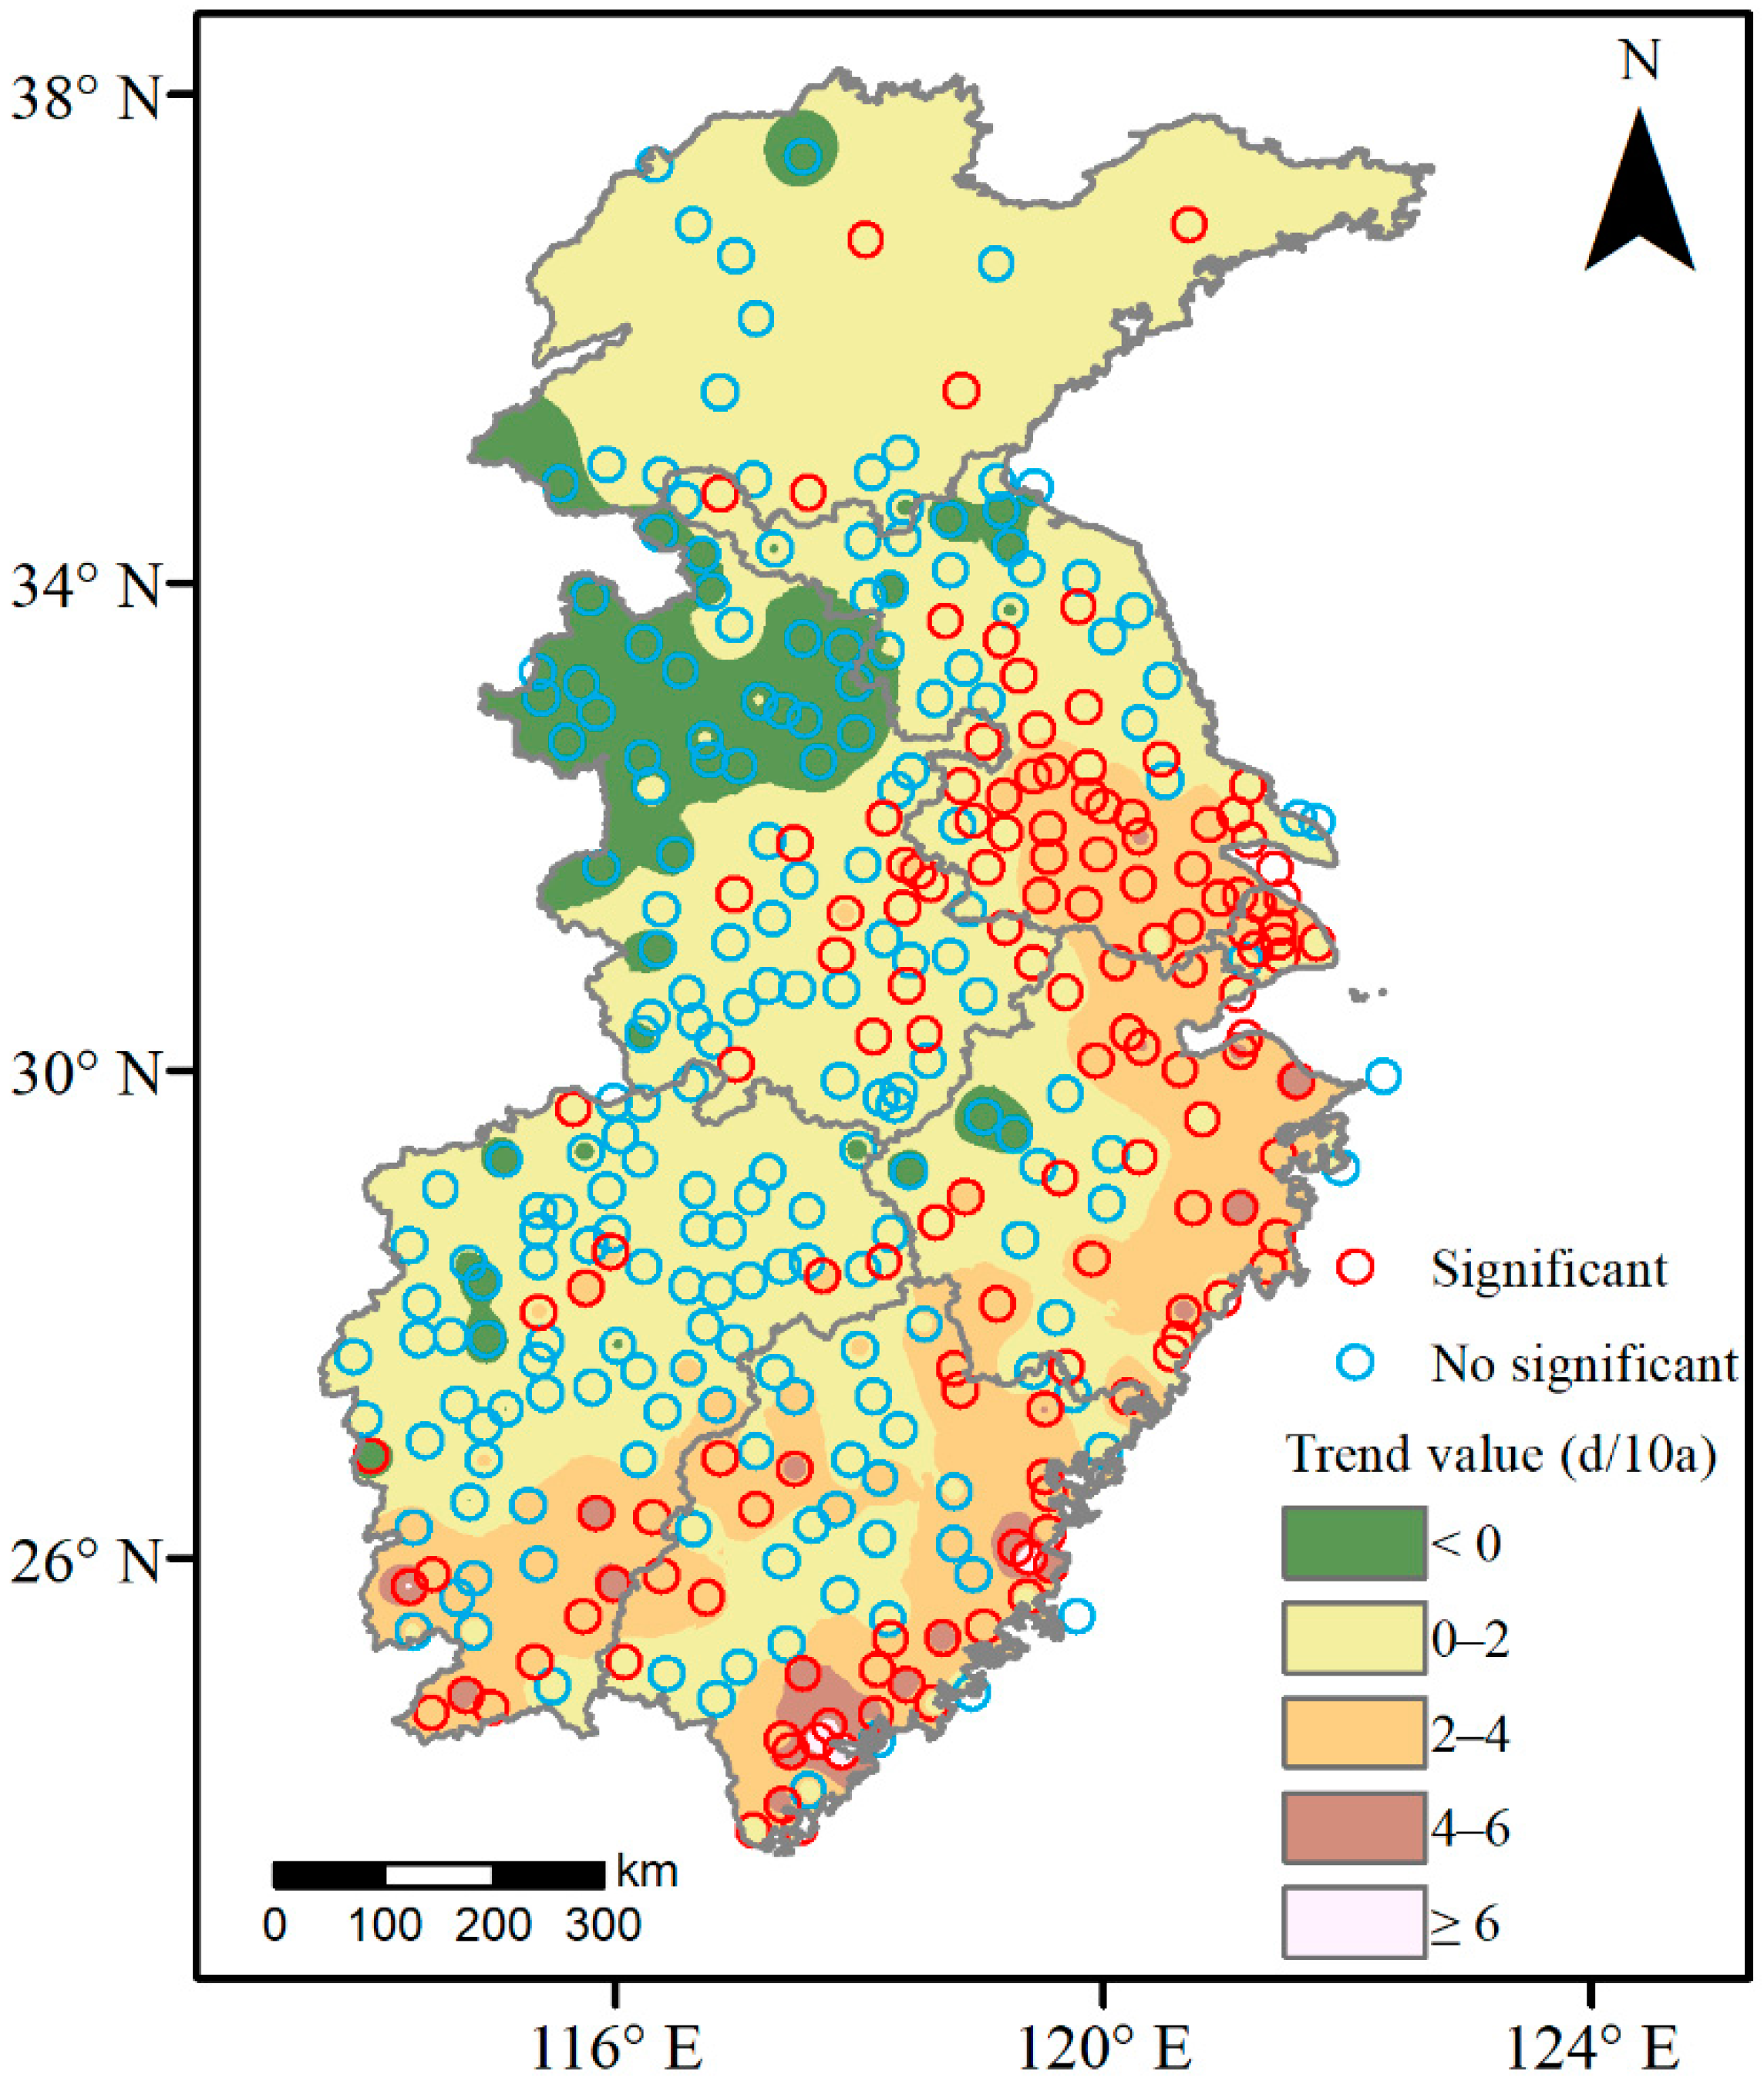
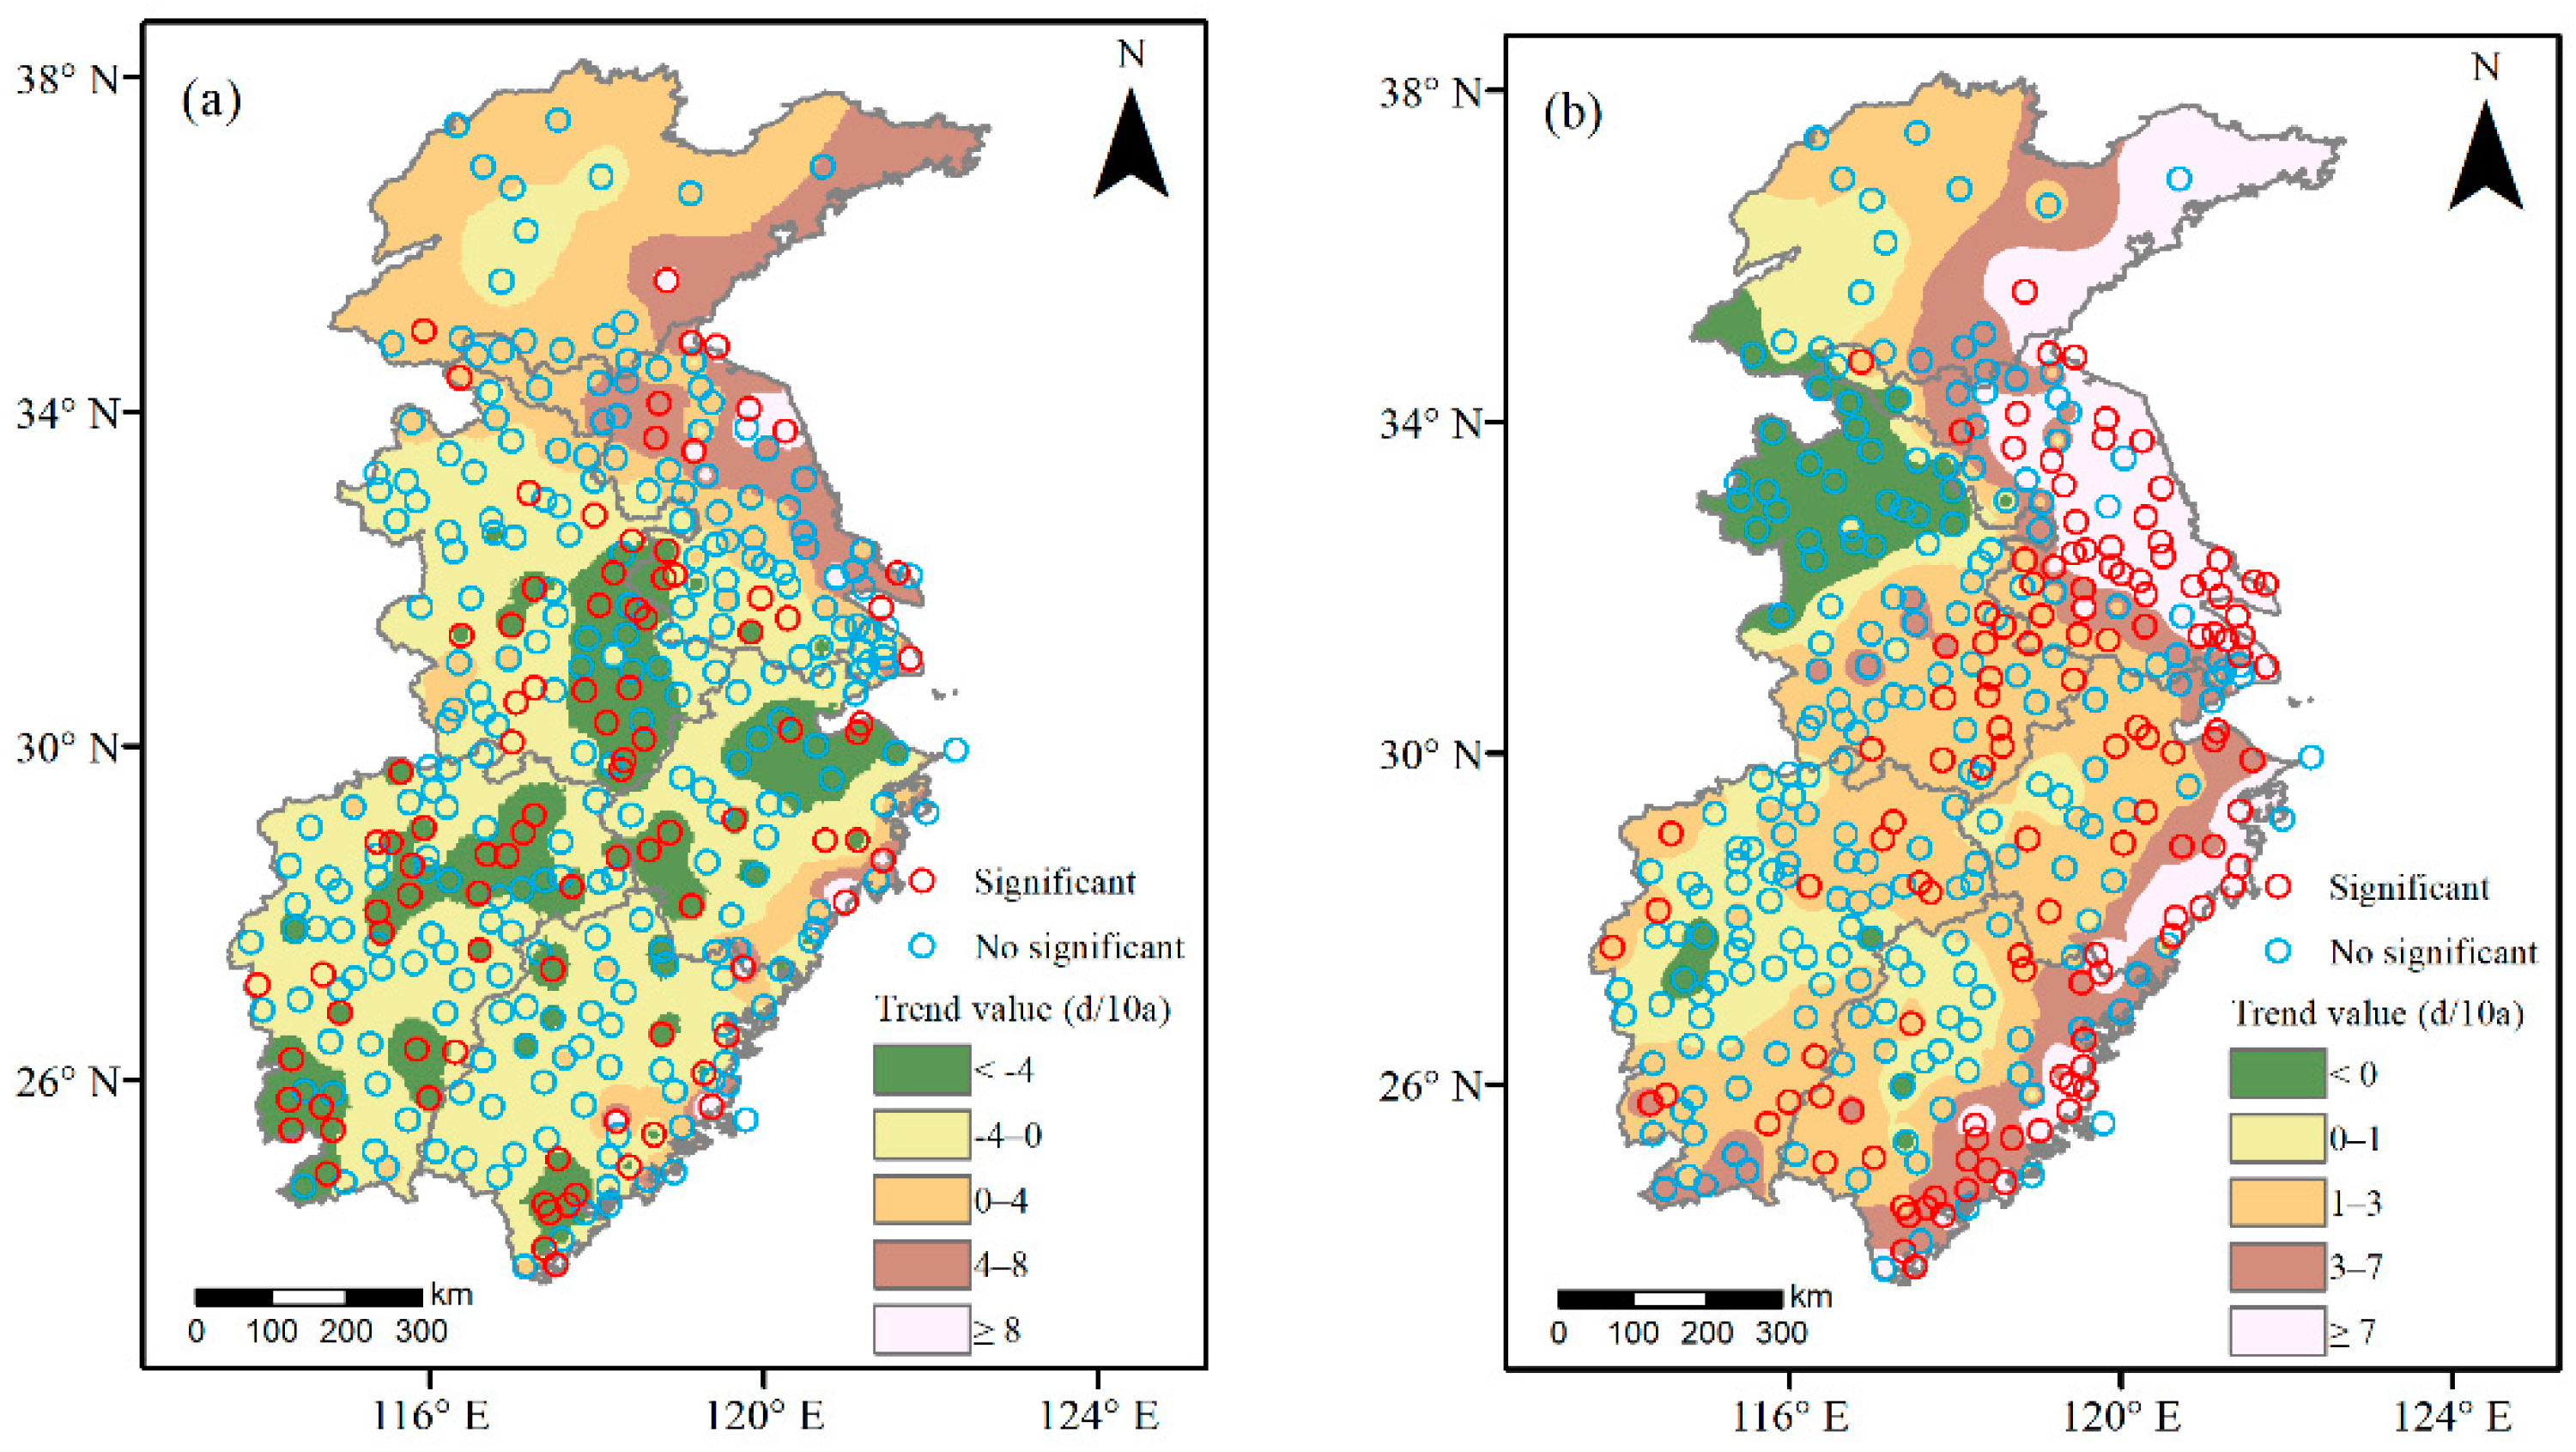
Over the 60-year study period, the number of EMTE days exhibited an increasing trend in eastern, southern, and coastal areas of East China, while a weak decreasing trend was observed in northern and western areas. The number of days increased most prominently at a rate of up to 3–6 d/decade (locally 6–9 d/decade) in eastern areas of the Yangtze River Delta, coastal areas of Zhejiang and Fujian, and southern Jiangxi Province, all of which passed the t-test at a significance level of 0.05.
(3)
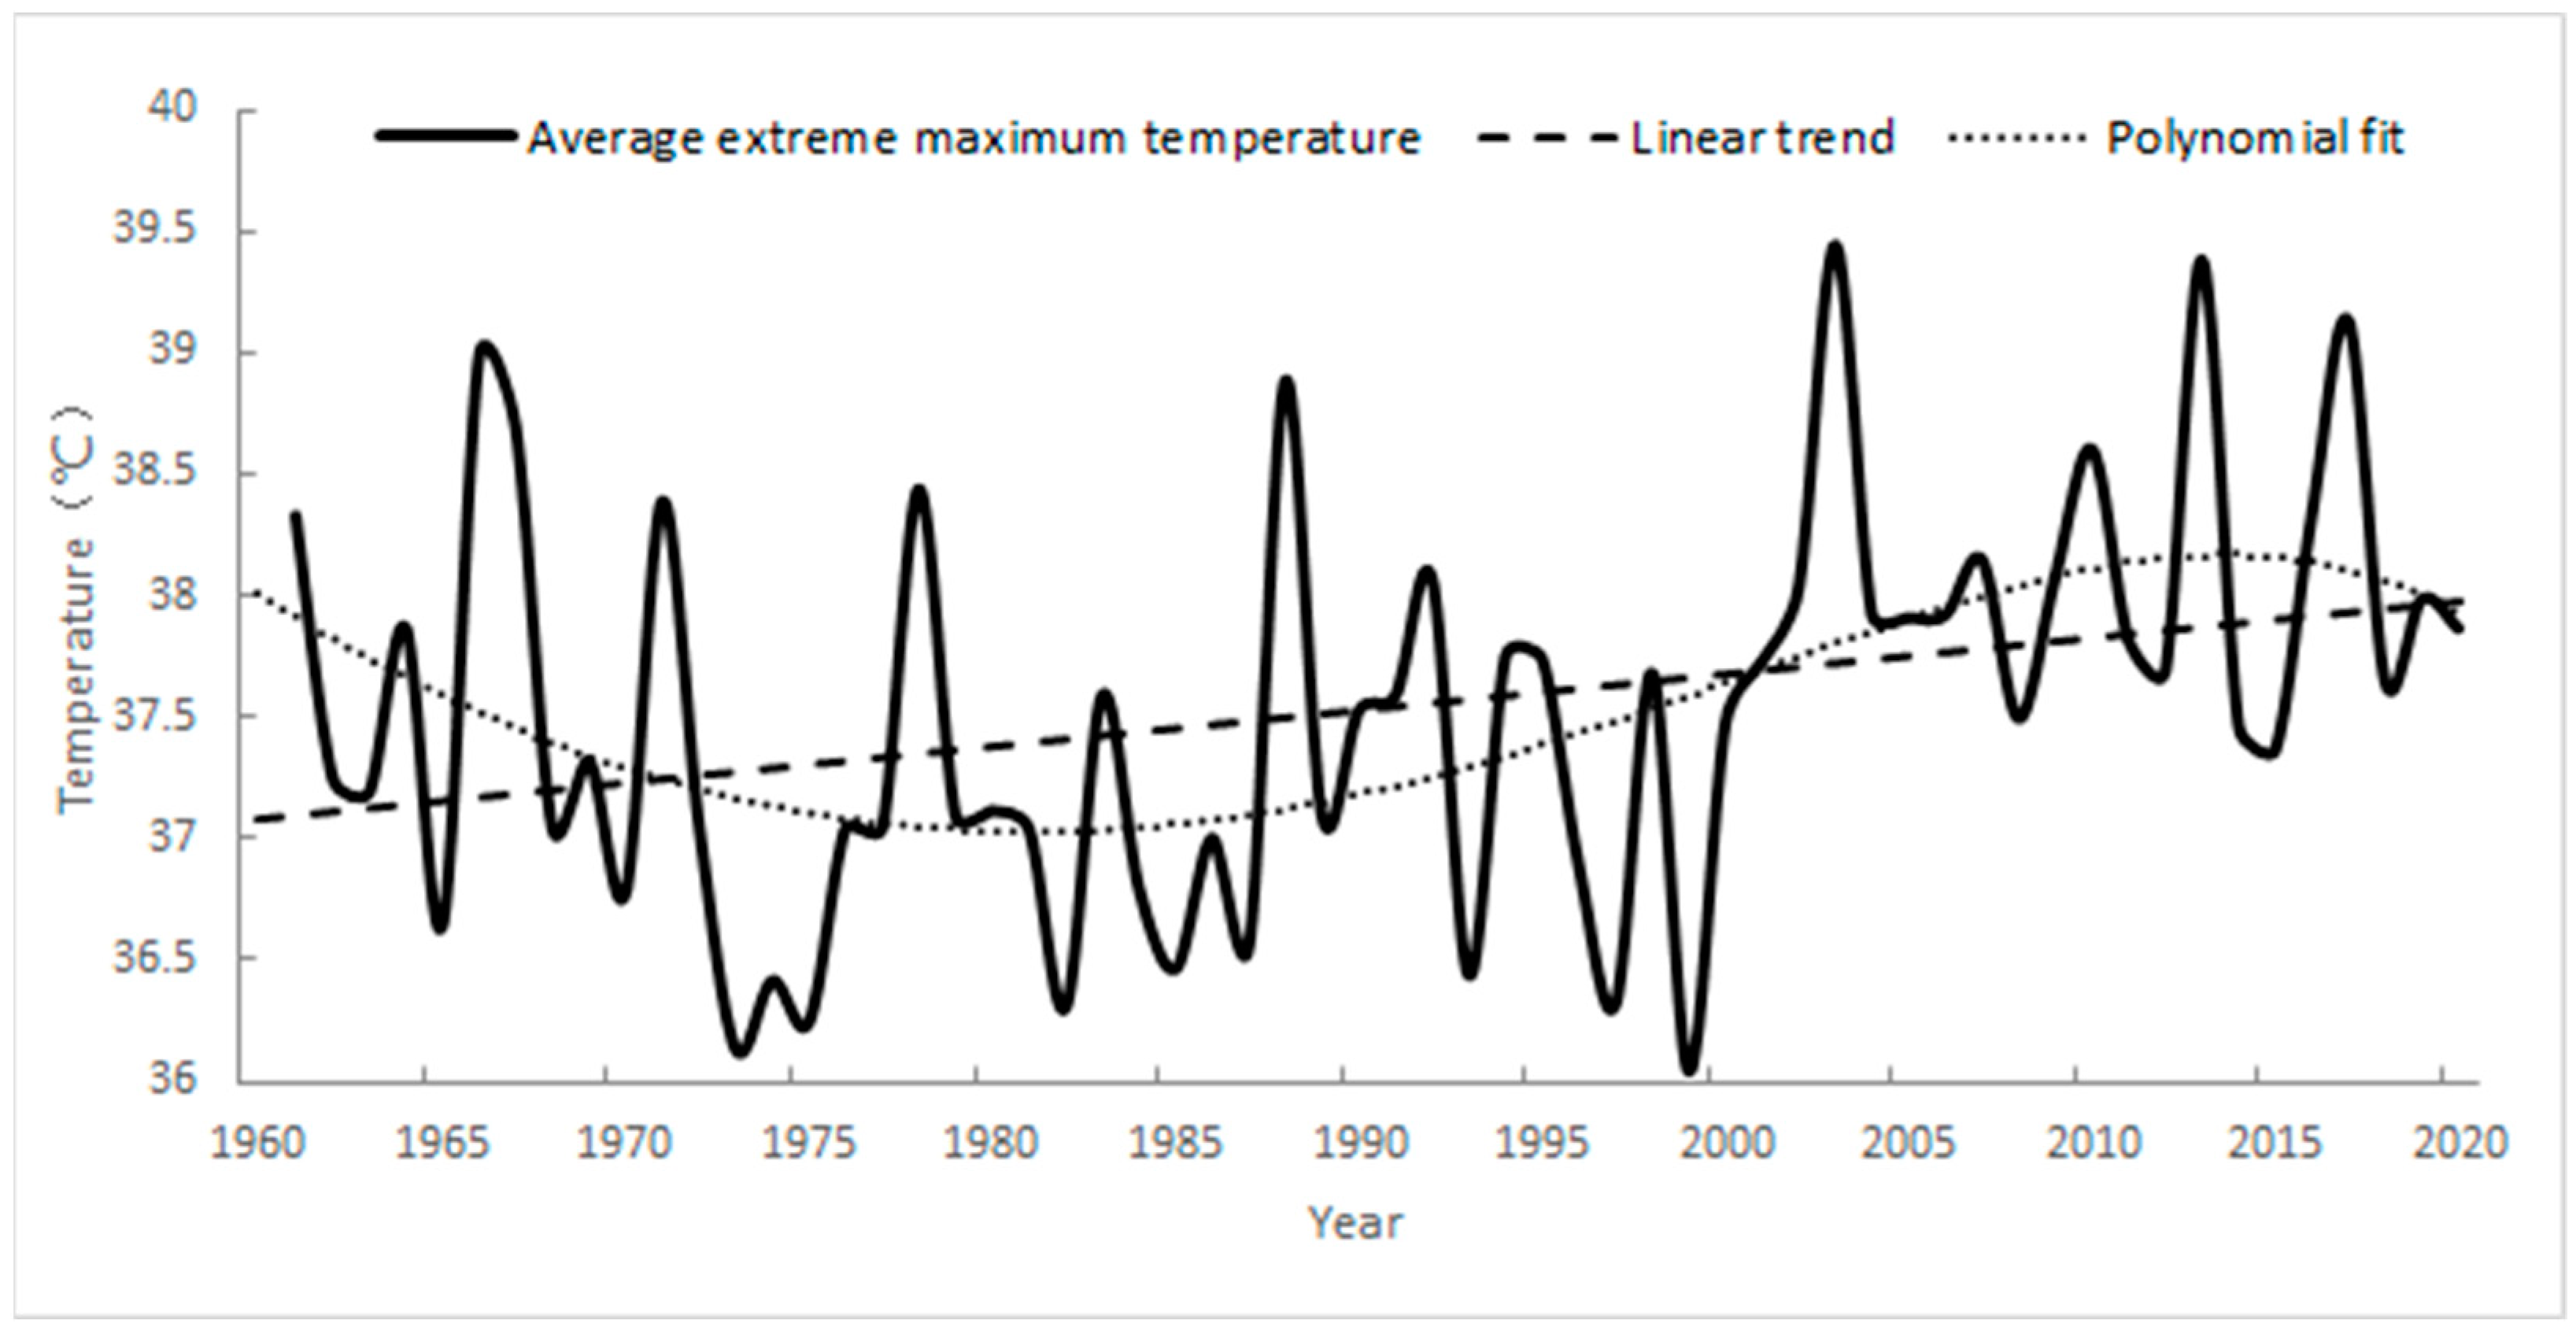
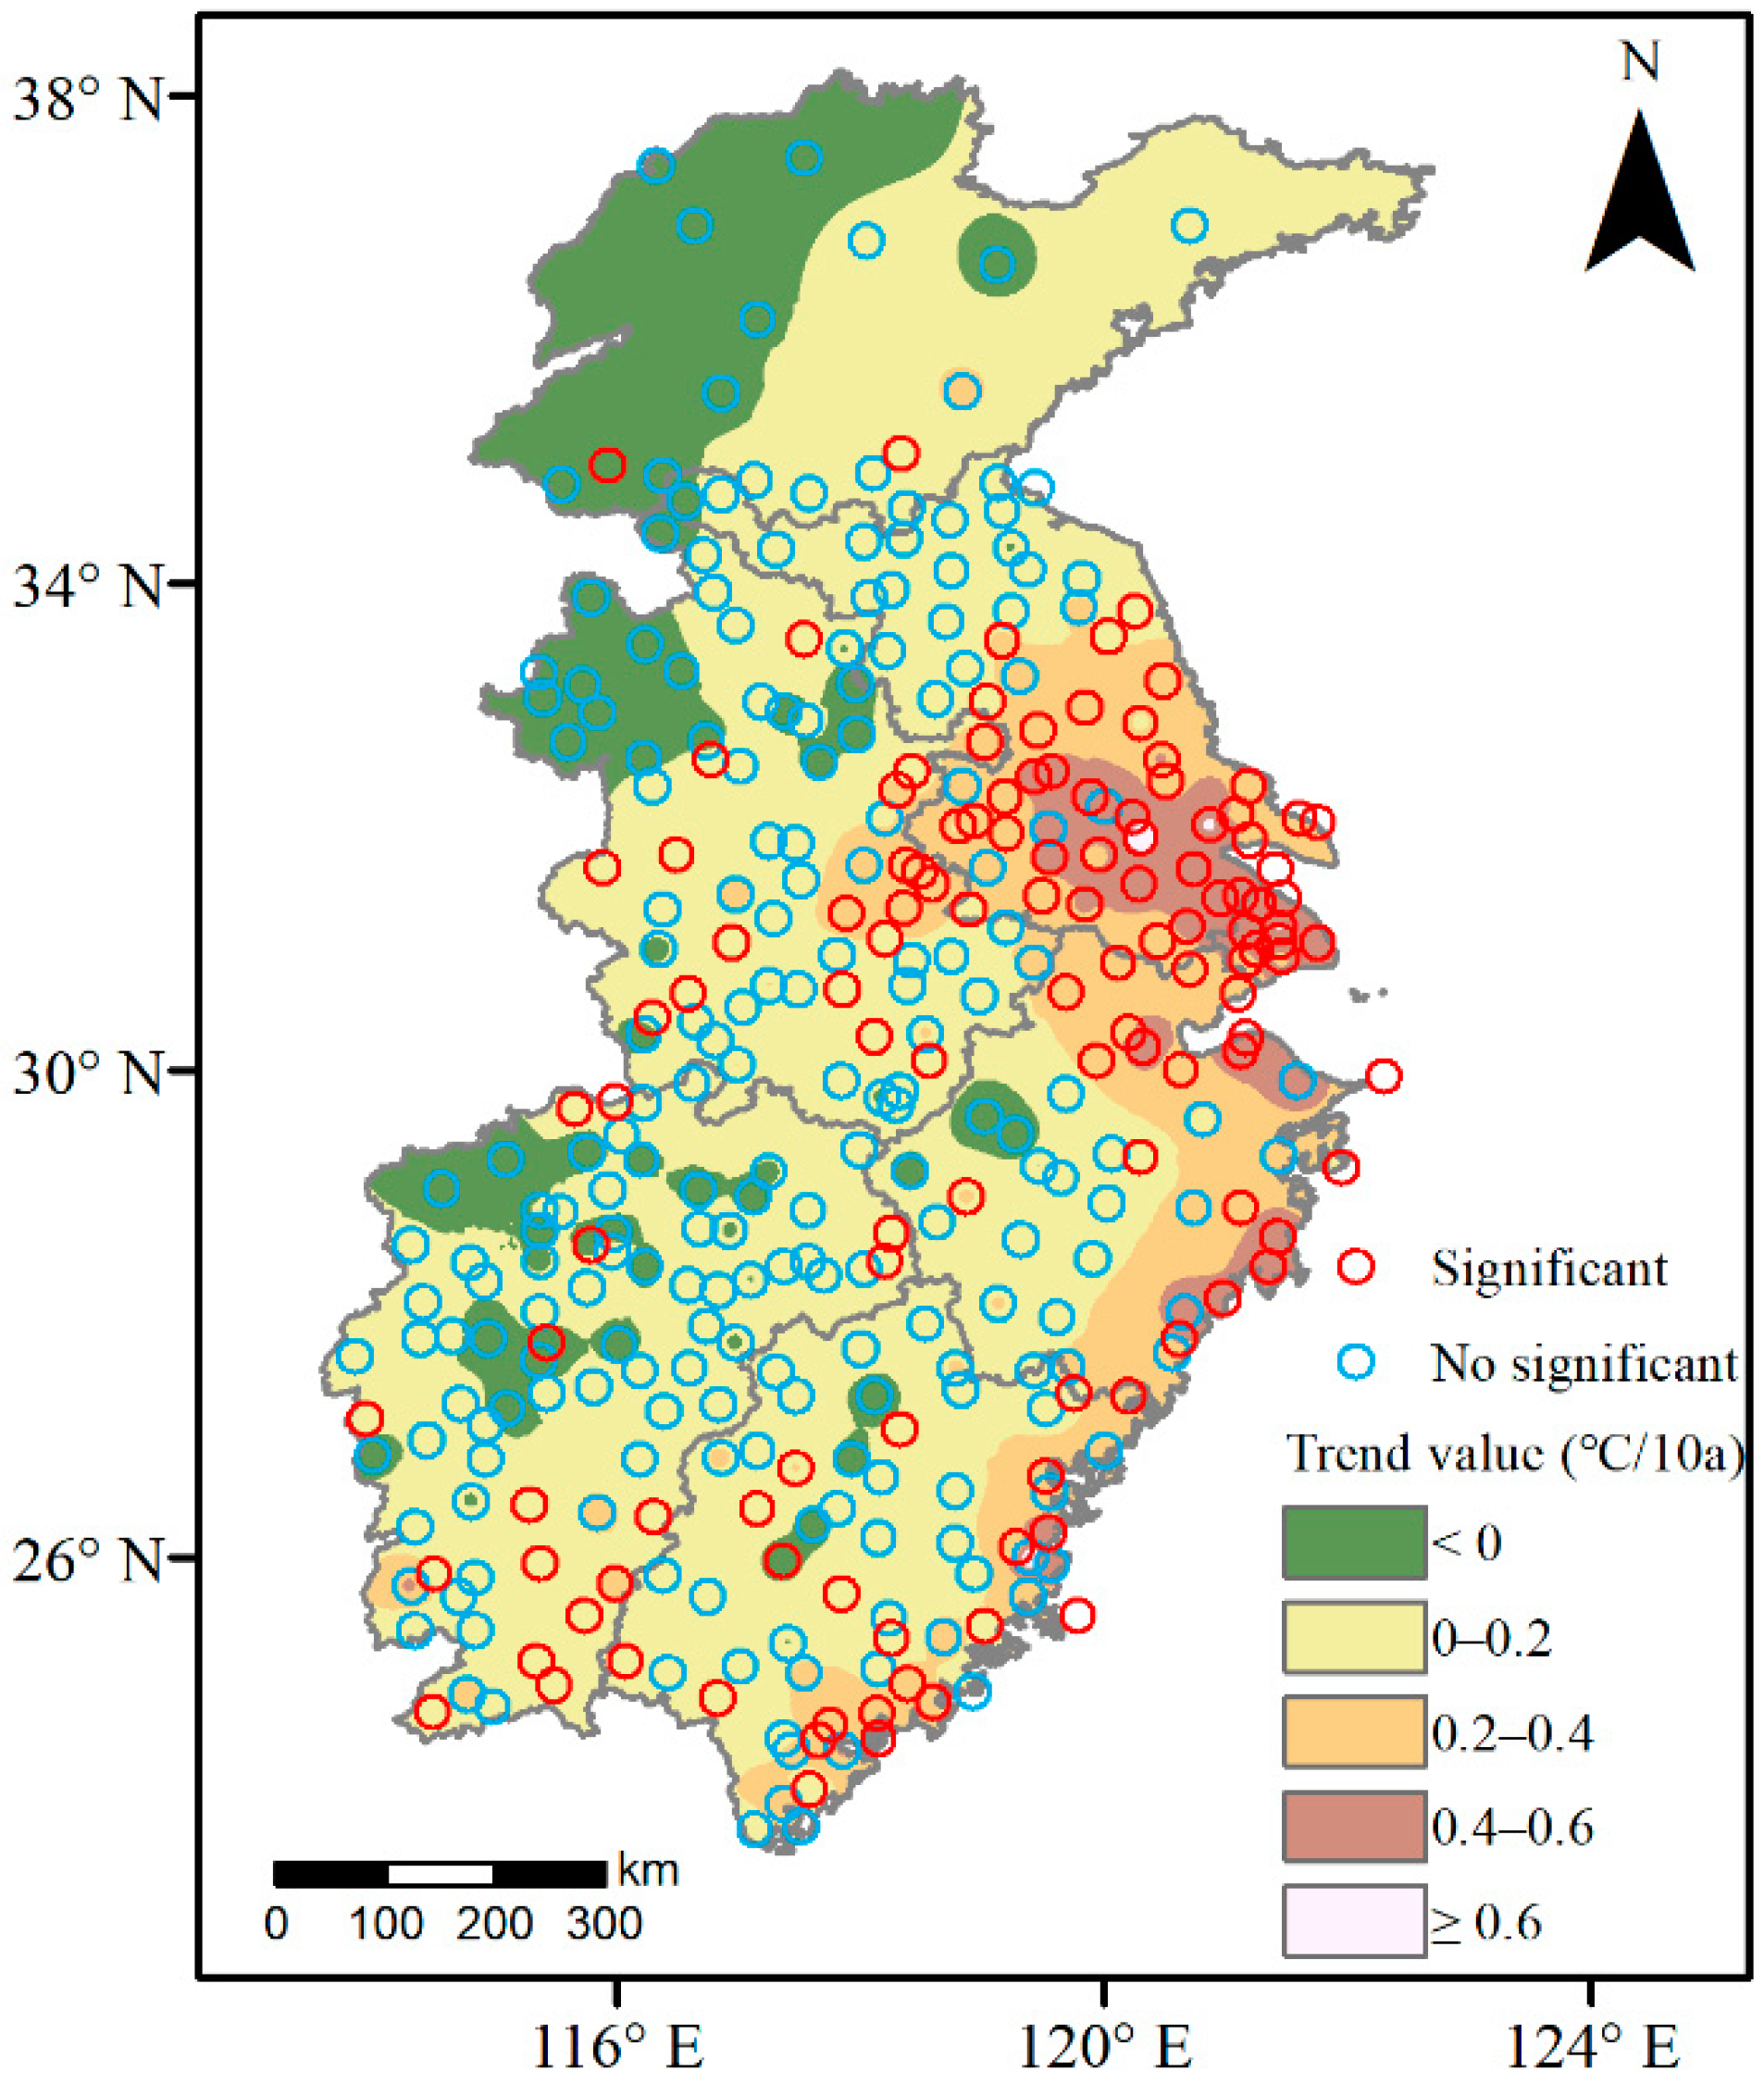
The EMTE intensity showed an increasing trend at a rate of 0.15 °C/decade in East China during the 60-year study period, passing the t-test at a significance level of 0.05. The linear variation trends of the extreme maximum temperature were between −0.2 and 0.8 °C/decade, with a distinct upward trend in most areas. Historical maximum-temperature extremes occurred primarily in 2003 and 2013.
(4)
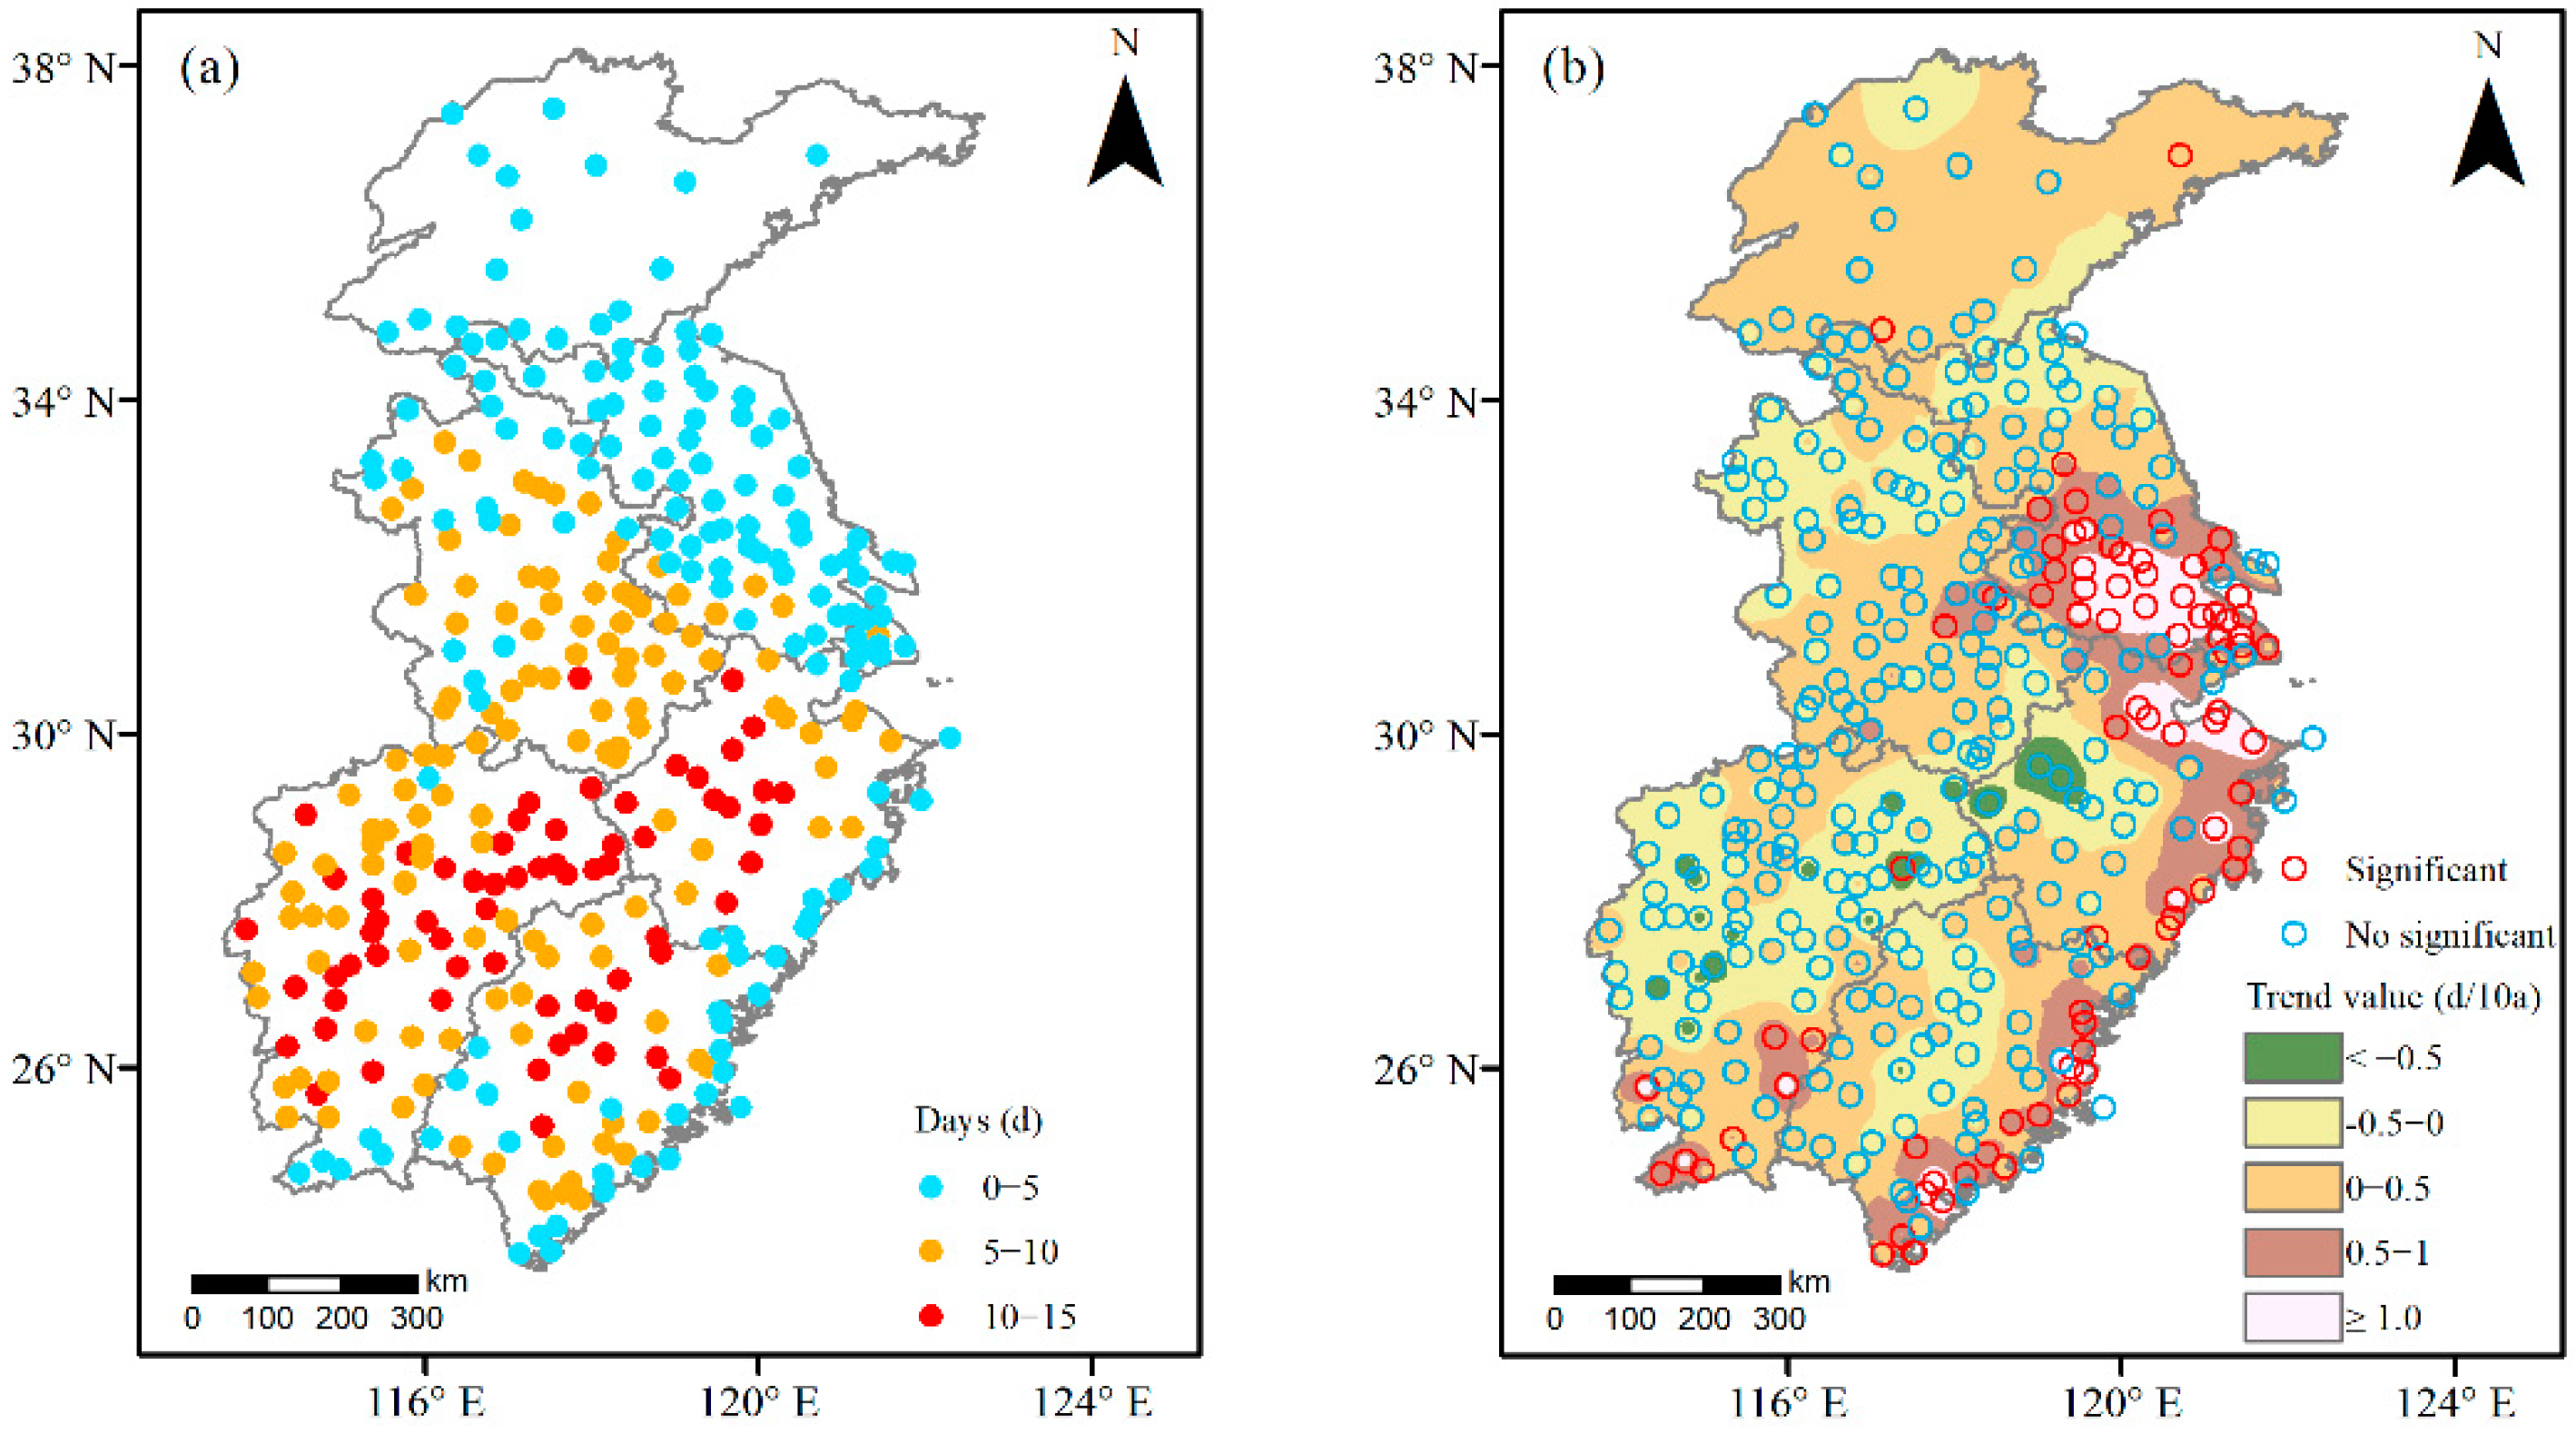
The mean number of consecutive EMTE days increased by 0.24 d/10a in East China, an increase of 1.4 d in the recent 60 years. The growth rate increased significantly after 2003, i.e., the mean number of consecutive EMTE days during 2003–2020 increased by 35% in comparison with that in 1961–2002. The mean number of consecutive EMTE days in the south was greater than that in the north, and the annual variation trend was between −1.3 and 2.1 d/10a. The growth rate in the Yangtze River Delta, eastern coastal areas, and southern mountainous areas passed the t-test at a significance level of 0.05. The mean mutation time was 2003, and the growth rate before and after the mutation was 0.4 and 1.4 d/10a, respectively.
(5)
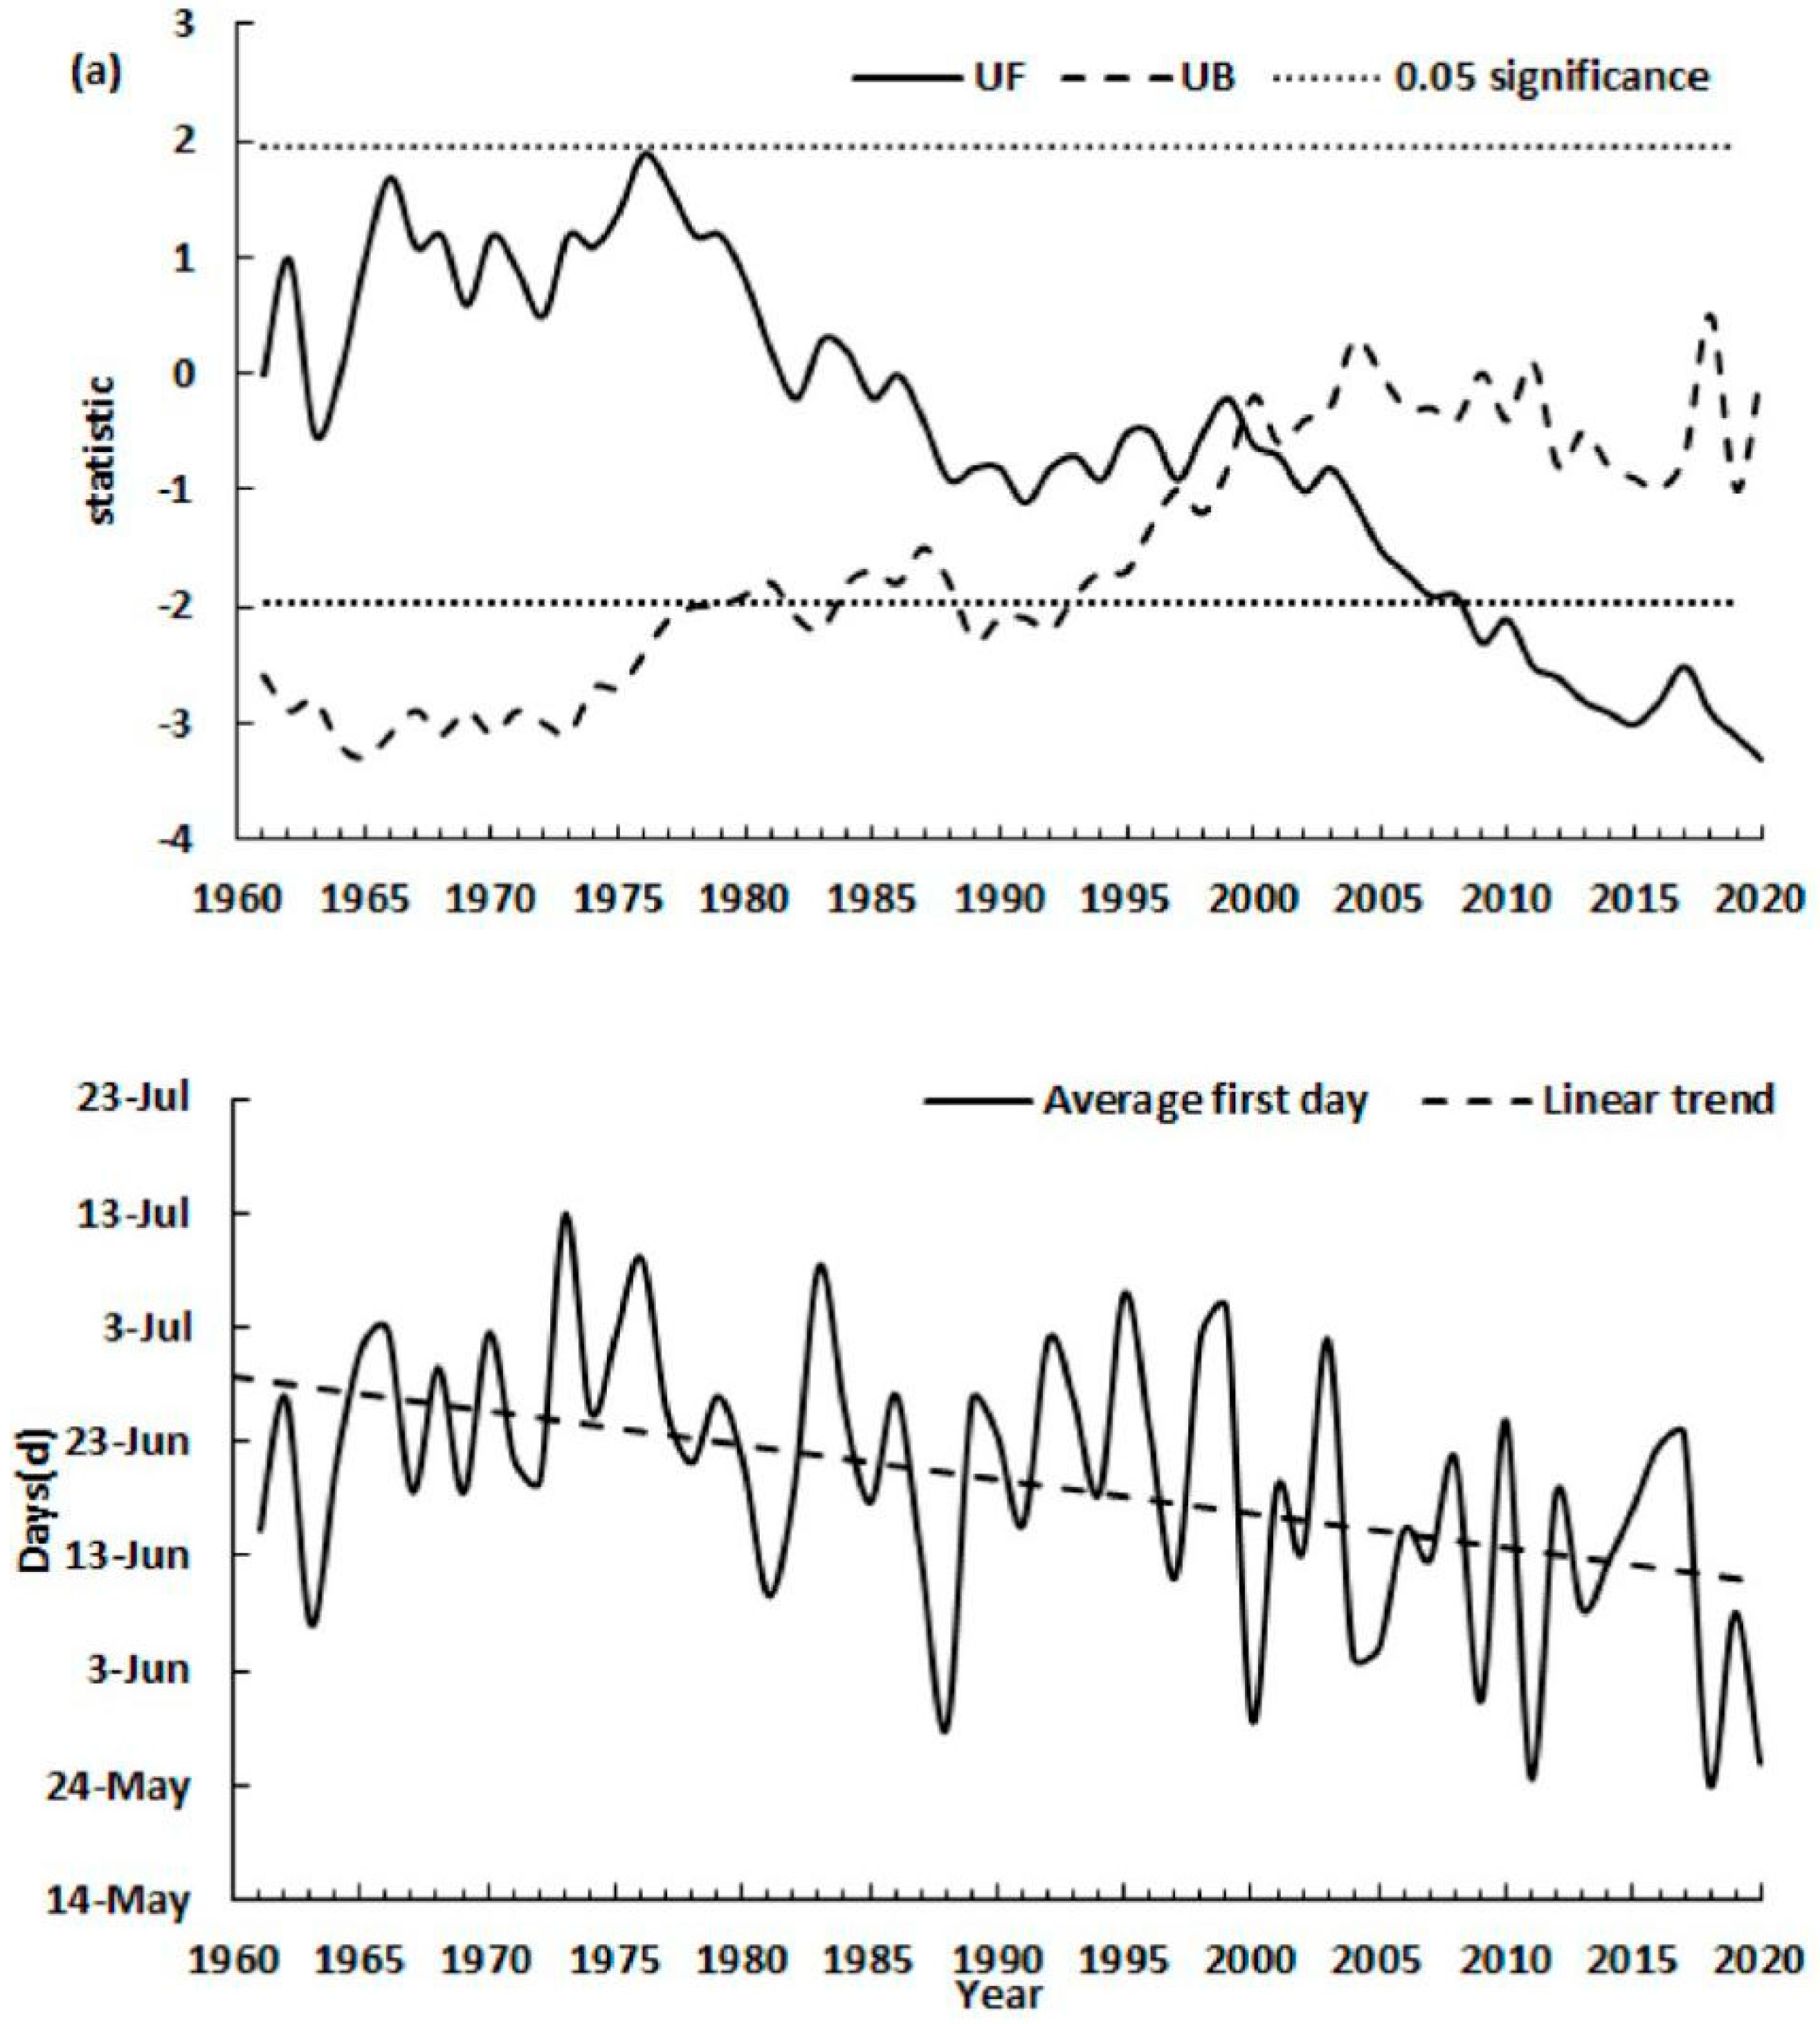
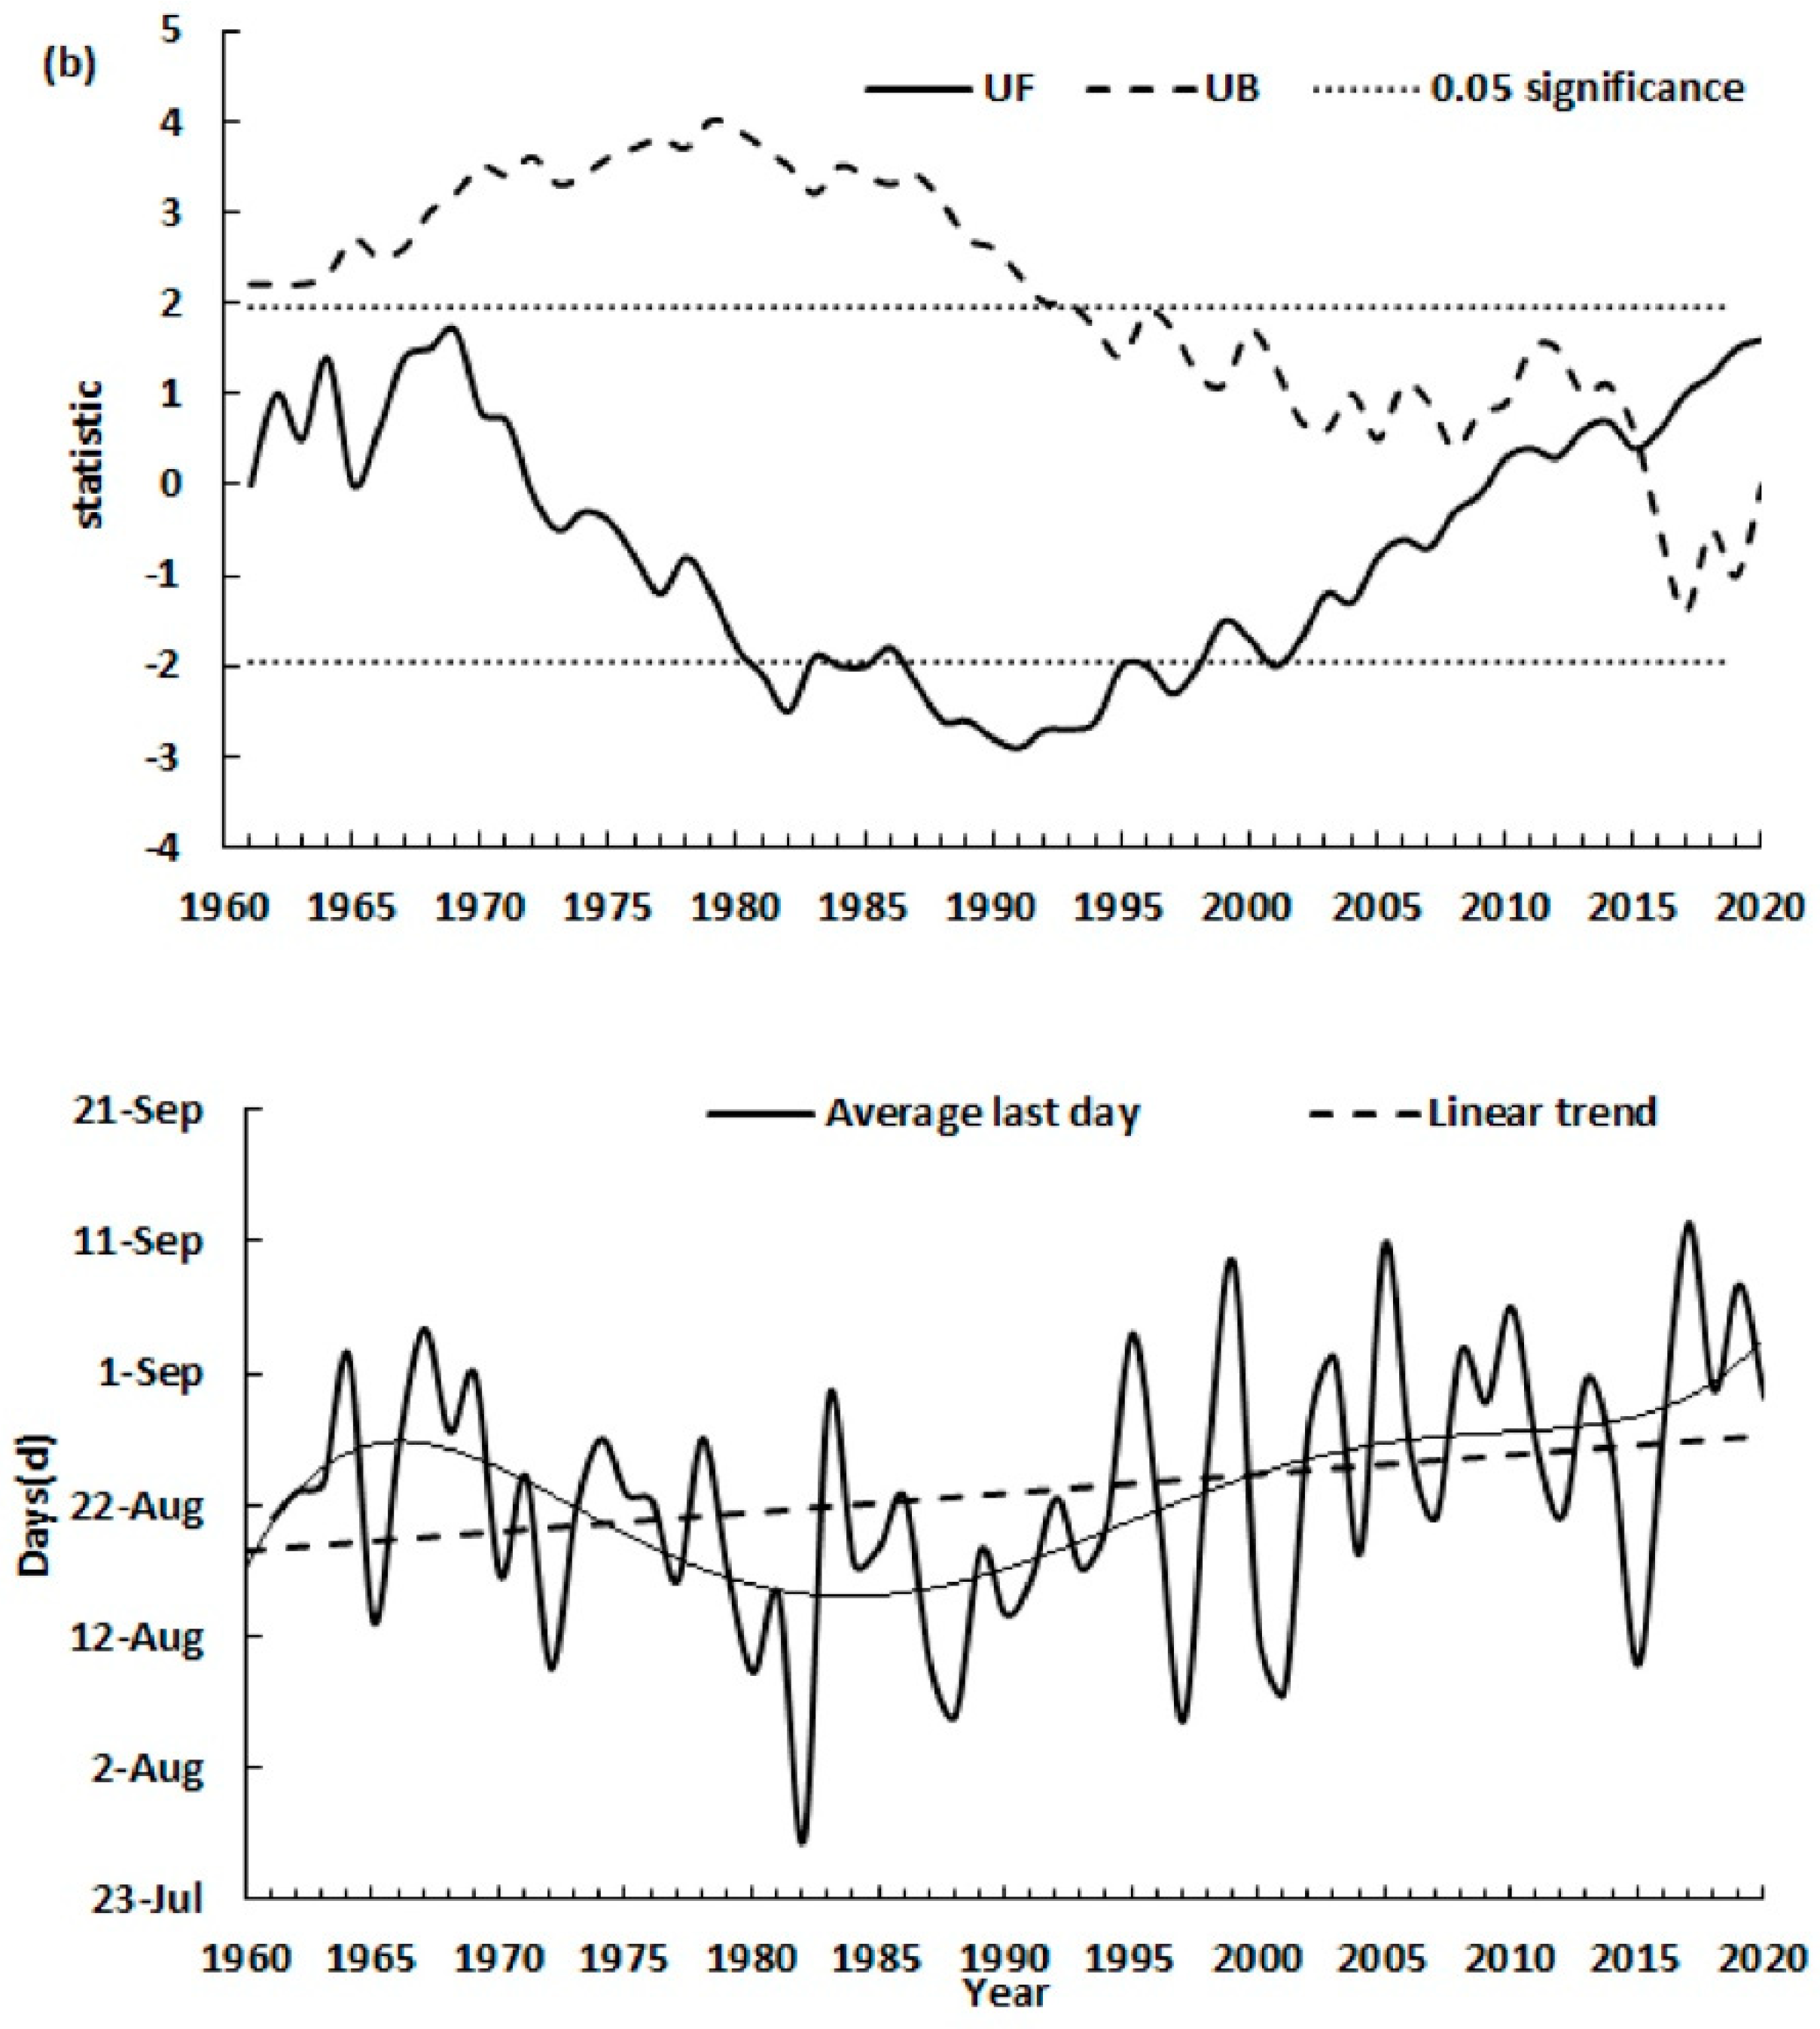
In the past 60 years in East China, the mean first EMTE day gradually advanced and the mean last EMTE day became delayed, especially in the 21st century. Over the study period, the mean first EMTE day advanced by 12 days and the mean last EMTE day became delayed by 7 days; the mean first EMTE day had a mutation in 2000 and the mean last EMTE day had a mutation in 2015.
(6)
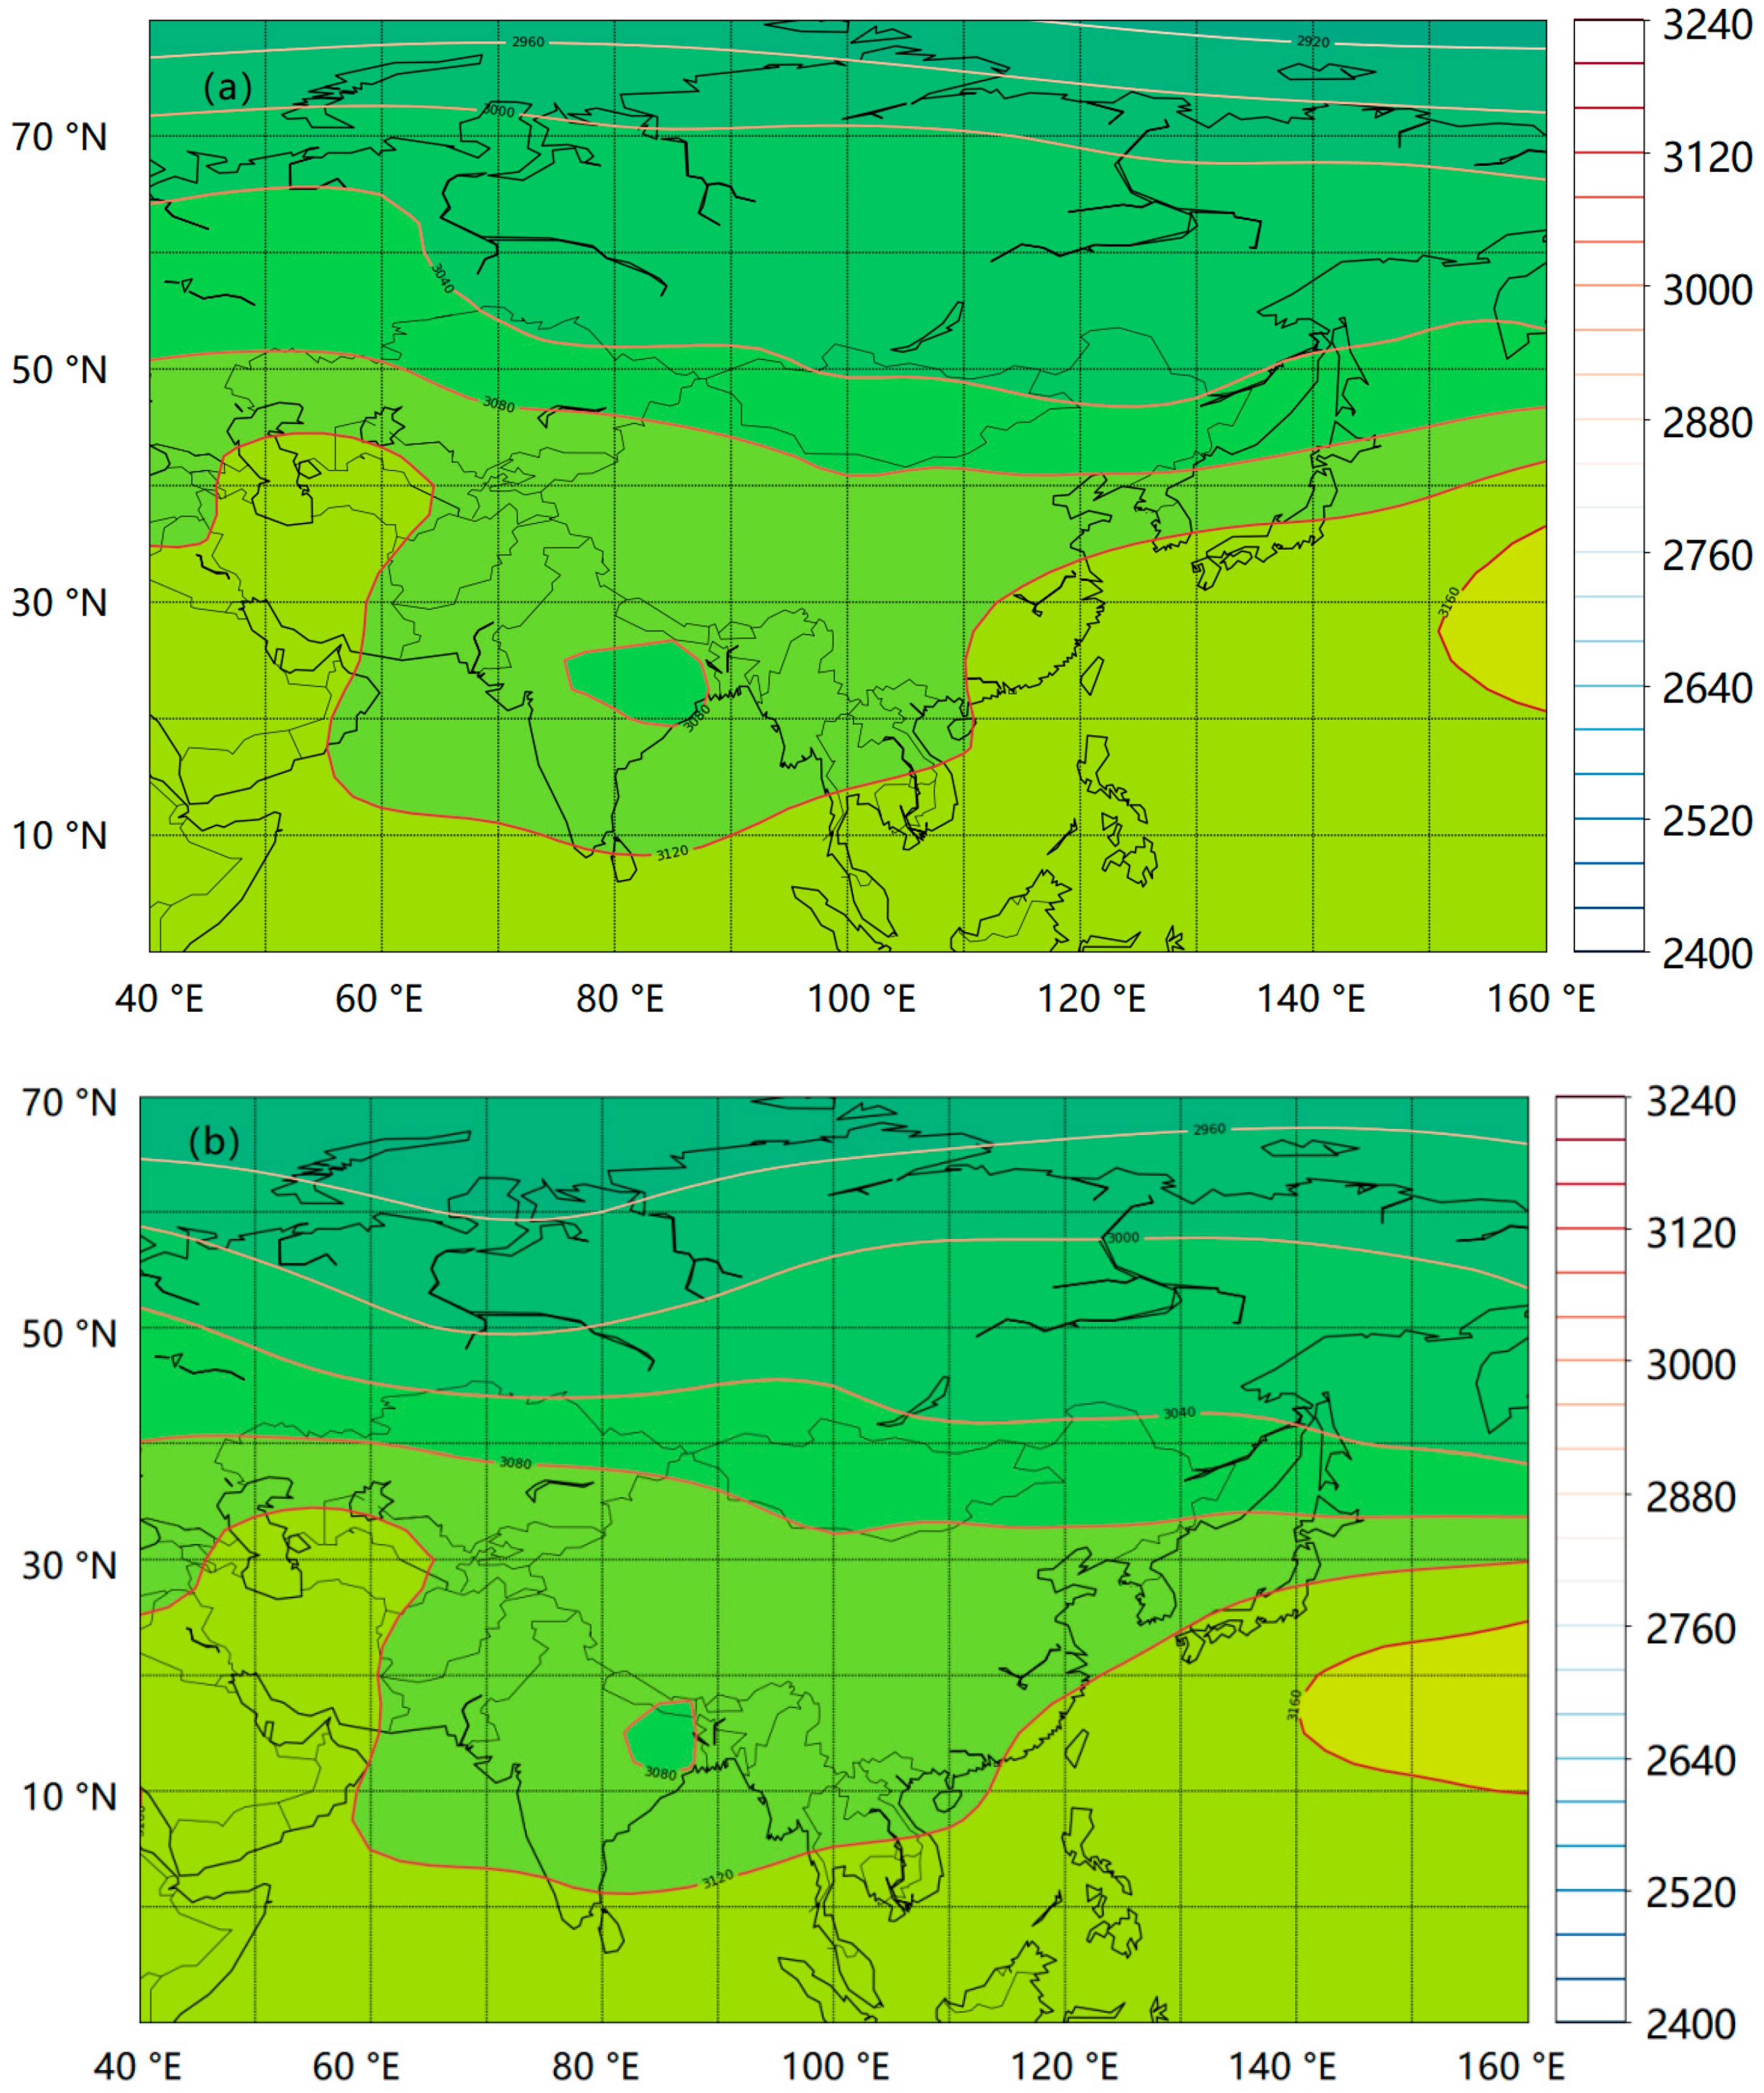
In East China, EMTEs are clearly related to the intensity and location of the subtropical high, western Pacific Subtropical high, South Asian high, and mid-latitude westerly trough. Extreme summer high temperatures occur in East China because the study region experiences atmospheric subsidence resulting from the intensification and westward extension of the subtropical high coupled with the weakening and northward displacement of the mid-latitude westerly trough.

Author Contributions

Conceptualization, M.Z. and J.H.; methodology, L.Z.; software, L.Z.; data curation, J.X.; writing—original draft preparation, J.H.; funding acquisition, M.Z. All authors have read and agreed to the published version of the manuscript.

Funding

This research was funded by the Natural Science Foundation of Jiangxi Province grant number (20202BABL203036).

Institutional Review Board Statement

Not applicable.

Informed Consent Statement

Informed consent was obtained from all subjects involved in the study.

Data Availability Statement

All data used in this study were provided by the China Meteorological Administration (http://data.cma.cn/, accessed on 15 March 2022). Direct requests for these materials may be made to the provider.

Acknowledgments

The authors would like to thank Shuixin Zhong of Institute of Tropical Marine Meteorology for helpful discussions on topics related to this work.

Conflicts of Interest

The authors declare no conflict of interest.

References

  1. IPCC. Climate Change 2021: The Physical Science Basis; Masson-Delmotte, V., Zhai, P., Pirani, A., Connors, S.L., Péan, C., Berger, S., Caud, N., Chen, Y., Goldfarb, L., Gomis, M.I., et al., Eds.; Contribution of Working Group Ι to the Sixth Assessment Report of the Intergovernmental Panel on Climate Change; Cambridge University Press: Cambridge, UK; New York, NY, USA, 2021. [Google Scholar]
  2. Ferrelli, F.; Brendel, A.S.; Perillo, G. Warming signals emerging from the analysis of daily changes in extreme temperature events over Pampas (Argentina). Environ. Earth Sci. 2021, 80, 1–13. [Google Scholar] [CrossRef]
  3. Vincent, L.A.; Mekis, É. Changes in Daily and Extreme Temperature and Precipitation Indices for Canada over the Twentieth Century. Atmos. Ocean. 2006, 44, 177–193. [Google Scholar] [CrossRef] [Green Version]
  4. Chao, L.; Huang, B.; Yuanjian, Y.; Jones, P.; Cheng, J.; Yang, Y.; Li, Q. A new evaluation of the role of urbanization to warming at various spatial scales: Evidence from the Guangdong-Hong Kong-Macau region, China. Geophys. Res. Lett. 2020, 47, e2020GL089152. [Google Scholar] [CrossRef]
  5. Shen, X.; Liu, B.; Jiang, M.; Lu, X. Marshland loss warms local land surface temperature in China. Geophys. Res. Lett. 2020, 47, e2020GL087648. [Google Scholar] [CrossRef] [Green Version]
  6. Feng, Y.; Li, G. Interaction between urbanization and eco-environment in the Tibetan Plateau. J. Geogr. Sci. 2021, 31, 298–324. [Google Scholar] [CrossRef]
  7. Ding, Y.; Ren, G. Climate Change Science in China; China Meteorological Press: Beijing, China, 2008; p. 281. [Google Scholar]
  8. Yang, X.; Ruby Leung, L.; Zhao, N.; Zhao, C.; Qian, Y.; Hu, K.; Chen, B. Contribution of urbanization to the increase of extreme heat events in an urban agglomeration in east China. Geophys. Res. Lett. 2017, 44, 6940–6950. [Google Scholar] [CrossRef]
  9. Shi, J.; Wei, P.P.; Cui, L.; Zhang, B. Spatio-temporal characteristics of extreme precipitation in East China from 1961 to 2015. Meteorol. Z. 2018, 27, 377–390. [Google Scholar] [CrossRef]
  10. Shi, J.; Wen, K.; Cui, L. Distribution and trend on consecutive days of severe weathers in China during 1959–2014. J. Geogr. Sci. 2016, 26, 658–672. [Google Scholar] [CrossRef] [Green Version]
  11. Shi, J.; Ding, Y.H.; Cui, L.L. Climatic characteristics and causes of extreme high temperature in East China. Atmos. Sci. 2009, 33, 347–358. [Google Scholar]
  12. Wang, Q.; Zhang, M.J.; Wang, S.J. Analysis of extreme temperature events in the Yangtze River Basin from 1962 to 2011. J. Geogr. 2013, 68, 611–625. [Google Scholar]
  13. Ju, L.L.; Shi, J.; Zhang, M. Extreme temperature changes over East China from 1961 to 2015. Desert Oasis Meteorol. 2020, 14, 112–121. [Google Scholar]
  14. Mao, Y.W.; Chen, Z.H.; Chen, Q.; Xie, P. Characteristics of extreme temperature indices in Wuhan from 1951 to 2016. Desert Oasis Meteorol. 2018, 12, 75–82. [Google Scholar]
  15. Zhu, X.; Ye, C.; Peng, J.; Cai, H.C. Variation characteristics of extreme temperature events in Hunan Province from 1960 to 2014. Desert Oasis Meteorol. 2016, 10, 82–89. [Google Scholar]
  16. Wu, L.; Chen, L.; Wang, K.; Ma, J. Temporal and Spatial Variation Characteristics of Annual Extreme Temperature in the Mainland of China During 1983–2012. J. Arid. Meteorol. 2016, 34, 945–951. [Google Scholar]
  17. Liang, M.; Wu, L. Characteristics analysis of Extreme High Temperature in Summer in Eastern China. Meteorol. Sci. 2015, 35, 701–709. [Google Scholar]
  18. Chen, Y.; Zhang, L.; Qian, H. Variation characteristics and regional differences of extreme high temperature days in South China during the last 53 years. Trop. Geography 2016, 36, 692–699. [Google Scholar]
  19. Ding, H.J.; Zhou, L.L.; Zha, B.; Zhai, G.Q. Analysis of abnormal high temperature in Summer 2003 in Jiangnan. J. Zhejiang Univ. Nat. Sci. 2007, 1, 100–105. [Google Scholar]
  20. Zeng, X.; Zhai, J.; Su, B.; Jiang, T.; Zhu, J. Temporal and spatial variation of annual mean temperature in the Yangtze River Basin. Resour. Environ. Yangtze Basin 2009, 18, 427–431. [Google Scholar]
  21. Zhang, S.; Yin, Z.; Liu, Y.; Wen, J.H.; Zhang, H.; An, Y.Z. Risk analysis of high temperature disaster in East China based on GIS. Disaster 2011, 26, 59–65. [Google Scholar]
  22. Dong, B.; Sutton, R.T.; Chen, W.; Liu, X.; Lu, R.; Sun, Y. Abrupt Summer Warming and Changes in Temperature Extremes over Northeast Asia Since the Mid-1990s: Drivers and Physical Processes. Adv. Atmos. Sci. 2016, 33, 1005–1023. [Google Scholar] [CrossRef] [Green Version]
  23. Shi, J.; Cui, L.; Wen, K.; Tian, Z.; Wei, P.; Zhang, B. Trends in the consecutive days of temperature and precipitation extremes in China during 1961–2015. Environ. Res. 2018, 161, 381–391. [Google Scholar] [CrossRef] [PubMed]
  24. Hu, K.; Huang, G.; Wu, R. A Strengthened Influence of ENSO on August High Temperature Extremes over the Southern Yangtze River Valley since the Late 1980s. J. Clim. 2013, 26, 2205–2221. [Google Scholar] [CrossRef] [Green Version]
  25. Ai-Hui, W.; Jian-Jian, F.U. Changes in Daily Climate Extremes of Observed Temperature and Precipitation in China. Atmos. Ocean. Sci. Lett. 2013, 6, 89–96. [Google Scholar] [CrossRef]
  26. Vincent, L.A.; Aguilar, E.; Saindou, M.; Hassane, A.F.; Jumaux, G.; Roy, D. Observed trends in indices of daily and extreme temperature and precipitation for the countries of the western Indian Ocean, 1961–2008. J. Geophys. Res. 2011, 116, D10. [Google Scholar] [CrossRef]
  27. Guan, Y.; Zhang, X.; Zheng, F.; Wang, B. Trends and variability of daily temperature extremes during 1960–2012 in the Yangtze River Basin, China. Int. J. Climatol. 2015, 124, 79–94. [Google Scholar] [CrossRef] [Green Version]
  28. Niu, Z.; Wang, L.; Fang, L.; Li, J.; Yao, R. Analysis of spatiotemporal variability in temperature extremes in the Yellow and Yangtze River basins during 1961–2014 based on high-density gauge observations. Int. J. Climatol. 2020, 40, 1–21. [Google Scholar] [CrossRef]
  29. Zhang, S.Y.; Wang, S.R.; Zhang, Y.S.; Zhang, D.K.; Song, Y.L. The climatic character of high temperature and the prediction in the large cities of east of China. J. Tropical Meteor. 2004, 20, 750–760. [Google Scholar]
  30. Plackett R, L. Studies in the History of Probability and Statistics. XXIX: The Discovery of the Method of Least Squares. Biometrika 1972, 59, 239–251. [Google Scholar] [CrossRef]
  31. Milliken, G.A.; Bates, D.M.; Watts, D.G. Nonlinear Regression Analysis and Its Applications. Technometrics 1988, 32, 219. [Google Scholar] [CrossRef]
  32. Wu, J.; Wu, J.; Huang, W.; Yao, L.N.; Lei, Z.C. Variation characteristics of Extreme temperature in East China in recent 50 years. Hubei Agric. Sci. 2020, 60, 96–100, 114. [Google Scholar]
  33. Lei, Y.; Gong, D.; Zhang, Z.; Guo, D.; He, X.Y. Temporal and spatial variation of summer high temperature days and their circulation background in China. Geogr. Res. 2009, 28, 653–662. [Google Scholar]
  34. Yin, J.; J, M.; Xiao, A.; Zhang, Y. Characteristics and Forecasting methods of Subtropical high during Summer High Temperature in Jiangxi province. Meteorol. Disaster Reduct. Res. 2011, 34, 19–25. [Google Scholar]
  35. Sun, J.; Wang, H.; Yuan, W. Interdecadal Variation of Extreme High Temperature Events in China and their Relationship with Atmospheric Circulation. Clim. Environ. Res. 2011, 16, 199–208. [Google Scholar]
  36. Wang, W.; Xu, J.; Cai, X.; Sun, C. Analysis of atmospheric circulation characteristics and mechanism of heat wave and drought in summer of 2013 over the middle and lower reaches of Yangtze River Basin. Plateau Meteorol. 2017, 36, 1595–1607. [Google Scholar]
  37. Shi, J.; Cui, L.; Zhou, W. Analysis of atmospheric Circulation characteristics during high Temperature period in East China. J. Trop. Meteorol. 2009, 25, 753–759. [Google Scholar]
  38. Zou, H.; Wu, S.S.; Shan, J.S.; Wang, S. Diagnostic study of the severe high temperature event over Mid-East China in 2013 summer. Acta Meteorol. Sin. 2015, 73, 481–495. [Google Scholar]
  39. Li, Z.H.; Li, C.Y.; Song, J.; Tan, Y.; Li, X. An analysis of the characteristics and causes of extremely high temperature days in the Yangtze–Huaihe River basins in summer 1960–2011. Clim. Environ. Res. 2015, 20, 511–522. [Google Scholar]
  40. Yin, J.; Zhang, C.J.; Zhang, C.M. Clmiatic Diagnostic Analysis of the Exceptional High Temperature in Summer 2003 in Jiangxi Province. J. Nanjing Inst. Meteorol. 2005, 6, 855–861. [Google Scholar]
  41. Lin, X.; Guan, Z.Y. Temporal and spatial characteristics and interannual variation of summer high Temperature in East China. J. Nanjing Inst. Meteorol. 2008, 31, 1–9. [Google Scholar]
  42. Peng, X.; Guo, B.Y.; Wei, N.; She, Q.N.; Liu, M.; Xiang, W.N. Characteristics of extreme heat events variations and their response to urbanization in Yangtze river delta region in recent sixty years. Resour. Environ. Yangtze Basin 2016, 25, 1917–1926. [Google Scholar]
  43. Zhang, L.; Ren, G.Y.; Miao, S.G.; Zhang, A.Y.; Meng, F.C.; Zhu, S.C.; Ren, Y.Y.; Suo, N.K.Z. Numerical Simulation of Urbanization on a Single extreme high Temperature process in Beijing. Chin. J. Atmos. Sci. 2020, 44, 1093–1108. [Google Scholar]
  44. Ao, X.Y.; Tan, J.G.; Zhi, X.; Guo, Q.B.; Lu, Y.W.; Liu, D.W. Synergistic effect of urban Heat Island and heat wave in Shanghai and its influencing factors. Acta Geogr. Sin. 2019, 74, 1789–1802. [Google Scholar]
  45. Mitchell, J.M.J. The thermal climate of Cities. Public Health Serv. 1961, 62, 131–145. [Google Scholar]
  46. Oke, T.R. City size and the urban heat islands. Atmos. Environ. 1973, 7, 769–779. [Google Scholar] [CrossRef]
Figure 1. Elevation and geographical location of East China.
Atmosphere 13 00609 g001
Figure 2. Distribution of the selected meteorological stations in East China.
Atmosphere 13 00609 g002
Figure 3. Interannual variation in the annual number of extreme maximum temperature event (EMTE) days in East China during the period 1961–2020 (red dashed line indicates the decadal mean).
Atmosphere 13 00609 g003
Figure 4. Climate tendency rate and significant variation distribution of the annual number of EMTE days in East China during the period 1961–2020.
Atmosphere 13 00609 g004
Figure 5. Interannual variation in mean extreme maximum temperature in East China during the period 1961–2020.
Atmosphere 13 00609 g005
Figure 6. Climate tendency rate and significant variation in East China during the period 1961–2020.
Atmosphere 13 00609 g006
Figure 7. Years of occurrence of maximum extreme maximum temperature event intensity in East China during the period 1961–2020.
Atmosphere 13 00609 g007
Figure 8. (a) Mean maximum consecutive extreme maximum temperature event days, and (b) climate tendency rate and significant variation distribution of these days in East China during the period 1961–2020.
Atmosphere 13 00609 g008
Figure 9. Variation trend and Mann–Kendall calculation of the mean (a) first and (b) last extreme maximum temperature event days in East China during the period 1961–2020.
Atmosphere 13 00609 g009aAtmosphere 13 00609 g009b
Figure 10. Distribution of the climate tendency rate of the mean (a) first and (b) last extreme maximum temperature event days in East China during the period 1961–2020.
Atmosphere 13 00609 g010
Figure 11. Calculated mean 500-hPa height field (geopotential) in July in typical years with (a) more and (b) fewer EMTEs in East China.
Atmosphere 13 00609 g011
Figure 12. Average 700 hpa height field in a typical high-temperature year in July in East China with (a) more and (b) fewer EMTEs in East China.
Atmosphere 13 00609 g012
Table 1. Mann–Kendall test of annual number of extreme maximum temperature event days.
Mutation YearSlope (d/10a)
2009Premutation slope (Before 2009)Post-mutation slope (After 2009)
0.42.8
Table 2. Mann–Kendall test of maximum consecutive extreme maximum temperature event (EMTE).
Mutation YearSlope (d/10a)
Earliest year of mutationLast year of mutationmean year of mutationPremutation slope (Before 2003)Post-mutation slope (After 2003)
1977200920030.41.4
Publisher’s Note: MDPI stays neutral with regard to jurisdictional claims in published maps and institutional affiliations.

