Article

Research on the Spatial Heterogeneity and Influencing Factors of Air Pollution: A Case Study in Shijiazhuang, China

School of Architecture, Tianjin University, Tianjin 300072, China
*
Authors to whom correspondence should be addressed.
Atmosphere 2022, 13(5), 670; https://doi.org/10.3390/atmos13050670
Submission received: 15 March 2022 / Revised: 14 April 2022 / Accepted: 20 April 2022 / Published: 22 April 2022

Abstract

:
Rapid urbanization causes serious air pollution and constrains the sustainable development of society. The influencing factors of urban air pollution are complex and diverse. Multiple factors act together to interact in influencing air pollution. However, most of the existing studies on the influencing factors of air pollution lack consideration of the interaction mechanisms between the factors. Using multisource data and geographical detectors, this study analyzed the spatial heterogeneity characteristics of air pollution in Shijiazhuang City, identified its main influencing factors, and analyzed the interaction effects among these factors. The results of spatial heterogeneity analysis indicate that the distribution of aerosol optical depth (AOD) has obvious agglomeration characteristics. High agglomeration areas are concentrated in the eastern plain areas, and low agglomeration areas are concentrated in the western mountainous areas. Forests (q = 0.620), slopes (q = 0.616), elevation (q = 0.579), grasslands (q = 0.534), and artificial surfaces (q = 0.506) are the main individual factors affecting AOD distribution. Among them, natural factors such as topography, ecological space, and wind speed are negatively correlated with AOD values, whereas the opposite is true for human factors such as roads, artificial surfaces, and population. Each factor can barely affect the air pollution status significantly alone, and the explanatory power of all influencing factors showed an improvement through the two-factor enhanced interaction. The associations of elevation ∩ artificial surface (q = 0.625), elevation ∩ NDVI (q = 0.622), and elevation ∩ grassland (q = 0.620) exhibited a high explanatory power on AOD value distribution, suggesting that the combination of multiple factors such as low altitude, high building density, and sparse vegetation can lead to higher AOD values. These results are conducive to the understanding of the air pollution status and its influencing factors, and in future, decision makers should adopt different strategies, as follows: (1) high-density built-up areas should be considered as the key areas of pollution control, and (2) a single-factor pollution control strategy should be avoided, and a multi-factor synergistic optimization strategy should be adopted to take full advantage of the interaction among the factors to address the air pollution problem more effectively.

1. Introduction

As urbanization accelerates, air pollution increasingly poses severe challenges to ecosystems and has become a difficult issue for global governance [1]. The development of urbanization and economic growth in China has led to the emergence of various environmental pollution problems, among which air pollution is prominent [2,3]. Studies have shown that air pollution harms health, causes premature death [4,5], creates substantial economic losses, and restricts sustainable social development [6,7]; thus, it attracts widespread attention [8], with the focus of research on the state of air pollution and responses to it [9]. Studies suggest that the influencing factors of urban air pollution are complex and diverse [10].
First, in terms of influencing factor research, existing studies show that in addition to pollution sources [11,12], human factors such as the distribution of built environment factors [13,14,15], industrial distribution [16], energy consumption [17], and social economy [16,18], and natural factors such as terrain [19], wind speed [20], and ecological space [21] are all important factors, and multiple factors interact to affect the air pollution state [22]. At present, further research on the influencing factors and mechanisms of urban air pollution is needed because relevant factors for planning and construction are not adequately considered [20]; the interaction mechanism among factors also needs to be studied further [23,24].
Second, in terms of research methodology, the methods commonly applied in the existing studies mainly included factor analysis and dynamic factor analysis (DFA) [25,26], principal component analysis [27], extreme boundary analysis [28], the spatial Durbin model [29], spatial lag model and spatial error model [30], land use regression (LUR) [31], and the LMDI decomposition model [32]. These statistical quantitative methods were effective in identifying the explanatory power of individual factors on air pollution, but most of them ignored the local effects of the influencing factors and interactive effects of multiple factors [24,33]. Spatial autocorrelation analysis, geographically weighted regression [33], and the Bayesian space-time hierarchy model (BSTHM) [34,35] addressed the ignoring of the local effects, but were not able to analyze the interactive effects of multiple factors. Geodetector is a good method of spatial statistics for detecting and attributing spatial stratified heterogeneity [36], and it is capable of quantitatively determining the explanatory power of individual factors and two-factor interactions [37], analyzing the interaction among factors, and revealing complex relationships among factors, which is more reliable and informative than traditional methods [33].
As an important city in the Beijing-Tianjin-Hebei (BTH) region of China, Shijiazhuang City enjoys rapid economic growth coupled with increasing environmental pressure and prominent air pollution problems [38] and ranks at the bottom of the national urban air quality ranking year-round [39]. Shijiazhuang City is representative and typical in the BTH region in terms of its degree of urbanization and industrialization, as well as the severity of air pollution. Moreover, the BTH region where Shijiazhuang is located is an important core region in China and the focus of air pollution research [40,41,42]. Despite numerous previous studies, air pollution prevention and control are still major problems restricting regional sustainable development, and technological bottlenecks still need to be overcome [43]. Therefore, this study selected Shijiazhuang City as the research area. Using Geodetector, the main influencing factors of air pollution were identified, and the interaction mechanism of each factor was analyzed, providing scientific support for the regulation of spatial factor layout and optimization of air safety patterns in typical heavily polluted cities such as Shijiazhuang.

2. Materials and Methods
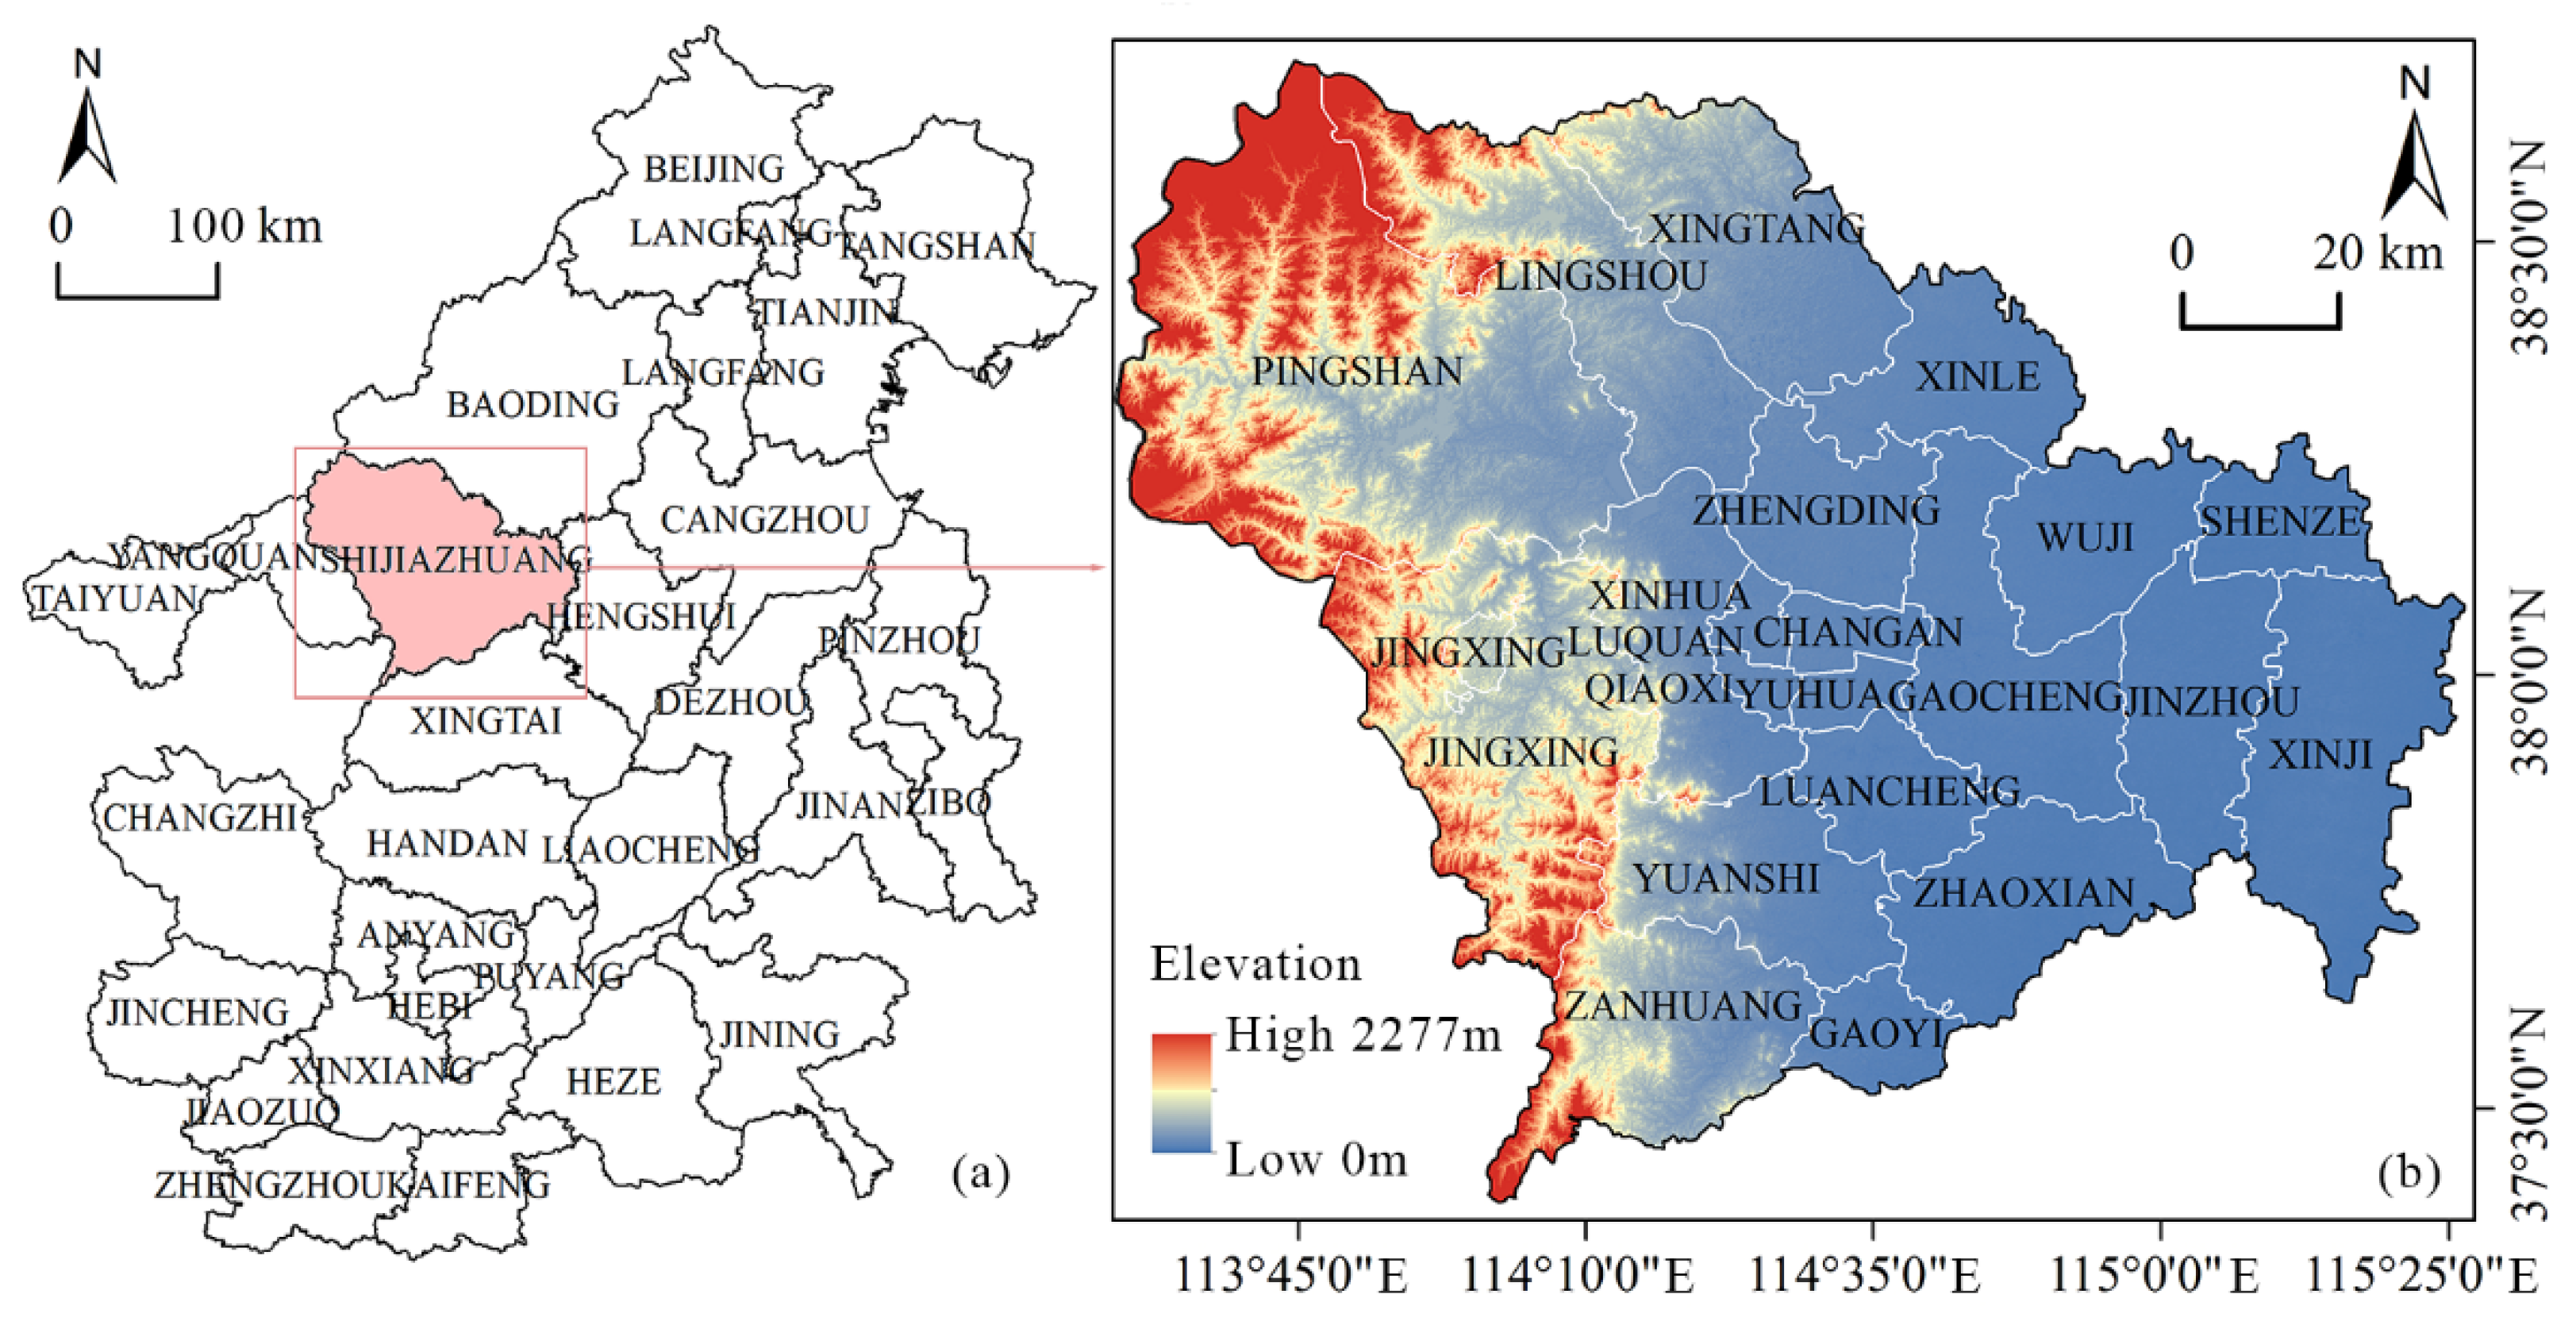
2.1. Study Area

Shijiazhuang City (Figure 1, latitude and longitude: 37°27′ to 38°47′ N, 113°30′ to 115°20′ E) is elevated in the west and low in the east, containing the middle section of Taihang Mountain in the west and the Hutuo River plain in the east, and has a calm wind frequency of 28%. As one of the most important industrial cities in the Beijing-Tianjin-Hebei region, Shijiazhuang is rich in energy and mineral resources, and has developed an industrial economy and a high level of urbanization, but the problem of “soot” air pollution is prominent. According to the Action Plan for Comprehensive Treatment of Air Pollution in Beijing-Tianjin-Hebei Region and Surrounding Areas in 2019–2020 Autumn and Winter Period of the Ministry of Environmental Protection, twenty-eight cities, including Beijing, Tianjin, and Shijiazhuang, have been designated as air pollution transmission channels in the Beijing-Tianjin-Hebei region (“2 + 26 cities”). Not only is this area important for air pollution control, it also is a core area in China, due to its dense population and developed economy. Shijiazhuang is a typical heavily polluted city in this area. As a result of a large number of policies and measures launched by the government, air pollution in the region has improved in recent years, but the air quality of Shijiazhuang is still the worst in the region and is in urgent need of improvement.

2.2. Data and Preprocessing

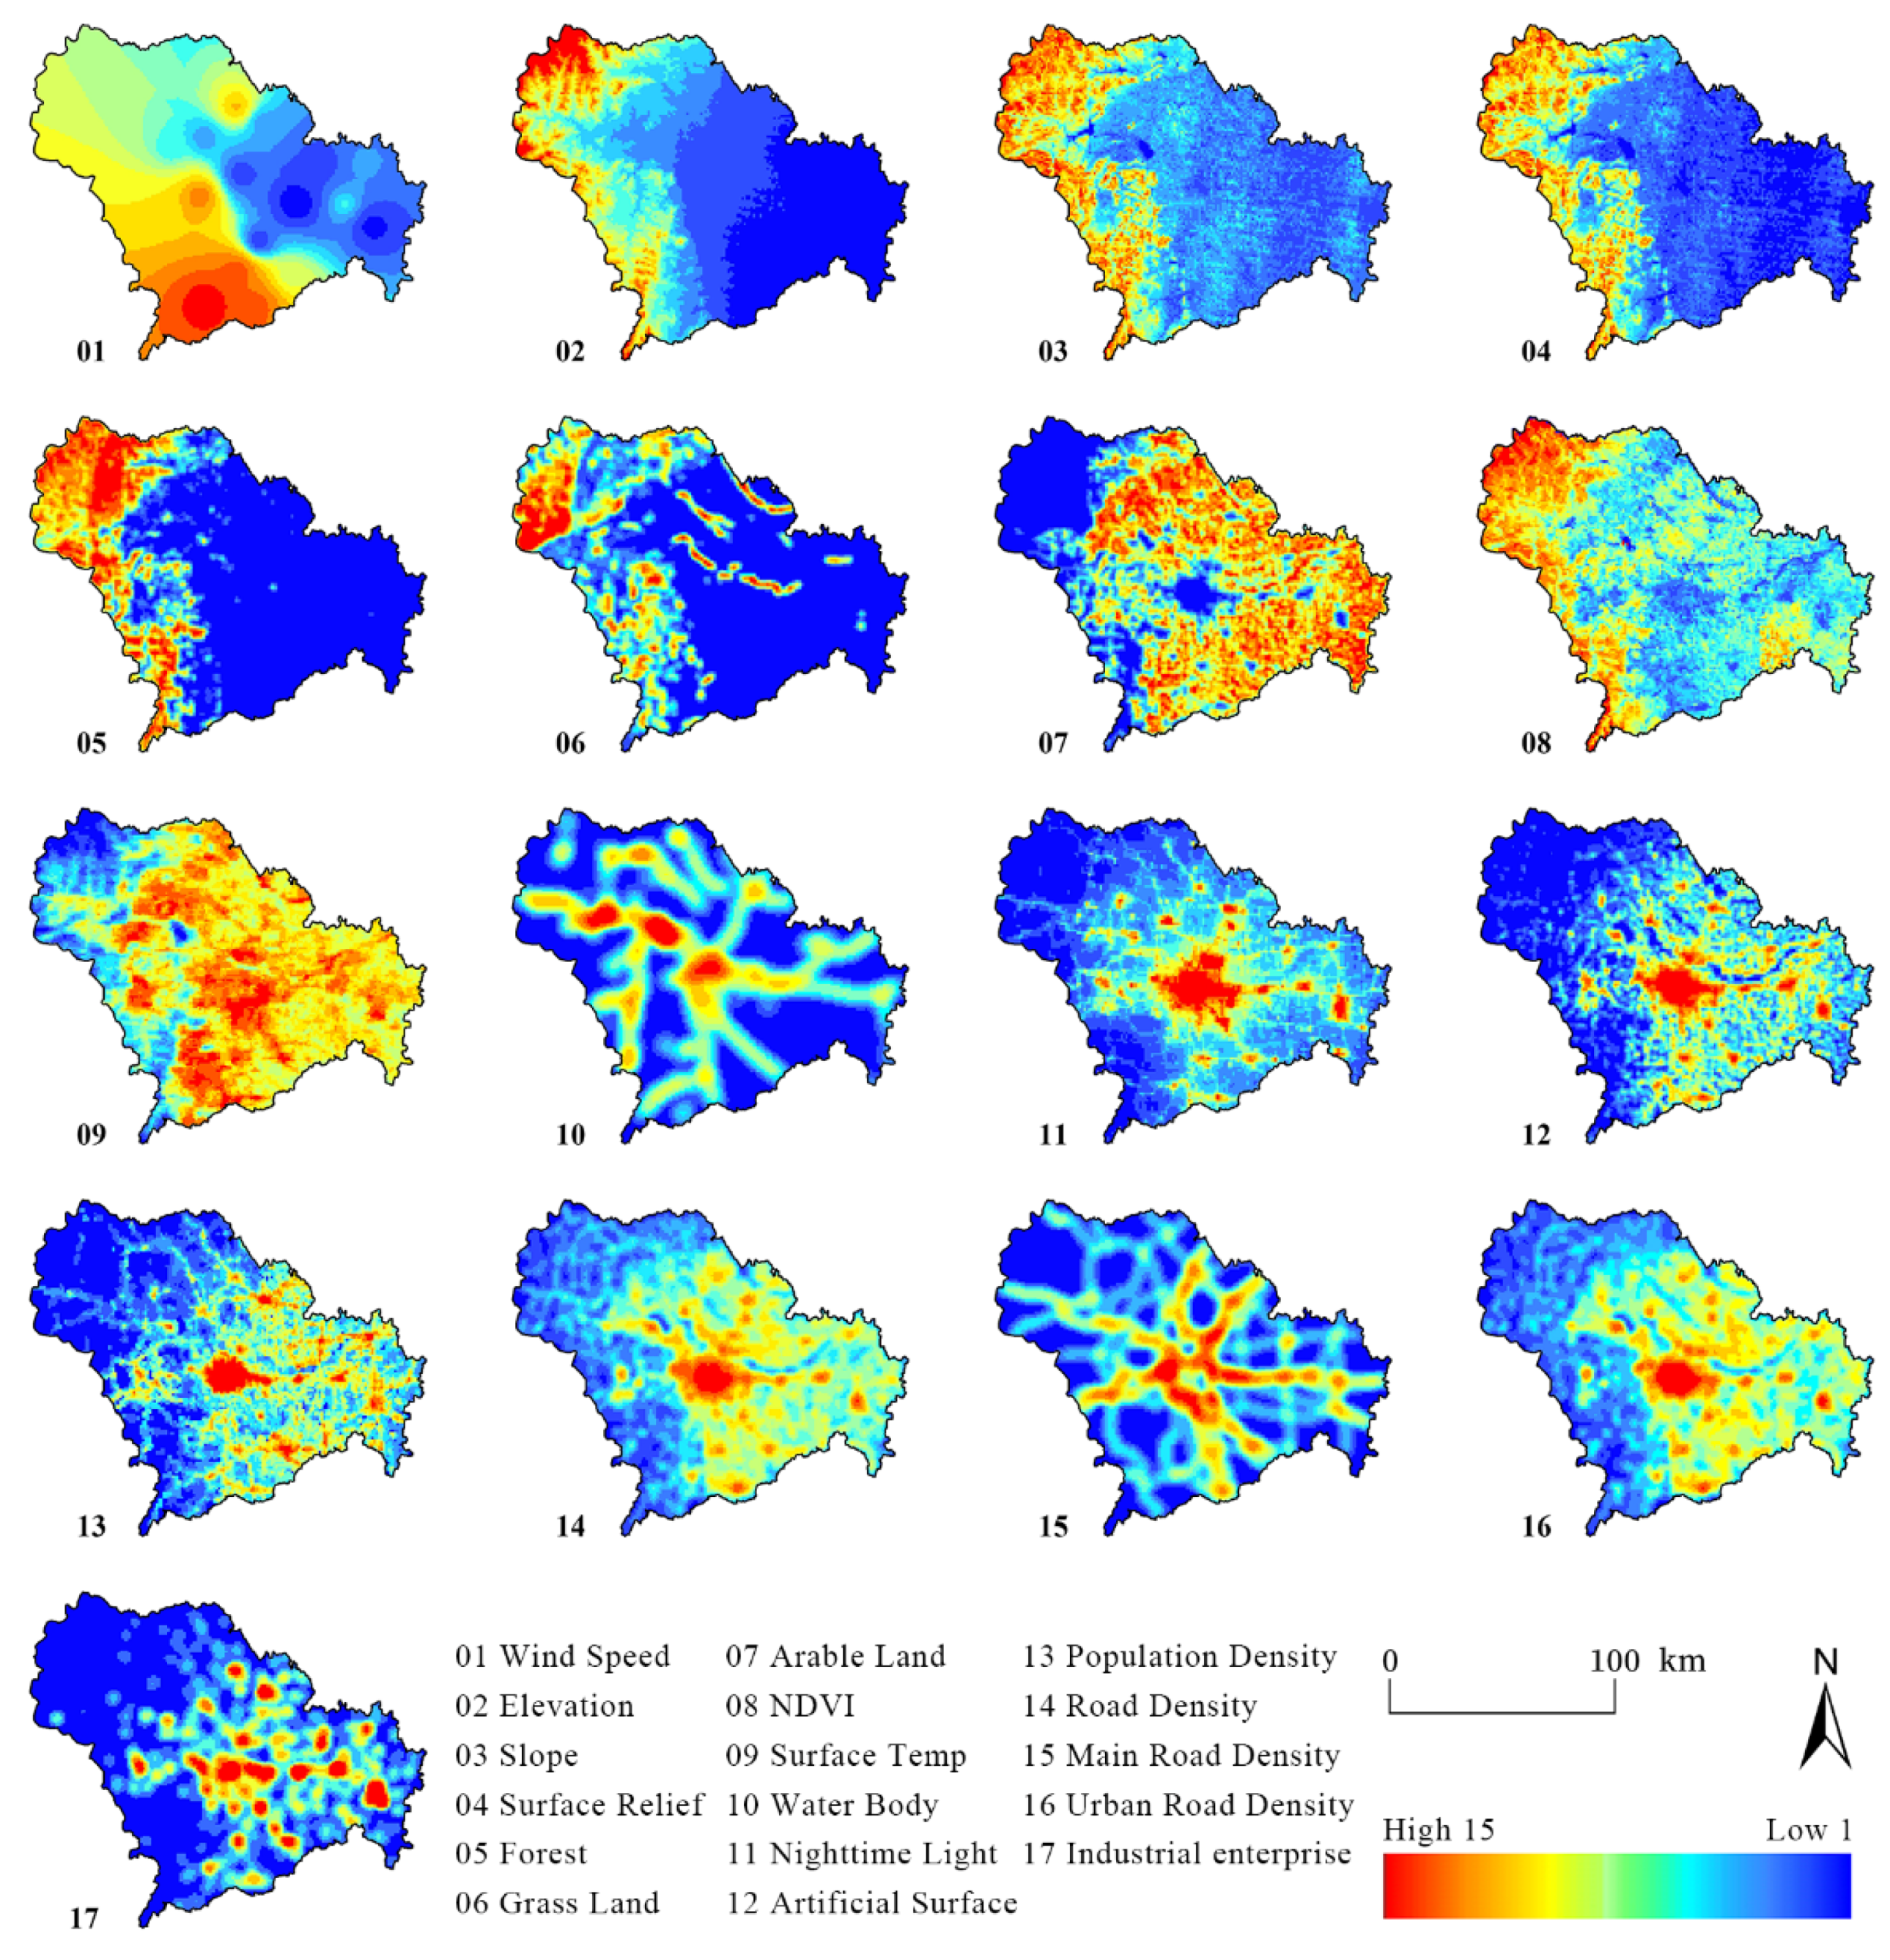
2.2.1. Data Resources

In order to ensure the representativeness and accuracy of the selected influencing factors in this study, we screened for various natural and human factors by summarizing the influencing factors analyzed in existing studies [13,14,15,19,20,21] and considering the accessibility of data. On this basis, 17 natural and human factors were selected for this study.
Among them, nature factors included wind speed, elevation, slope, surface relief, forest, grassland, arable land, normalized difference vegetation index (NDVI), surface temperature, and water bodies. Human factors include nighttime light, artificial surface, population density, road density, main road density, urban road density, and industrial enterprise distribution. All data were acquired in 2020 and adopted the CGS2000 coordinate system uniformly. The data included:
  • Data related to natural factors: air pollution data were the annual average AOD numerical raster data calculated from the inversion of 2020 MCD19A2 remote sensing data, with a data resolution of 1 km. Wind speed monitoring data came from the China Meteorological Data Service Data Center (http://data.cma.cn, accessed on 1 March 2021), and the average annual wind speed and wind direction data of 17 meteorological monitoring stations in Shijiazhuang were calculated. LST data were derived from the annual average LST raster data calculated from the inversion of 2020 MYD11A2 remote sensing data with a data resolution of 1 km. ASTER GDEM 30 M data came from the Geospatial Data Cloud platform of the Computer Network Information Center of the Chinese Academy of Sciences (http://www.gscloud.cn, accessed on 1 March 2021). The forest, grassland, cultivated land, and artificial land data were from a land cover dataset of GlobeLand30 (National Catalog Service for Geographic Information: http://www.webmap.cn, accessed on 1 March 2021), with a data resolution of 30 m. The data were evaluated by the Aerospace Information Research Institute of the Chinese Academy of Sciences for accuracy and had an overall accuracy of 85.72% and high reliability. Vector data of river systems were obtained from the National Geomatics Center of China (http://www.ngcc.cn/ngcc, accessed on 1 March 2021).
  • Data related to human factors: Population distribution data came from WorldPop, an open spatial demographic data and research program (https://www.worldpop.org/, accessed on 1 March 2021), with a data resolution of 100 m. Point of interest (POI) data of industrial enterprises and building contour and height data came from Amap API (https://lbs.amap.com/, accessed on 1 March 2021) with high accuracy. Road traffic vector data came from the National Geomatics Center of China (http://www.ngcc.cn/ngcc/, accessed on 1 March 2021) and the Open Street Map (https://www.openstreetmap.org/, accessed on 1 March 2021). In this study, the road vector data were processed into three types of road density factors using the line density analysis tool of ArcGIS. Among them, the total road density includes all urban and regional roads, the main road density includes regional roads such as highways, and the urban road density includes all levels of city roads. The nighttime light data were from the Nighttime-Light Dataset of the Chinese Academy of Sciences (Flint), calculated and generated based on Suomi NPP VIIRS night light remote sensing data, with a resolution of 500 m. The nighttime light data were widely used to reflect the distribution of population and economic activity; the brighter the lights, the more developed the economy.

2.2.2. Preprocessing

The IDL programming of ENVI10.3 was used to process and retrieve the daily MCD19A2 MODIS remote sensing images of Shijiazhuang for 2020 using the MCTK data processing tool. To prevent the influence of missing pixels caused by rain and clouds, effective pixels of all locations were accumulated after excluding the missing pixels to calculate the average annual AOD and obtain the annual air pollution conditions (Figure 2). With the aid of the ArcGIS10.8 platform, the annual county-level meteorological monitoring data of Shijiazhuang were calculated by means of the inverse distance weight (IDW) method to obtain the interpolation results of the annual wind speed monitoring data. Fishnet was used to create a grid with a side length of 1000 m to divide Shijiazhuang into 13,995 subregions, and the mean values of aerosol raster data in the subregions were calculated for geographical detector analysis.
The ENVI and ArcGIS (ESRI, Redlands, CA, USA) tools were used to reprocess the data, such as for calculating the kernel density of factors. Based on the grid, the mean values of each variable in the subregion were calculated, normalized, and reclassified. After comparison, the geometric interval method was selected for reclassification. Continuous numerical data of independent variables were uniformly processed into data with standardized values within the range of 1–15 for geographical detector analysis so that the results of the subregion mean standardized classification of 17 factors were obtained (Figure 3). To obtain the matching data from each variable for geographical detection, sampling points were set according to the grid (1 km × 1 km), and the values of each variable in the subregion were extracted to obtain data for geographical detection.

2.3. Methods

For Shijiazhuang City, ENVI and ArcGIS were used to invert and interpolate MODIS remote sensing data and wind speed monitoring data to obtain the distribution of aerosol optical thickness in the city. Using status data, spatial agglomeration characteristics of air pollution were analyzed with spatial autocorrelation analysis, clustering and hotspot analysis, and spatial heterogeneity characteristics of air pollution were analyzed with hotspot analysis (Getis–ORD Gi*). In addition, statistical tools such as Geodetector were used to calculate the composition of influencing factors of urban air pollution, and the interaction mechanism among factors was also analyzed. Urban spatial optimization strategies were proposed based on these detection results.
Hotspot analysis was performed on Getis–Ord Gi* statistics for the values of all locations in the region, and z scores and p values were obtained to determine the spatial clustering location of high-value or low-value factors. The location with high-value attributes that was surrounded by other locations with high-value attributes was a hotspot with statistical significance. The formula of the Getis–Ord local statistics is:
G i * = j = 1 n w i , j x j X ¯ j = 1 n w i , j S [ n j = 1 n w i , j 2 ( j = 1 n w i , j ) 2 ] n 1
X ¯ = j = 1 n x j n ;   S = j = 1 n x j 2 n ( X ¯ ) 2
The geographical detector is a statistical method used to detect spatial heterogeneity with multiple factors and reveal the influencing factors and driving forces of spatial heterogeneity, and it has been widely used in studying the source and influencing factors of pollution and other disaster risks [36]. By obtaining the value of q, this method can measure the significance of each spatial heterogeneity factor and detect the explanatory power of independent variables on dependent variables [36]. The formula is:
q = 1 h = 1 L N h σ h 2 N σ 2 = 1 S S W S S T
S S W = h = 1 L N h σ h 2 ;   S S T = N σ 2
where L is the layer of dependent variable Y or independent variable X; Nh and N are layer h and the total number of units, respectively; σ h 2 and σ2 are the variances of layer h and the Y value of the whole region, respectively; and SSW and SST are the variance within the layer and the total variance of the whole region. Among them, the value range of q is [0, 1], and the larger the value, the more significant the spatial heterogeneity of Y and the stronger the explanatory power of X on Y. Furthermore, the interaction relationship among independent variables can be analyzed by calculating the q value after independent variables interact in pairs [36].

3. Results

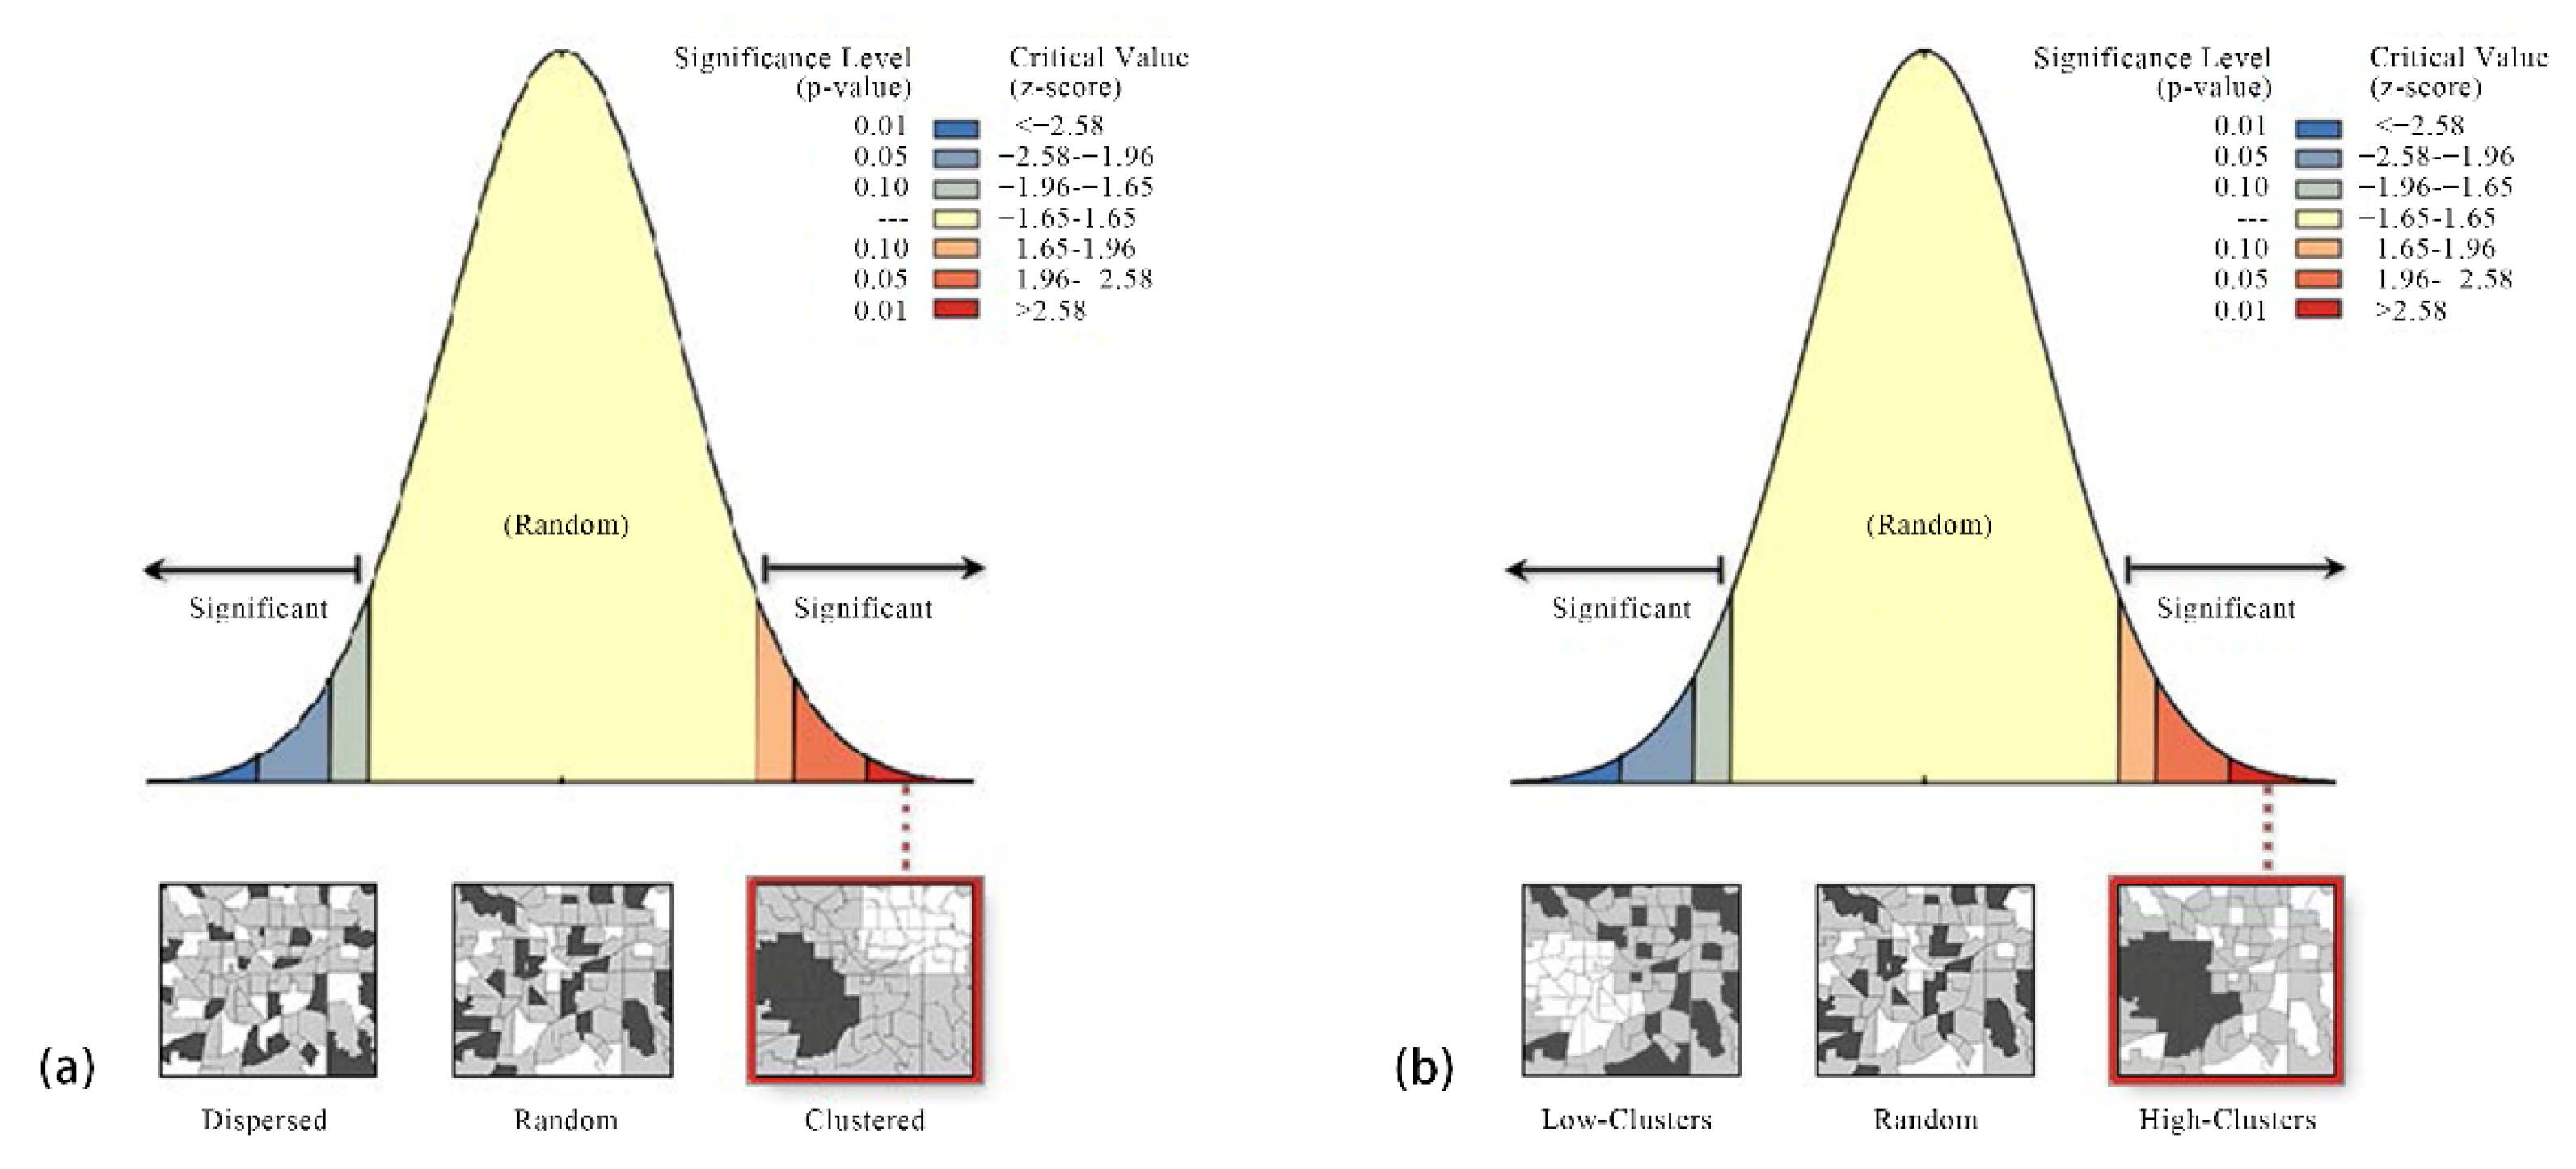
3.1. Analysis of the Spatial Heterogeneity Characteristics of Air Pollution in Shijiazhuang

The study used spatial autocorrelation analysis, clustering analysis, and hotspot analysis to analyze both the spatial agglomeration characteristics of air pollution and the hot and cold spots of air pollution in Shijiazhuang and then extracted the heavily polluted areas. The basic characteristics of the spatial distribution of air pollution in Shijiazhuang were thus obtained. The results of spatial autocorrelation analysis (Figure 4, Table 1) show that there is a significant agglomeration of air pollution in Shijiazhuang, and the specific nature of agglomeration presents a significant high-value agglomeration.
This suggests that areas with high levels of air pollution are spatially concentrated and, therefore, the reduction in air pollution risk in these parts is particularly significant in reducing the overall air pollution risk. Therefore, these areas should be considered as key areas for air pollution risk management.
The results of clustering and outlier analysis (Anselin Local Moran) and hotspot analysis (Getis–ORD Gi*) show that (Figure 5) air pollution in Shijiazhuang has significant spatial heterogeneity characteristics, high in the east and low in the west; that is, the air pollution is high in the eastern plain and low in the western Taihang Mountains. Pollution hotspots are concentrated in the eastern plain area and counties, while the cold spots are concentrated in the mountainous area and counties, except for the Jingxing mining area. Hotspot areas are highly concentrated, with spatial heterogeneity characteristics coupled with urban construction intensity and industrial development degree.

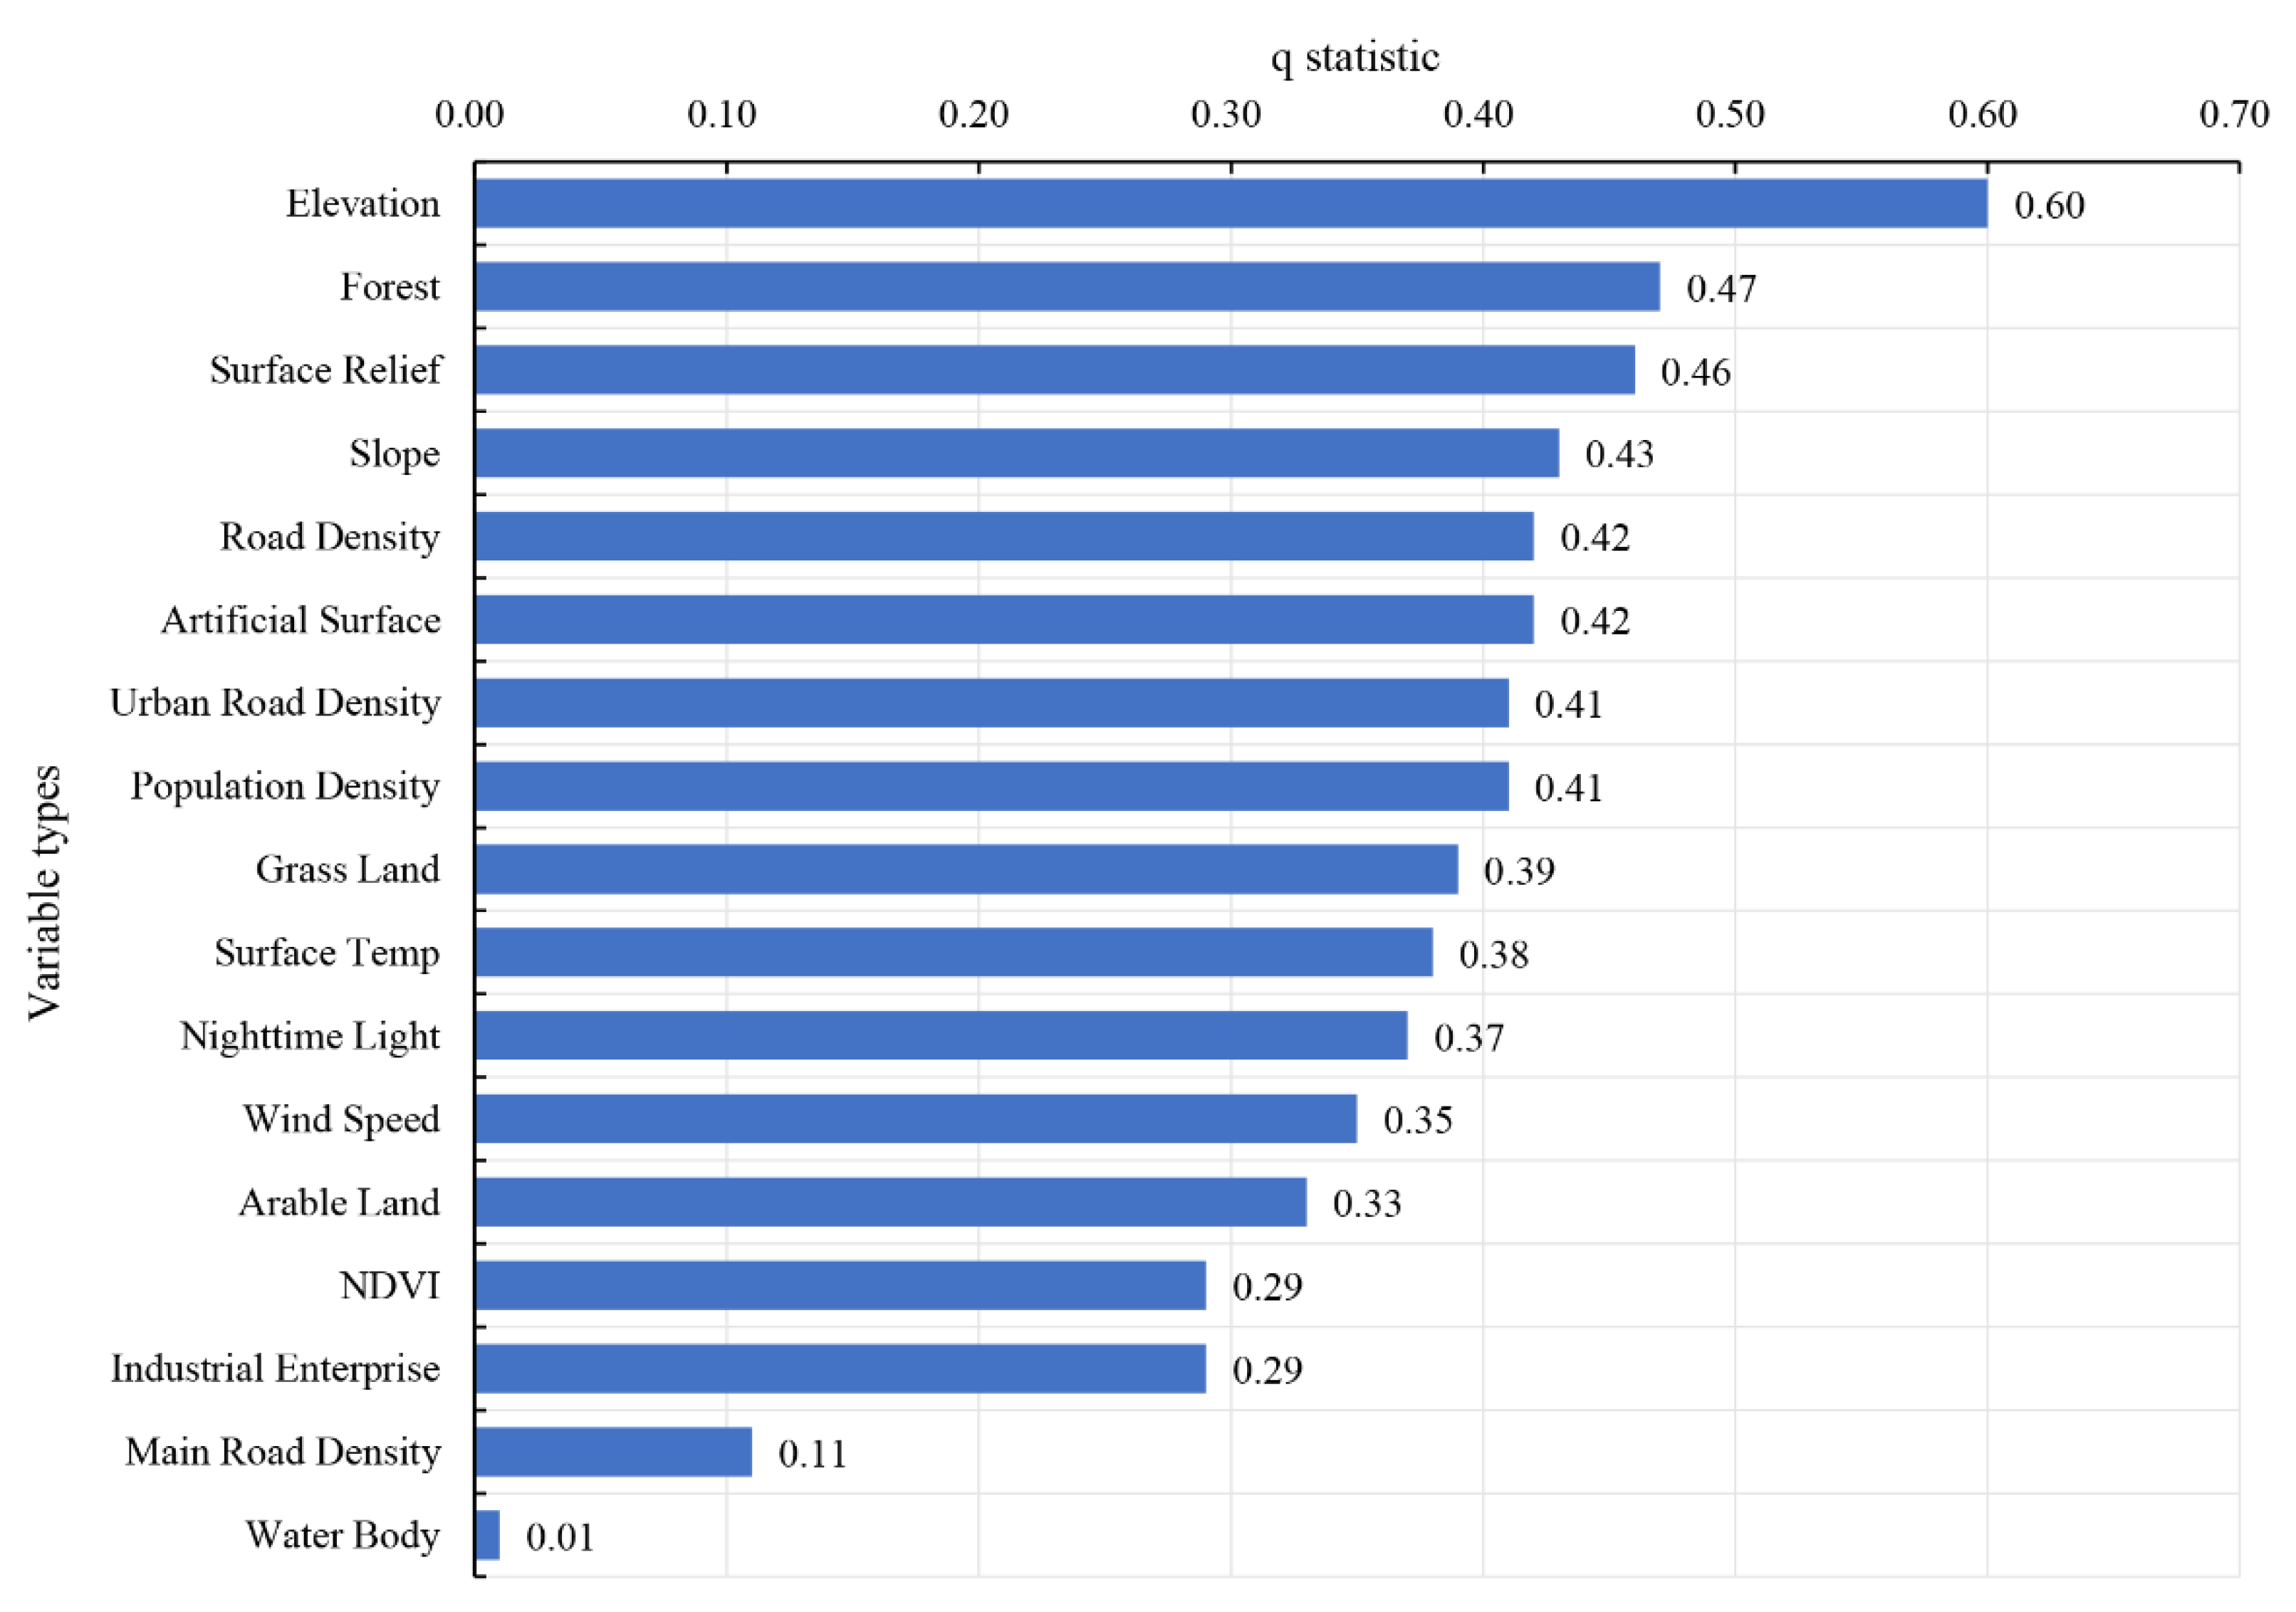
3.2. Identification of Influencing Factors of Air Pollution in Shijiazhuang

To quantitatively determine the explanatory power of the 17 individual factors on the spatial heterogeneity of air pollution, and analyze the possible causal relationships among them, we analyzed the factor detector result of Geodetector (Figure 6).
The factor detector measures the explanatory power of each factor on air pollution by calculating the q value, which is positively correlated with the explanatory power. The factor detection result shows that natural factors such as elevation, forest, the Earth’s surface undulation, and slope have the highest explanatory power. In addition to the density of trunk roads, railways, and rivers, other factors, such as the overall density of the road network, artificial surfaces, urban road density, population density, grassland, surface temperature, night light intensity, wind speed, cultivated land, NDVI, and industrial enterprise density, are correlated with the spatial distribution of air pollution. Of these, wind speed, night light and cultivated land have similar effects on air pollution. The q value of river density is lower than 0.1, indicating that there is no significant correlation.
The results show that, when considering the explanatory power of individual factors, the leading factors that have the highest explanatory power on the spatial pattern of air pollution include natural factors such as terrain, forest, and grassland, and human factors such as road density (including overall density and urban road density), artificial surfaces, and population density. Among these, natural factors mainly include basic terrain and ecological land, whereas human factors mainly reflect urban built-up environment density and the degree of population and economic activity agglomeration. Under the influence of the transregional transport of air pollutants, industrial enterprises and other pollution sources have low explanatory power on surrounding air pollution. The explanatory power of trunk roads, railways, and river density on air pollution is not significant.

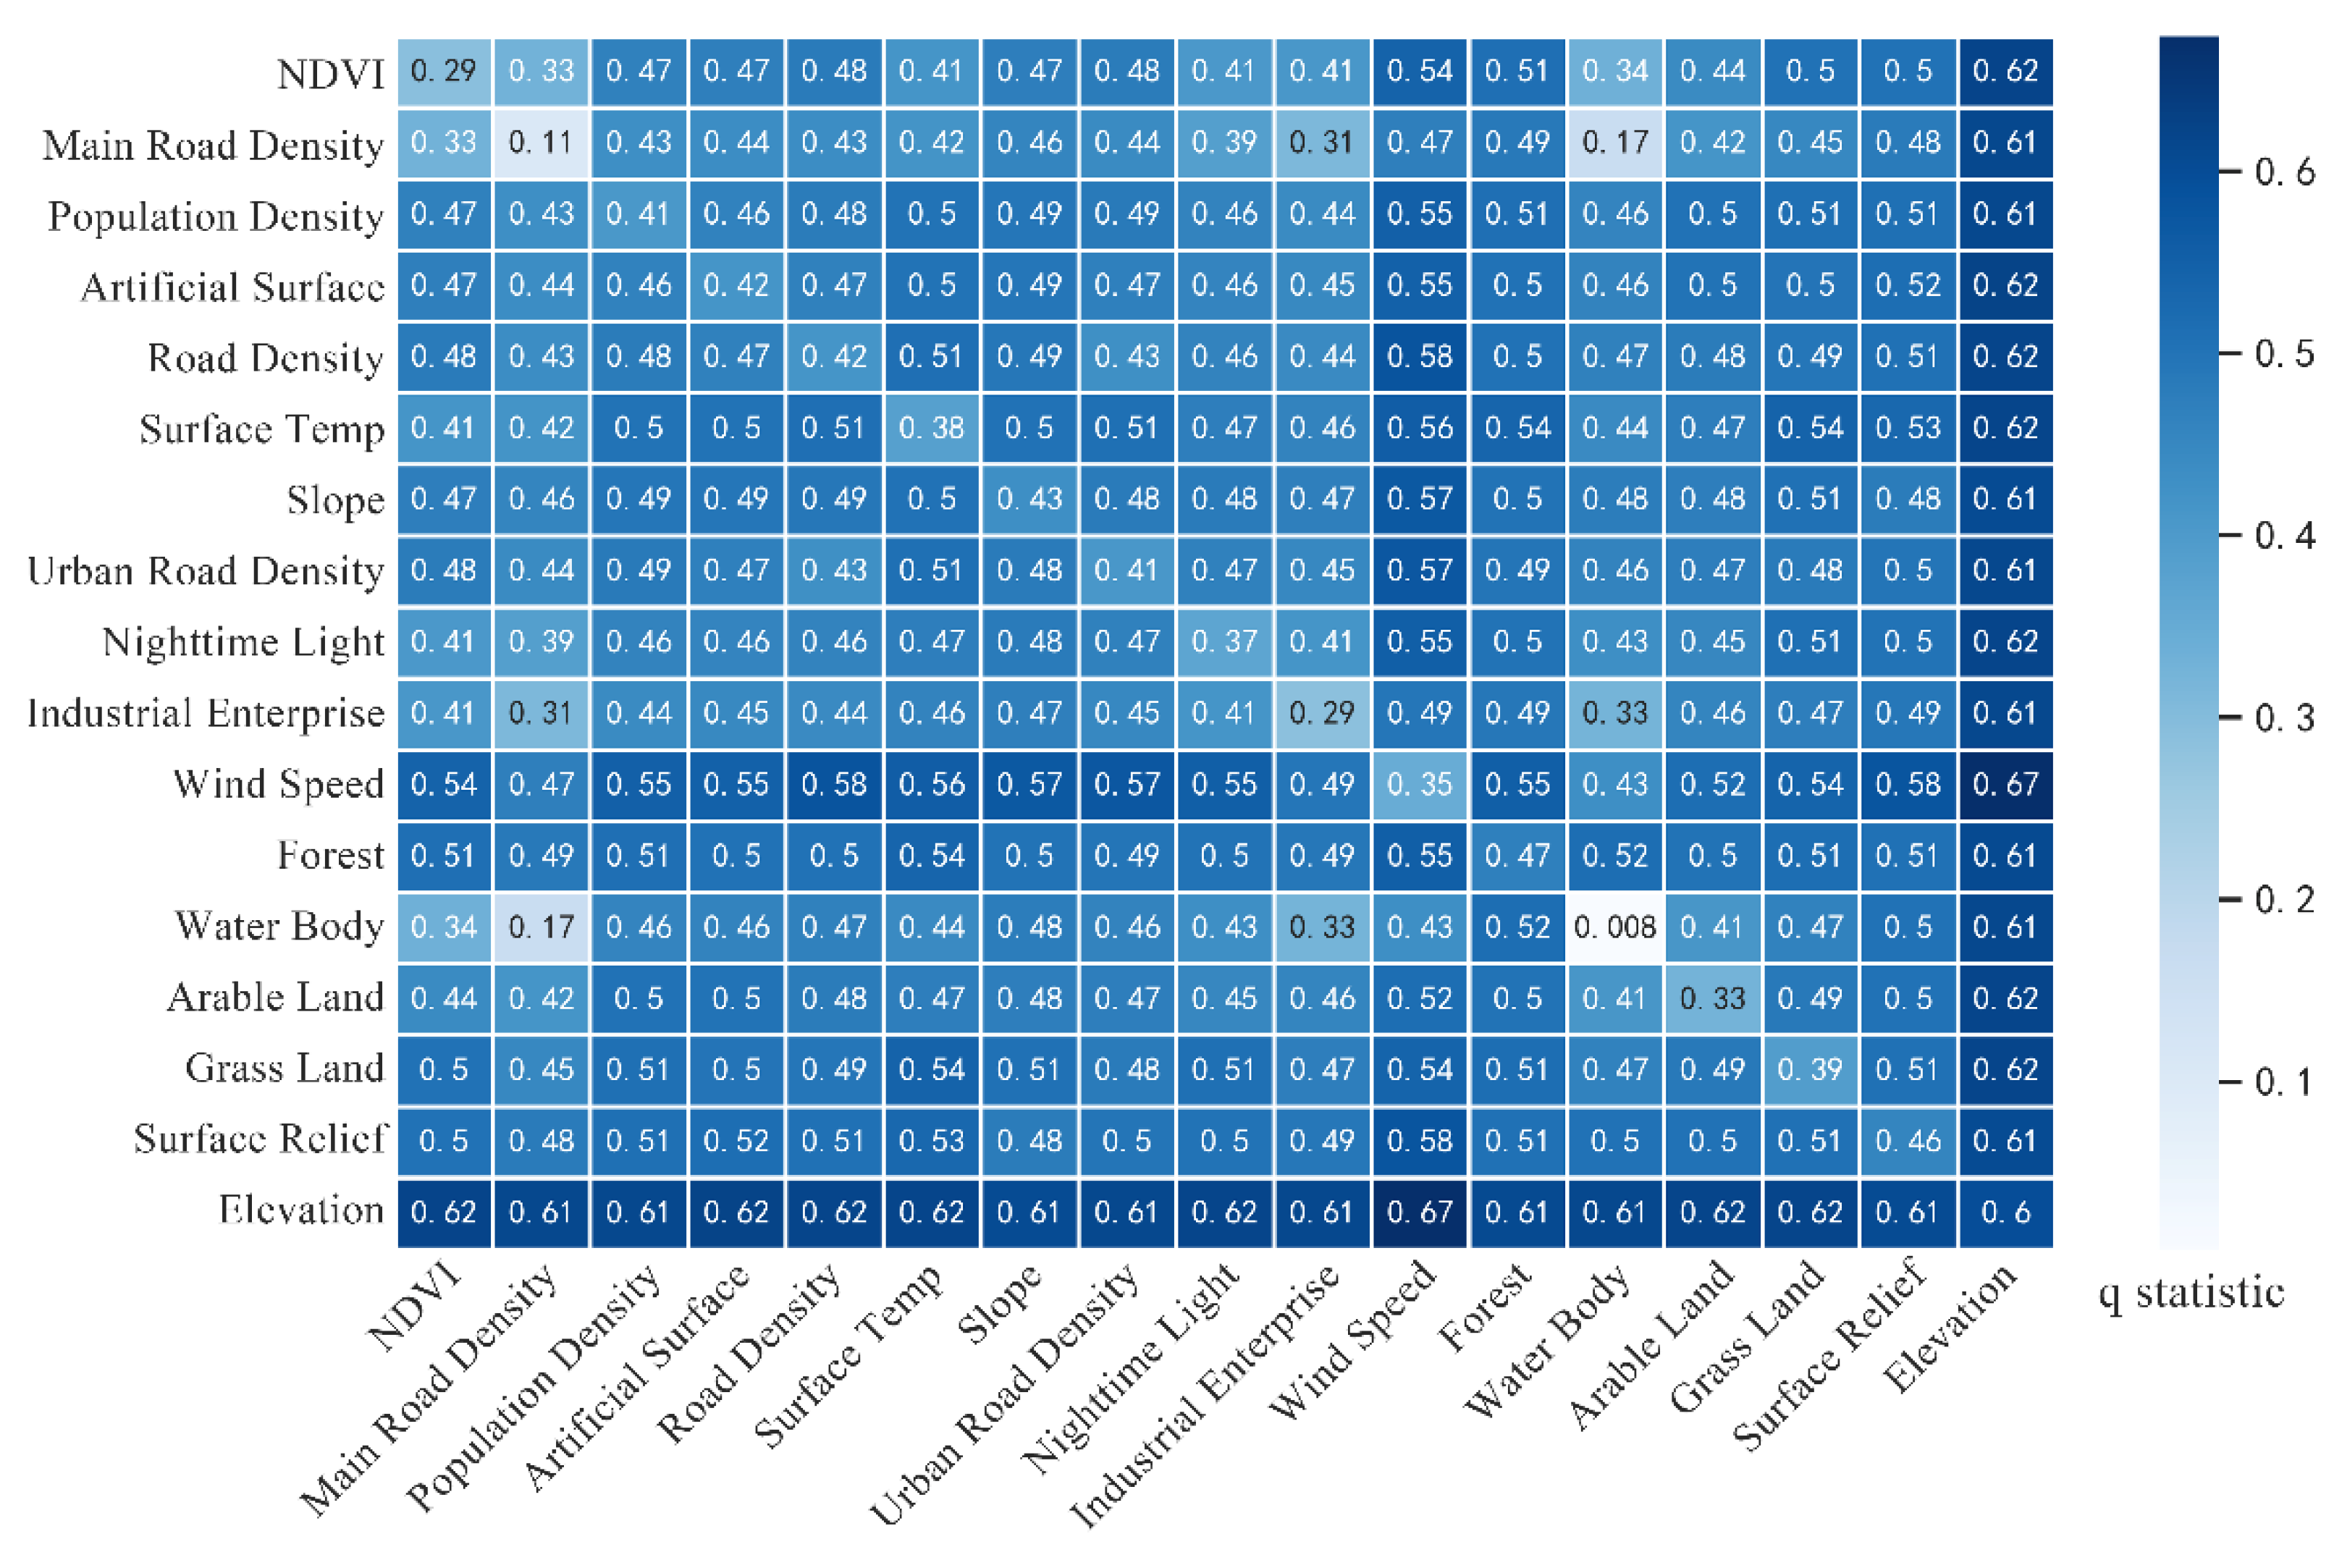
3.3. Analysis of the Interaction and Mechanism of Air Pollution Influencing Factors

The interaction detector calculated the q value after independent variables interacted in pairs to analyze the strength of the interaction between factors. The results show (Figure 7) that terrain and annual average wind speed have strong interactions with other variables, with the q value obtained from the interaction between elevation and wind speed being the highest, and the interaction between rivers and trunk roads and railways being the lowest. In terms of interaction types, the annual average wind speed has a two-factor enhanced interaction relationship with most other variables; that is, the q value obtained from the interaction of two factors is greater than the maximum q values of two single factors. However, the interaction between average annual wind speed and trunk road, railway, and river is a nonlinear enhancement; that is, the q value obtained from the interaction in pairs is greater than the sum of q values obtained from two single factors.
The risk detector calculated the mean value of dependent variables corresponding to the value of factors at all levels to provide a basis for analyzing the possible influence of each factor on the spatial pattern of air pollution and reveal the numerical relationship between explanatory variables and dependent variables. The results show that (Figure 8) human factors such as the overall density of the road network, artificial surface density, urban road density, industrial enterprise density, and night light intensity are significantly positively correlated with the air pollution degree. Natural factors such as terrain represented by elevation, ecological land represented by forest and grassland, and wind speed are significantly negatively correlated with the air pollution degree. Therefore, the agglomeration of population, urban construction, and economic activities is significantly correlated with the increase in air pollution; the agglomeration and expansion of ecological land and the increase in wind speed can significantly weaken air pollution.
More severe air pollution is more likely to be found in high-density urban center areas rather than in industrial areas distributed in the urban periphery, suggesting that domestic and traffic pollution sources, high building density, and construction intensity in high-density built-up areas combine to increase air pollution levels and weaken conditions for the dispersion and dilution of air pollutants. In addition, due to its high population density, the risk of exposure to air pollution is also high. Therefore, on the basis of the existing control of industrial pollution sources, the focus should be on the control of pollution sources and the construction of pollution control wind fields in high-density urban areas.
The results reflect the explanatory power of relevant factors on air pollution, reveal the influence mechanism of relevant factors on air pollution, and provide a basis for the optimization strategy to prevent and control various factors of air pollution.
Combining the analysis results of the risk detector and interaction detector shows that (Figure 9) different factors have different influence mechanisms on air pollution, and they act simultaneously on the discharge and diffusion of pollutants, thus producing complex effects on the spatial heterogeneity of air pollution. Of these factors, natural factors, such as terrain and ecological land, have absorbing and weakening effects on air pollutants and have an important influence on urban construction and the aggregation of human factors. The aggregation of human factors leads to an increase in pollutant emissions and a weakening of pollutant diffusion, further influencing the spatial heterogeneity of air pollution. It is necessary to consider factors’ attributes and their sensitivity to human intervention when promoting an optimization strategy for urban air pollution in view of the planning layout, construction control of human spatial factors, and the protection and expansion of natural factors.

4. Discussion

This study analyzed the spatial heterogeneity of air pollution in Shijiazhuang city and detected the main individual factors influencing the spatial heterogeneity of air pollution, the interaction between the factors, and the modes of interaction of each factor using geographic detectors.
AOD values show significant spatial heterogeneity, and more severe air pollution is generally found in high-density urban central areas, and individual factors including forests and grasslands, terrain, and artificial surfaces have the strongest explanatory power for the spatial heterogeneity of AOD values. This reflects the fact that high-intensity urban construction, sparse vegetation, and low, flat topographic conditions are strongly associated with severe air pollution, and the increase in population and built-up area density, and the destruction of vegetation, contribute significantly to the increase in AOD values, leading to an increase in air pollution problems. This indicates that the regulation of these factors can influence the spatial heterogeneity of AOD values and mitigate air pollution problems.
In response to the lack of analysis of the interaction between multiple factors in existing studies on air pollution influencing factors, this study introduced a Geodetector and focused on exploring the interaction between the factors, proving that the Geodetector can better reflect the degree of the interaction between air pollution influencing factors. This study found that the explanatory power of each factor was improved through interaction, and the highest influence on the distribution of AOD values was found in the interaction between terrain and artificial surfaces, NDVI, and forest grassland, indicating that each factor can barely affect the air pollution status alone, but has an impact on air pollution through complex interactions. However, many existing measures to control individual factors actually ignored this interaction, which has caused some of the existing measures to be ineffective. This is confirmed by existing studies on the optimization of individual factors such as urban ventilation corridors [44].
Therefore, the air pollution prevention and control strategy should avoid focusing on an individual factor such as a certain pollutant source or the ventilation corridors, but should instead propose a comprehensive system of strategies covering all factors including the planning of urban growth directions based on the analysis of natural conditions such as terrain and ventilation status, the control of construction intensity in high-density urban areas, the protection and expansion of ecological spaces such as forests and grasslands, the control of all types (industrial, transport and residential) of pollutant sources, the construction of the ventilation system based on roads and open spaces [45,46], and the policy system to ensure the implementation of all measures to take advantage of the interactions between all factors that contribute to the reduction in air pollution, so that these measures can achieve the objective of reducing air pollution.
There are some limitations to this work. We used AOD to reflect the extent of air pollution, which may have caused some limitations of the results, due to the fact that important air pollutants such as O3, NOX, and SO2 could not be well represented by AOD values, and future studies could further improve these aspects by using more accurate and comprehensive pollutant concentration data. Secondly, other influencing factors that are associated with air pollution may not have been included in our analysis. Additionally, in terms of research content, current studies still focus on the influencing factors of air pollution and their correlation. However, the change in the degree of air pollution involves the complete process of pollutant discharge, diffusion, absorption, and other complex effects among multiple factors. In future studies, the interaction mechanism and coupling optimization among various factors in a complex system should be further advanced based on existing research. The popularization and application of technologies such as big data, AI, and machine learning will promote the study of complex system problems affecting air pollution, thus becoming an important research focus.

5. Conclusions

Through the processing, regression analysis, and geographical detector calculation of the data of Shijiazhuang City, the following main conclusions are obtained:
(1)
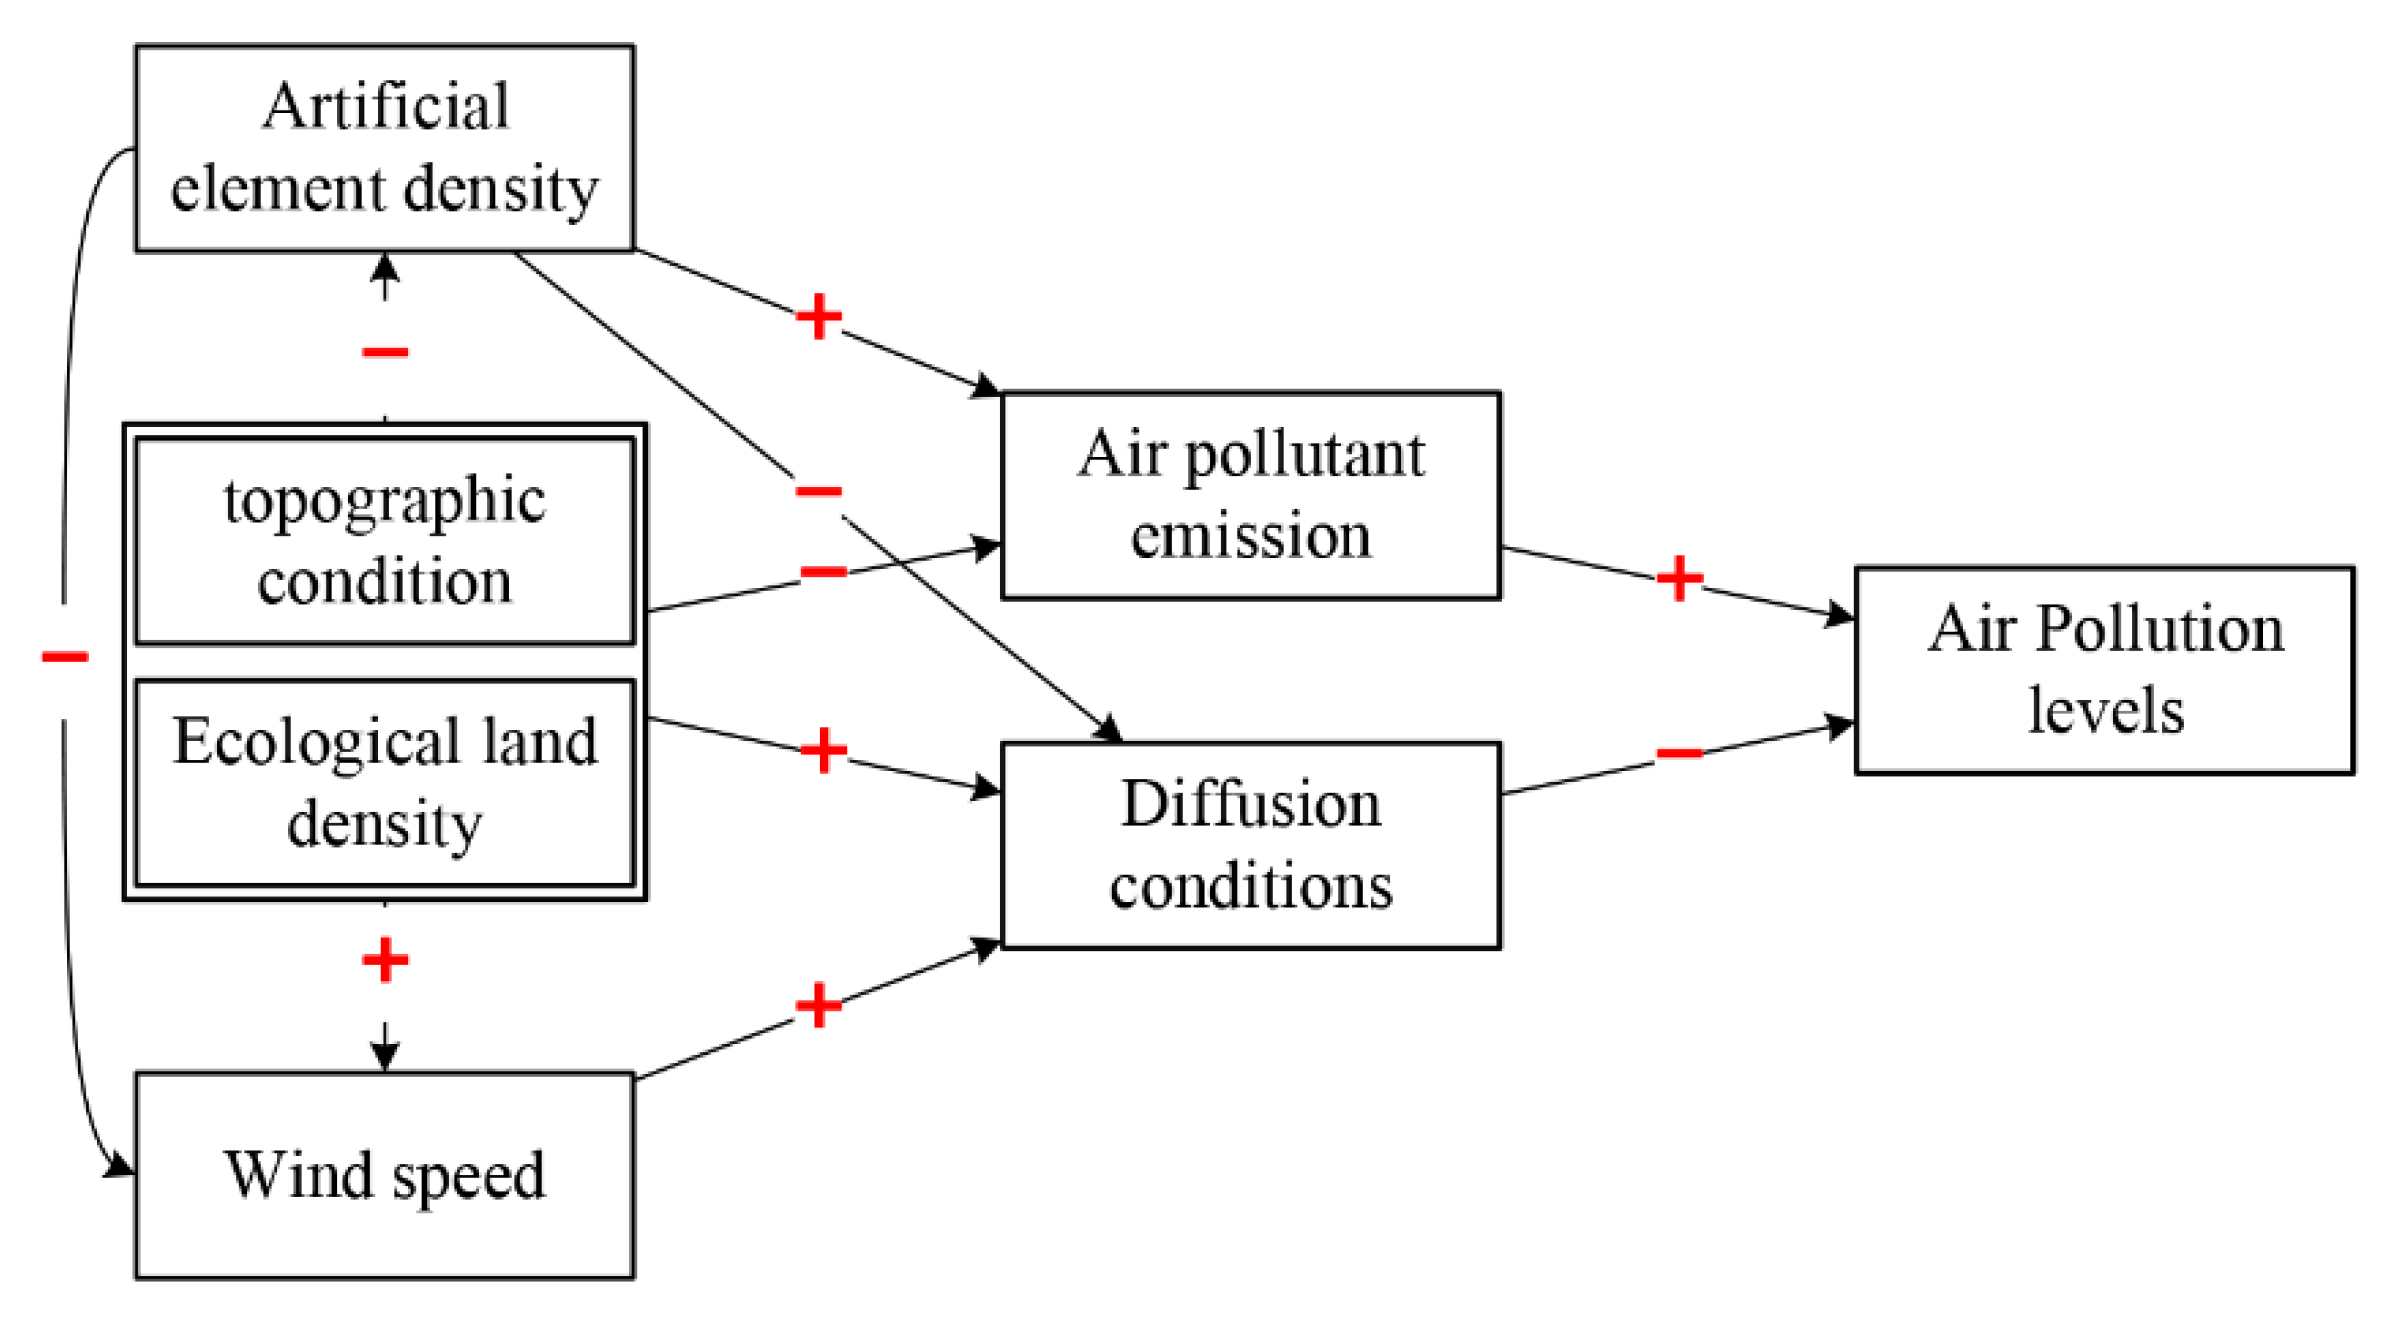
Spatial distribution characteristics of air pollution: within the administrative region of Shijiazhuang, air pollution shows obvious characteristics of high-value agglomeration and heterogeneity. The high agglomeration areas are concentrated in the eastern plain areas where human factors such as industry and population are concentrated, and low agglomeration areas are concentrated in the western mountainous areas.
(2)
The main individual influencing factors of air pollution spatial heterogeneity: forest (q = 0.620), slope (q = 0.616), elevation (q = 0.579), grassland (q = 0.534), and artificial surface (q = 0.506) are the main individual factors affecting AOD distribution. Among them, natural factors such as topography, ecological space, and wind speed are negatively correlated with AOD values, whereas the opposite is true for human factors such as roads, artificial surfaces, and population. These human factors reflect the density of the urban built-up environment and the agglomeration degree of population and economic activity. Therefore, high-density built-up areas should be considered as the key areas for pollution control.
(3)
The interaction effects among factors: each factor can barely affect the air pollution status significantly alone. The explanatory power of all influencing factors showed an improvement through the two-factor enhanced interaction. The associations of elevation ∩ artificial surface (q = 0.625), elevation ∩ NDVI (q = 0.622), and elevation ∩ grassland (q = 0.620) exhibited a high explanatory power on AOD value distribution. The highest AOD value appears in the places with lower elevation, high-density built environment, and sparse vegetation cover.

Author Contributions

Conceptualization, Y.S. and J.Z.; methodology, Y.S.; software, Y.S.; validation, Y.S. and A.N.; formal analysis, Y.S.; investigation, Y.S.; resources, Y.S. and J.Z.; data curation, Y.S.; writing—original draft preparation, Y.S.; writing—review and editing, Y.S. and A.N.; visualization, Y.S. and A.N.; supervision, J.Z.; project administration, J.Z.; funding acquisition, J.Z. All authors have read and agreed to the published version of the manuscript.

Funding

This research was funded by National Natural Science Foundation of China (NSFC), grant number 52078320.

Data Availability Statement

The datasets analyzed during the current study were derived from the following public domain resources: https://ladsweb.modaps.eosdis.nasa.gov/missions-and-measurements/modis/ (accessed on 1 March 2021); http://data.cma.cn (accessed on 1 March 2021); http://www.gscloud.cn (accessed on 1 March 2021); http://www.webmap.cn (accessed on 1 March 2021); http://www.ngcc.cn/ngcc (accessed on 1 March 2021); https://www.worldpop.org/ (accessed on 1 March 2021); https://lbs.amap.com/ (accessed on 1 March 2021); https://www.openstreetmap.org/ (accessed on 1 March 2021); https://www.zybuluo.com/novachen/note/1741875 (accessed on 1 March 2021).

Conflicts of Interest

The funders had no role in the design of the study; in the collection, analyses, or interpretation of data; in the writing of the manuscript, or in the decision to publish the results.

References

  1. Chan, C.; Yao, X. Air pollution in mega cities in China. Atmos. Environ. 2008, 42, 1–42. [Google Scholar] [CrossRef]
  2. Xie, Y.; Dai, H.; Zhang, Y.; Wu, Y.; Hanaoka, T.; Masui, T. Comparison of health and economic impacts of PM2.5 and ozone pollution in China. Environ. Int. 2019, 130, 104881. [Google Scholar] [CrossRef] [PubMed]
  3. Dong, D.; Xu, B.; Shen, N.; He, Q. The Adverse Impact of Air Pollution on China’s Economic Growth. Sustainability 2021, 13, 9056. [Google Scholar] [CrossRef]
  4. Jerrett, M. The death toll from air-pollution sources. Nature 2015, 525, 330–331. [Google Scholar] [CrossRef] [PubMed] [Green Version]
  5. Lelieveld, J.; Evans, J.S.; Fnais, M.; Giannadaki, D.; Pozzer, A. The contribution of outdoor air pollution sources to premature mortality on a global scale. Nature 2015, 525, 367–371. [Google Scholar] [CrossRef]
  6. Crane, K.; Mao, Z. Costs of Selected Policies to Address Air Pollution in China; RAND Corporation: Santa Monica, CA, USA, 2015. [Google Scholar]
  7. Fang, C.; Liu, H.; Li, G. International progress and evaluation on interactive coupling effects between urbanization and the eco-environment. J. Geogr. Sci. 2016, 26, 1081–1116. [Google Scholar] [CrossRef]
  8. Wang, B.; Hong, G.; Qin, T.; Fan, W.; Yuan, X. Factors governing the willingness to pay for air pollution treatment: A case study in the Beijing-Tianjin-Hebei region. J. Clean. Prod. 2019, 235, 1304–1314. [Google Scholar] [CrossRef]
  9. Liang, C.; Duan, F.; He, K.; Ma, Y. Review on recent progress in observations, source identifications and countermeasures of PM2.5. Environ. Int. 2016, 86, 150–170. [Google Scholar] [CrossRef] [PubMed]
  10. Wu, T.; Zhou, L.; Jiang, G.; Meadows, M.; Zhang, J.; Pu, L.; Wu, C.; Xie, X. Modelling Spatial Heterogeneity in the Effects of Natural and Socioeconomic Factors, and Their Interactions, on Atmospheric PM2.5 Concentrations in China from 2000–2015. Remote Sens. 2021, 13, 2152. [Google Scholar] [CrossRef]
  11. Pui, D.; Chen, S.; Zuo, Z. PM2.5 in China: Measurements, sources, visibility and health effects, and mitigation. Particuology 2014, 13, 1–26. [Google Scholar] [CrossRef]
  12. Streets, D.; Waldhoff, S. Present and future emissions of air pollutants in China: SO2, NOx, and CO. Atmos. Environ. 2000, 34, 363–374. [Google Scholar] [CrossRef]
  13. Lu, C.; Liu, Y. Effects of China’s urban form on urban air quality. Urban Stud. 2015, 53, 2607–2623. [Google Scholar] [CrossRef]
  14. Clark, L.P.; Millet, D.B.; Marshall, J.D. Air Quality and Urban Form in US Urban Areas: Evidence from Regulatory Monitors. Environ. Sci. Technol. 2011, 45, 7028–7035. [Google Scholar] [CrossRef]
  15. McCarty, J.; Kaza, N. Urban form and air quality in the United States. Landsc. Urban Plan. 2015, 139, 168–179. [Google Scholar] [CrossRef]
  16. Guan, D.; Su, X.; Zhang, Q.; Peters, G.P.; Liu, Z.; Lei, Y.; He, K. The socioeconomic drivers of China’s primary PM. Environ. Res. Lett. 2014, 9, 024010. [Google Scholar] [CrossRef] [Green Version]
  17. He, L.; Zhang, L.; Liu, R. Energy consumption, air quality, and air pollution spatial spillover effects: Evidence from the Yangtze River Delta of China. Chin. J. Popul. Resour. Environ. 2019, 17, 329–340. [Google Scholar] [CrossRef]
  18. Li, J.; Hou, L.; Wang, L.; Tang, L. Decoupling Analysis between Economic Growth and Air Pollution in Key Regions of Air Pollution Control in China. Sustainability 2021, 13, 6600. [Google Scholar] [CrossRef]
  19. Wang, X.; Klemes, J.; Dong, X.; Fan, W.; Xu, Z.; Wang, Y.; Varbanov, P. Air pollution terrain nexus: A review considering energy generation and consumption. Renew. Sustain. Energy Rev. 2019, 105, 71–85. [Google Scholar] [CrossRef]
  20. Yang, J.; Shi, B.; Shi, Y.; Marvin, S.; Zheng, Y.; Xia, G. Air pollution dispersal in high density urban areas: Research on the triadic relation of wind, air pollution, and urban form. Sustain. Cities Soc. 2020, 54, 101941. [Google Scholar] [CrossRef]
  21. Matos, P.; Vieira, J.; Rocha, B.; Branquinho, C.; Pinho, P. Modeling the provision of air-quality regulation ecosystem service provided by urban green spaces using lichens as ecological indicators. Sci. Total Environ. 2019, 665, 521–530. [Google Scholar] [CrossRef] [PubMed]
  22. Zhan, D.; Kwan, M.; Zhang, W.; Wang, S.; Yu, J. Spatiotemporal Variations and Driving Factors of Air Pollution in China. Int. J. Environ. Res. Public Health 2017, 14, 1538. [Google Scholar] [CrossRef] [PubMed] [Green Version]
  23. Bai, L.; Jiang, L.; Yang, D.; Liu, Y. Quantifying the spatial heterogeneity influences of natural and socioeconomic factors and their interactions on air pollution using the geographical detector method: A case study of the Yangtze River Economic Belt, China. J. Clean. Prod. 2019, 232, 692–704. [Google Scholar] [CrossRef]
  24. Zhan, D.; Kwan, M.-P.; Zhang, W.; Yu, X.; Meng, B.; Liu, Q. The driving factors of air quality index in China. J. Clean. Prod. 2018, 197, 1342–1351. [Google Scholar] [CrossRef]
  25. Zhang, X.; Shi, M.; Li, Y.; Pang, R.; Xiang, N. Correlating PM2.5 concentrations with air pollutant emissions: A longitudinal study of the Beijing-Tianjin-Hebei region. J. Clean. Prod. 2018, 179, 103–113. [Google Scholar] [CrossRef]
  26. Yu, H.-L.; Lin, Y.-C.; Kuo, Y.-M. A time series analysis of multiple ambient pollutants to investigate the underlying air pollution dynamics and interactions. Chemosphere 2015, 134, 571–580. [Google Scholar] [CrossRef] [PubMed]
  27. Pandey, B.; Agrawal, M.; Singh, S. Assessment of air pollution around coal mining area: Emphasizing on spatial distributions, seasonal variations and heavy metals, using cluster and principal component analysis. Atmos. Pollut. Res. 2014, 5, 79–86. [Google Scholar] [CrossRef] [Green Version]
  28. Wang, L.; Chen, J. Socio-economic influential factors of haze pollution in china: Empirical study by eba model using spatial panel data. Acta Sci. Circumstantiae 2016, 36, 3833–3839. [Google Scholar] [CrossRef]
  29. Liu, H.; Fang, C.; Zhang, X.; Wang, Z.; Bao, C.; Li, F. The effect of natural and anthropogenic factors on haze pollution in Chinese cities: A spatial econometrics approach. J. Clean. Prod. 2017, 165, 323–333. [Google Scholar] [CrossRef]
  30. Hao, Y.; Liu, Y.-M. The influential factors of urban PM2.5 concentrations in China: A spatial econometric analysis. J. Clean. Prod. 2016, 112, 1443–1453. [Google Scholar] [CrossRef]
  31. Huang, L.; Zhang, C.; Bi, J. Development of land use regression models for PM2.5, SO2, NO2 and O3 in Nanjing, China. Environ. Res. 2017, 158, 542–552. [Google Scholar] [CrossRef] [PubMed]
  32. Xu, S. Analysis of the Influencing Factors of Industrial Air Pollution in Shenzhen. IOP Conf. Ser. Earth Environ. Sci. 2020, 450, 012094. [Google Scholar] [CrossRef]
  33. Zhou, D.; Lin, Z.; Liu, L.; Qi, J. Spatial-temporal characteristics of urban air pollution in 337 Chinese cities and their influencing factors. Environ. Sci. Pollut. Res. 2021, 28, 36234–36258. [Google Scholar] [CrossRef] [PubMed]
  34. Zhang, X.; Yan, B.; Du, C.; Cheng, C.; Zhao, H. Quantifying the interactive effects of meteorological, socioeconomic, and pollutant factors on summertime ozone pollution in China during the implementation of two important policies. Atmos. Pollut. Res. 2021, 12, 101248. [Google Scholar] [CrossRef]
  35. Zhang, X.; Cheng, C. Temporal and Spatial Heterogeneity of PM2.5 Related to Meteorological and Socioeconomic Factors across China during 2000–2018. Int. J. Environ. Res. Public Health 2022, 19, 707. [Google Scholar] [CrossRef] [PubMed]
  36. Wang, J.F.; Li, X.H.; Christakos, G.; Liao, Y.L.; Zhang, T.; Gu, X.; Zheng, X.Y. Geographical Detectors-Based Health Risk Assessment and its Application in the Neural Tube Defects Study of the Heshun Region, China. Int. J. Geogr. Inf. Sci. 2010, 24, 107–127. [Google Scholar] [CrossRef]
  37. Jing, Z.; Liu, P.; Wang, T.; Song, H.; Lee, J.; Xu, T.; Xing, Y. Effects of Meteorological Factors and Anthropogenic Precursors on PM2.5 Concentrations in Cities in China. Sustainability 2020, 12, 3550. [Google Scholar] [CrossRef]
  38. Zhao, P.; Zhang, X.; Xu, X.; Zhao, X. Long-term visibility trends and characteristics in the region of Beijing, Tianjin, and Hebei, China. Atmos. Res. 2011, 101, 711–718. [Google Scholar] [CrossRef]
  39. China National Environmental Monitoring Centre. Report on the National Surface Water and Ambient Air Quality Status in 2020; Ministry of Ecology and Environment: Beijing, China, 2021. [Google Scholar]
  40. Wang, S.; Ma, H.; Zhao, Y. Exploring the relationship between urbanization and the eco-environment-A case study of Beijing-Tianjin-Hebei region. Ecol. Indic. 2014, 45, 171–183. [Google Scholar] [CrossRef]
  41. Maji, K.J.; Dikshit, A.K.; Arora, M.; Deshpande, A. Estimating premature mortality attributable to PM2.5 exposure and benefit of air pollution control policies in China for 2020. Sci. Total Environ. 2018, 612, 683–693. [Google Scholar] [CrossRef]
  42. Miao, Y.; Hu, X.; Liu, S.; Qian, T.; Xue, M.; Zheng, Y.; Wang, S. Seasonal variation of local atmospheric circulations and boundary layer structure in the Beijing-Tianjin-Hebei region and implications for air quality. J. Adv. Model. Earth Syst. 2015, 7, 1602–1626. [Google Scholar] [CrossRef]
  43. Li, N.; Zhang, X.; Shi, M.; Hewings, G.J.D. Does China’s air pollution abatement policy matter? An assessment of the Beijing-Tianjin-Hebei region based on a multi-regional CGE model. Energy Policy 2019, 127, 213–227. [Google Scholar] [CrossRef]
  44. Liu, C.; Shu, Q.; Huang, S.; Guo, J. Modeling the Impacts of City-Scale “Ventilation Corridor” Plans on Human Exposure to Intra-Urban PM2.5 Concentrations. Atmosphere 2021, 12, 1269. [Google Scholar] [CrossRef]
  45. Fang, Y.; Zhao, L. Assessing the environmental benefits of urban ventilation corridors: A case study in Hefei, China. Build. Environ. 2022, 212, 108810. [Google Scholar] [CrossRef]
  46. Liu, C.; Jin, M.; Zhu, X.; Peng, Z. Review of Patterns of Spatiotemporal PM2.5, Driving Factors, Methods Evolvement and Urban Planning Implications. J. Hum. Settl. West China 2021, 36, 9–18. [Google Scholar]
Figure 1. Map of Shijiazhuang (a) in the air pollution transmission channel area of the Beijing-Tianjin-Hebei region; (b) administrative region of Shijiazhuang City.
Atmosphere 13 00670 g001
Figure 2. Spatial distribution of air pollution (AOD).
Atmosphere 13 00670 g002
Figure 3. Results of standardized classification of variables.
Atmosphere 13 00670 g003
Figure 4. Results of spatial autocorrelation analysis: (a) Moran’s I results; (b) general G results).
Atmosphere 13 00670 g004
Figure 5. Clustering and hotspot analysis results: (a) Anselin local Moran results; (b) Getis–Ord-Gi* results.
Atmosphere 13 00670 g005
Figure 6. Results of factor detector.
Atmosphere 13 00670 g006
Figure 7. Results of interaction detector.
Atmosphere 13 00670 g007
Figure 8. Influencing factors of air pollution.
Atmosphere 13 00670 g008
Figure 9. Analysis of the interaction mechanism of factors.
Atmosphere 13 00670 g009
Table 1. List of Moran’s I and General G analysis results.
MethodsProjectsResults
Moran’s IMoran’s index0.977421
Expected index−0.000073
z score223.061996
p value0.000000
General GObserved General G0.000001
Expected General G0.000000
z score141.428016
p value0.000000
Publisher’s Note: MDPI stays neutral with regard to jurisdictional claims in published maps and institutional affiliations.

