3.1. Mass Concentration
Table 2 presents the PM concentrations measured inside the vehicles; PM
2.5, PM
10 and PM
coarse were obtained at the ATOMKI UB station (from 24 h samplings) on the sampling days and PM
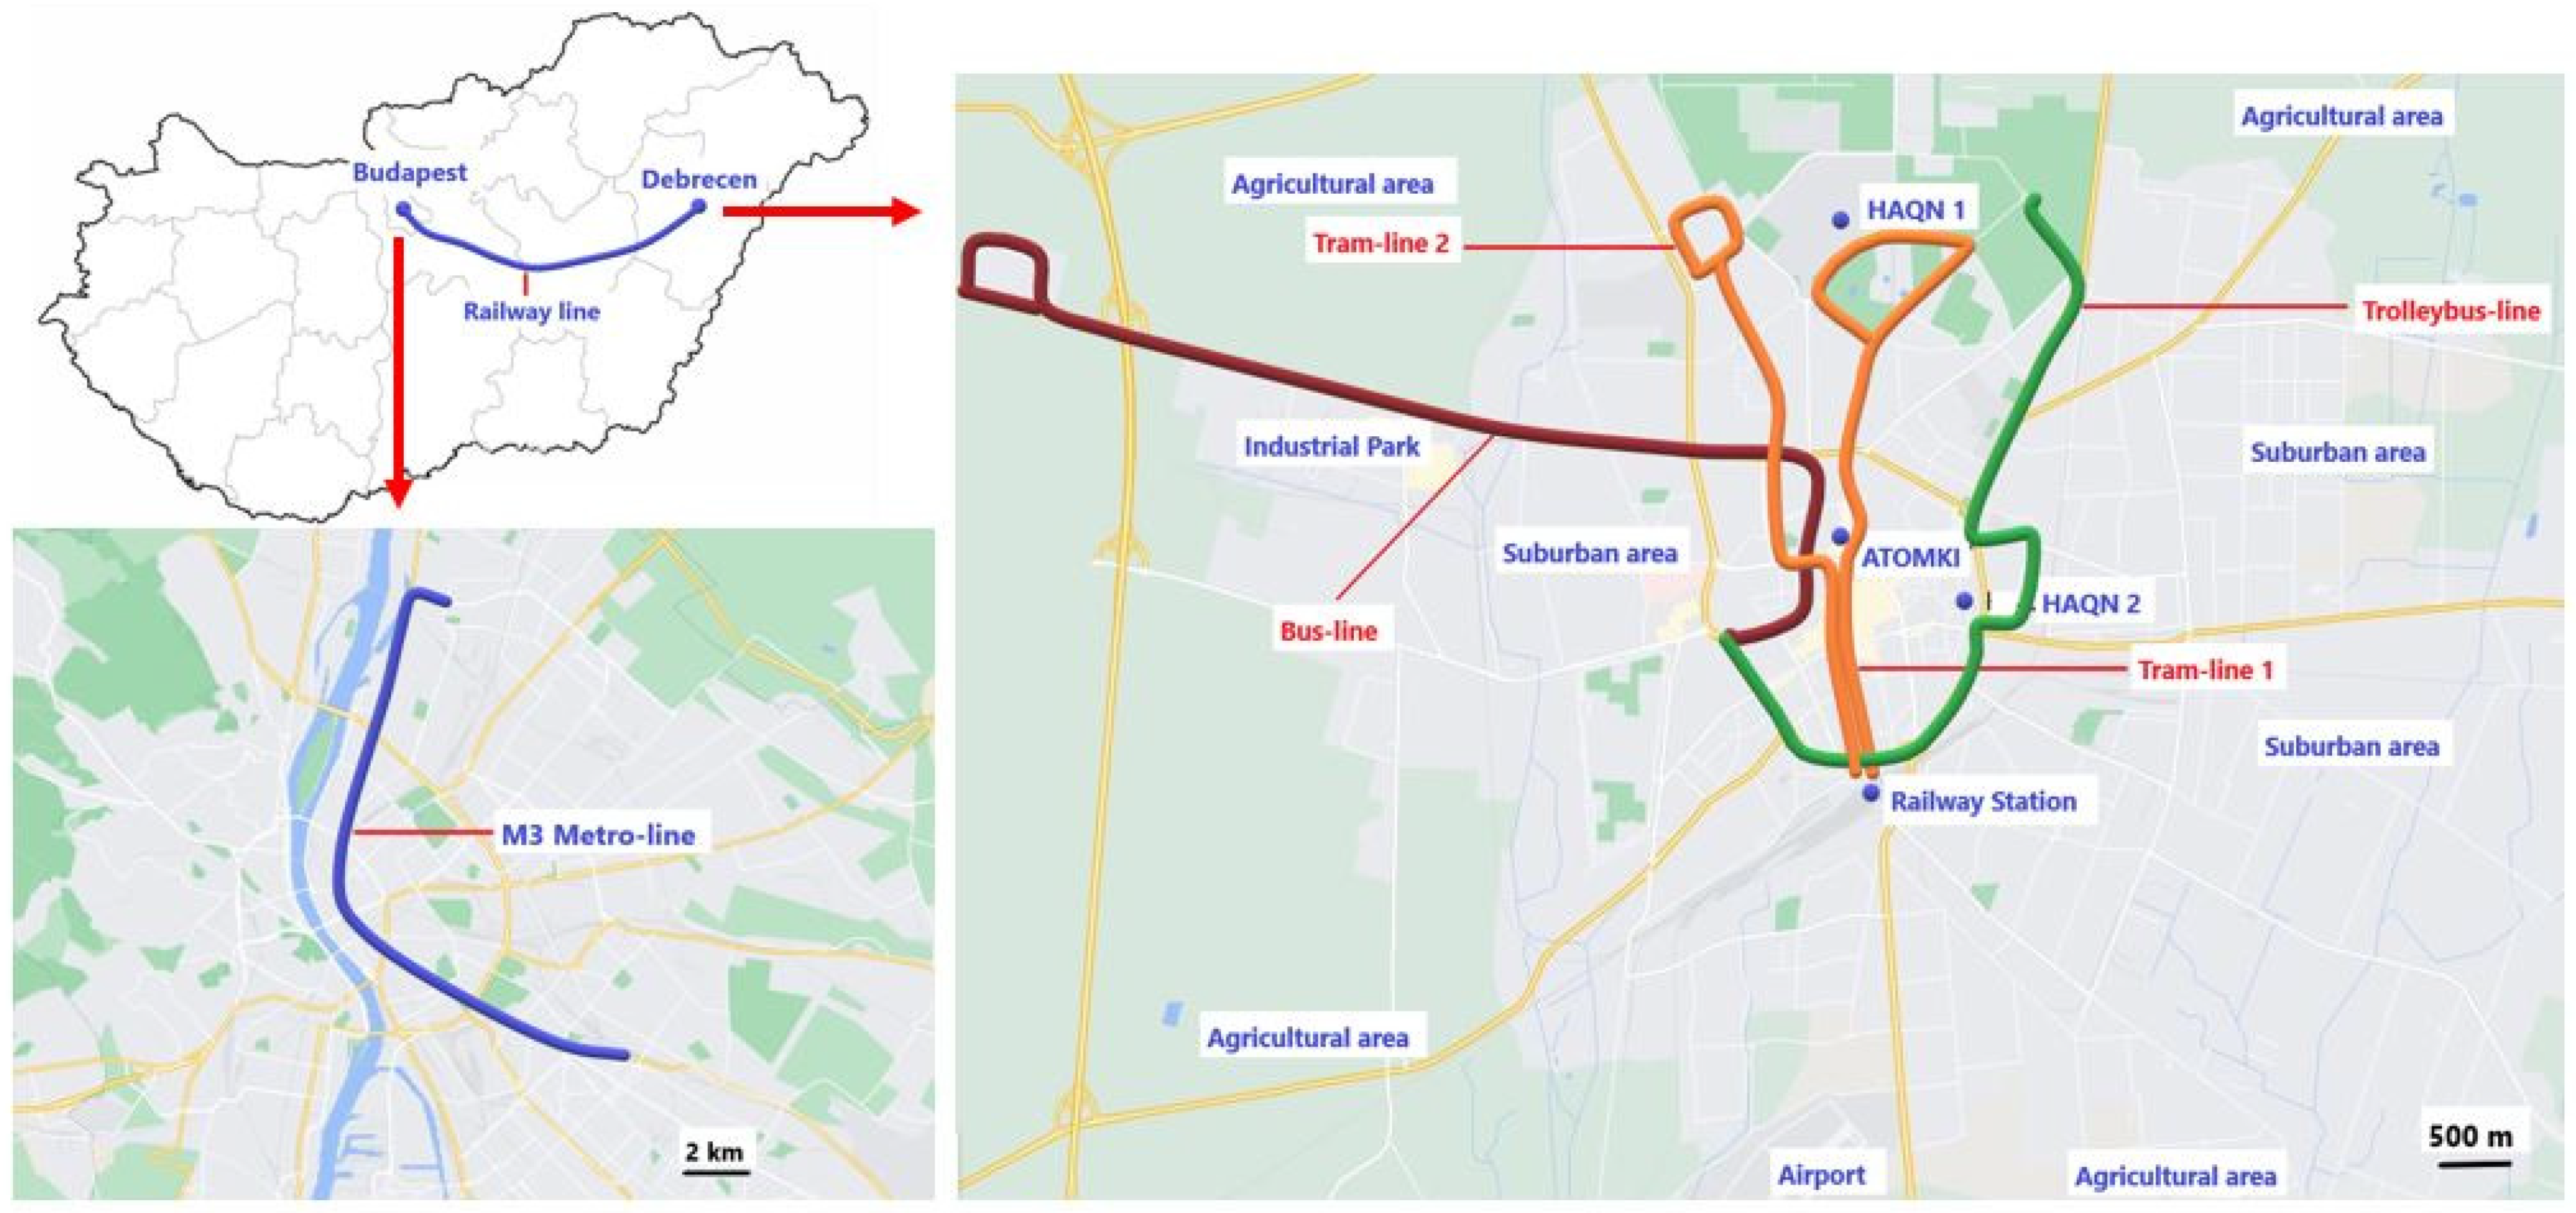
10 concentrations were measured at an UB and at a traffic measurement site of the Hungarian Air Quality Network (HAQN) in Debrecen at the time of the samplings [
35]. The automatic stations of the HAQN provided only PM
10 mass data. The outdoor PM data show that the samplings were made in similar conditions: the outdoor pollution level was, on average, level in the city, and the meteorological circumstances were also similar for all days.
The PM
coarse concentration on the different vehicles varied between 29 and 354 µg m
−3, while the PM
2.5 concentration was found to be between 12 and 189 µg m
−3. The lowest concentrations were measured in the case of the new tram, while very high pollution levels were observed on the old tram, the bus, the IC train and the metro. The concentrations inside the vehicles were compared to the PM
10 levels measured at the same time at two HAQN sites and the location of the ATOMKI. The results showed that in all cases, the PM pollution levels were significantly higher than for outdoors. The PM
coarse level was very high in both years in all vehicles, except the new tram, while in general, much higher PM
2.5 levels were measured in 2014 than in 2012. One exception is the local bus, where high PM
2.5 concentrations were experienced in 2012. This bus line leads from the city center to a suburban area a few kilometers outside the city border using the main road No. 33. At the time of the sampling, due to the good weather, the bus was driving with all the windows down, and agricultural works were being conducted in nearby fields. Thus, the resuspended dust, the emission from the diesel engine and the field works together could cause the elevated PM pollution levels inside the bus. The differences between the PM
2.5 levels in the two campaigns can be explained by the different travelling conditions (in the warm weather windows are usually kept down) or the older age of the ventilating systems. We had no access to information about the date of maintenance, either. High concentrations were measured on the old tram in 2014. Roadworks next to the tramline were the most probable cause of the elevated pollution level, as we have shown in our study from 2017 to 2018 [
18]. Significantly lower PM
coarse and PM
2.5 concentrations were observed in the new tram than in the old type in 2014, which is in accordance with our findings from 2017 to 2018 [
18]. It is important to note that the two types of trams ran partly on different lines during the sampling period: the old ones ran on tram-line 1, while the new types on tram-line 2.
In
Table 3, the obtained PM concentrations are presented together with results from similar studies from Hong Kong [
13], Munich [
36], Barcelona [
22], Lisbon [
23] and our findings for the trams in Debrecen, 2017–2018 [
18]. Basically, the measured concentrations were on the same order of magnitude as in other cities for similar vehicles; however, in most cases, we measured similar or higher concentrations. We note that in most of the other studies, the PM concentrations were obtained by real-time measurement using particle counters. The PM concentrations measured in the metro were in accordance with other results, e.g., Rome (407 µg m
−3 on average) [
37], London (800 µg m
−3 on average) [
38] or Stockholm (470 µg m
−3 on average) [
39]. In the case of the IC train, the observed PM
10 concentrations were significantly higher than the findings in other studies [
40,
41,
42], while the PM
2.5 concentrations were in good agreement with data from other countries [
40,
43,
44]. More detailed information for comparison concerning the metro and trains can be found in
Table S2 in the Supplementary Materials [
17,
18,
37,
38,
39,
40,
41,
42,
43,
44,
45,
46].
3.2. Elemental Composition
The elemental concentrations of the measured 16 elements in different vehicles and size fractions, indoor/outdoor (I/O) ratios and EF values in 2012 and in 2014 are shown in
Table 4,
Table 5 and
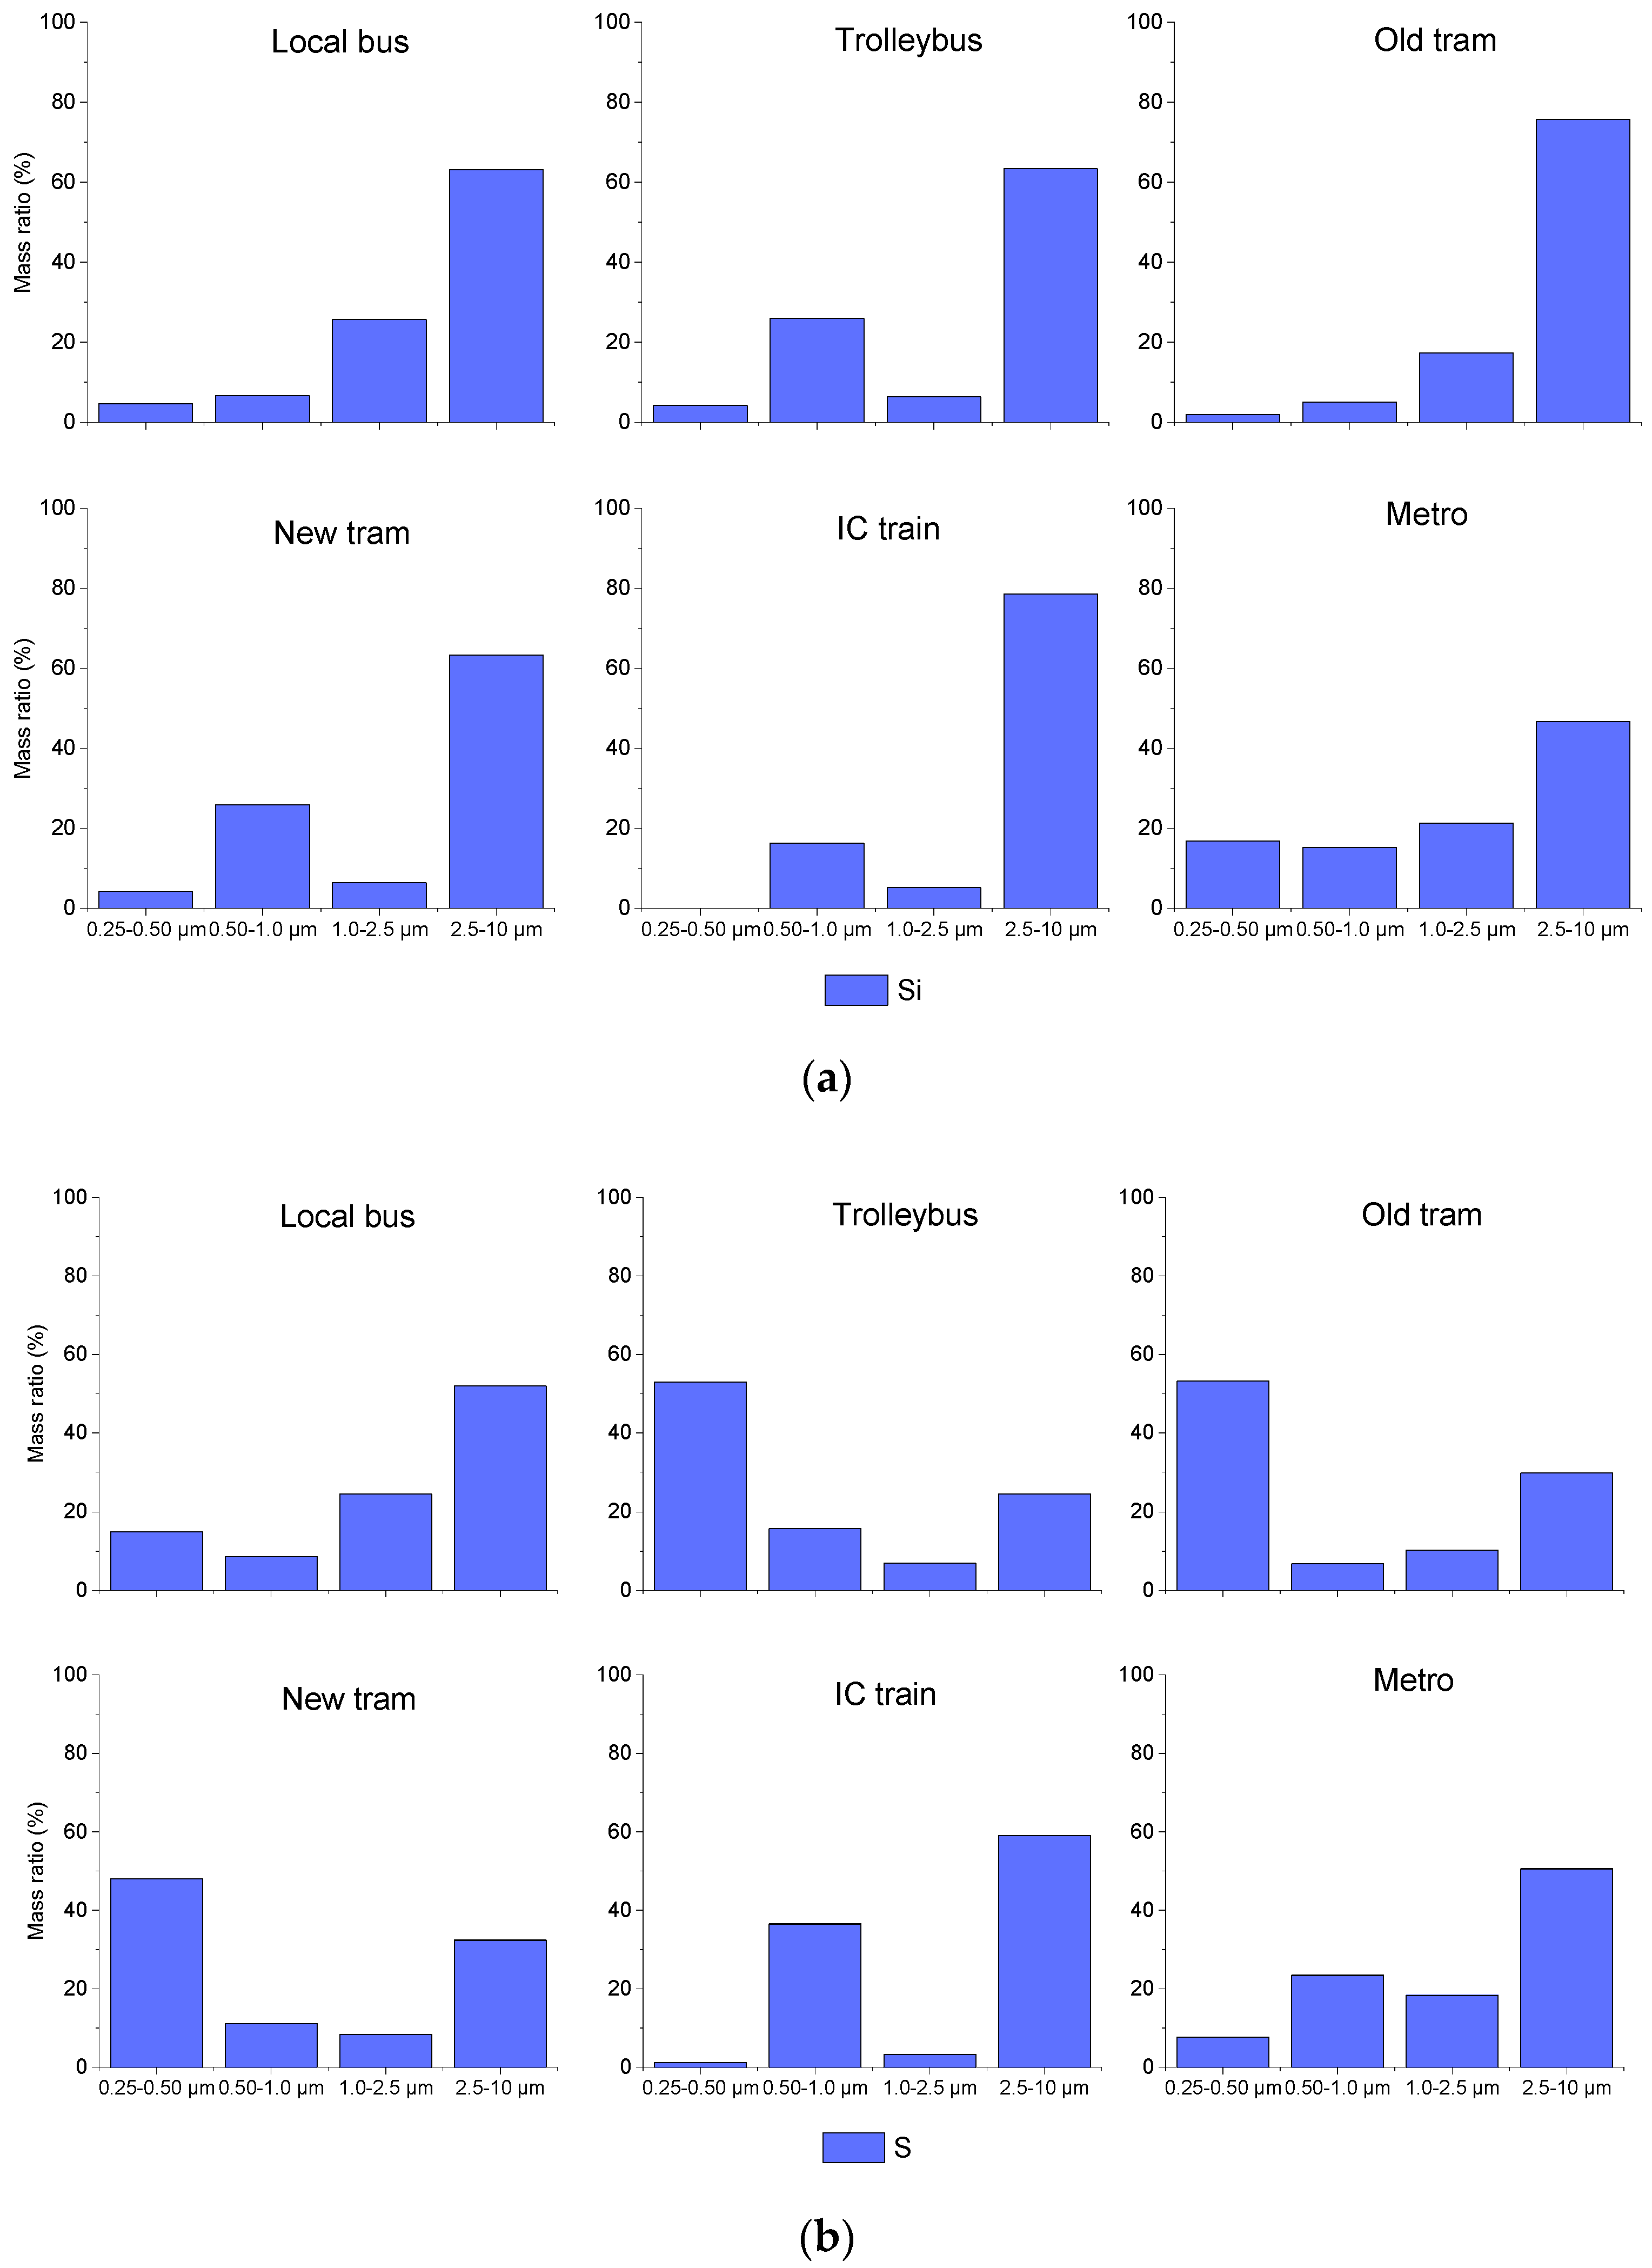
Table 6. In 2012, the observed elements exhibited high concentrations. EFs of Al, Si, P, K, Ca, V, Mn and Ba in all vehicles were below 10, which suggests soil resuspension as their source, whereas S, Cl, Cr, Fe, Cu, Zn and Pb had high EFs, indicating an anthropogenic origin. The enrichment factors of Mn and Fe were much higher in the case vehicles running on rails (i.e., tram and IC train) pointing towards an additional source of these elements.
Since the resuspension of soil was recognized as one of the main sources of PM pollution inside the vehicles, the contribution of mineral dust components was calculated using the formula: 1.9[Al] + 2.14[Si] + 1.4[Ca] + 1.3[K] +1.67[Ti] + 1.44[Fe] [
47] (our assumption is that the elements occur in their common oxide form). For vehicles running on rail, the enrichment factors of Fe were higher than 1. Therefore, the following formula was used to estimate the amount of Fe from the Earth’s crust [
16]:
where PM (Ti)
aerosol is the concentration of Ti in the aerosol sample, and (Fe/Ti)
crustal represents the concentration of X element in Mason’s average crustal rock composition [
34]. The calculations for mineral dust were based on the crustal Fe concentration.
In the coarse fraction, the contribution of mineral dust varied between 30 and 50%. The exceptions were the new tram with 70% and the IC train with only 5% mineral dust contribution. In the fine fraction, the contribution of mineral dust ranged from 5% (local bus 2012, IC train) to 25% (trolleybus, new tram), with two exceptions: old tram—60%, local bus 2014—45%. For vehicles running on rails, the contribution of non-mineral dust Fe (Nmd. Fe) to the Fe concentration varied between 70 and 99% in both size fractions, indicating railway abrasion as a primary source of in-vehicle pollution.
We assumed that primarily carbonaceous particles were responsible for the unaccounted mass [
48].
In 2014, the measured concentration data in the vehicles could be compared to outdoor data; hence, I/O ratios were calculated. We found that the elemental concentrations were significantly higher inside the vehicles than in the outdoor air, while the composition was similar. The highest I/O ratios were detected in the local bus, and the lowest in the new tram. Similar I/O ratios were found in the old tram and the trolley bus in both size fractions. In general, the I/O ratios were 5–10 times higher in the coarse fraction than in the fine fraction.
Nevertheless, the accumulation (I/O ratios) was higher for mineral dust elements, such as Al, Si, Ca, Ti and Ba, than for elements of anthropogenic origin (e.g., S, Zn, Pb or fine fraction K). The higher accumulation of mineral dust could be attributed to the resuspension of dust caused by traffic and passengers. The highest I/O ratios were measured in the bus and the lowest ones in the new tramcar. In the latter case, lower PM2.5 concentrations of elements of anthropogenic origin were measured indoor than outdoor, indicating that the air filtering system of the modern tram worked very effectively. Lower PM and elemental concentrations, by at least a factor of two, were measured inside the modern CAF trams than in the old type of trams, which had already been running for 18 years. For Cl, the I/O ratios and, thus, indoor enrichment were all higher than all of the other elements for all vehicle types, indicating an indoor source of chlorine.
In terms of each vehicle type, we found at least one element that was characteristic to that type, and its origin was the vehicle itself or its infrastructure. These elements were identified by the higher EF and indoor enrichment values and high I/O ratios. High Fe and Mn concentrations in the trams, trains and the metro originated from rail abrasion. Copper and zinc could come from the overhead wires in the case of the trams, the trolleybus and the train.
Different aerosol compositions and very high concentrations for some elements were observed inside the metro carriage. Enrichment factors of Mn, Fe, Br, Ba and Pb were much higher than in the aboveground vehicles. This could be explained by the fact that the metro railway systems have a closed character, restricted ventilation and special emission sources [
16]. Fe accounted for more than 50% of the measured mass, and other heavy metals, such as Cr, Mn, Cu, Br and Pb, were also present in remarkable concentrations. Their source could be rail abrasion. We note that these outdated Russian trains where we collected the samples are no longer operational. Very high PM
coarse concentrations were measured in the IC train on both occasions; however, in this case the measured elemental concentrations did not account for the elevated PM levels. Therefore, the samples were investigated by scanning electron microscopy to obtain better insight into the pollution in the trains (see
Section 3.4).
Figure 2 presents the indoor EF ratios of the different vehicles in 2014. In most cases, the indoor EF values were approximately 1, as expected. Nevertheless, some elements had higher values. In the buses, the indoor EF values were all approximately 1 for both fractions, suggesting that the pollutants originated from outside. Chlorine had the highest indoor enrichment in the trolleybuses and old and new types of trams. In the fine fraction, the source of chlorine was assumed to be sodium hypochlorite, which is used to clean the interior of vehicles. The origin of the coarse fraction of Cl is a question to which single particle analysis by SEM could provide answers. The indoor EF of zinc was above 1 in the trolleybuses and the two trams; it could originate from the overhead wires. Moreover, high iron and silicon values were identified in the trams. The most probable source of iron could be the rail and tram wheel abrasion.
3.4. Single Particle Analysis by Scanning Electron Microscopy
As mentioned earlier, the bulk composition did not provide satisfactory explanations as to the origin of pollution in some cases. One interesting question was the enhanced PMcoarse levels in the IC train and in the old tram and another was the origin of the very high concentrations of Cl inside some vehicles. Therefore, single particle analysis using scanning electron microscopy was performed on all coarse mode samples from all of the vehicles. Morphology together with its chemical composition of an aerosol particle provides important information about its origin, formation, aging and its possible impact on the environment and human health. The following particle types were identified: amorphous (i.e., Al–Si rich, Al–Si–Fe rich, Si rich and Fe rich), fibrous (i.e., C–O rich), cubic (i.e., KCl and NaCl), fiber (i.e., K rich) and filings (Fe rich).
Figure 4a shows amorphous particles (i.e., Al–Si–K–Mg rich) identified as mineral dust [
49]. This formation was found in all types of vehicles in great number.
Fe-rich filing particles (
Figure 4b) were observed in the Metro, which was unique to this vehicle. Such particles were responsible for the very high iron concentration measured in the underground train.
Chlorine appeared in the form of NaCl and KCl crystal cubes. Its origin was presumably salt remaining from winter de-icing in early spring and fertilizer in autumn [
50]. Mainly, KCl was found in the trolleybuses in September 2014 and NaCl in the case of the old tram in March 2012 (
Figure 4c). Furthermore, fibrous material with C and O contents were found in all of the samples (
Figure 4d), which suggests an organic origin. Such fibers occurred in a great number on the samples from the IC train. K-rich fiber particles were observed in 2014 in the old tram (
Figure 4e). One possible origin of the fibers are the seats, another is the air ventilating system.


 ,
, 


