Abstract
This study employed an onboard emission measurement system to measure the real-world emission factors of particulate matter (PM), particle-bound polycyclic aromatic hydrocarbons (PAHs), and gaseous air pollutants for different types of diesel-fueled non-road construction machines operated inside confined spaces within a brick manufacturing factory located in Taiwan. To the best knowledge of the authors, this is the first study that reports real-world PM, PAH, and gaseous pollutant emission factors for non-road engines in Taiwan. The mean real-world fuel-specific emission factors of PM, carbon monoxide, total hydrocarbons, and nitric oxide were 0.712–1.17, 8.27–17.9, 3.04–5.77, and 38.1–96.8 g/kg-fuel, respectively, for the test machines. Likewise, mean ΣPAHs emission factors ranged from 157 to 230 μg/kg-fuel for three types of test machines. Further, the average emission of particle-bound PAH per unit PM emission ranged from 213 to 384 μg-PAH/g-PM. Among the analyzed PAHs, the medium-molecular weight (3- and 4-ring) compounds contributed to the largest share of particle-bound PAH emissions. However, in terms of Benzo[a]pyrene equivalent (BaPeq) toxicity, the high-molecular weight (5- and 6-ring) PAHs were more important, as they had the highest BaPeq toxic emission factors. This study provides detailed composition and emission factors of particle-bound PAHs in non-road diesel construction machine emissions, which may be useful as a chemical fingerprint for source apportionment studies.
1. Introduction
Non-road engines are one of the major contributing sources of air pollutants in several parts of the world. It has been estimated that these would be the largest contributing sources of carbon monoxide (CO) and total hydrocarbon (THC) emissions in Asia by 2050 [1]. Non-road diesel construction machines are key sources of particulate matter (PM) and oxides of nitrogen (NOx). In London, the construction sector was the largest PM10 emission source and the fifth-largest NOx emission source in 2016 [2]. Likewise, non-road engines are major sources of air pollutants in China [3,4]. Due to the long lifespan and durability of non-road engines [5], the construction equipment fleet often consists of many old-model and old-age engines with little to no tailpipe emission control systems. Such engines could have disproportionately high contributions to the total emissions in a region. In addition, non-road engines are also subject to no or less stringent emission regulations in many countries and are being paid relatively less attention compared to on-road vehicles [2,6,7,8,9].
Measuring representative real-world emission factors for non-road engines is challenging due to the wide variation in the nature of work, operation modes, and working materials [2]. Many prior studies have employed onboard emission measurement systems to measure the real-world emissions of non-road construction machines [2,6,9,10,11,12,13,14]. These studies show that the real-world emission factors of pollutants for non-road construction machines vary by a wide range, because these might be affected by a multitude of factors, such as engine characteristics, operating patterns, working sites and materials, fuel types, and ambient environmental conditions [2,6,12,15,16]. Moreover, emissions of construction machines are often higher during real-world operation than during the regulatory test procedure [2,17].
Despite the importance of non-road mobile emission sources, studies conducted on the real-world emissions of these sources are still scarce in Taiwan and several other Asian countries [9]. Moreover, there exists only a limited amount of data for PM and toxic air pollutant emissions, such as polycyclic aromatic hydrocarbons (PAHs), for these sources. Due to the insufficient data on the chemical fingerprint of construction machine emissions, the non-road mobile emission sources are often ignored in the source apportionment studies [4]. Therefore, real-world emission factors of gaseous, particulate, and toxic air pollutants for non-road construction machines are needed for estimating emission inventory with better accuracy and overall air quality management [3,17]. Such data will also help develop and update the emission standards for non-road mobile emission sources.
PAHs are a group of compounds consisting of two or more aromatic rings and are generally emitted due to the incomplete combustion of carbon-based fuels, such as diesel and gasoline. PAHs are a common constituent of diesel engine exhausts [7] and are known to cause toxic effects on humans and animals [18]. Toxic emissions, such as PAHs, of non-road construction machines, should be paid more attention when the machines are operated in confined spaces than in open spaces. The operation of such machines within a confined space would restrict the dispersion of pollutants, leading to a high exposure risk to the machine operators and other workers. Wheel loaders, forklifts, and excavators are the common types of non-road engines operated inside the confined spaces of brick manufacturing factories in Taiwan. Due to the relatively restricted airflow inside the factory, the exhaust emissions accumulate in the factory premise, posing threats to the health of workers. Therefore, characterizing the toxic emissions of construction machines, such as PAHs, would provide valuable information for modeling the dispersion of pollutants and assessing the exposure of workers to these pollutants.
This study was conducted to measure the real-world emission factors of PM, gaseous pollutants (CO, THC, NO, CO2), and particle-bound PAHs for non-road diesel construction machines operated inside a brick manufacturing facility in Taiwan. PM and gaseous pollutants were measured in situ using an onboard emission measurement system, and PAHs were analyzed in the laboratory using PM samples collected during real-world operation. To our best knowledge, this is the first study to report real-world PM, PAH, and gaseous pollutant emission factors for non-road construction machines in Taiwan. The findings of this study fill the data gap on non-road diesel engine emissions and also help formulate and update the relevant emission standards in Taiwan.
2. Materials and Methods
2.1. Test Machines and Emission Sampling
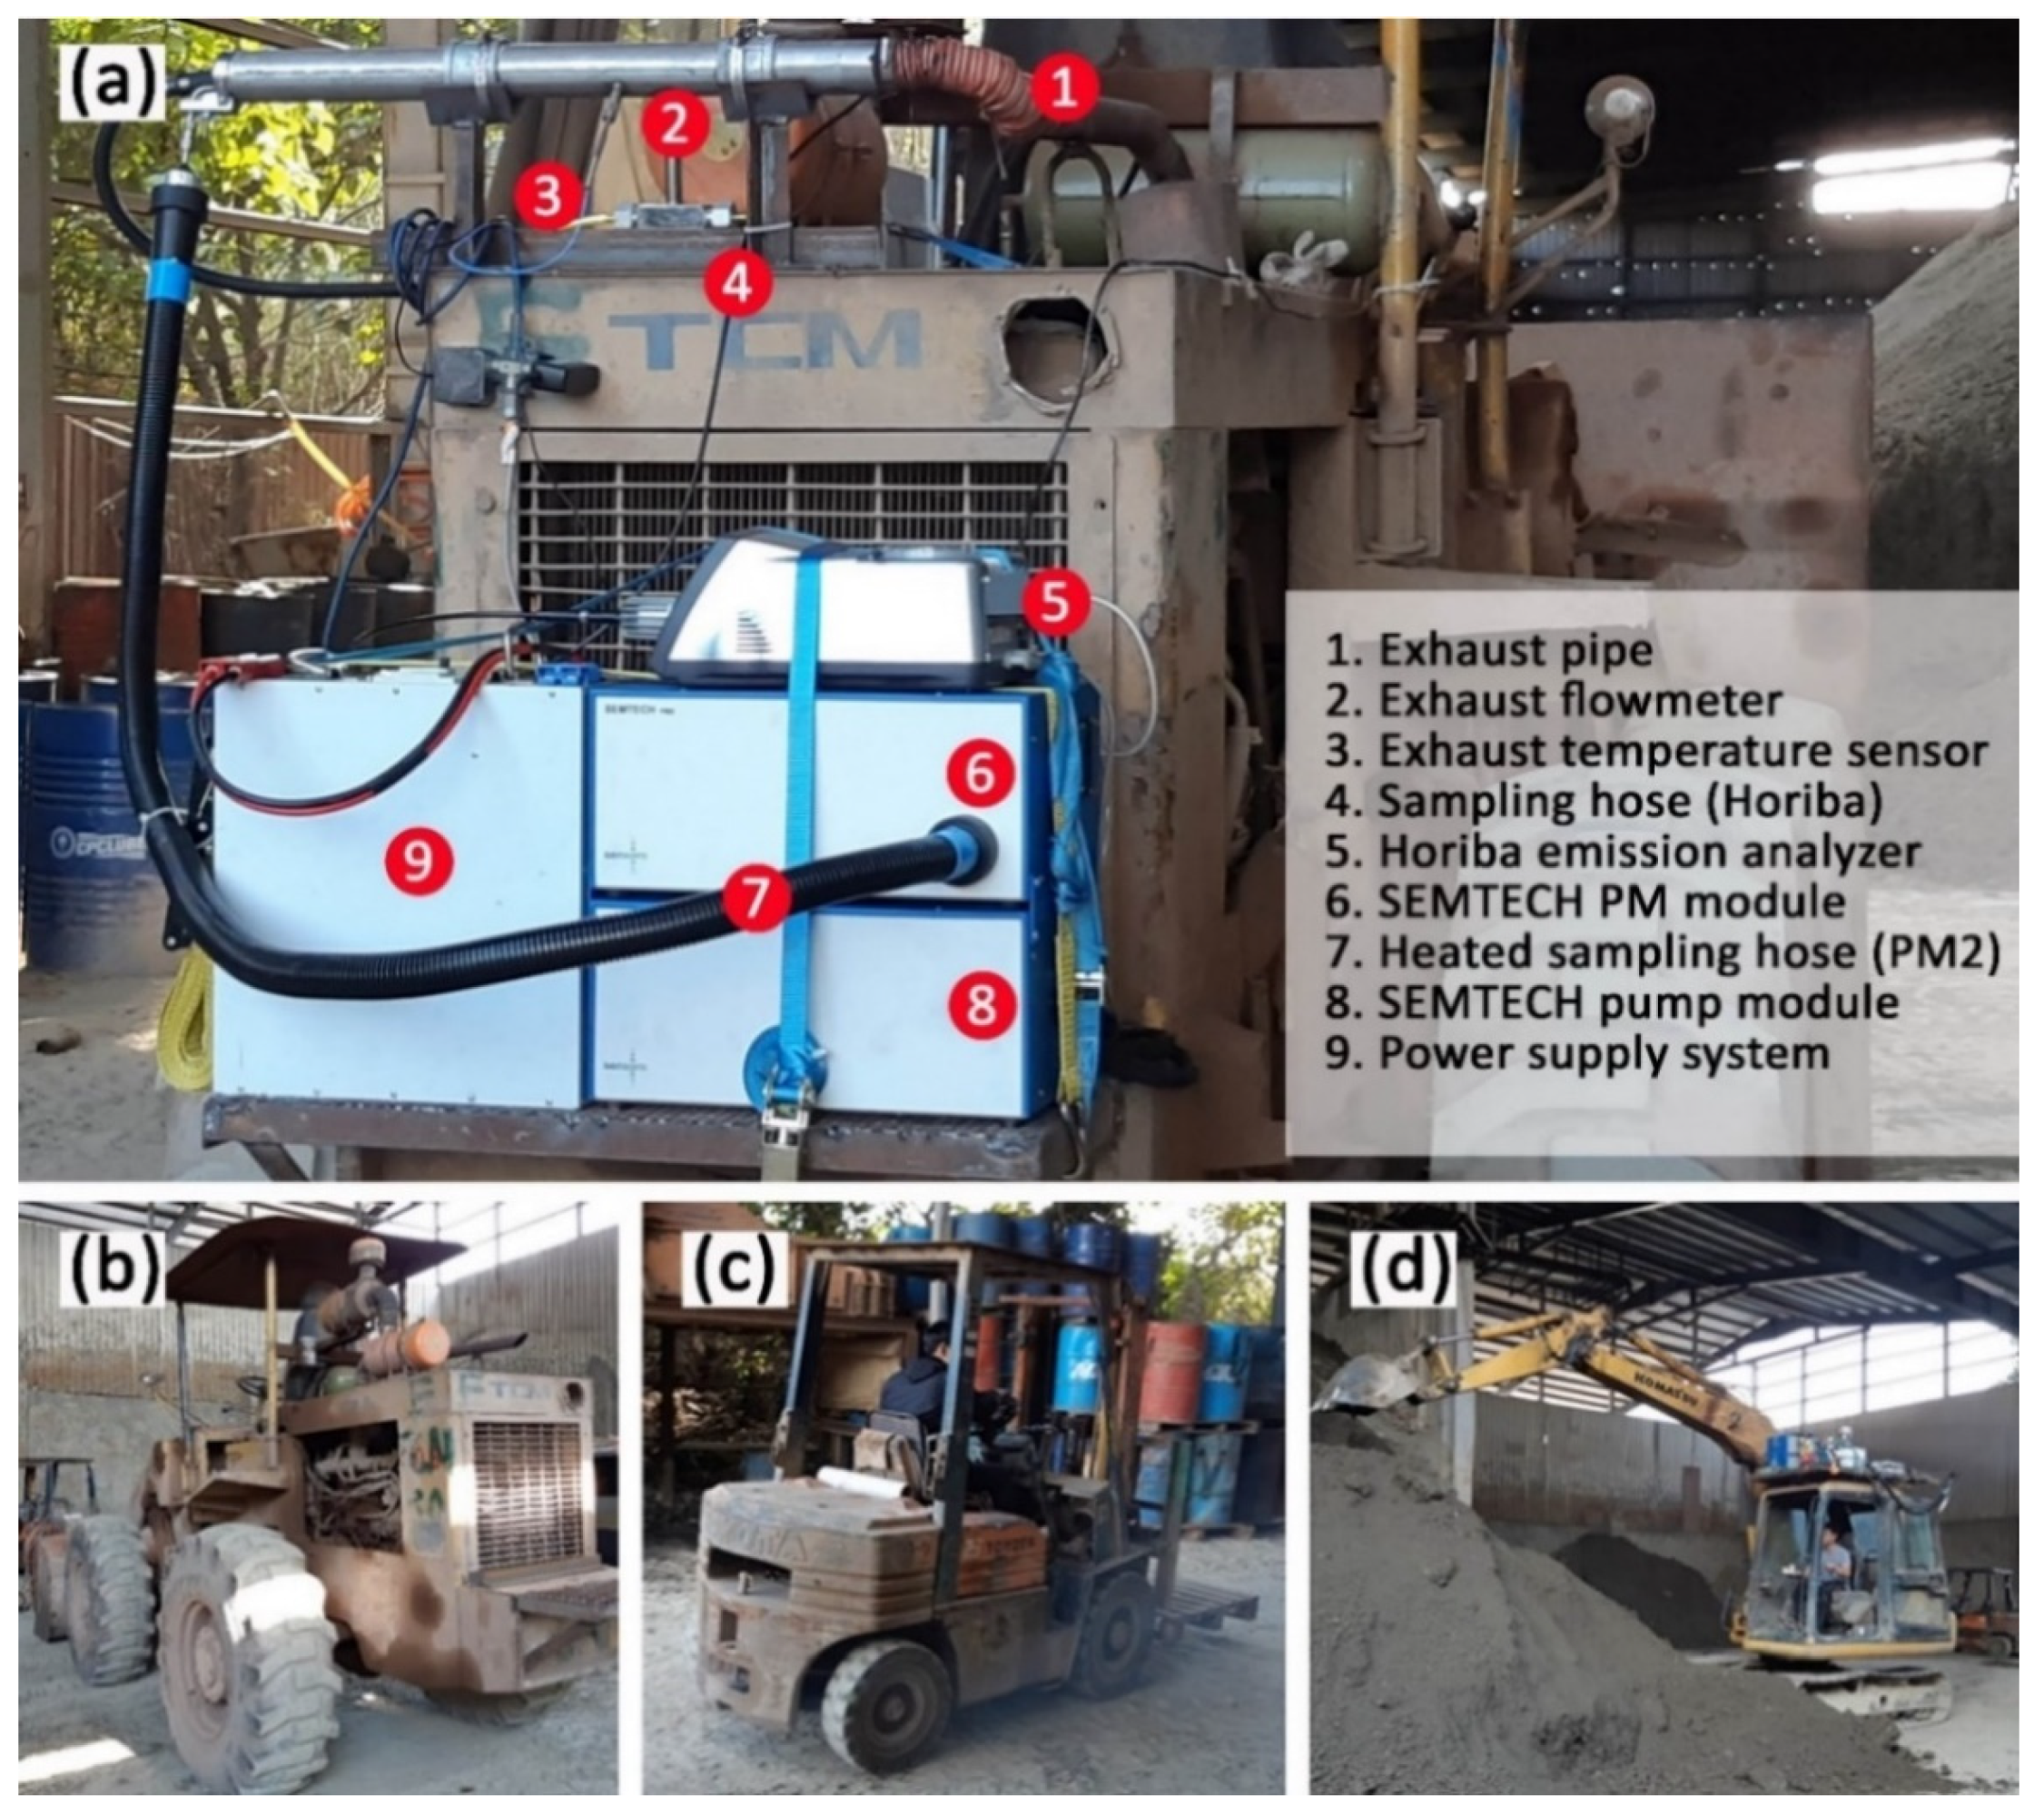
Real-world emission tests were conducted for a TCM wheel loader (WL, n = 3), a Toyota forklift (FL, n = 6), and a Komatsu excavator (EX, n = 8). The test machines are shown in Figure 1. The emission tests were conducted between January and May 2020. The average ambient pressure was 0.997 ± 0.005 atm (mean ± standard deviation, SD; hereafter, mean values are presented with SD) during the sampling period. The details of the samples, including the ambient environmental conditions (temperature, relative humidity) are provided in the Supplementary Materials (Table S1). Although a total of 17 real-world emission tests were conducted, the PAH analysis was performed for 11 samples only, which included the samples collected for WL (n = 2), FL (n = 4), and EX (n = 5). The brand, model, engine displacement volume, rated power, and the accumulated work hours of the test machines are presented in Table 1. The test machines were not equipped with any tailpipe emission control devices. All emission tests were conducted using diesel fuel with a sulfur content of ≤10 ppm. All emission tests were conducted inside a brick manufacturing facility, where excavators and wheel loaders are typically used for loading and unloading soil, and forklifts are used for transporting the manufactured bricks. Therefore, the emission tests for WL and EX were conducted with brick-manufacturing soil as the working material (digging, loading, and unloading soil piles), whereas those for EX were conducted with bricks as the working material (transporting bricks within the factory premises).

Figure 1.
Emission measurement system and test machines: (a) components of the onboard emission measurement system; (b) wheel loader; (c) forklift; (d) excavator.

Table 1.
Characteristics of test equipment.
2.2. Real-World Emissions Measurement
An onboard emissions measurement system consisting of a real-time PM analyzer (SEMTECH PM2, Sensors, Inc., Saline, MI, USA), a real-time gaseous pollutant analyzer (Horiba Mexa-584L, Horiba, Ltd., Kyoto, Japan), a pitot-based exhaust flowmeter, and an onboard power supply system was employed for the real-world emission measurement (Figure 1). The exhaust sample was drawn into the PM analyzer through a 2 m heated sample line (100 °C). The SEMTECH PM analyzer is equipped with a Pegasor PPS-M sensor that makes use of the ion mobility technique for the real-time PM mass measurement and a filter unit (three 47 mm filter holders) for the cumulative PM mass measurement. Both components were operated simultaneously while sampling. The PM filters were baked at 850 °C, conditioned at 20–23 °C temperature and 30–40% relative humidity for 24 h, and weighed before sampling. After sampling, the PM filters were stored in an icebox and transported to the laboratory for further analysis. The filters were again conditioned for 24 h, as mentioned above, and weighed to determine the collected cumulative PM mass.
The real-time PM concentration measured by Pegasor PPS-M should be corrected with a factor using the filter-based cumulative PM mass as the true value [19]. The corrected real-time PM data were calculated using Equations (1) and (2):
where PMc,i (μg/m3) is the corrected PM concentration for the time step i, PMr,i (μg/m3) is the raw PM concentration measured by the Pegasor real-time sensor for the time step i, DRP,i (unitless) is the Pegasor dilution ratio for the time step i, k (unitless) is the correction factor for the test session, w (μg) is the net PM mass collected on the filter, SFRi (m3/s) is the raw sample flow rate for the time step i, ti (s) is the duration of the time step i (1 s for 1 Hz data), and n is the total number of time steps or data points.
The Horiba automotive exhaust gas analyzer simultaneously measures CO, THC, and CO2 using non-dispersive infrared sensors. It was also equipped with electrochemical sensors for measuring O2 and NO. The analyzer also provides the air-fuel ratio using exhaust gas concentrations and the carbon balance method. Key specifications of the PM and gaseous analyzers and other measurement devices are provided in the Supplementary Materials (Table S2). It should be noted that the Horiba analyzer measures the exhaust gas concentrations on a dry basis (moisture in the exhaust sample is removed before the measurement of concentrations). Therefore, a dry-to-wet correction was applied to the second-by-second emission concentration data prior to further analysis. The detailed procedure of dry-to-wet correction when the gaseous concentrations are measured on a dry basis has been provided in the authors’ prior study [20].
In addition to the emission measurement, the real-world duty cycles of three types of test machines were also characterized. For this, a video camera was mounted on the test machine, and the video of the operation was recorded with a time stamp. Later, the video record was manually analyzed to characterize the operation cycle into idling (engine turned on, but not moving or working), moving (moving without working material load), and working (working or moving with working material load) modes.
2.3. Analysis of Particle-Bound PAHs
Particle-bound PAHs were analyzed in PM samples collected on 47 mm quartz fiber filters. The filter PM samples were Soxhlet extracted before analysis. The extraction procedure has been explained in detail in the authors’ prior study [19]. The PAH analysis was performed using a system of gas chromatography–mass spectrometry (GCMS) (Agilent 6890N GC/5975 MS, Agilent Technologies, California, United States). The GC was equipped with a DB-5MS ultra inert column (Agilent Technologies, California, United States) with the dimensions 30 m (length), 0.25 mm (internal diameter), and 0.25 μm (film thickness). The GC temperature program was as follows: 50 °C (hold for 1 min), heated to 250 °C with 15 °C/min ramp, 250 °C (hold for 2 min), heated to 310 °C with 10 °C/min ramp, and finally hold for 1 min at 315 °C. The speciated PAHs were quantitated with a calibration prepared using a 16-component PAH standard in methanol (50%) and dichloromethane (50%) (100 μg/mL, AccuStandard, Inc., New Haven, CT, USA). The relative standard deviations of all calibrations were less than 30%. The analyzed PAH components are as follows: naphthalene (Nap), acenaphthylene (Acy), acenaphthene (Ace), fluorene (Fl), phenanthrene (Phe), anthracene (Ant), fluoranthene (Flu), pyrene (Pyr), benzo[a]anthracene (BaA), chrysene (Chr), benzo[b]fluoranthene (BbF), benzo[k]fluoranthene (BkF), benzo[a]pyrene (BaP), dibenzo[a,h]anthracene (DahA), indeno[1,2,3-c,d]pyrene (IcdP), and benzo[g,h,i]perylene (BghiP).
2.4. Toxic Equivalent Emission Factors of PAHs
In addition to the mass emission factors of speciated PAHs, the toxic equivalent emission factors were also calculated. The toxic equivalent emission factor was obtained as the product of the mass emission factor and toxic equivalent factor (TEF) for each PAH species. The TEF values were adopted from the study by Nisbet and LaGoy [18].
3. Results and Discussion
3.1. Operation Mode Characterization
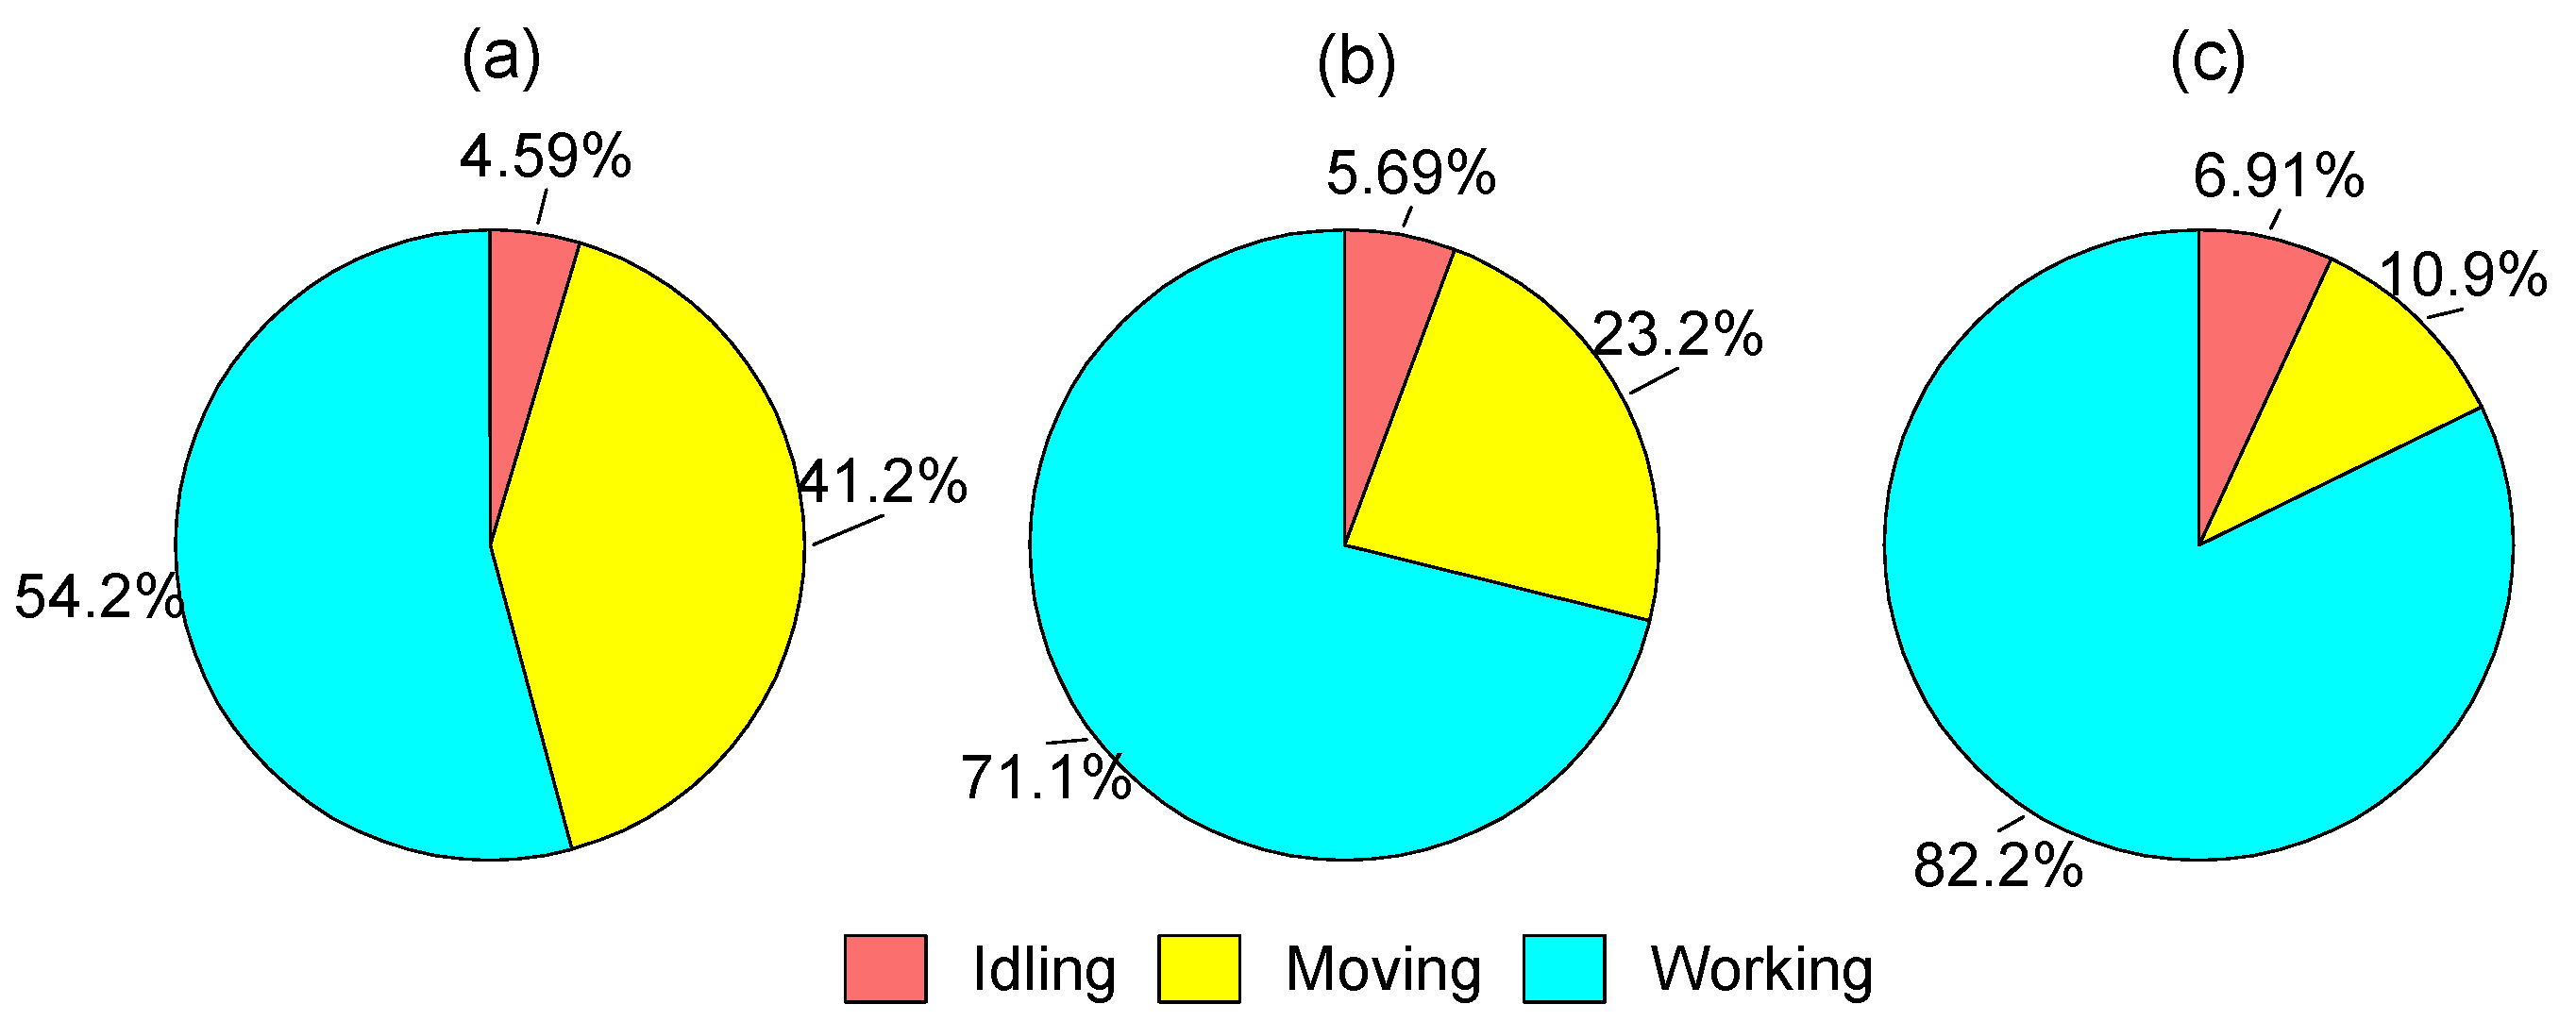
The real-world operation mode shares of test machines are presented in Figure 2. For all three types of test machines, the highest shares were observed for the working mode. Among the three types of equipment, the highest working mode share was observed for EX (82.2%), followed by FL (71.1%) and WL (54.2%). These data indicate that EX might have higher load factors than WL and FL. Likewise, the moving mode had the second-highest share in the duty cycles of all three construction machines. The highest moving mode share was observed for WL (41.2%), followed by FL (23.2%) and EX (10.9%). The lowest moving mode share was observed for EX, because excavators are often stationed at a location while working. The idling mode shares were fairly similar for all three types of construction machines (4.59–6.91%). A study reported that a typical forklift duty cycle includes 7.4% idling, 24.6% moving, and 68.0% working timeshares [3], which are close to those obtained for FL in the present study.
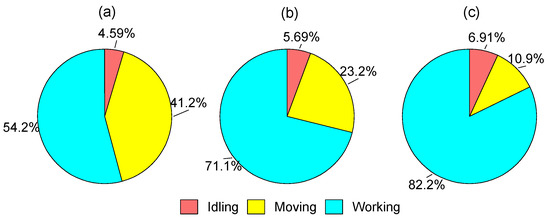
Figure 2.
Real-world operation modal share for test machines: (a) WL; (b) FL; (c) EX.
3.2. PM and Gaseous Pollutant Emission Factors
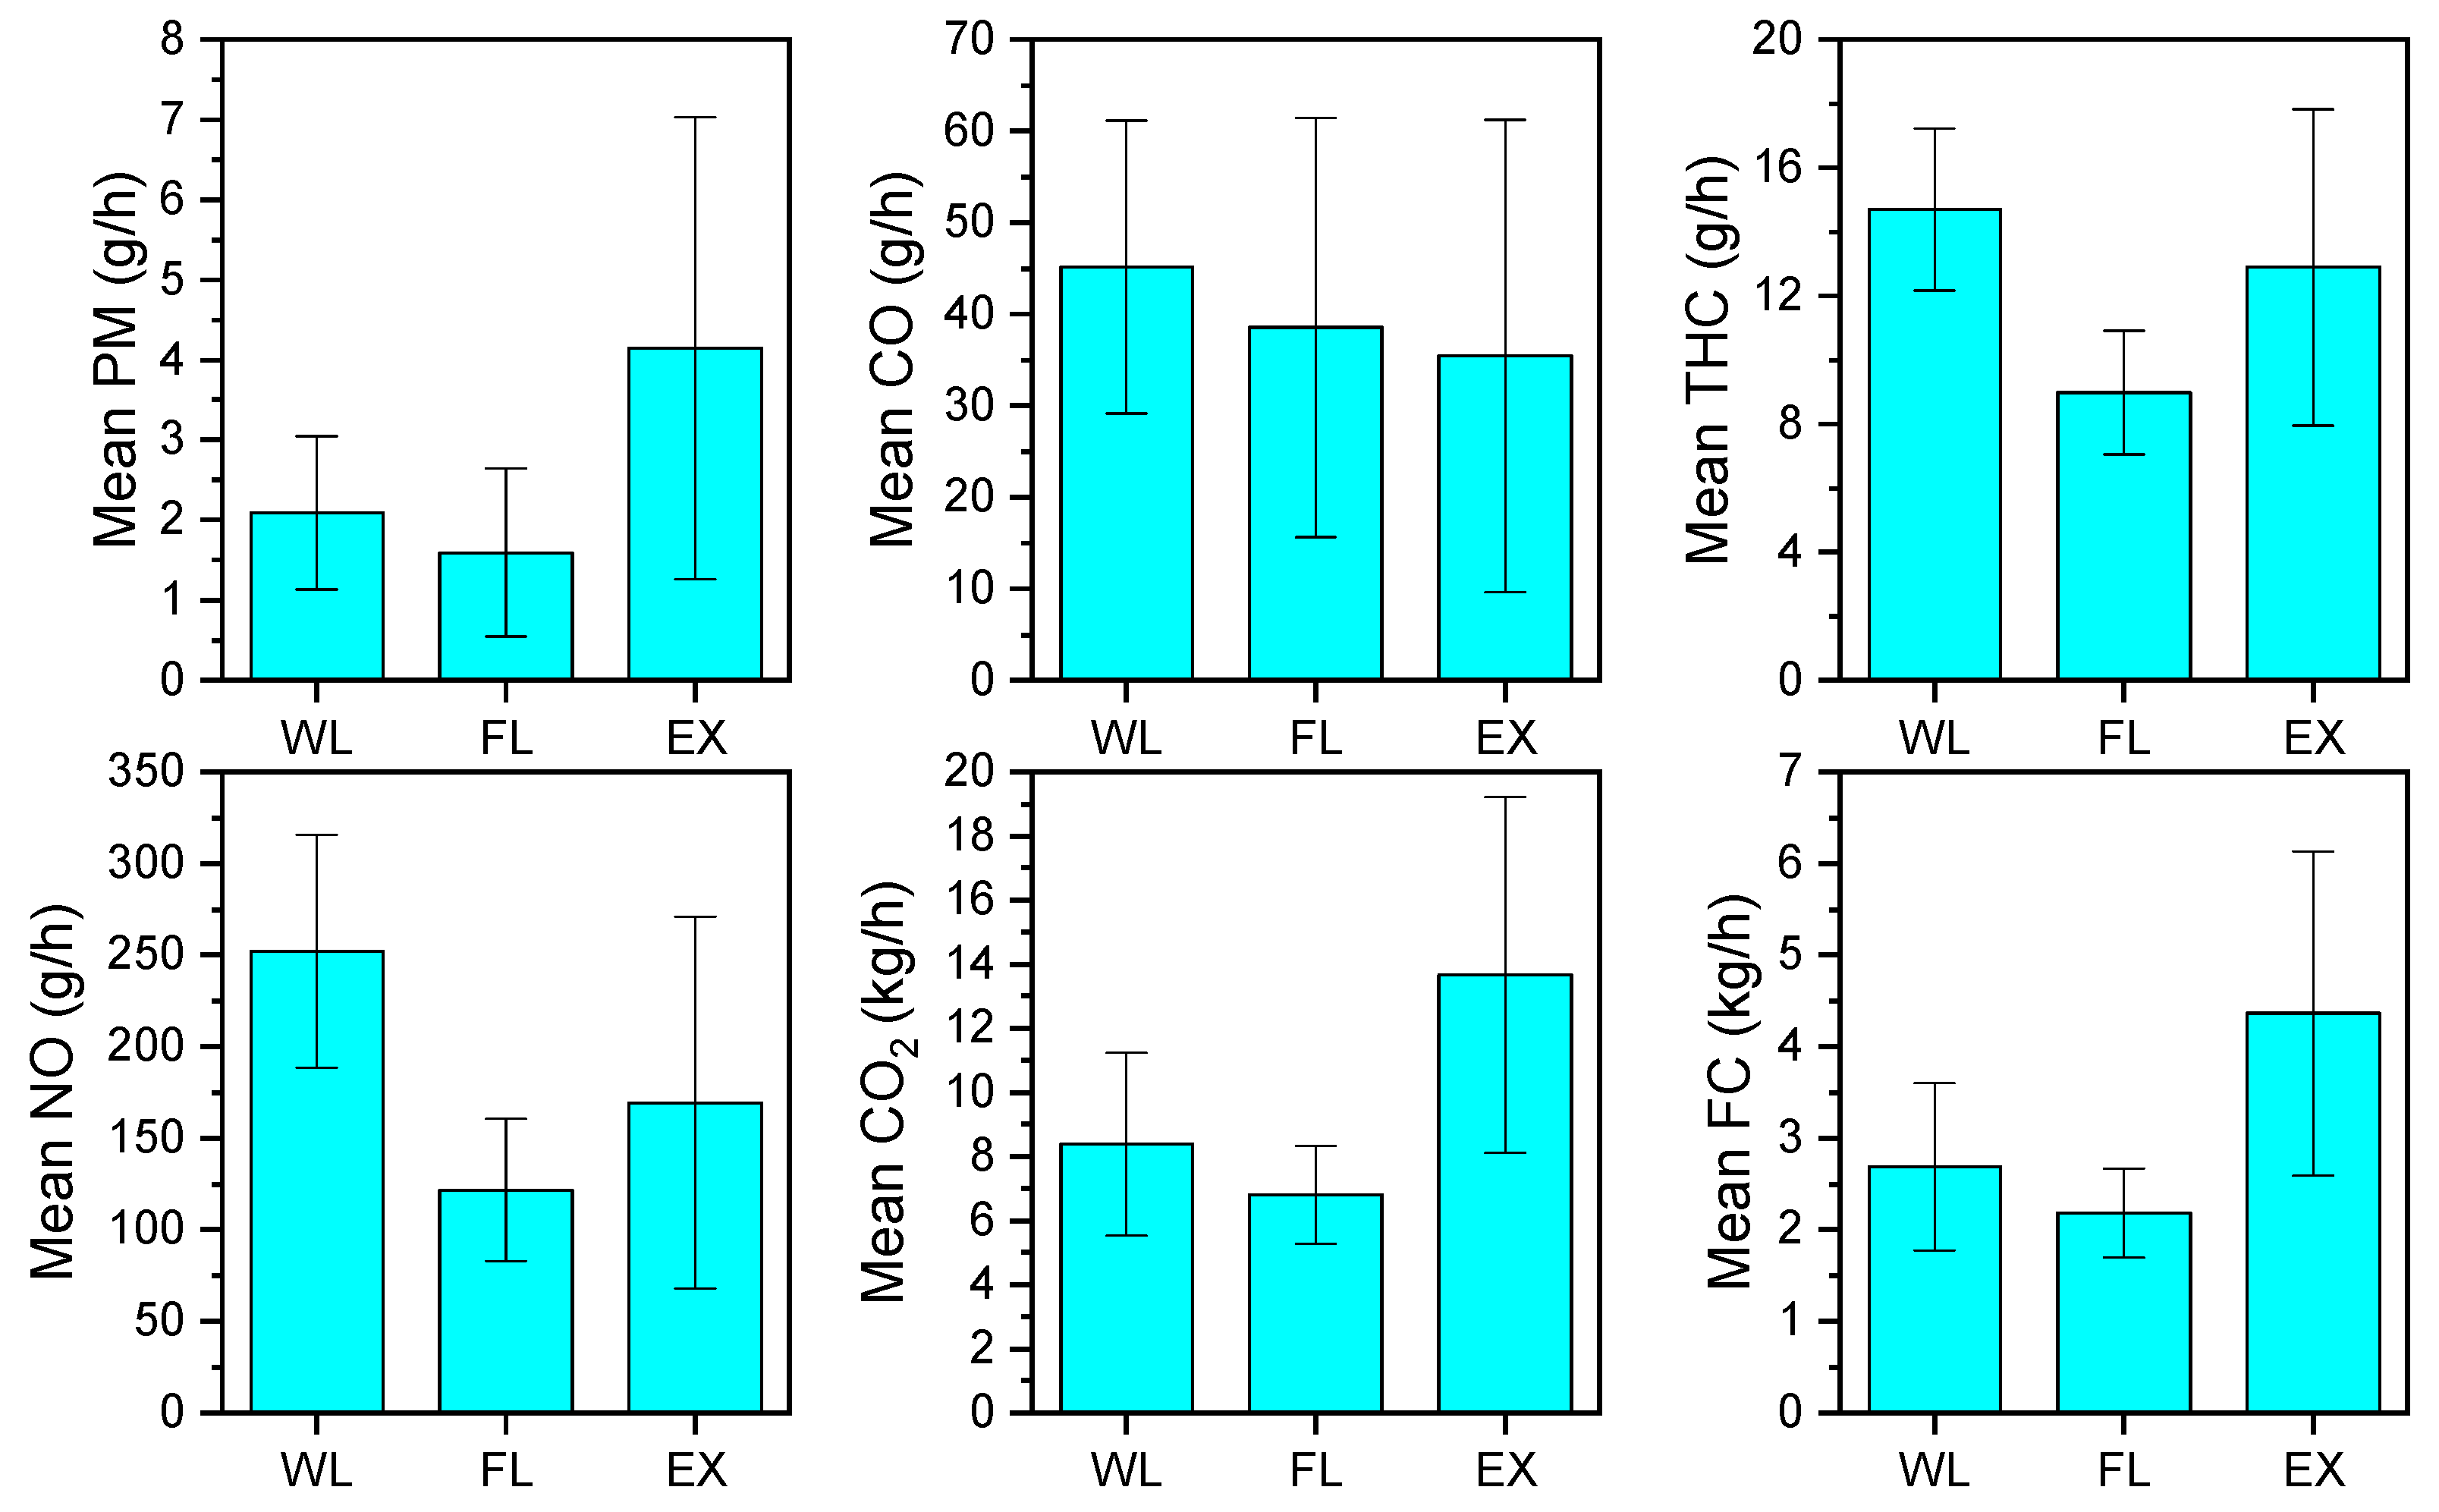
Figure 3 presents the mean time-specific emission factors of PM, gaseous pollutants, and time-specific fuel consumption (FC) rates for the three types of test machines. The mean PM emission factor was highest for EX (4.15 ± 2.88 g/h), followed by WL (2.09 ± 0.96 g/h) and FL (1.59 ± 1.05 g/h). Likewise, the CO2 emission factor and the FC rates were also found highest for EX. However, CO, THC, and NO emission factors were found highest for WL. For most pollutants, the lowest emission rates were observed for FL, which could be due to its smallest engine displacement volume, consequently having the lowest FC rates. However, the construction machine with the largest engine displacement volume (i.e., WL) was not always the highest emitter. For example, despite having a smaller engine displacement volume, EX had higher mean emission factors of PM and CO2 than WL. EX had the highest-rated power among the test machines (Table 1). Therefore, the highest emission factors of PM, CO2, and FC observed for EX among all test machines might be associated with the higher power output of EX during the real-world operation. The observed differences in the emission rates might have been influenced by the duty cycle and the nature of the work. The nature of the work affects the engine load factor and hence the emission rates. Load factors of the construction machines have been found to vary widely during real-world operation. For example, a prior study reported load factors ranging from 19% to 63% for various types of construction machines [5]. Although load factors were not measured in the present study due to the unavailability of onboard diagnostics, different test machines likely had varying load factors during the real-world operation as suggested by the operation mode shares discussed in the previous section. This might be the major reason for the differences in the emission factors of the pollutants for the different construction machines.

Figure 3.
Mean ± SD of real-world time-specific emission factors of PM and gaseous pollutants and fuel consumption rates.
In a study conducted by Pang et al., time-specific emission factors of forklifts (engine displacement volume, 2.7–6.9 L) were 1.4–17.5 g/h for PM2.5, 15.8–56.1 g/h for CO, 5.0–16.4 g/h for THC, and 15.8–60.1 g/h for NO during different duty modes [3]. These emission factors generally agree with those obtained in the present study, except for NO. The NO emission factors obtained in the present study for FL were approximately two to five times those reported in the study by Pang et al. [3]. The average FC rates were found to be 2.69 ± 0.914 kg/h (WL), 2.18 ± 0.488 kg/h (FL), and 4.36 ± 1.77 kg/h (EX). The FC rate was lowest for FL, which had the smallest engine displacement volume, and the highest FC rate was observed for EX. Likewise, WL had a lower mean FC rate than that of EX, despite WL having a significantly larger engine. This could be the result of the differences in the rated power of the engine and the nature of the work. Previous studies have also shown that the excavators have higher FC rates than other construction machines. For example, in a prior study, a 3.9 L EX had an FC rate of 7.19 L/h, and 5.9–6.0 L WL had FC rates ranging from 3.41 to 6.43 L/h [10]. Therefore, the FC rates obtained in the present study make a reasonable comparison with those reported by the previous works.
Table 2 presents the mean fuel-specific emission factors of PM and gaseous pollutants for WL, FL, and EX. The mean PM emission factor was highest for EX (1.17 ± 1.07 g/kg-fuel), followed by WL (0.916 ± 0.623 g/kg-fuel), and FL (0.712 ± 0.331 g/kg-fuel). However, the THC and NO emission factors were found highest for WL. Despite having the smallest engine displacement volume, FL did not have the lowest fuel-specific emission factor for all pollutants. For example, it had the highest emission factor of CO (17.9 ± 10.2 g/kg-fuel) among the three types of test equipment. In a prior study conducted by Pang et al., the fuel-specific emission factors during different operation modes were 2.8–7.7 g/kg-fuel for PM2.5, 15.5–23.2 g/kg-fuel for CO, 5.8–8.2 g/kg-fuel for THC, and 21.8–27.5 g/kg-fuel for NO for diesel forklifts [3]. The PM emission factors obtained in the present study were much lower than those reported by Pang et al. [3], whereas the NO emission factors were higher in the present study. The emission of thermal NOx is favored at higher temperatures and in an excess of air. Relatively higher emission factors of NO in the present study suggest a higher combustion temperature and an excess of air, which might have caused relatively lower PM emissions due to the more complete combustion of fuel. Hu et al. measured the real-world fuel-specific emission factors of PM, CO, THC, and NOx for EX, WL, bulldozers, and rollers [7], which were close to those obtained in the present study. Similarly, Cao et al. reported the real-world fuel-specific emission factors for a wide variety of construction machines, with the engine displacement volume ranging from 4.5 to 15.2 L [5]. The THC and NO emission factors measured in the present study were relatively higher than those reported by Cao et al., and the emission factors of PM, CO, and CO2 were comparable in both studies. Likewise, Frey et al. measured the real-world emission factors of a wide variety of diesel non-road construction machines [10]. The fuel-specific emission factors obtained in the present study were well within the range of emission factors reported by Frey et al., except for the NO emission factor. In summary, the emission factors obtained in the present study generally make a reasonable comparison with those reported by previous studies.
Table 2.
Fuel-specific emission factors (g/kg-fuel) of test machines compared with those reported in the literature.
Table 3 presents the variabilities in the time- and fuel-specific emission factors in terms of the coefficient of variation (CV). The table shows that the CVs were often lower for fuel-specific emission factors than for time-specific emission factors, with a few exceptions for PM, THC, and NO. For example, the CVs of time-specific CO emission factors were 35.4% for WL, 59.5% for FL, and 72.8% for EX, whereas those of fuel-specific emission factors were 13.9% for WL, 57% for FL, and 49.4% for EX. For CO2, the variability was very low (CV 0.184–0.519%) for fuel-specific emission factors compared with time-specific emission factors (CV 22.5–40.7%). Depending on the engine size and power, the time-specific FC can vary widely, which can consequently cause a wide variation in the time-specific exhaust emission factors among construction machines. However, the fuel-specific emission factor, which is the exhaust emission rate divided by the FC rate, may not vary much among the construction machines with similar engine technologies due to the simultaneous increase or decrease in emission rates with FC rates for construction machines with different engine sizes. In other words, a lower CV indicates a close-to-linear relationship between the emission and FC rate, and a higher CV indicates that the relationship between emissions and FC deviates more from linearity or has a more complex relationship. The results obtained in the present study suggested that it would be more accurate to calculate emission inventories based on fuel-specific emission factors than time-specific emission factors. A prior study also reported that fuel-specific emission factors had lower variability than time-specific emission factors for diesel forklifts [3], and these results agree with those obtained in the present study.
Table 3.
Coefficient of variation (%) of time-specific and fuel-specific emission factors.
3.3. PAH Emission Factors
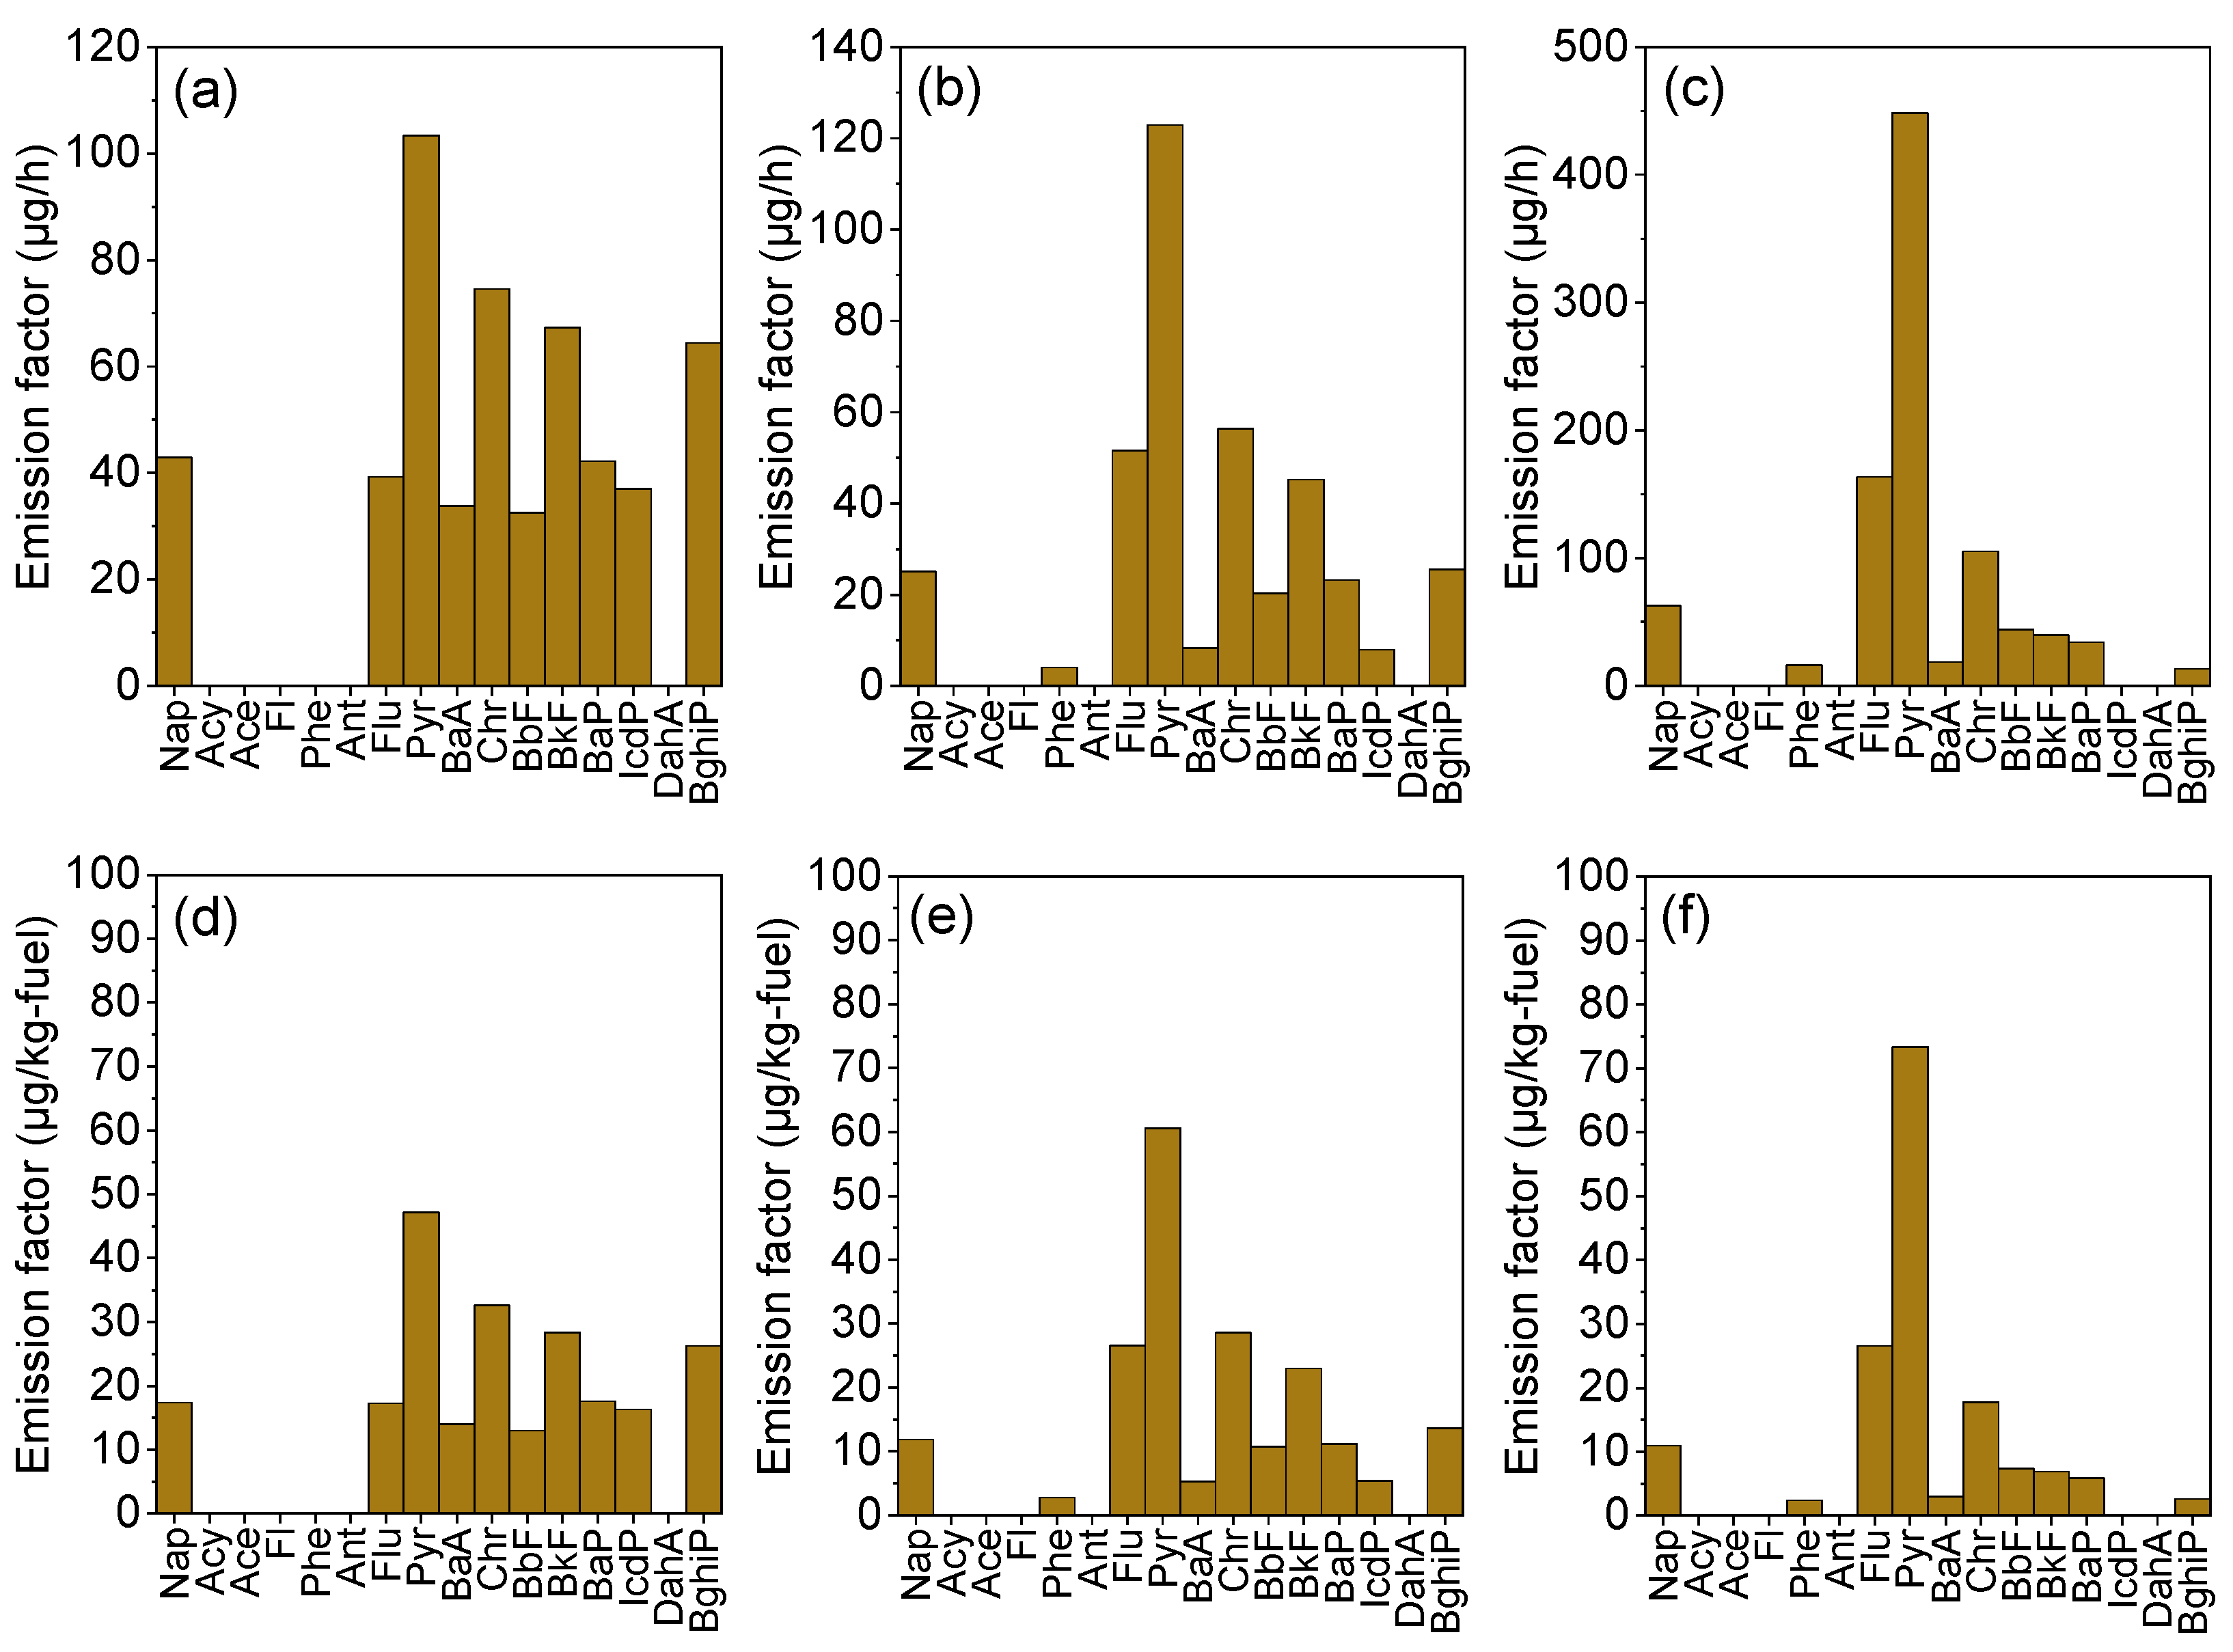
Figure 4 presents the time-specific emission factors of all analyzed PAHs for WL (Figure 4a), FL (Figure 4b), and EX (Figure 4c). As the figure depicts, the highest mean emission factors were obtained for Pyr in all test machines, which ranged from 103 μg/h for WL to 448 μg/h for EX. Other frequently detected PAHs in the exhaust of test machines were Nap, Flu, BaA, Chr, BbF, BkF, BaP, and BghiP. Figure 4d–f shows the fuel-specific emission factors of all analyzed PAHs. Similar to the above result, the fuel-specific emission factor was also highest for Pyr among the detected PAH species. The average Pyr emission factors were 47.2 μg/kg-fuel for WL, 60.6 μg/kg-fuel for FL, and 73.4 μg/kg-fuel for EX.

Figure 4.
PAH emission factors: (a) time-specific emission factors for WL; (b) time-specific emission factors for FL; (c) time-specific emission factors for EX; (d) fuel-specific emission factors for WL; (e) fuel-specific emission factors for FL; (f) fuel-specific emission factors for EX.
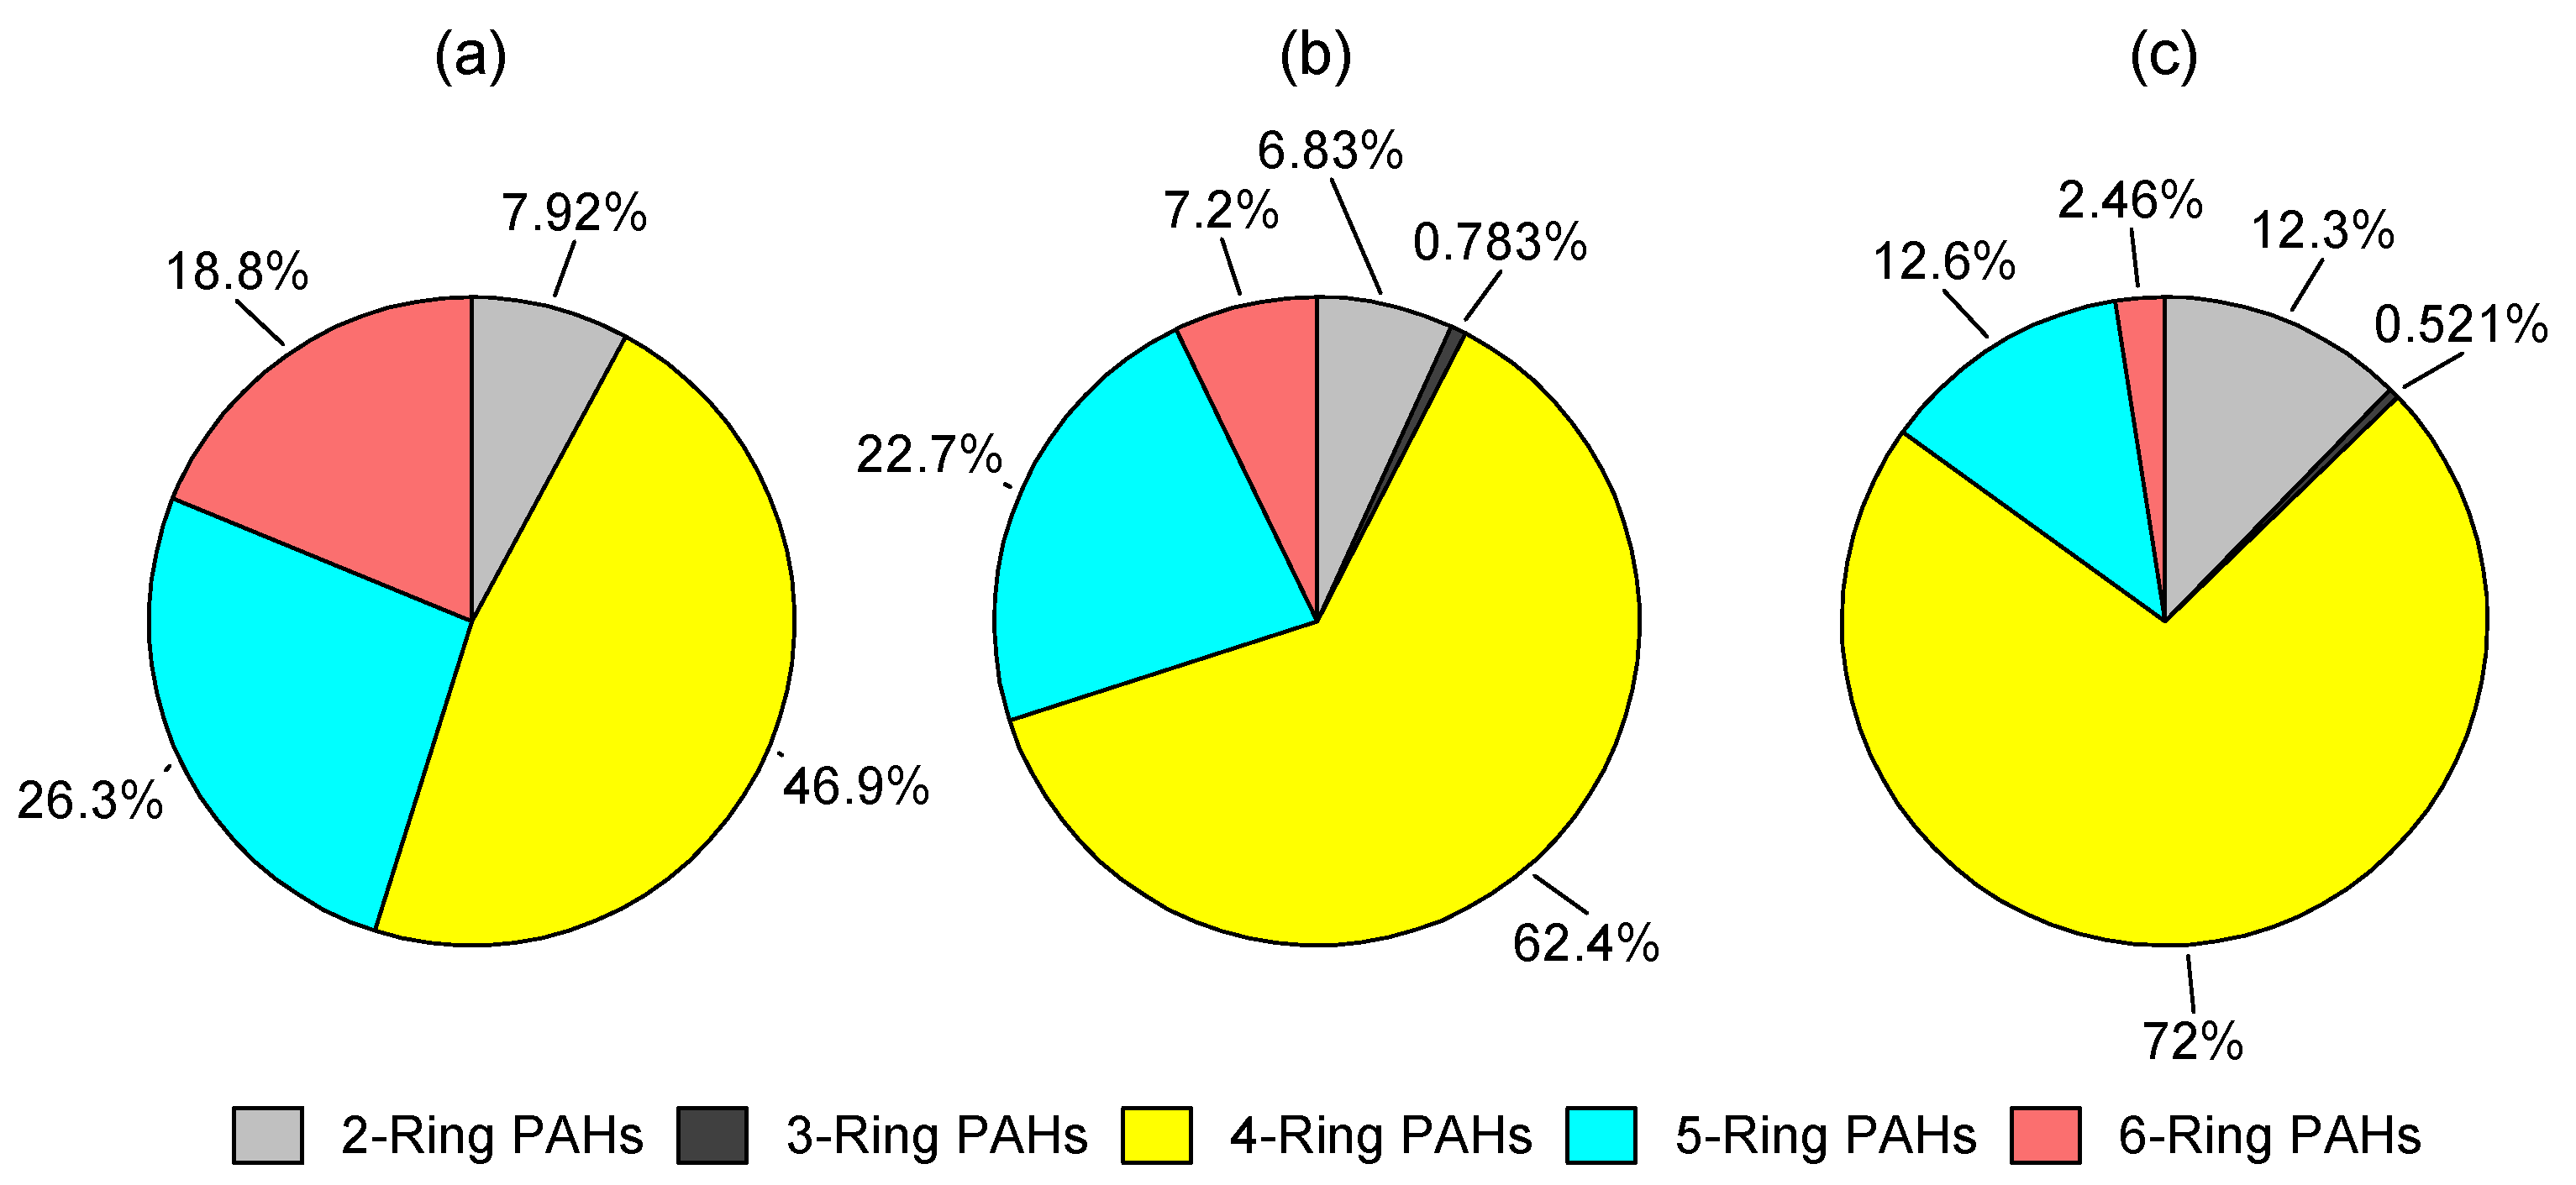
The chemical profile of particle-bound PAHs expressed as the ratio of the emission factor of an individual PAH compound to the ΣPAH emission factor was prepared and presented in the Supplementary Materials (Table S3). Furthermore, PAHs were categorized into low-molecular weight (2-ring), medium-molecular weight (3- and 4-ring), and high-molecular weight (5-, 6-, and 7-ring) PAHs [21]. As Figure 5 depicts, low- and medium-molecular weight PAHs accounted for a large fraction of particle-bound PAHs mass emissions (46.9% for WL, 63.2% for FL, and 72.6% for EX). In a prior study, low molecular weight PAHs (2-ring) and medium molecular weight PAHs (3- and 4-ring) were the major particle-bound PAHs in construction machine emissions, which together accounted for 77.3–88.3% of total PAHs [21]. These results generally agree with those obtained in the present study.
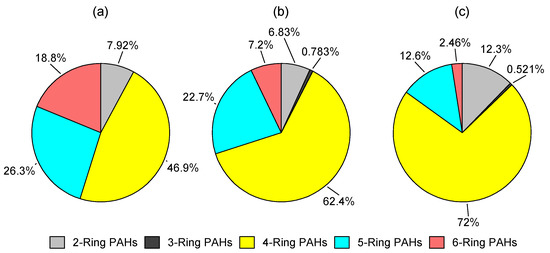
Figure 5.
Distribution of PAHs emissions according to the number of aromatic rings: (a) WL; (b) FL; (c) EX.
The ratios of the sum of PAHs to PM (μg of PAH per g of PM emitted) were also calculated for different test machines. The average PAH-to-PM ratios were 384 (0.0384%), 238 (0.0238%), and 213 (0.0213%) μg-PAH/g-PM for WL, FL, and EX, respectively. The PAHs to PM ratios did not differ much among the three types of engines in the present study. In a prior study [7], the ratios were 0.05–0.12% for EX and 0.07–0.09% for WL, which were relatively higher than those obtained in the present study. A prior study conducted by the authors on on-road diesel trucks found the PAH-to-PM ratios to range from 200 (0.0200%) to 233 (0.0233%) μg-PAH/g-PM [19], which were lower than those obtained in the present study. These results suggested that PM emissions from construction machines are likely more toxic than those emitted from on-road diesel vehicles, because the former contained more PAH per unit of PM mass emitted.
Molecular diagnostic ratios (MDR) of PAHs can provide useful information for source apportionment studies when the atmospheric contaminants are contributed by a few strong sources [22]. The MDRs, namely Flu/(Pyr + Flu), BaA/(Chr + BaA), BaP/BghiP, IcdP/(BghiP + IcdP), and BbF/BkF, were calculated in the present study. The mean MDRs for all test machine samples are presented in Figure 6. Mean Flu/(Pyr + Flu) was 0.266 ± 0.0472 (CV = 17.7%), mean BaA/(Chr + BaA) was 0.330 ± 0.0770 (CV = 23.3%), mean BaP/BghiP was 0.828 ± 0.255 (CV = 30.8%), mean IcdP/(BghiP + IcdP) was 234 ± 0.218 (CV = 93.1%), and mean BbF/BkF was 0.635 ± 0.274 (CV = 43.1%). As depicted by CV, the highest repeatability (lowest variability) was observed for Flu/(Pyr + Flu), indicating that this MDR can be a good indicator of diesel exhaust emission. Figure 6 also compares the MDRs obtained in the present study with those calculated based on the emission data obtained from prior studies for various types of on-road and non-road diesel exhaust emissions [7,19,21,23,24]. The MDRs obtained in the present study compare fairly well with those reported in the literature. Among the MDRs, the values of Flu/(Pyr + Flu) and BaA/(Chr + BaA) were most similar to those reported in the literature. The comparison, however, indicated that the MDRs may not discriminate particle PAH emissions from on-road and non-road diesel engines as both types of engine exhausts had fairly similar MDRs.
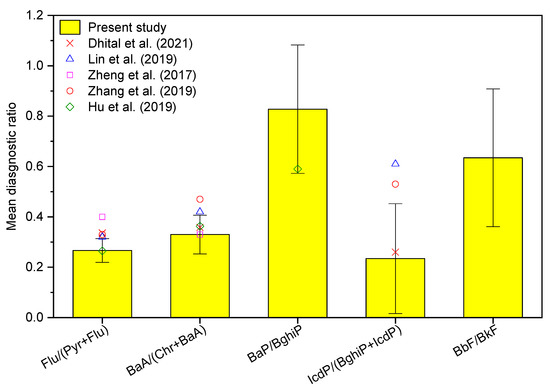
Figure 6.
PAH diagnostic ratios obtained in the present study compared with those reported or calculated based on the emission data obtained from the literature [7,19,21,23,24] for various types of on-road and non-road diesel exhaust emissions for diesel exhaust emissions.
3.4. Toxic Equivalent Emission Factors of PAHs
The time- and fuel-specific toxic emission factors of PAHs are presented in Table 4. Although Pyr was the most abundant PAH in terms of the mass emission factor per unit time or fuel consumption, it was not the major PAH in terms of the toxic potency emission factor. As depicted by the table, the most abundant PAH with the highest time- and fuel-specific BaPeq toxicity was BaP for all test machines. Not all PAH species are equally toxic. Among the analyzed PAHs, the compound with the highest toxicity was BaP, with the TEF equal to one [18]. Therefore, BaP was the most important species in the construction machine exhaust in terms of PAH toxicity. Other major PAHs contributing to the BaPeq toxic emission factors were BkF, BbF, and BaA. The compounds with high BaPeq toxic emission factors were high-molecular weight PAHs, whereas the low- and medium-molecular weight PAHs had negligible contributions to the total BaPeq toxic emission factors.
Table 4.
Time- and fuel-specific toxic potency emission factors of PAHs for different types of construction machines.
4. Conclusions
This study measured the real-world time- and fuel-specific emission factors of PM, gaseous air pollutants, and particle-bound PAHs for three common types of non-road construction machines, namely wheel loaders, forklifts, and excavators, operated inside a brick manufacturing facility located in Taiwan. The time-specific emission factors of most pollutants varied widely among and between the test machines, and the fuel-specific emission factors showed relatively less variation. This result suggests that using fuel-specific emission factors would be more reliable than time-specific emission factors to calculate the emission inventory of non-road construction machines. Furthermore, an analysis of PAH emissions revealed that medium-molecular weight PAHs (3- and 4-ring PAHs) contribute to the largest share of particle-bound PAH emissions. However, in terms of the BaP equivalent toxicity of PAHs, high-molecular weight PAHs (5-ring and higher) were more important, as they had the highest BaPeq toxic emission factors. Since these non-road engines are operated inside of confined spaces within the brick factory, toxic emissions might be accumulated in the factory’s atmosphere, posing elevated threats to the health of workers. Therefore, it is important for future studies to assess the workers’ exposure to toxic emissions within such facilities.
Supplementary Materials
The following supporting information can be downloaded at: https://www.mdpi.com/article/10.3390/atmos13050766/s1, Table S1: Ambient temperature and relative humidity (mean ± SD) during sampling; Table S2: Specifications of the components of the onboard emission measurement system; Table S3: Chemical profile of particle-bound PAH emissions of test machines.
Author Contributions
Conceptualization, N.B.D., L.-C.W., H.-H.Y., N.K.C. and C.-H.L.; data curation, N.B.D. and C.-H.L.; formal analysis, N.B.D. and H.-H.Y.; funding acquisition, H.-H.Y.; investigation, N.B.D., L.-C.W., H.-H.Y., N.K.C. and C.-H.L.; methodology, N.B.D., H.-H.Y. and C.-H.L.; project administration, H.-H.Y.; resources, C.-H.L.; software, N.B.D.; supervision, H.-H.Y.; validation, N.B.D. and H.-H.Y.; visualization, N.B.D.; writing—original draft, N.B.D.; writing—review and editing, N.B.D., L.-C.W., H.-H.Y., N.K.C. and C.-H.L. All authors have read and agreed to the published version of the manuscript.
Funding
This study was funded by the Ministry of Science and Technology, Taiwan (MOST 108-2221-E-324-016-MY3).
Institutional Review Board Statement
Not applicable.
Informed Consent Statement
Not applicable.
Data Availability Statement
All data generated or analyzed during this study are included in the article.
Conflicts of Interest
The authors declare no conflict of interest. The funders had no role in the design of the study; in the collection, analyses, or interpretation of data; in the writing of the manuscript; or in the decision to publish the results.
References
- Yan, F.; Winijkul, E.; Streets, D.G.; Lu, Z.; Bond, T.C.; Zhang, Y. Global emission projections for the transportation sector using dynamic technology modeling. Atmos. Chem. Phys. 2014, 14, 5709–5733. [Google Scholar] [CrossRef] [Green Version]
- Desouza, C.D.; Marsh, D.J.; Beevers, S.D.; Molden, N.; Green, D.C. Real-world emissions from non-road mobile machinery in London. Atmos. Environ. 2020, 223, 117301. [Google Scholar] [CrossRef]
- Pang, K.; Zhang, K.; Ma, S. Tailpipe emission characterizations of diesel-fueled forklifts under real-world operations using a portable emission measurement system. J. Environ. Sci. 2021, 100, 34–42. [Google Scholar] [CrossRef] [PubMed]
- Yu, F.; Li, C.; Liu, J.; Liao, S.; Zhu, M.; Xie, Y.; Sha, Q.; Huang, Z.; Zheng, J. Characterization of particulate smoke and the potential chemical fingerprint of non-road construction equipment exhaust emission in China. Sci. Total Environ. 2020, 723, 137967. [Google Scholar] [CrossRef] [PubMed]
- Cao, T.; Durbin, T.D.; Russell, R.L.; Cocker, D.R.; Scora, G.; Maldonado, H.; Johnson, K.C. Evaluations of in-use emission factors from off-road construction equipment. Atmos. Environ. 2016, 147, 234–245. [Google Scholar] [CrossRef] [Green Version]
- Qi, L.; Liu, H.; Shen, X.; Fu, M.; Huang, F.; Man, H.; Deng, F.; Shaikh, A.A.; Wang, X.; Dong, R.; et al. Intermediate-volatility organic compound emissions from nonroad construction machinery under different operation modes. Environ. Sci. Technol. 2019, 53, 13832–13840. [Google Scholar] [CrossRef]
- Hu, Q.; Huang, C.; Qiao, L.; Ma, Y.; Yang, Q.; Tang, W.; Zhou, M.; Zhu, S.; Lou, S.; Tao, S.; et al. Speciated PM composition and gas and particle emission factors for diesel construction machinery in China. Aerosol Air Qual. Res. 2019, 19, 1820–1833. [Google Scholar] [CrossRef] [Green Version]
- Liu, Y.; Zhang, W.; Yang, W.; Bai, Z.; Zhao, X. Chemical compositions of PM2.5 emitted from diesel trucks and construction equipment. Aerosol Sci. Eng. 2018, 2, 51–60. [Google Scholar] [CrossRef] [Green Version]
- Jung, S.; Kim, S.; Lim, Y.; Lee, J.; Chung, T.; Hong, H.; Mun, S.; Lee, S.; Jang, W.; Lim, J. Emission characteristics of hazardous air pollutants from construction equipment. Aerosol Air Qual. Res. 2020, 20, 2012–2024. [Google Scholar] [CrossRef]
- Frey, H.C.; Rasdorf, W.; Lewis, P. Comprehensive field study of fuel use and emissions of nonroad diesel construction equipment. Transp. Res. Rec. J. Transp. Res. Board 2010, 2158, 69–76. [Google Scholar] [CrossRef]
- Tu, R.; Li, T.; Meng, C.; Chen, J.; Sheng, Z.; Xie, Y.; Xie, F.; Yang, F.; Chen, H.; Li, Y.; et al. Real-world emissions of construction mobile machines and comparison to a non-road emission model. Sci. Total Environ. 2021, 771, 145365. [Google Scholar] [CrossRef] [PubMed]
- Cao, T.; Russell, R.L.; Durbin, T.D.; Cocker, D.R.; Burnette, A.; Calavita, J.; Maldonado, H.; Johnson, K.C. Characterization of the emissions impacts of hybrid excavators with a portable emissions measurement system (PEMS)-based methodology. Sci. Total Environ. 2018, 635, 112–119. [Google Scholar] [CrossRef] [PubMed] [Green Version]
- Fu, M.; Ge, Y.; Tan, J.; Zeng, T.; Liang, B. Characteristics of typical non-road machinery emissions in China by using portable emission measurement system. Sci. Total Environ. 2012, 437, 255–261. [Google Scholar] [CrossRef] [PubMed]
- Zavala, M.; Huertas, J.I.; Prato, D.; Jazcilevich, A.; Aguilar, A.; Balam, M.; Misra, C.; Molina, L.T. Real-world emissions of in-use off-road vehicles in Mexico. J. Air Waste Manag. Assoc. 2017, 67, 958–972. [Google Scholar] [CrossRef] [Green Version]
- Martin, N.; Lombard, M.; Jensen, K.R.; Kelley, P.; Pratt, T.; Traviss, N. Effect of biodiesel fuel on “real-world”, nonroad heavy duty diesel engine particulate matter emissions, composition and cytotoxicity. Sci. Total Environ. 2017, 586, 409–418. [Google Scholar] [CrossRef] [PubMed]
- Lewis, P.; Leming, M.; Rasdorf, W. Impact of engine idling on fuel use and CO2 emissions of nonroad diesel construction equipment. J. Manag. Eng. 2012, 28, 31–38. [Google Scholar] [CrossRef]
- Peng, Z.; Ge, Y.; Tan, J.; Fu, M.; Wang, X.; Chen, M.; Lu, Y.; Wu, Y. Real-world emission from in-use construction equipment in China. Aerosol Air Qual. Res. 2016, 16, 1893–1902. [Google Scholar] [CrossRef] [Green Version]
- Nisbet, I.C.T.; LaGoy, P.K. Toxic equivalency factors (TEFs) for polycyclic aromatic hydrocarbons (PAHs). Regul. Toxicol. Pharmacol. 1992, 16, 290–300. [Google Scholar] [CrossRef]
- Dhital, N.B.; Wang, S.X.; Lee, C.H.; Su, J.; Tsai, M.Y.; Jhou, Y.J.; Yang, H.H. Effects of driving behavior on real-world emissions of particulate matter, gaseous pollutants and particle-bound PAHs for diesel trucks. Environ. Pollut. 2021, 286, 117292. [Google Scholar] [CrossRef]
- Yang, H.H.; Dhital, N.B.; Cheruiyot, N.K.; Wang, L.C.; Wang, S.X. Effects of road grade on real-world tailpipe emissions of regulated gaseous pollutants and volatile organic compounds for a Euro 5 motorcycle. Atmos. Pollut. Res. 2021, 12, 101167. [Google Scholar] [CrossRef]
- Zhang, Q.; Yang, L.; Ma, C.; Zhang, Y.; Wu, L.; Mao, H. Emission characteristics and chemical composition of particulate matter emitted by typical non-road construction machinery. Atmos. Pollut. Res. 2019, 11, 679–685. [Google Scholar] [CrossRef]
- Katsoyiannis, A.; Sweetman, A.J.; Jones, K.C. PAH molecular diagnostic ratios applied to atmospheric sources: A critical evaluation using two decades of source inventory and air concentration data from the UK. Environ. Sci. Technol. 2011, 45, 8897–8906. [Google Scholar] [CrossRef] [PubMed]
- Lin, Y.C.; Li, Y.C.; Amesho, K.T.T.; Chou, F.C.; Cheng, P.C. Characterization and quantification of PM2.5 emissions and PAHs concentration in PM2.5 from the exhausts of diesel vehicles with various accumulated mileages. Sci. Total Environ. 2019, 660, 188–198. [Google Scholar] [CrossRef]
- Zheng, X.; Wu, Y.; Zhang, S.; Hu, J.; Zhang, K.M.; Li, Z.; He, L.; Hao, J. Characterizing particulate polycyclic aromatic hydrocarbon emissions from diesel vehicles using a portable emissions measurement system. Sci. Rep. 2017, 7, 10058. [Google Scholar] [CrossRef] [PubMed]

Publisher’s Note: MDPI stays neutral with regard to jurisdictional claims in published maps and institutional affiliations. |
© 2022 by the authors. Licensee MDPI, Basel, Switzerland. This article is an open access article distributed under the terms and conditions of the Creative Commons Attribution (CC BY) license (https://creativecommons.org/licenses/by/4.0/).