Article

Air Quality in Two Northern Greek Cities Revealed by Their Tropospheric NO2 Levels

by
Maria-Elissavet Koukouli
1,*,
Andreas Pseftogkas
1,
Dimitris Karagkiozidis
1,
Ioanna Skoulidou
1,
Theano Drosoglou
1,
Dimitrios Balis
1,
Alkiviadis Bais
1,
Dimitrios Melas
1 and
Nikos Hatzianastassiou
2
1
Laboratory of Atmospheric Physics, Aristotle University of Thessaloniki, GR-54634 Thessaloniki, Greece
2
Laboratory of Meteorology, Department of Physics, University of Ioannina, GR-45110 Ioannina, Greece
*
Author to whom correspondence should be addressed.
Atmosphere 2022, 13(5), 840; https://doi.org/10.3390/atmos13050840
Submission received: 27 April 2022 / Revised: 17 May 2022 / Accepted: 17 May 2022 / Published: 20 May 2022
(This article belongs to the Special Issue Urban Climate and Air Quality in Mediterranean Cities)

Abstract

:
In this article, we aim to show the capabilities, benefits, as well as restrictions, of three different air quality-related information sources, namely the Sentinel-5Precursor TROPOspheric Monitoring Instrument (TROPOMI) space-born observations, the Multi-Axis Differential Optical Absorption Spectroscopy (MAX-DOAS) ground-based measurements and the LOng Term Ozone Simulation-EURopean Operational Smog (LOTOS-EUROS) chemical transport modelling system simulations. The tropospheric NO2 concentrations between 2018 and 2021 are discussed as air quality indicators for the Greek cities of Thessaloniki and Ioannina. Each dataset was analysed in an autonomous manner and, without disregarding their differences, the common air quality picture that they provide is revealed. All three systems report a clear seasonal pattern, with high NO2 levels during wintertime and lower NO2 levels during summertime, reflecting the importance of photochemistry in the abatement of this air pollutant. The spatial patterns of the NO2 load, obtained by both space-born observations and model simulations, show the undeniable variability of the NO2 load within the urban agglomerations. Furthermore, a clear diurnal variability is clearly identified by the ground-based measurements, as well as a Sunday minimum NO2 load effect, alongside the rest of the sources of air quality information. Within their individual strengths and limitations, the space-borne observations, the ground-based measurements, and the chemical transport modelling simulations demonstrate unequivocally their ability to report on the air quality situation in urban locations.

1. Introduction

In recent decades, with the ever-increasing urbanisation and human need for modern living conditions, air quality has become a major concern affecting billions of people globally. According to the World Health Organization, WHO, in 2016, 91% of the world population was exposed to conditions where the WHO air quality guidelines levels were not met [1] while ambient air pollution, both in urban and rural areas, was estimated to cause 4.2 million premature deaths worldwide. For Greece and the year 2015, the European Environment Agency [2] estimated that about 12,000 premature deaths were attributable to particulate matter (PM2.5 and PM10) concentrations, over 6100 to ozone (O3), concentrations and 2300 to nitrogen dioxide (NO2) concentrations. Monitoring of air quality is traditionally performed by ground-based in situ stations and the European Environmental Agency, EEA, is basing its annual assessments of the status, impact and recent air quality trends on measurements at fixed sampling stations [3]. The EU Environmental Implementation Review 2019 for Greece [4] reports that exceedances related to the annual limit value for NO2 were registered in one out of four air quality zones (the capital city of Athens), in one out of four zones for PM2.5 and in three out of four zones for PM10. These official statistics are however relying on the network of in situ air quality stations reporting to the EEA Air Quality Data Service [5] which are rarely indicative of the true situation; in Greece, only four cities are represented in this database, with no indication on the status over the rest of the mainland, the islands and background locations that are likely affected by inter-regional or trans-boundary pollution events. More recently, however, new technologies and modelling capabilities have given rise to complementary sources of information on air quality adding value to its monitoring. These include increased spatial coverage, with satellite remote sensing observations, city-wide analysis of pollutants at different heights in the atmosphere, with ground-based instrumentation, as well as attribution of increased pollutant levels to the original emitting sources, with state-of-the-art regional chemical transport modelling.
In this work, the tropospheric NO2 concentrations will be studied as an air quality indicator. On a global scale, emissions of nitrogen oxides (NOx = NO + NO2) from natural sources far outweigh those generated by human activities (e.g., [6]). Natural sources include microbial processes in soils, oxidation of biogenic ammonia, wildfires and lightning. However, the NO2 levels attributable to natural NOx emissions sources, typically referred to as background, are rather small compared to the magnitude of anthropogenic emissions. Currently, fossil fuel combustion is the largest source of NOx and, together with biomass burning emissions, anthropogenic activities dominate the NOx budget. As a trace gas with a relatively short lifetime, NO2 is usually confined to a local scale with respect to its source and therefore exhibits strong spatial and temporal variations, rendering its monitoring dependent on the spatiotemporal resolution of its observations.
In the following, we aim to demonstrate the abilities, benefits, as well as limitations, of three different air quality-related pools of information, namely the Sentinel-5 Precursor TROPOspheric Monitoring Instrument (TROPOMI) space-born observations, the Multi-Axis Differential Optical Absorption Spectroscopy (MAX-DOAS) ground-based measurements and the LOng Term Ozone Simulation-EURopean Operational Smog (LOTOS-EUROS) chemical transport modelling system. Using as case studies the Greek cities of Thessaloniki, with a population of 1 million, and Ioannina, with a population of 110 thousand, and the tropospheric NO2 concentrations as air quality indicators, the local air quality levels and patterns between 2018 and 2021 are studied. These two cities are selected as two study cases representative of a large and a medium-sized urban agglomeration, exhibiting different characteristics regarding the strength and the nature/type of emission sources, as well as their individual geomorphology and topography. The aim of this work differs from that typically seen in literature, that of directly inter-comparing, validating, merging and contrasting the observations and simulations, as we aim to treat each dataset as autonomous and, without disregarding their differences, clearly present the common air quality picture that they provide.
In Section 2, both observational datasets and the model simulations are briefly described alongside the pre-processing of the original datasets specific to the requirements of this study. In Section 3, the findings per city are separately expanded and analysed. In Section 4, an executive summary of this work is provided alongside suggestions for future semi-operational use of these monitoring systems, with ideas that stemmed during this research.

2. Materials and Methods

2.1. Two Northern Greece Cities

Thessaloniki, Figure 1a, a port city located in the North of Greece, is the second-largest city of the country, with over one million inhabitants in its metropolitan area, while the majority of industrial activity is concentrated in the west and north-west part of the city. The meteorological features affecting air quality in the city are defined by the Gulf of Thermaikos and the mountain on Hortiatis, causing both sea and land breeze and valley mountain winds [7]. Road transport and industrial emissions are the two main sources of NOx emissions in the greater area of Thessaloniki [8] while according to [9] these two anthropogenic emission sources of Thessaloniki contribute by 35  ±  8% and 45  ±  3%, respectively, to the annual mean NOx emissions for Greece. The study of [10] reported that even small reductions in NOx emissions (~5%) are sufficient for the NO2 annual average to remain below the EU limit of 40 μg/m3. The recent lockdown due to the Severe Acute Respiratory Syndrome Coronavirus-2, COVID-19, has offered the unique possibility to quantify NOx emissions changes due to transport. The study [11], which was based on satellite observations and chemical transport modelling simulations, reported an ~10% reduction in NO2 levels over the city while [12], using a machine learning technique and measurements from two traffic air quality monitoring stations, reported a mean reduction of ~22%. These findings appear counter-intuitive since, in terms of the number of vehicles circulating in Thessaloniki, private cars and motorcycles are the vast majority. However, [13] have recently shown that a significant decrease in the concentrations of atmospheric pollutants related to road traffic, reaching up to −65% for NOx levels, is achieved when public buses circulating in a major road axis of Thessaloniki are replaced with battery electric vehicles. They conclude that a reduction of the circulation of private vehicles by −20% in combination with the use of battery-electric vehicles for public transportation is the best scenario for improved air quality in the city.
Ioannina, Figure 1b, a town of ~110,000 habitants, is located on a plateau of about 480 m in height, surrounded by four mountains and a lake. With respect to NO2 levels, the air quality of the city is characterized by a “good” air quality index, as per the Index of Air Pollution from the European Commission [14] while a small weekend effect is also reported, with Sundays appearing as the cleanest days. A rather weak seasonal variability was also found for Ioannina; during summertime, two counteracting factors affect the local NO2 levels, the absence of rain preventing NO2 deposition, whereas the available solar radiation favours its destruction to O3 formation. The city is however known, in recent years, to suffer from residential wood burning emissions, leading to persistent wintertime smog episodes [15].

2.2. MAX-DOAS Measurements

Multi-axis differential optical absorption spectroscopy (MAX-DOAS) is a ground-based passive remote sensing technique that is widely used for the detection of aerosols and trace gases in the Planetary Boundary Layer (PBL) and in the lowermost free troposphere (e.g., [16,17,18]). MAX-DOAS systems perform spectrally resolved measurements of scattered sunlight in the ultraviolet (UV) and visible (VIS) parts of the electromagnetic spectrum at different elevation angles [19]. The spectral analysis of the recorded spectra by differential optical absorption spectroscopy (DOAS) [20] allows the simultaneous detection of several trace gases that have distinct absorption structures, such as NO2, formaldehyde (HCHO), O3, sulfur dioxide (SO2), water vapour (H2O) and glyoxal (CHOCHO). The primary retrieved product from a MAX-DOAS system is the differential Slant Column Density (dSCD), i.e., the difference in trace gas column amount between a measured spectrum and a Fraunhofer reference spectrum (FRS), typically measured at the zenith. By recording spectra at different elevation angles (typically from close to the horizon towards the zenith) that belong to the same azimuth viewing direction, MAX-DOAS systems allow the retrieval of the trace gases vertical distribution in the lower troposphere.
Several MAX-DOAS systems (Phaethon) have been operating since 2014 on the rooftop of the Physics Department building of the Aristotle University of Thessaloniki (40.634° N, 22.956° E). The instruments have been gradually upgraded ever since for the retrieval of tropospheric NO2 Vertical Column Densities (VCDs) [21,22], total ozone columns [23] and recently for the retrieval of aerosol and trace gas vertical profiles [24]. In the current study, scattered radiation spectra are measured at eleven elevation angles (i.e., 1, 2, 3, 4, 5, 6, 8, 10, 12, 15 and 30°) with an integration time of ~1 min per angle and a sequential zenith-sky measurement is used as the FRS for the retrieval of the NO2 dSCDs. The dSCDs are calculated with the QDOAS (version 3.2, September 2017) spectral fitting software suite (https://uv-vis.aeronomie.be/software/QDOAS/, last access: 11 April 2022) and the NO2 vertical profiles are retrieved by applying the Mexican MAX-DOAS Fit (MMF) [25] inversion algorithm to the measured NO2 dSCDs. Details about the instrumentation, the slant column retrieval settings and the input parameters for the inversion algorithm can be found in [24]. One year of measurements between May 2020 to May 2021 over Thessaloniki is considered in this work, with the system configured to measure at four azimuth viewing directions, i.e., 142, 185, 220 and 255°, illustrated in Figure 1a as the different coloured lines. Depending on the known local NO2 sources, these viewing directions roughly translate into a suburban (142°), an urban (185°), a sea (220°) and a rural location (255°). As will be discussed in the results section, the variability of the MAX-DOAS observations in the different azimuth viewing directions was found to be high. As a result, no clear distinction between the expected NO2 loads could be differentiated, and the MAX-DOAS observations for the different azimuth viewing directions were averaged into one mean NO2 time series.
During the PANhellenic infrastructure for Atmospheric Composition and climatE chAnge (PANACEA; https://panacea-ri.gr/, access on 19 May 2022) measurement winter campaign 2020, a MAX-DOAS system was installed on the rooftop of the Physics Department building at the University of Ioannina from 3 January 2020 to 18 February 2020. No remote sensing instruments operate regularly in Ioannina and the air quality is monitored only by in situ measurement sites that are distributed around the city centre. Tropospheric NO2 VCDs are retrieved for the first time in Ioannina using MAX-DOAS observations. The system was configured to perform elevation scans at three azimuth viewing directions (15, 35 and 80°, illustrated in Figure 1b). The azimuth directions of 15° and 35° point towards the urban direction, while the 80° azimuth direction points to a suburban area. The viewing directions at elevation angles close to the horizon (i.e., less than 4°) are blocked by the surrounding mountains at all azimuths and thus NO2 vertical profiles cannot be reliably retrieved. Hence, the NO2 VCDs for Ioannina are derived from the dSCDs measured at 30 and 15° elevation angles by division with appropriate differential Air Mass Factors (dAMFs) that were calculated based on Radiative Transfer Model (RTM) simulations, taking into account the viewing geometry, the aerosol optical properties, and the instrument’s viewing direction relative to the sun [21]. The NO2 dSCDs at these elevation angles are lower than those measured at lower elevation angles and the associate fitting errors are larger. Furthermore, the NO2 levels measured in Ioannina are considerably lower than in Thessaloniki and the differential optical densities are usually very low, reaching the spectrometer’s detection limit. Hence, in order to obtain data of higher quality, the NO2 VCDs are calculated from the average VCDs at 30 and 15° when those agreed to at least 50%. Similarly as for Thessaloniki, for Ioannina, one azimuth-averaged MAX-DOAS time series is analysed.

2.3. S5P/TROPOMI Observations

The Sentinel 5 Precursor (S5P) mission is a low Earth orbit polar satellite system to provide information and services on air quality, climate and the ozone layer in the timeframe between 2016 and 2023. The S5P satellite was launched on 13 October 2017, carrying the TROPOspheric Monitoring Instrument, TROPOMI [26]. TROPOMI is a double channel, nadir-viewing grating spectrometer, measuring solar backscattered earthshine radiances in the ultraviolet, visible, near-infrared, and shortwave infrared with global daily coverage [27,28]. The instrument has a swath width of 2600 km with a near nadir resolution at 3.5 × 5.5 km2 since 6 August 2019 (3.5 × 7 km2 initial spatial resolution). The wavelength range for the NO2 column retrieval is between 405 and 465 nm and detailed information on the algorithm and data can be found in the TROPOMI NO2 Algorithm Theoretical Basis Document [27,28]. The data are constantly being validated by the Mission Performance Center Validation Data Analysis Facility, VDAF (https://mpc-vdaf.tropomi.eu/, last access: 16 September 2021). According to the latest validation report, TROPOMI L2_NO2 tropospheric column data show a negative median bias of −34% when compared to MAX-DOAS ground-based observations, well within the mission requirement of 50% [29]. This bias is reduced by approximately 20% when the MAX-DOAS profile data are vertically smoothed using the S5P averaging kernels.
In this work, we use offline v1.2 and v1.3 S5P/TROPOMI NO2 tropospheric vertical column densities for a long sensing period, from May 2018 to March 2021, over the Greek cities of Thessaloniki and Ioannina. The data are filtered with a quality assurance value (qa_value > 0.75) to ensure cloud-free satellite observations and are gridded onto a 0.01° × 0.01° grid so as to extract the observations of the specified pixels required for this research. The day-of-week, monthly and seasonal variations of NO2 are studied over urban, suburban, rural and sea areas in Thessaloniki and over urban and rural areas in Ioannina. In order to demonstrate the space-based monitoring capabilities more clearly, for Thessaloniki, the urban and suburban pixels were averaged into one, the sea and rural pixels into another and the central pixel over AUTH, where the bulk of the NOx emissions reside, is studied separately. Similarly, for Ioannina, the urban and suburban pixels are averaged while the central pixel over the UOI is studied separately.

2.4. LOTOS-EUROS Simulations

LOTOS-EUROS is the chemical transport model used to simulate atmospheric pollutants in this study [30]. The model is designed to simulate trace gases and aerosols in three dimensions in the lower atmosphere. LOTOS-EUROS is one of the state-of-the-art models used in the Copernicus Atmosphere Monitoring Service (CAMS, http://www.copernicus-atmosphere.eu) providing atmospheric information to a broad range of users, while it has been widely used in different studies concerning different parts of the world (e.g., [31,32]). The model behaviour has been studied and validated in Greece and, for the city of Thessaloniki, it exhibits a mild underestimation of ~−10% when comparing simulated tropospheric NO2 columns with S5P/TROPOMI and MAX-DOAS observations in summer [33].
The gas chemical mechanisms in LOTOS-EUROS are based on the updated version of CBM IV [34], while the secondary inorganic aerosols are represented by the ISORROPIA II module [35]. The simulations were driven by operational meteorological data from the European Centre for Medium-Range Weather Forecasts (ECMWF) with a horizontal resolution of 7 km × 7 km. Atmospheric variables were simulated in 12 vertical layers expanding from the surface to about 200 hPa. The anthropogenic emission inventory used is based on CAMS-REG (CAMS regional European emissions) v4.2 inventory for the year 2017 and the temporal profiles used are the default profiles provided by CAMS for Europe. The CAMS-REG inventory provides European total annual gridded emissions on a 0.10° × 0.05° grid. The model calculates biogenic NOx emissions from soils online, depending on soil type and temperature [36].
In this study, a nested domain configuration was used. Three different model runs with varying horizontal resolutions were performed so as to obtain a smooth transition in the dynamics from the large European scales to the desired local scale of the cities of Thessaloniki and Ioannina. First, a coarse resolution run that covers the region of Europe expanding from 15° W to 45° E and 30° N to 60° N and a horizontal resolution of 0.25° × 0.25° was performed. The initial and boundary conditions in this run were derived from the CAMS global near-real-time (NRT) product with a spatial resolution of 35 km × 35 km. Secondly, a medium resolution run was performed over Greece (20° E to 27° E and 34° N to 42° N) with a horizontal resolution of 0.10° longitude × 0.05° latitude, while the boundary conditions, in this case, were retrieved from the lower-resolution domain. Finally, we performed two higher-resolution runs with a spatial resolution of 0.01° × 0.01°, covering the regions of Thessaloniki (22.775° E to 23.075° E and 40.5° N to 40.75° N) and Ioannina (20.7° E to 20.9° E and 39.55° to 39.85° N) deriving concentration of pollutants on an hourly basis, between April 2018 and April 2021. Concentrations of gases and aerosols simulated in the medium resolution run were used as boundary conditions for the runs of Thessaloniki and Ioannina.
While the aim of this work is not to validate the model simulations against the ground- and space-born observations, in order to have a homogeneous discussion, the simulations were also aggregated in the same manner as the space-borne observations, i.e., for Thessaloniki, the urban and suburban pixels are shown as one, the sea and rural pixels as a second another and the central pixel over AUTH as a third. Similarly, for Ioannina, the urban and suburban pixels are averaged while the central pixel over the UOI is studied separately.
In Table 1, the main characteristics of each dataset used in this work as an air quality information pool are given, including their strong points and limitations. In such a format, it becomes clearer that these are all complementary to one another and each is an asset to any study performed on the urban scale.

3. Results

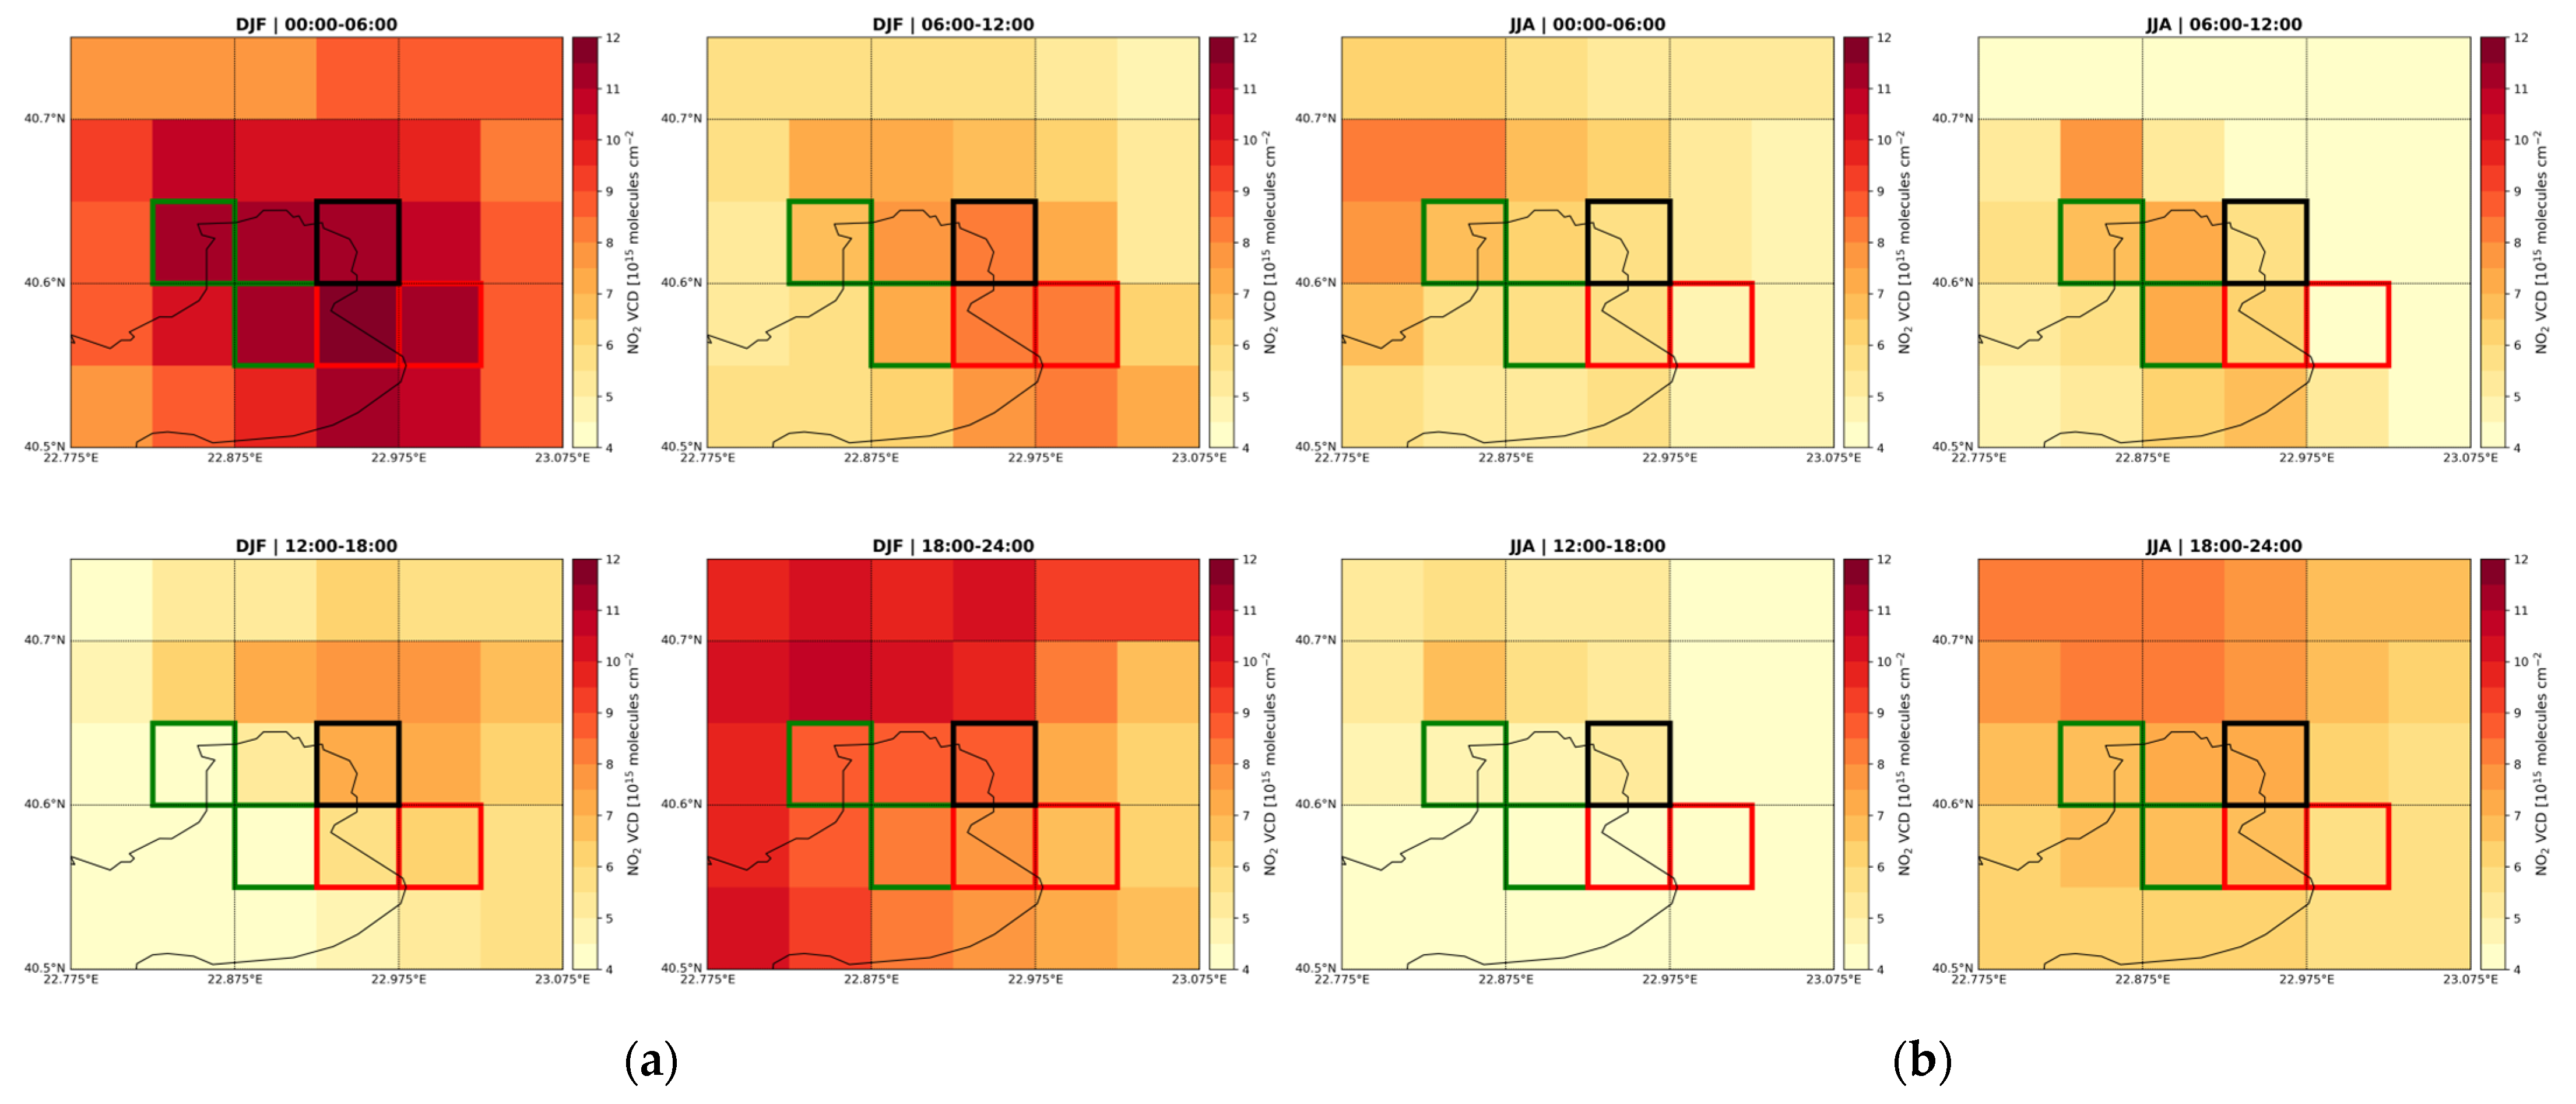
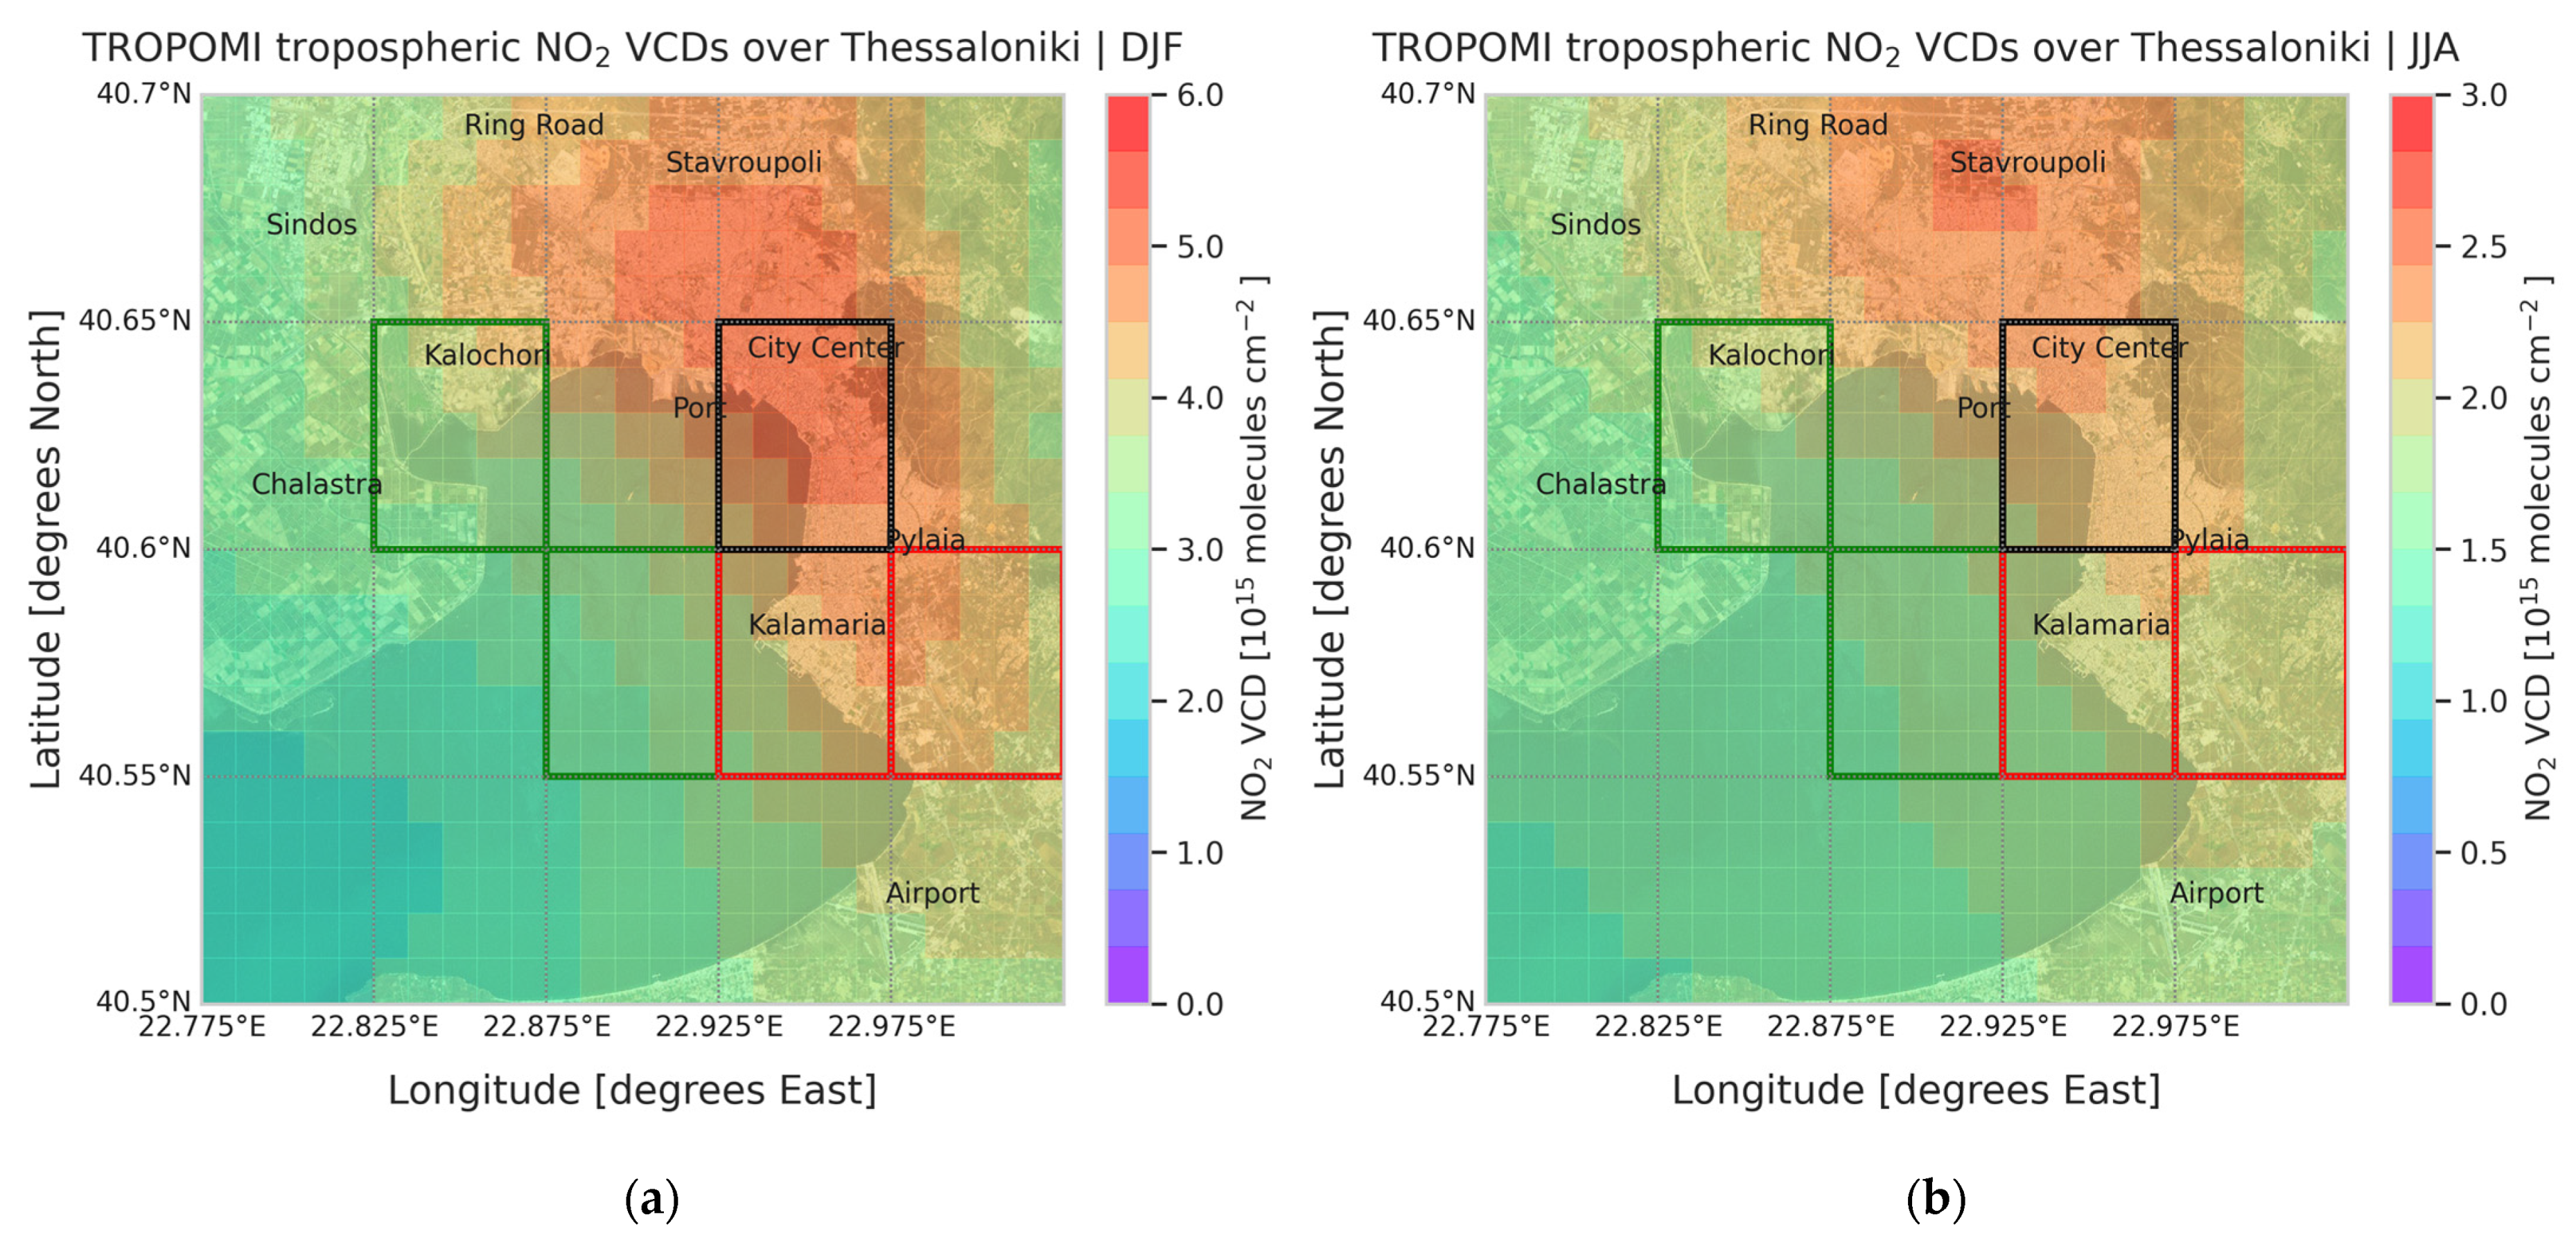
3.1. Thessaloniki Metropolitan Area

3.1.1. Spatial Variability within the City

The average lifetime of NOx in the boundary layer depends on many factors such as meteorological conditions, photolysis strengths, the duration of night-time, temperature, OH and H2O concentrations. Typically, 2–6 h are considered a good estimate for summertime with this value reaching one day during wintertime and the absence of sunlight. As a result, a clear seasonality is expected especially between winter and summer loads. In Figure 2, the wintertime (left) and summertime (right) TROPOMI tropospheric NO2 concentrations are shown for Thessaloniki, including: the locations of urbanized areas (city centre, Pylaia, Kalamaria, Stavroupoli), the port, the airport, the heavily used ring road, the industrial area (Sindos) and a possible source of agricultural NOx emissions in the rice fields of Chalastra. The satellite data were hyper-gridded using standard space-borne atmospheric analysis tools onto a 0.01 × 0.01° grid, however, for the discussion below, these were aggregated according to the colour-coded 5 × 5 grid boxes. The centre of the city which includes the location of the MAX-DOAS system is depicted in black; with red, the two urban and suburban MAX-DOAS viewing geometries are shown and with green, the rural and sea MAX-DOAS viewing geometries are represented (see Figure 1, left). These same pixels are also be used in the analysis of the LOTOS-EUROS simulations. The time period between May 2018 and March 2020 is presented in this work, while TROPOMI typically overpasses between 11:00 and 12:00 UTC over Greece. Since the aim of this work is to demonstrate the individual dataset capabilities in monitoring air quality, and not to inter-compare them, no homogenization between them was applied. This is typically performed by the application of the averaging kernel information between different datasets that are sensitive at different altitudes within the atmosphere. Hence, the NO2 reported levels are expected to vary in magnitude.
Over the entire domain shown, the wintertime loads range between 2.40 and 5.20 × 10¹⁵ molecules/cm2, with a mean of 3.70 ± 0.65 × 10¹⁵ molecules/cm2 while the summertime loads range between 1.45 and 2.45 × 10¹⁵ molecules/cm2, with a mean of 1.88 ± 0.24 × 10¹⁵ molecules/cm2. Furthermore, one already observes a clear distinction in the NO2 loads in accordance with the expected emission locations annotated on the maps, discussed in the monthly mean time series in the next figure.

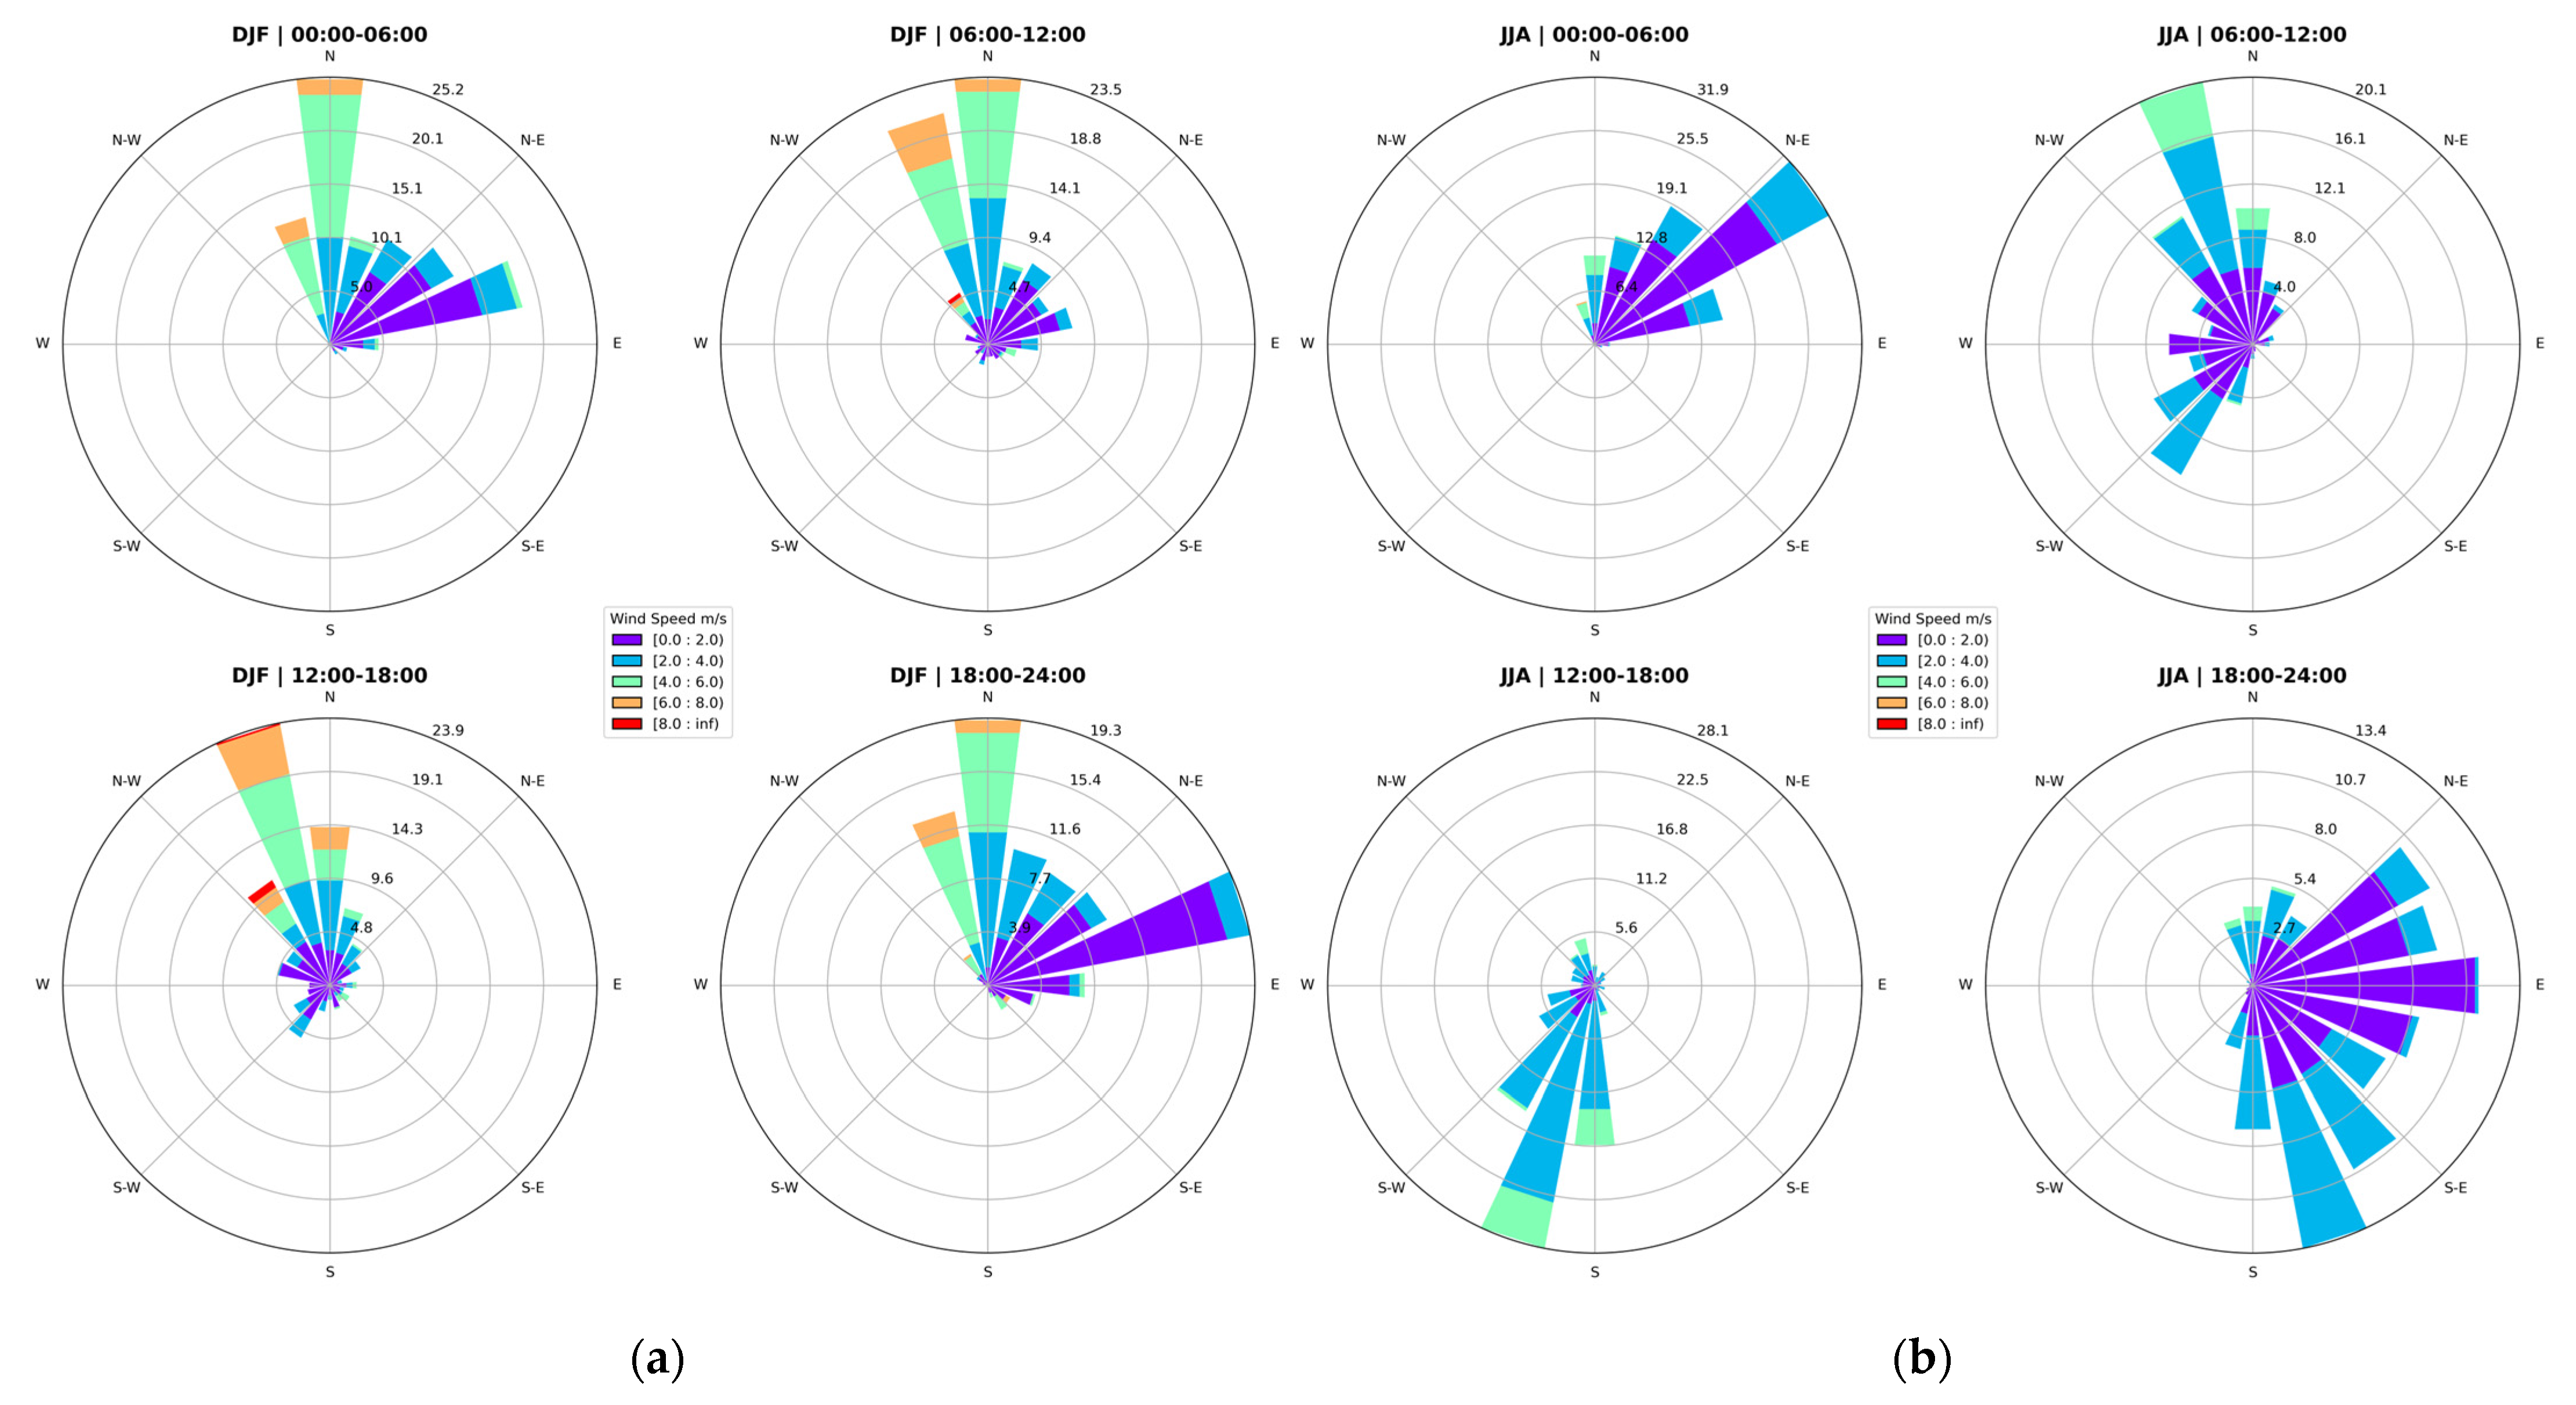
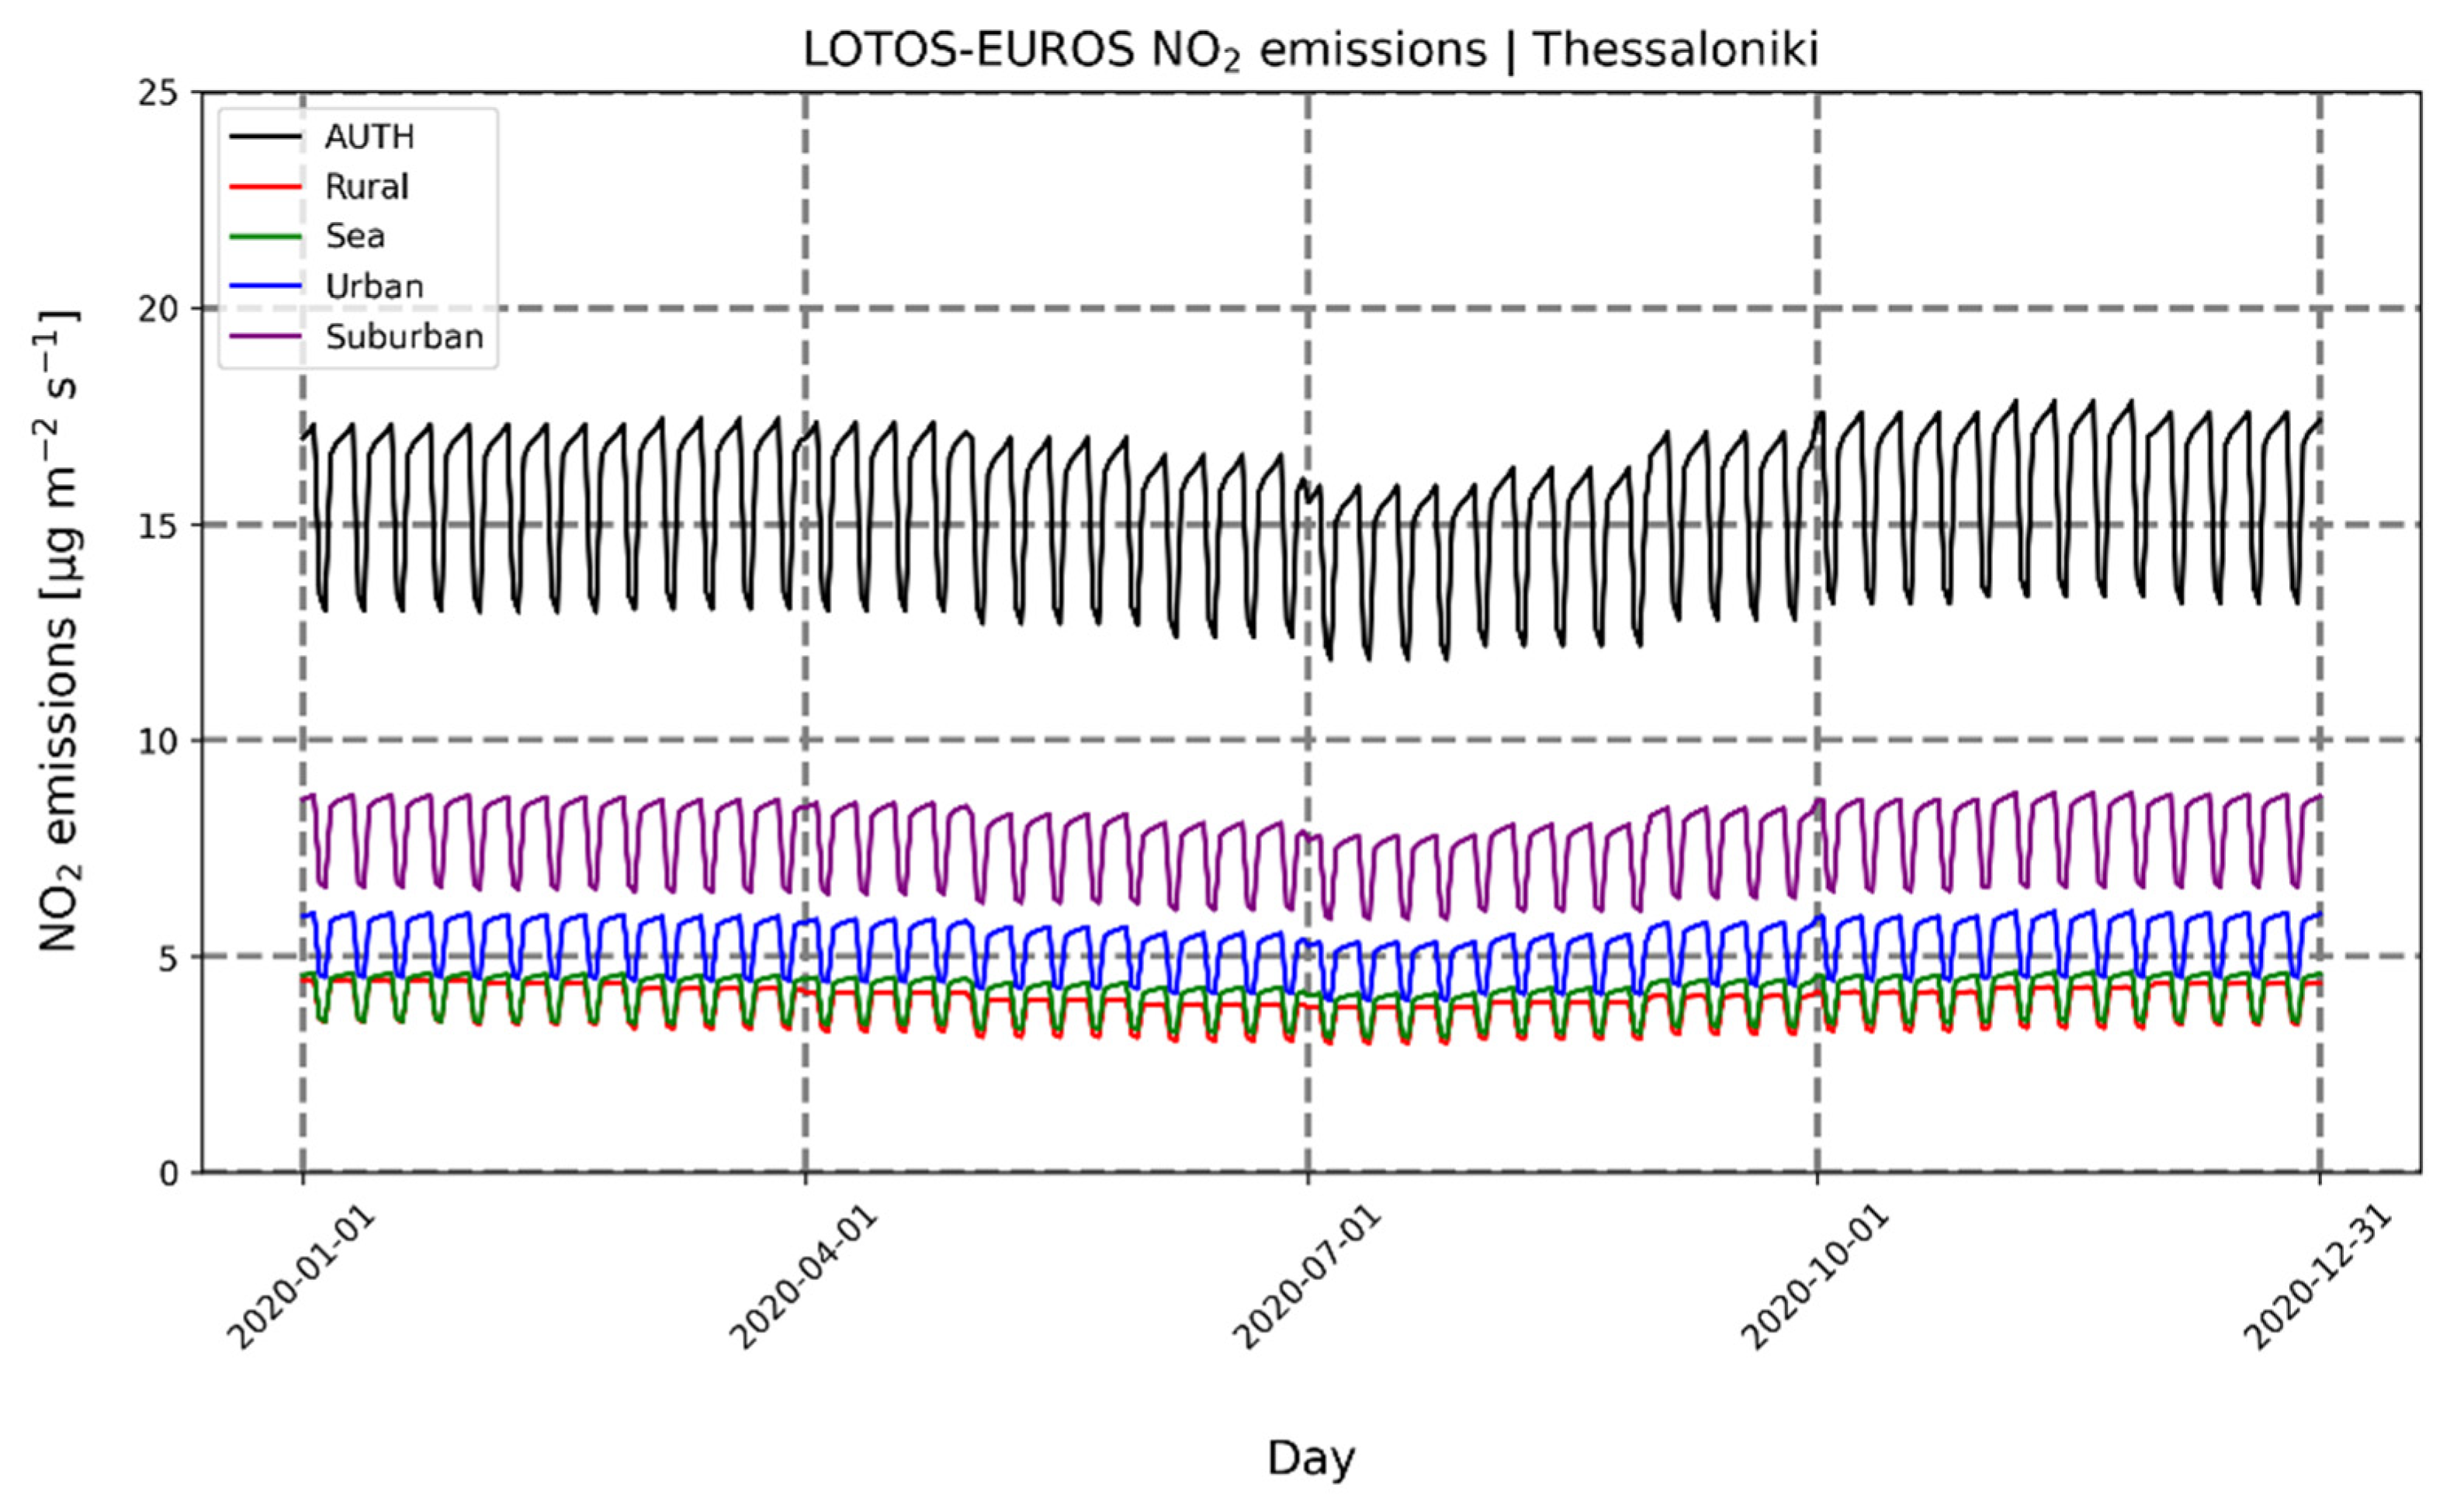
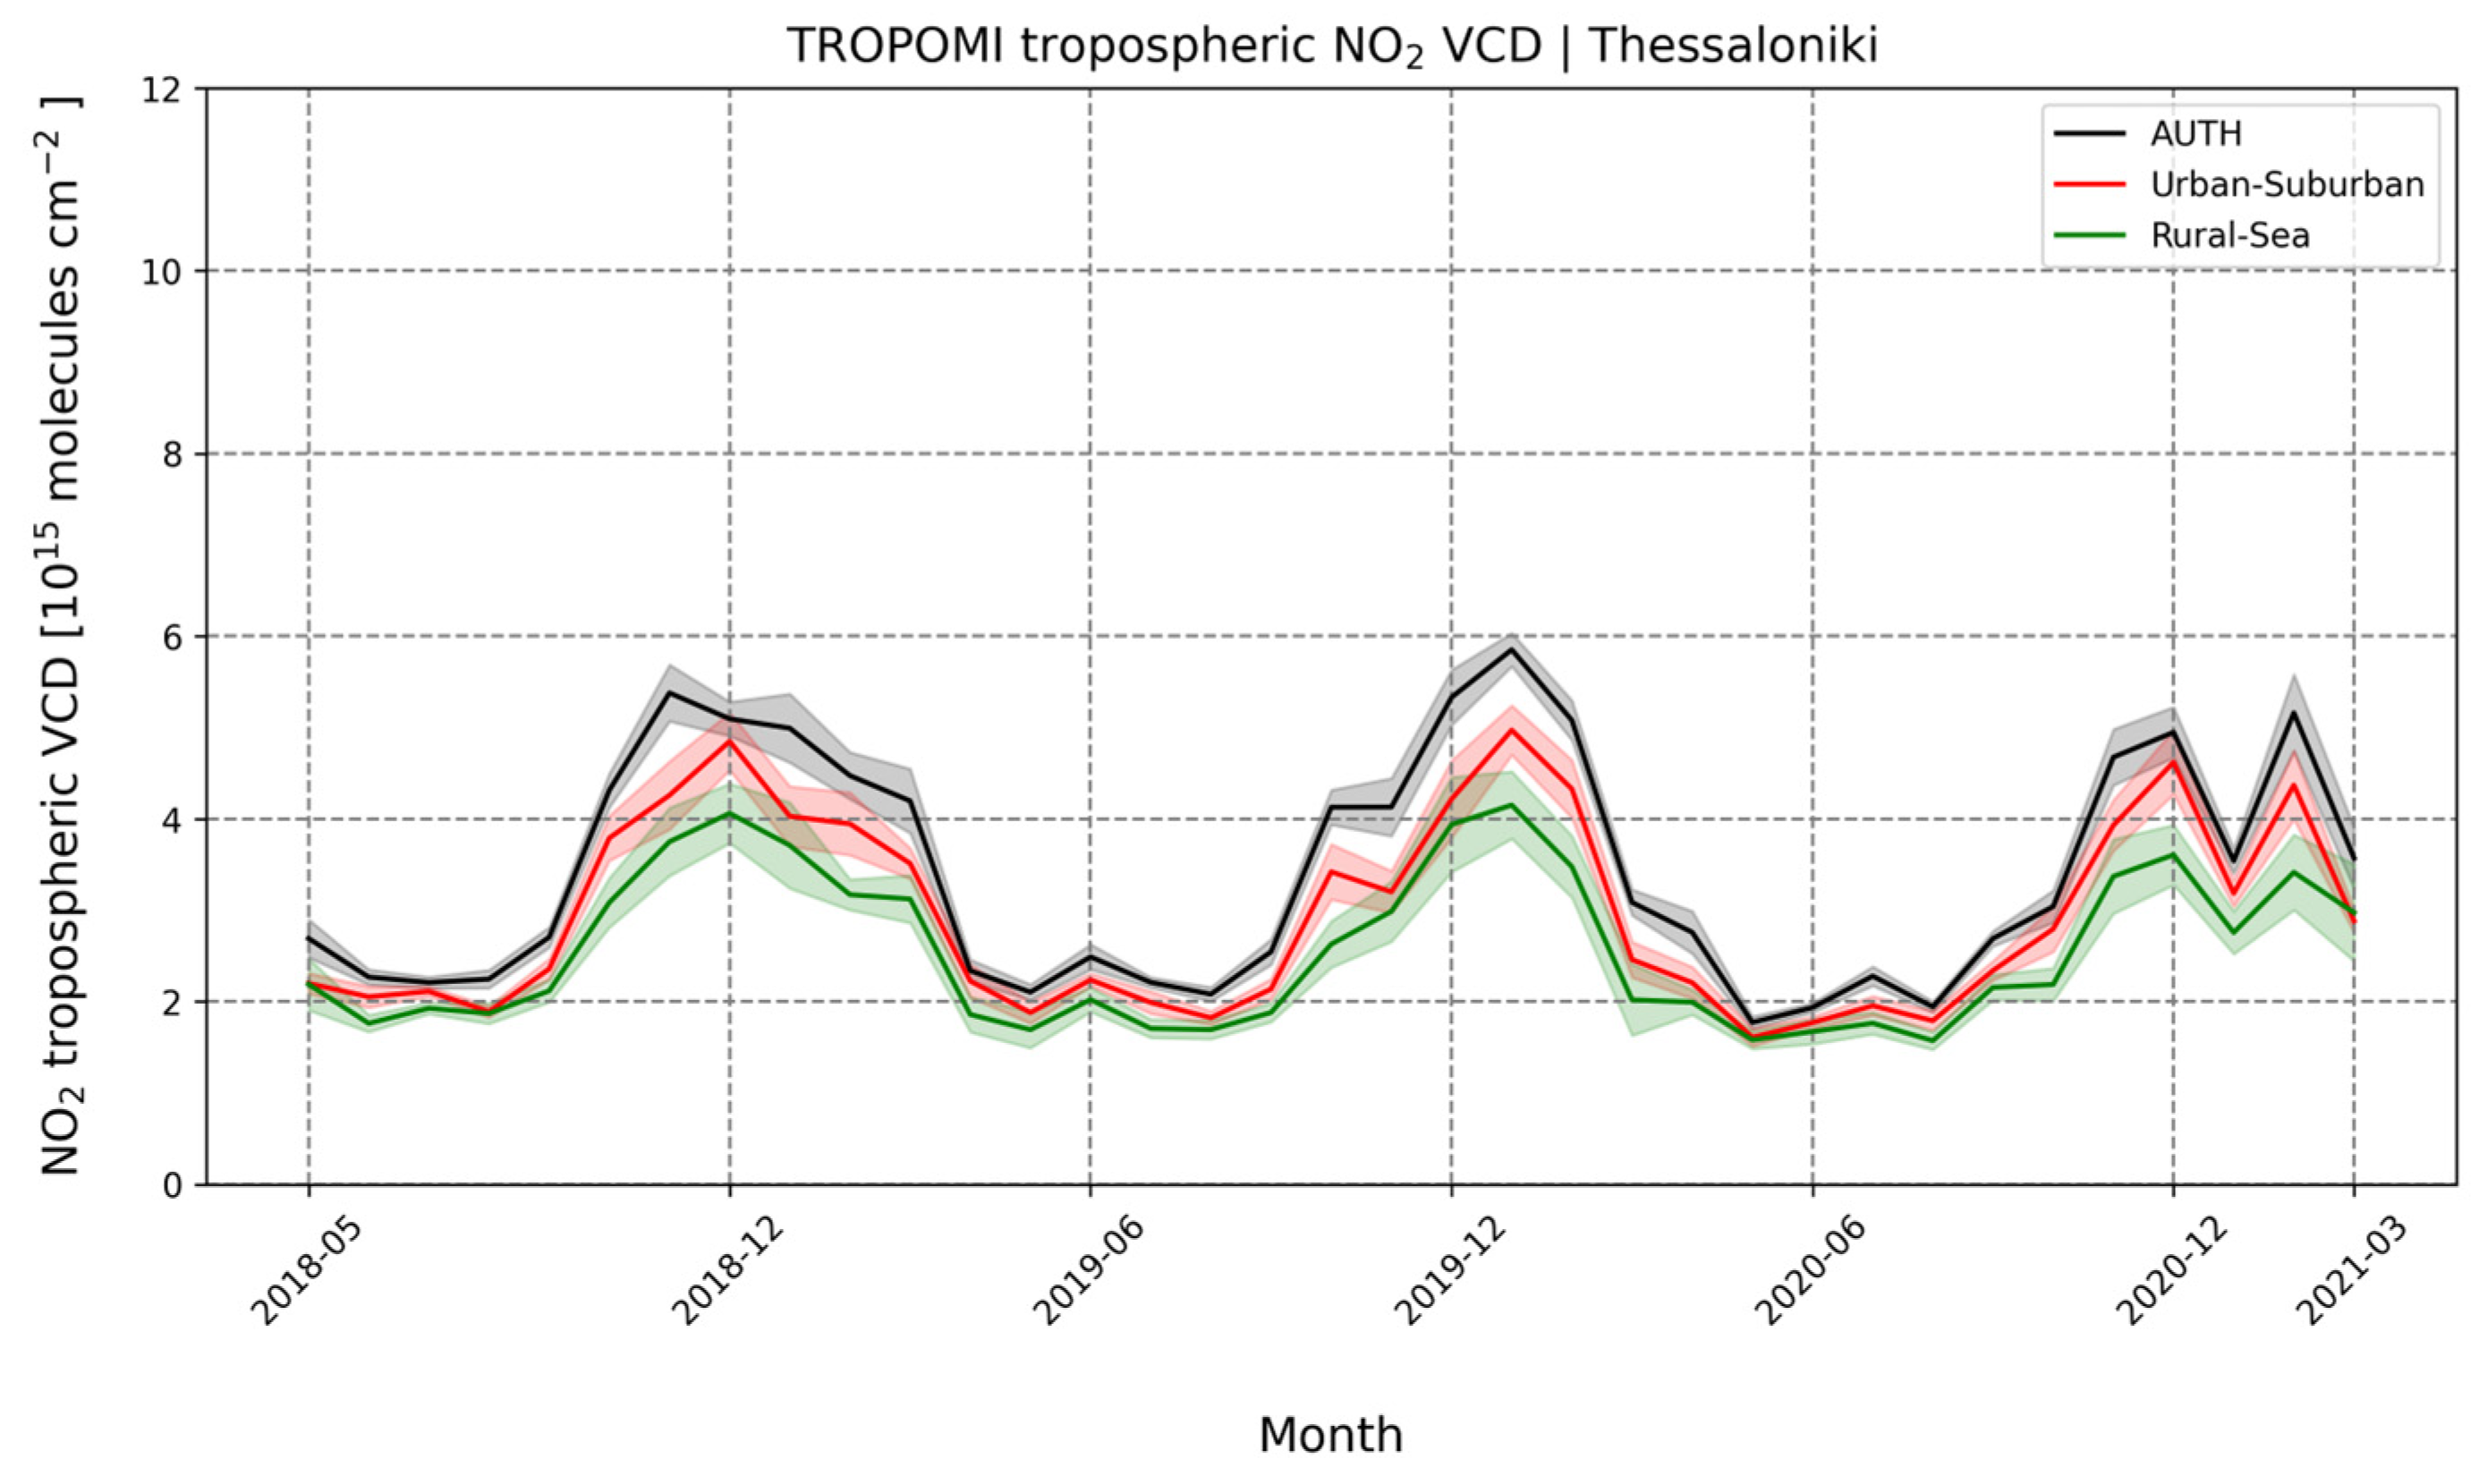
3.1.2. Time Series and Diurnal Variability

The time series of the TROPOMI tropospheric NO2 monthly mean loads (Figure 3) show a clear seasonal pattern for all locations studied, more pronounced for the city centre (black line) and the urban–suburban pixels (red line) than the rural–sea locations (green line) with the summertime lows at the ~1.5 × 10¹⁵ molecules/cm2 level and the wintertime highs at ~5.85, ~5.00 and ~4.15 × 10¹⁵ molecules/cm2 level, respectively. A curiously high load was observed for the month of February 2020, before COVID-19 related measures were enforced in Greece 11, which has been attributed to unusual meteorological conditions during that month, as also seen in the LOTOS-EUROS simulations, discussed below. Since the TROPOMI observations occur once per day, typically around 11:00–12:00 UTC over Thessaloniki, the shaded areas in the monthly mean time series represent the spatial variability of the chosen pixels. This variability is small, hence further testifying to the ability of the satellite sensor in viewing the different NO2 loads within the urban agglomeration.
The MAX-DOAS monthly mean tropospheric NO2 columns (1015 molecules/cm2) over Thessaloniki (Figure 4a) are presented as an average of all the viewing geometries shown in Figure 1, left, for the same sensing time as that of TROPOMI. The variability of the MAX-DOAS observations between the different viewing geometries was rather large and did not permit an analysis per viewing geometry. A possible reason is the horizontal distance of the MAX-DOAS observations which span more than one 0.05 × 0.05° (~5 × 5 km-pixels), ranging between 10–20 km depending on the season. This fact does not enable us to distinguish statistical significance between the different locations around Thessaloniki from the MAX-DOAS observations. Hence, one averaged MAX-DOAS dataset is shown in this work. Overall, the MAX-DOAS reports lows around 5 × 10¹⁵ molecules/cm2 for the summertime and highs reaching ~12 × 1015 molecules/cm2 in December, with a mean of 7.34 ± 2.15 × 10¹⁵ molecules/cm2, replicating the expected seasonal NO2 pattern albeit with higher absolute values than the satellite sensor.
The ability of the MAX-DOAS system to measure through the daylight hours, one of the strengths of this observational system, permits the discussion of the diurnal pattern of atmospheric gas. In Figure 4b the diurnal variability during wintertime is presented, as a box-plot, while the summertime is shown in Figure 4c. We note that during wintertime the mean levels remain high during the different sensing times, between ~6–7 × 10¹⁵ molecules/cm2, with high variability as shown by the standard error bars and the marked difference between mean (in blue) and median (in red) levels. This picture is well expected as the photochemical destruction of NO2 is weaker and the background levels of the species remain high, due to its increased lifetime. During summertime, the expected diurnal variability is very clear, with higher levels of ~7–8 × 10¹⁵ molecules/cm2, during rush hour (~05:00–06:00 UTC) and lows (~3–4 × 10¹⁵ molecules/cm2) after 10:00 UTC when sunlight is strong, with the secondary maximum appearing after 16:00 UTC when the photochemical NO2 destruction has slowed down.
The LOTOS-EUROS CTM simulations over the different locations around Thessaloniki are in complete agreement with that which the two observational sets have already revealed. In Figure 5a, the monthly mean time series of the same pixels and same overpass time as shown for TROPOMI (Figure 3) also show lows during the summertime and highs during the winter months, a clear distinction for the three different expected NO2 concentrations, including the peak of February 2020. As the entire timeline of the CTM simulations depends on the same NO2 emission inventory for the year 2017, this February 2020 increase may only be attributed to the special meteorological conditions of that month and corroborate the findings of the TROPOMI observations.
In more detail, the city centre location hosting the MAX-DOAS instrument reports a seasonality between 4.0 and 10.5 × 10¹⁵ molecules/cm2, with a mean load of 6.45 ± 1.68 × 10¹⁵ molecules/cm2, while the seasonality is similar for the urban-suburban and rural pixels, between 3.0 and 8.75 × 10¹⁵ molecules/cm2, albeit with somewhat different mean loads: for the urban–suburban, this was estimated to be 5.60 ± 1.50 × 10¹⁵ molecules/cm2 while for the rural location at 4.85 ± 1.50 × 10¹⁵ molecules/cm2. Recall that the standard deviations reported here, and shown as coloured shaded areas in the figures, represent the spatial variability of the hyper-grid and not a temporal variability.
Contrary to the satellite observations, which provide a picture of the situation for a specific time of day, and the MAX-DOAS observations, which provide the picture during daylight hours, the LOTOS-EUROS can provide estimates of the NO2 concentrations throughout the entire day. Of course, the CTM simulations depend on accurate input parameters and the correct representation of different physicochemical processes within the model. The CTM diurnal variability for winter (Figure 5b) and summer (Figure 5c) revealed issues in the modelling system, already identified by [33].
The first point of interest, for the winter diurnal patterns, is the unexpected higher night-time NO2 concentrations (after 16:00 UTC) which reach around 10–12 × 1015 molecules/cm2 well over the daytime maximum of ~9 × 10¹⁵ molecules/cm2. Study [33] validated LOTOS-EUROS surface NO2 simulations against air quality monitoring stations around Athens and Thessaloniki. The night-time comparisons were the most difficult to interpret; during the night period, the model overestimates the low NO2 measurements and underestimates the higher concentrations over the air quality stations. They concluded that the diurnal evolution of the boundary layer height appears to strongly affect both the mixing processes within the CTM and the photochemical NO2 destruction strength. These two processes may well be responsible for the unexpectedly high night-time NO2 concentrations for all locations examined during winter (Figure 5b). During summer (Figure 5c) a similar issue appears to occur, with the night-time max, however, only rising to the morning peak levels (~7–8 × 10¹⁵ molecules/cm2), possibly due to the rapid NO2 photochemical destruction.
The second point of interest is the model behaviour over the rural–sea pixel (green lines) both during wintertime (Figure 5b) and summertime (Figure 5c). With the absence of known strong emission sources, the very high levels reported in winter starting during the night-time hours after 18:00 UTC and flowing into daytime hours up to 10:00 UTC, were entirely unexpected. In Figure A1, maps of the LOTOS-EUROS tropospheric NO2 levels with colour-coded annotations of the locations of the pixels shown in Figure 5, are presented for winter and summertime averaged for 00:00–06:00, 06:00–12:00, 12:00–18:00 and 18:00–24:00 UTC. It is clear that the rural and sea pixels both depict extremely high NO2 levels during the entire day, apart from during the peak of the strong photochemical processing during the daylight hours. This surprising finding is corroborated by the Copernicus Atmospheric Monitoring Service, CAMS, regional ensemble re-analysis publicly available via the European air quality|Copernicus Atmosphere Monitoring Service. While this feature will be further investigated in the future, we can already note that the large scale dominant wind patterns for the region, shown in Figure A2, do not appear to explain this behaviour in themselves. During wintertime, northern winds are prominent throughout the day while during summertime more variable wind patterns can be observed depending on the time of day. These wind fields depict the ECMWF meteorological fields provided in a 7 × 7 km2 resolution to the LOTOS-EUROS model. The topography of the bay of Thessaloniki is however known to host extremely complex wind patterns which greatly affect the photochemical processes, discussed extensively in [7]. They reported moderate ozone levels for Thessaloniki throughout the day which are decisively affected by the break-up of the night-time temperature inversion and the onset of the sea breeze. Lessons learned from their work, which focuses on tropospheric O3, will be used to investigate this phenomenon further.

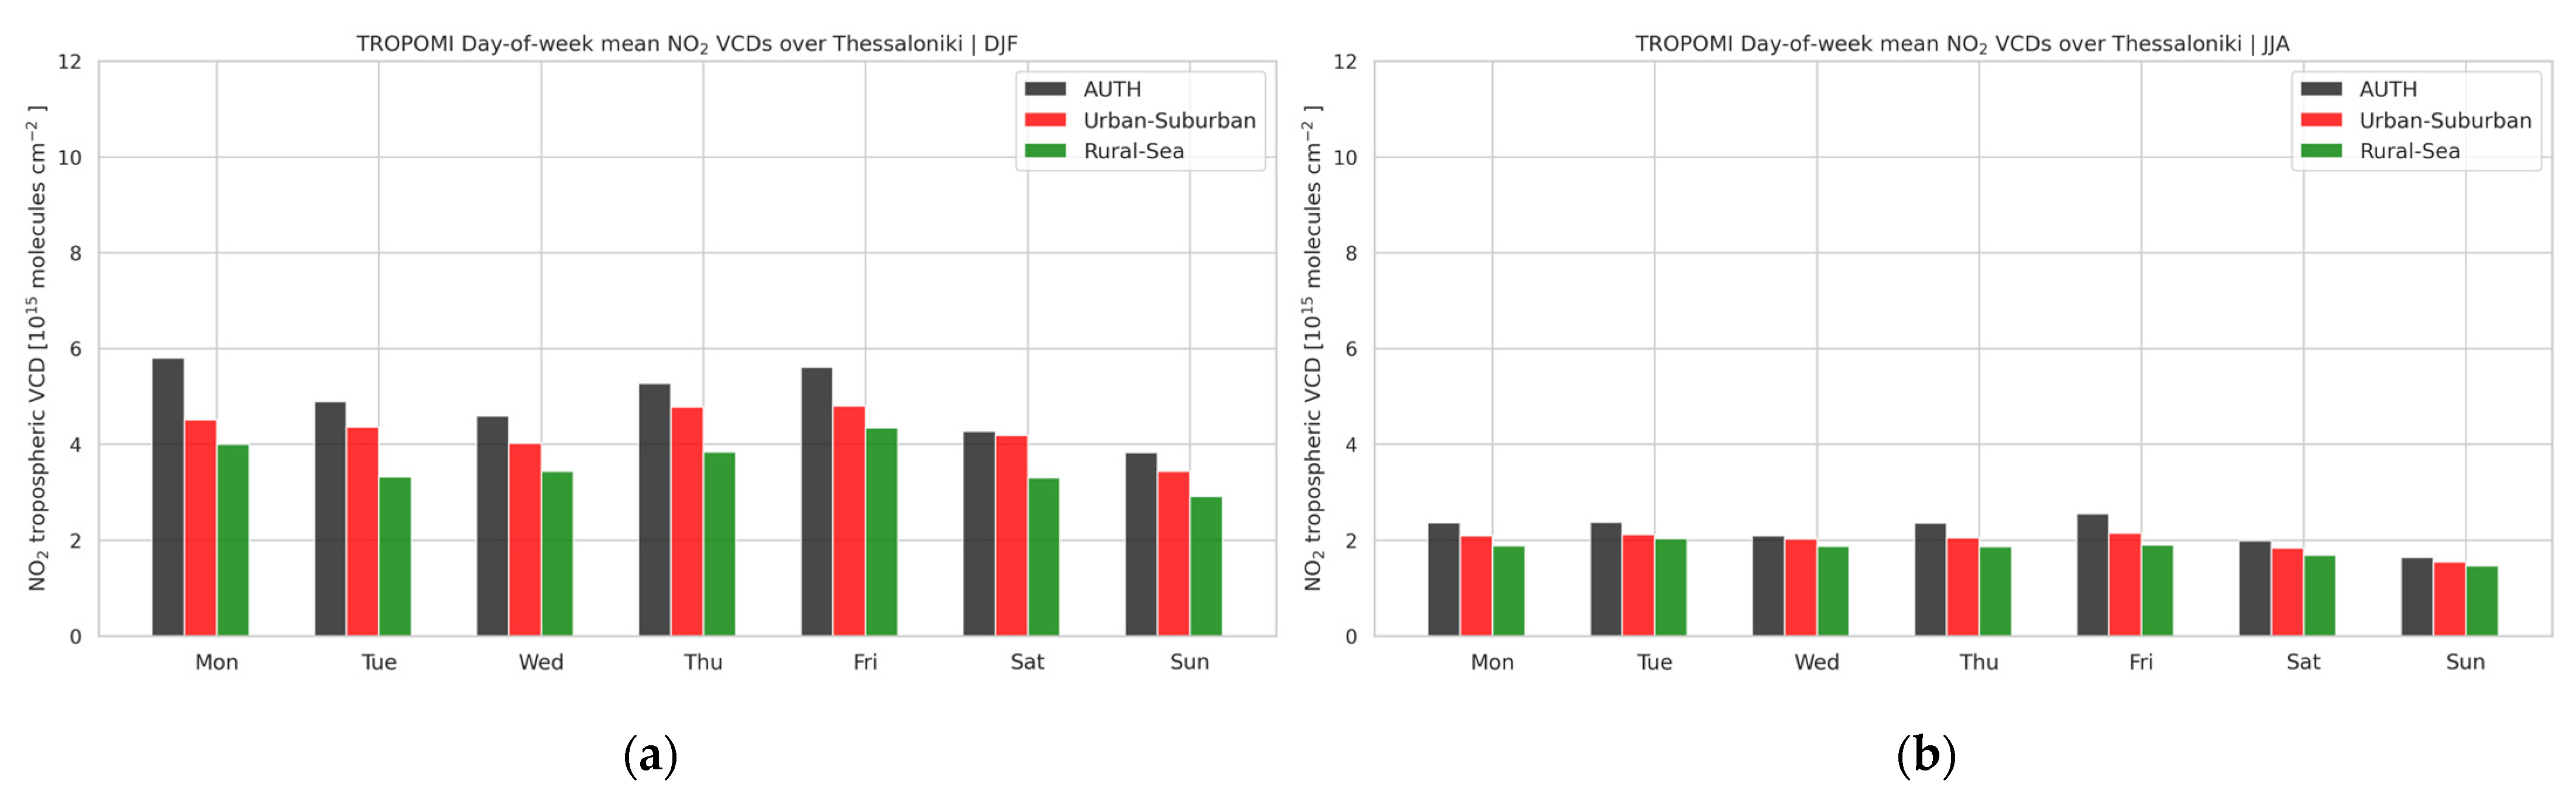
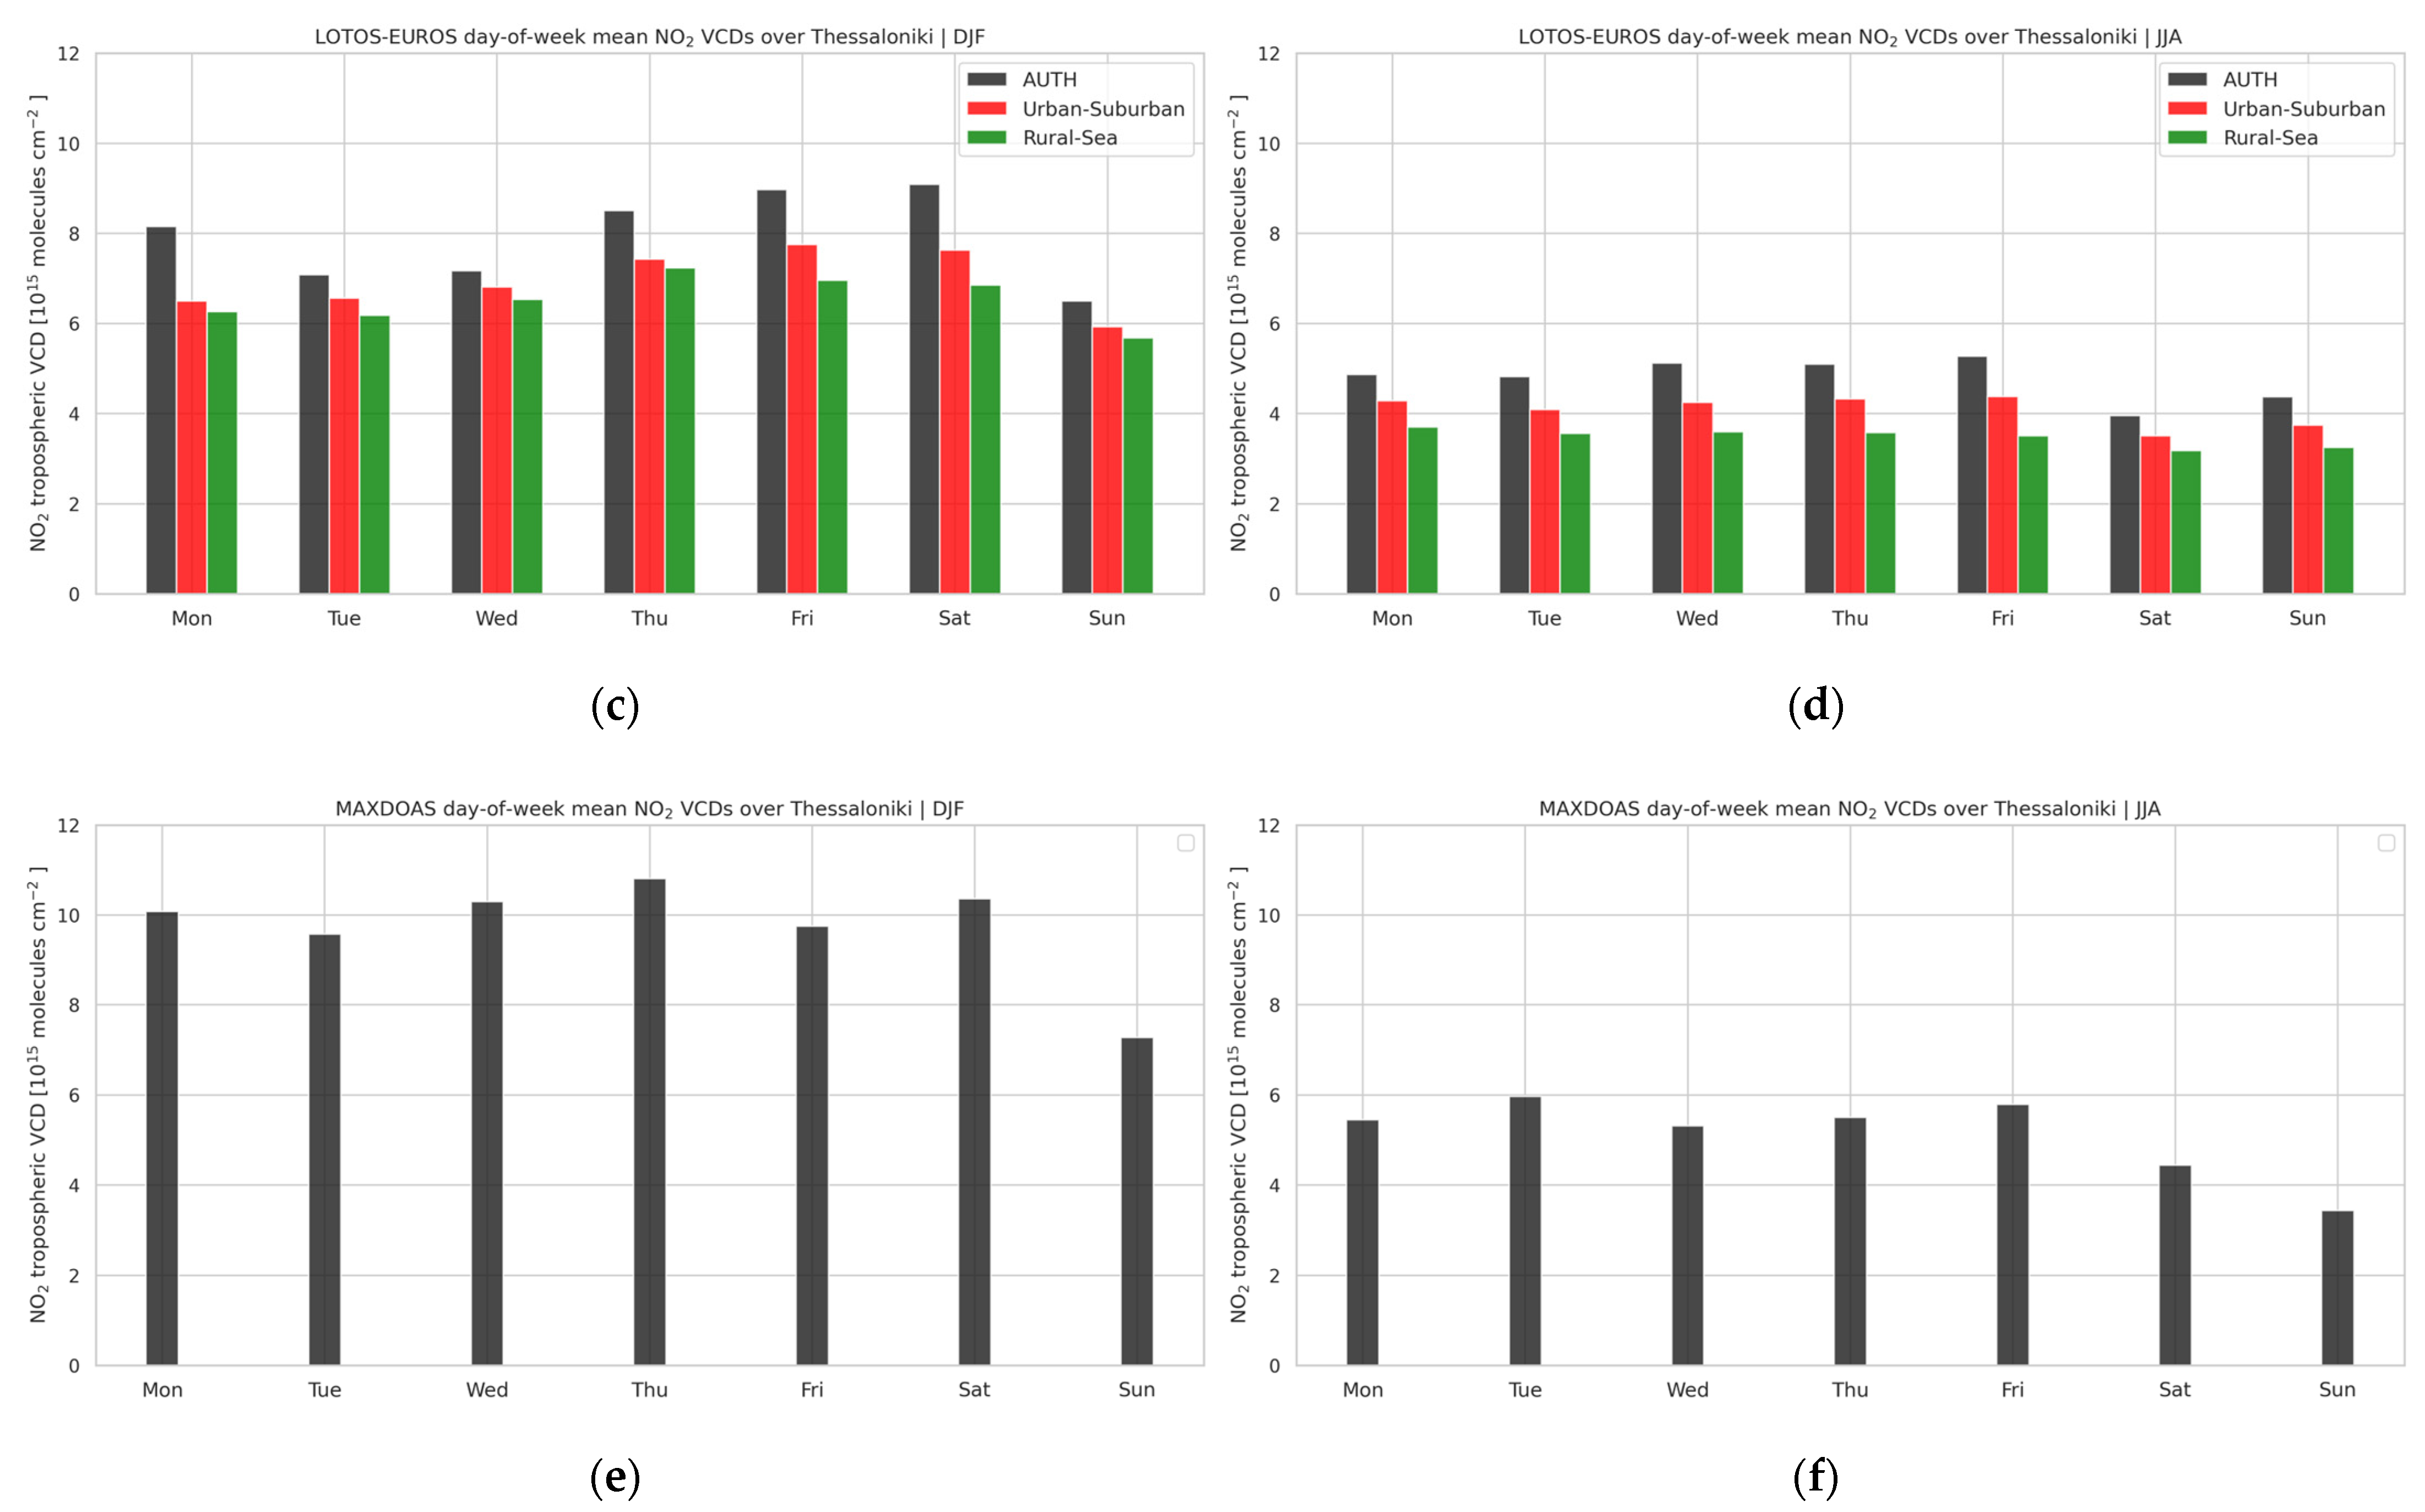
3.1.3. Day-of-Week Variability

The day-of-week, or weekly, variability of tropospheric NO2 has been examined in the past for major megacities on a global scale using different observational platforms. The authors of [37] studied the space-borne Global Ozone Monitoring Experiment (GOME)/ERS-2 tropospheric NO2 columns for industrialized regions and cities in the US, Europe and Japan and reported a clear Sunday minimum, of about 25–50% lower than working day levels. [38], using the Ozone Monitoring Instrument (OMI)/Aura and S5P/TROPOMI observations also reported a minimum ranging between 25% and 38% for large cities globally, for the traditional resting day of Sunday. Focusing on the continental US, [39], using only the high spatially resolution S5P/TROPOMI observations found that Saturday and Sunday NO2 concentrations are 16% and 24% lower, respectively, than during weekdays. These space-based dataset reports are well in line with the work of [40], who used in situ air quality monitoring stations for the agglomeration of Los Angeles, USA, where a 30%–35% Sunday decline in NO2 atmospheric content was reported.
Most of these studies focus on areas with a high anthropogenic NO2 atmospheric load which is not the case for the two Greek cities discussed here. The authors of [41] estimated that the S5P/TROPOMI tropospheric columns are about 20–30% lower during weekends over Helsinki, Finland, while a ground-based spectrophotometer, Pandora, also showed lower values but only by about 10–20%. In Figure 6, the wintertime (left column) and summertime (right column) day-of-week tropospheric NO2 concentrations are shown for the TROPOMI observations (top row), the LOTOS-EUROS simulations (middle row) and the MAX-DOAS measurements (bottom row). Even though the relative magnitudes for the NO2 concentrations differ greatly between the two seasons and type of dataset, the weekend effect is present in all three: TROPOMI reports a −20.2 ± 1.1% (−22.1 ± 2.5%) decline for Sunday, LOTOS-EUROS reports a −15.2 ± 2.1% (−7.8 ± 0.9%) and MAX-DOAS reports a −25.3% (−33.1%) during wintertime (summertime).
One further notes, from Table 2, that larger NO2 loads were sensed for Fridays with the LOTOS-EUROS CTM reporting the highest deviations of the weekly mean, at 10.5 ± 2.8% for winter and 6.0 ± 4.0% for the summer. The CTM results are attributed to the temporal profile used in the LOTOS-EUROS [42] which has recently been thoroughly updated in [43] and discussed by [44]. The resulting emissions are shown in Figure A3, where one notes the gradual increase of the input emissions between Monday and Friday, with a sharp drop on Saturday and even sharper on Sundays. An extensive analysis based on traffic count measurements at numerous locations around the Globe, including Athens, was developed for the road transport sector so as to calculate the monthly, weekly and hourly profiles required by the CTM. This increase is also reproduced by the TROPOMI observations which also show increased Friday loads by 15.7 ± 3.8% for winter and 10.0 ± 4.7% for summer.

3.2. Ioannina City and Environs

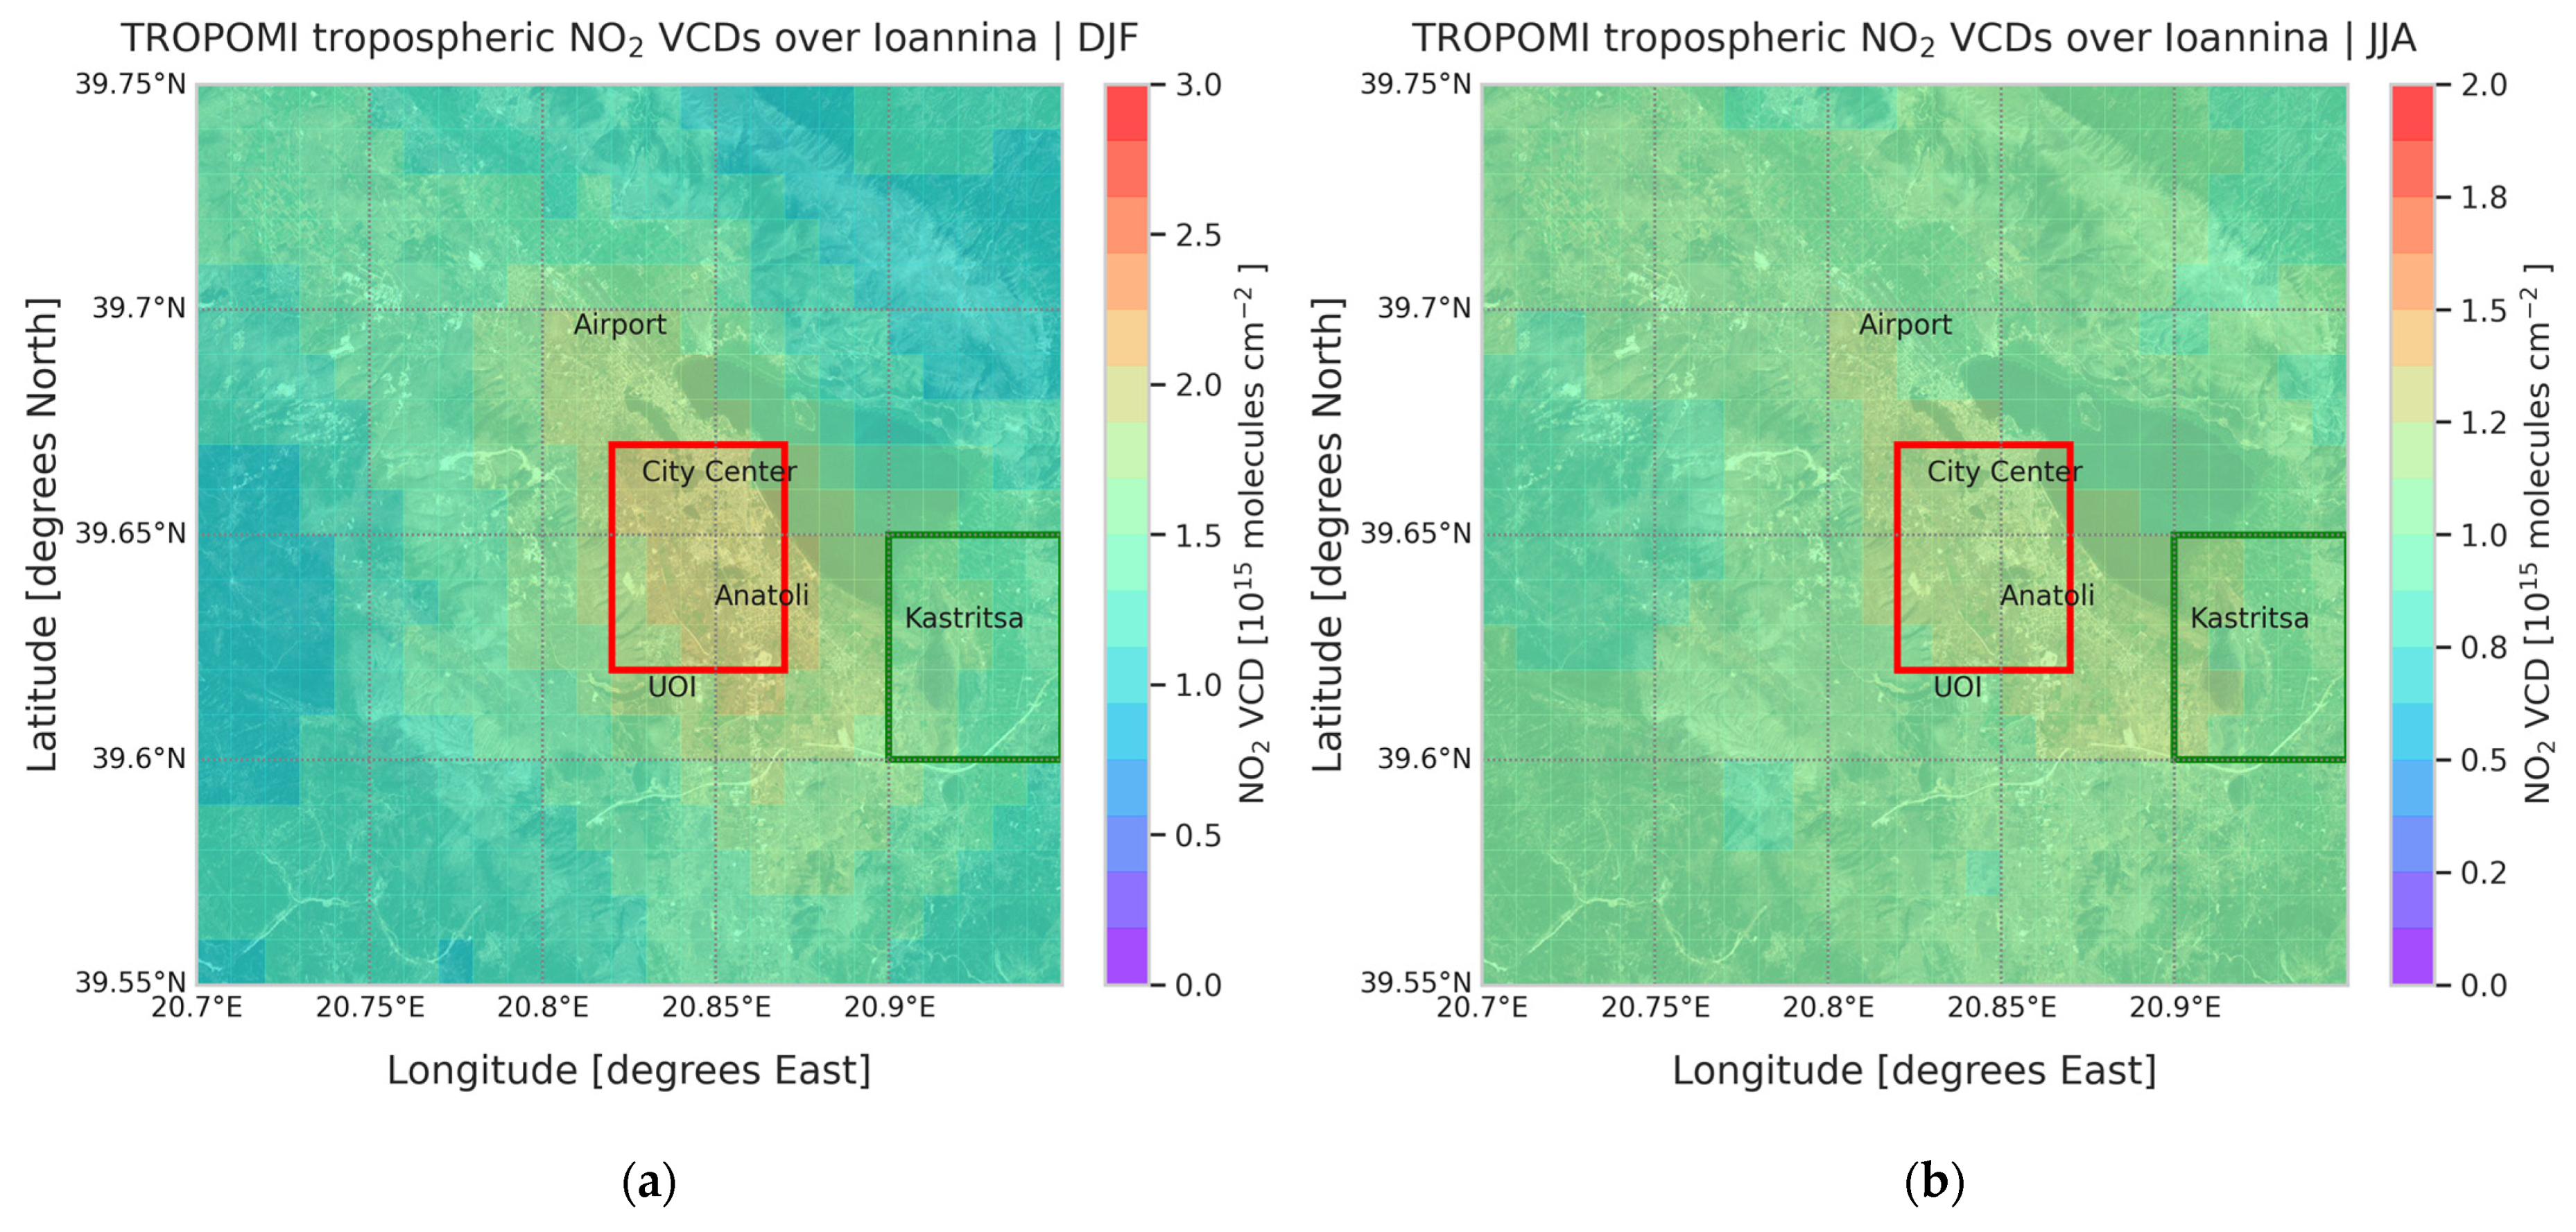
3.2.1. Spatial Variability within the City

Ioannina, a medium-sized city with no industrial zone, is exhibiting as expected far lower tropospheric NO2 loads than Thessaloniki. In Figure 7, the TROPOMI-reported NO2 levels are presented for the wintertime (left) and the summertime (right) including the location of the University of Ioannina, UOI, where the MAX-DOAS instrument was placed during the PANACEA winter campaign, the city centre, the small provincial airport as well a suburban location (Anatoli) and a rural location (Kastritsa.) Over the entire domain shown, the wintertime loads range between 1.02 and 2.02 × 10¹⁵ molecules/cm2, with a mean of 1.33 ± 0.23 × 10¹⁵ molecules/cm2 while the summertime loads range between 0.90 and 1.20 × 10¹⁵ molecules/cm2, with a mean of 1.04 ± 0.06 × 10¹⁵ molecules/cm2. The locations of the pixels chosen for further discussion are shown in red, for the urban–suburban locations and two of the MAX-DOAS viewing angles and in green, for the rural location and the third MAX-DOAS viewing angle.

3.2.2. Time Series and Diurnal Variability

When focusing on the two urban and rural pixels, a distinction between the tropospheric NO2 columns becomes clearer, especially during the wintertime months. For the urban pixels, which encompass the city of Ioannina and the main suburban location, the monthly mean time series of the TROPOMI observations (Figure 8, red line) show summertime lows at ~1.0 × 10¹⁵ molecules/cm2 and wintertime highs at ~3.0 × 10¹⁵ molecules/cm2 with mean annual loads of 1.44 ± 0.43 × 10¹⁵ molecules/cm2. For the rural pixel, in green, the summertime lows are ~ 0.67 × 10¹⁵ molecules/cm2, the wintertime highs at ~2.02 × 10¹⁵ molecules/cm2 and the mean annual load at 1.27 ± 0.26 × 10¹⁵ molecules/cm2. The February 2020 relatively high NO2 load, already identified for Thessaloniki, appears over Ioannina as well.
Due to the short time that the PANACEA campaign took place in Ioannina, the MAX-DOAS observations are limited to January and February 2020. From Figure 9a, where the daily mean observed tropospheric NO2 columns are shown, one notes that at the beginning of the PANACEA campaign the overall load over Ioannina was on average ~6.6 × 10¹⁵ molecules/cm2 while in the second part, after 25 January, the average load was ~3.65 × 10¹⁵ molecules/cm2. The shaded areas represent the variability of the hourly observations. In Figure 9b, the wintertime diurnal NO2 levels sensed by the MAX-DOAS are presented between 06:00 and 14:00 UTC, the full daytime hours. The increase in NO2 levels, between ~4 to ~6 × 10¹⁵ molecules/cm2), in the morning hours does not seem to abate, but rather levels remain high throughout the afternoon hours as well. The afternoon levels have a high variability associated with them, showing a very similar picture as what is measured by an in situ air quality monitoring station operating on location (not shown here).
A similar seasonal variability with higher overall NO2 levels as observed by TROPOMI is simulated by the CTM (Figure 10a) with summertime lows around 2 × 10¹⁵ molecules/cm2, and wintertime highs between 3–4 × 10¹⁵ molecules/cm2, depending on the year. The difference between the urban and rural locations is not so high, and in most cases within the spatial variability of the simulations. The LOTOS-EUROS diurnal variability in the case of Ioannina, shown for winter in Figure 10b and for summer in Figure 10c, presents an expected evolution with a double peak in the urban locations in the morning and evening. The wintertime evening levels are, as for the case of Thessaloniki, higher than the morning traffic-related levels and merit further investigation as to the exact physico-chemical processes that are driving these night-time increases.

3.2.3. Day-of-Week Variability

The day-of-week variability over Ioannina (Figure 11) follows the same patterns as for Thessaloniki, with the lowest tropospheric NO2 columnar value deviations reported for Sunday by all three data sources, with a different magnitude. The wintertime (left column) and summertime (right column) day-of-week tropospheric NO2 concentrations are shown for the TROPOMI observations (top row), the LOTOS-EUROS simulations (middle row) and the MAX-DOAS measurements (bottom row). The weekend effect is present in all three: TROPOMI reports a −16.3 ± 0.5% in winter (−21.5 ± 5.2% in summer) decline for Sunday, LOTOS-EUROS reports corresponding declines of −17.3 ± 2.8% in winter (−6.8 ± 1.2% in summer) and MAX-DOAS reports a very strong Sunday decrease, of −49%, which is based on five Sundays during winter 2020. All statistics are reported in Table 3.

4. Conclusions

In this work, the air quality due to nitrogen dioxide levels over two Northern Greek cities has been studied using Sentinel-5Precursor TROPOspheric Monitoring Instrument (TROPOMI) space-born observations, Multi-Axis Differential Optical Absorption Spectroscopy (MAX-DOAS) ground-based measurements and the LOng Term Ozone Simulation-EURopean Operational Smog (LOTOS-EUROS) chemical transport modelling system simulations. Each of these systems offers a different perspective on the current air quality situation over Thessaloniki and Ioannina depending on their spatiotemporal monitoring capabilities of the tropospheric NO2 levels. While these levels differ in magnitude between the two cities, following the different magnitudes of their NOx emitting sources, a common picture emerges as follows:
A clear seasonal pattern, with high NO2 levels during wintertime and lower NO2 levels in summer was found, clearly reflecting the effect of the high photochemistry strengths during the main sunlight summer months over Greece, by all three systems.
A marked distinction between locations with high emitting sources and clean locations around the urban sprawl were reported by both the space-borne observations and the model simulations.
The expected NO2 diurnal variability, less pronounced during wintertime but quite strong during summertime, was seen in both the ground-based measurements as well as the model simulations.
All three systems identified a discernible day-of-week variability with the lowest levels reported for Sundays in both seasons, reflecting the effect of reduced traffic emissions in both Greek cities.
Furthermore, the following open questions were identified and are thought to merit further investigation in the future:
The effect of the small scale wind patterns around the city of Thessaloniki and its bay was divulged in both the space-borne observations and the model simulations. The continuous transport of the pollutant in nearby locations may be responsible for a constant background NO2 level, which cannot be assessed by the air quality monitoring stations that are located within the city boundaries.
Extremely high NO2 levels during the night-time hours are simulated by the CTM which were unexpected considering the relatively low NO2 loads over the two cities were reported for the first time. The main physicochemical mechanism behind these enhancements should be investigated so as to assess its representativeness to the true situation.
The launch of the EUMETSAT Sentinel-4 UVN (Ultraviolet–Visible Near-infrared) imaging spectrometer on the geostationary MTG-S platform in early 2024 will offer a complete hourly space-borne observational dataset that will undoubtedly provide further insights on the air quality status over Greece.

Author Contributions

Conceptualization, D.B. and A.B.; methodology, M.-E.K. and D.B.; software, A.P. and M.-E.K.; validation, D.K. and I.S.; investigation, A.P. and I.S.; data curation, M.-E.K., A.P., D.K. and T.D.; writing—original draft preparation, M.-E.K.; writing—review and editing, A.P. and I.S.; supervision, D.B., D.M. and N.H. All authors have read and agreed to the published version of the manuscript.

Funding

This research has been financed by the European Union (European Regional Development Fund) and Greek national funds through the Operational Program “Competitiveness, Entrepreneurship and Innovation” (NSRF 2014–2020) by the “Panhellenic Infrastructure for Atmospheric Composition and Climate Change” project (MIS 5021516) implemented under the Action “Reinforcement of the Research and Innovation” infrastructure.

Institutional Review Board Statement

Not applicable.

Informed Consent Statement

Not applicable.

Data Availability Statement

The S5P/TROPOMI observations are publicly available from the Copernicus Open Access Hub (https://scihub.copernicus.eu/) [45]. The LOTOS-EUROS CTM simulations shown in this work are performed with the open-source version v02.02.001 and are available upon request from A.P. The MAX-DOAS observations are available upon request from D.K.

Acknowledgments

We would like to wholeheartedly thank Astrid Manders and Arjo Segers, TNO, Climate, Air and Sustainability, Utrecht, the Netherlands, for their valuable advice on the LOTOS-EUROS CTM. Results presented in this work have been produced using the Aristotle University of Thessaloniki (AUTH) High Performance Computing Infrastructure and Resources. The authors would like to acknowledge the support provided by the AUTH IT Centre throughout the progress of this research work. We further acknowledge the Atmospheric Toolbox®.

Conflicts of Interest

The authors declare no conflict of interest.

Appendix A

Figure A1. LOTOS-EUROS tropospheric NO2 columns (1015 molecules/cm2) over Thessaloniki for (a) winter and (b) summertime, averaged within four 6 h increments.
Atmosphere 13 00840 g0a1
Figure A2. Wind speed (ms−1) and direction rose diagrams for the AUTH pixel for (a) winter and (b) summertime.
Atmosphere 13 00840 g0a2
Figure A3. Weekly and seasonal variability of the NO2 emissions (μgm−2 s−1) over the specific locations around the urban area.
Atmosphere 13 00840 g0a3

References

  1. World Health Organization, WHO. Ambient Air Pollution: A Global Assessment of Exposure and Burden of Disease; World Health Organization: Geneva, Switzerland, 2016; ISBN 9789241511353. Available online: https://apps.who.int/iris/handle/10665/250141 (accessed on 27 August 2021).
  2. European Environmental Agency, EEA. Air Quality in Europe—2018 Report; Publications Office of the European Union: Luxembourg, 2020; ISBN 978-92-9213-989-6. ISSN 1977-8449. Available online: https://www.eea.europa.eu/publications/air-quality-in-europe-2018 (accessed on 18 November 2021). [CrossRef]
  3. European Environmental Agency, EEA. Air Quality in Europe—2020 Report; Publications Office of the European Union: Luxembourg, 2020; ISBN 978-92-9480-292-7. ISSN 1977-8449. Available online: https://www.eea.europa.eu/publications/air-quality-in-europe-2020-report (accessed on 18 November 2021). [CrossRef]
  4. European Union, EU. The Environmental Implementation Review 2019, Country Report: Greece. Available online: https://ec.europa.eu/environment/eir/pdf/report_el_en.pdf (accessed on 18 November 2021).
  5. European Environmental Agency, EEA. Air Quality Data Service. 2022. Available online: https://www.eea.europa.eu/ds_resolveuid/DAS-19-en (accessed on 11 April 2022).
  6. Seinfeld, J.H.; Pandis, S.N. Atmospheric Chemistry and Physics: From Air Pollution to Climate Change, 3rd ed.; John Wiley & Sons, Inc.: Hoboken, NJ, USA, 2016; ISBN 978-1-118-94740-1. [Google Scholar]
  7. Moussiopoulos, N.; Papalexiou, S.; Sahm, P. Wind flow and photochemical air pollution in Thessaloniki, Greece. Part I: Simulations with the European Zooming Model. Environ. Model. Softw. 2006, 21, 1741–1751. [Google Scholar] [CrossRef]
  8. Poupkou, A.; Nastos, P.; Melas, D.; Zerefos, C. Climatology of Discomfort Index and Air Quality Index in a Large Urban Mediterranean Agglomeration. Water Air Soil Pollut. 2011, 222, 163–183. [Google Scholar] [CrossRef]
  9. Fameli, K.M.; Assimakopoulos, V.D. Development of a road transport emission inventory for Greece and the Greater Athens Area: Effects of important parameters. Sci. Total Environ. 2015, 505, 770–786. [Google Scholar] [CrossRef] [Green Version]
  10. Moussiopoulos, Ν.; Vlachokostas, C.; Tsilingiridis, G.; Douros, I.; Hourdakis, E.; Naneris, C.; Sidiropoulos, C. Air quality status in Greater Thessaloniki Area and the emission reductions needed for attaining the EU air quality legislation. Sci. Total Environ. 2009, 407, 1268–1285. [Google Scholar] [CrossRef]
  11. Koukouli, M.E.; Skoulidou, I.; Karavias, A.; Parcharidis, I.; Balis, D.; Manders, A.; Segers, A.; Eskes, H.; Van Geffen, J. Sudden changes in nitrogen dioxide emissions over Greece due to lockdown after the outbreak of COVID-19. Atmos. Chem. Phys. 2021, 21, 1759–1774. [Google Scholar] [CrossRef]
  12. Akritidis, D.; Zanis, P.; Georgoulias, A.K.; Papakosta, E.; Tzoumaka, P.; Kelessis, A. Implications of COVID-19 Restriction Measures in Urban Air Quality of Thessaloniki, Greece: A Machine Learning Approach. Atmosphere 2021, 12, 1500. [Google Scholar] [CrossRef]
  13. Liora, N.; Poupkou, A.; Kontos, S.; Meleti, C.; Chrysostomou, K.; Aifadopoulou, G.; Zountsa, S.; Kalogirou, C.; Chacartegui, R.; Liguori, F.; et al. Estimating Road Transport Pollutant Emissions Under Traffic-Congested Conditions with an Integrated Modelling Tool—Emissions Reduction Scenarios Analysis. Emiss. Control Sci. Technol. 2021, 7, 137–152. [Google Scholar] [CrossRef]
  14. Sindosi, O.A.; Markozannes, G.; Rizos, E.; Ntzani, E. Effects of economic crisis on air quality in Ioannina, Greece. J. Environ. Sci. Health Part A 2019, 54, 768–781. [Google Scholar] [CrossRef] [PubMed]
  15. Stavroulas, I.; Grivas, G.; Michalopoulos, P.; Liakakou, E.; Bougiatioti, A.; Kalkavouras, P.; Fameli, K.M.; Hatzianastassiou, N.; Mihalopoulos, N.; Gerasopoulos, E. Field Evaluation of Low-Cost PM Sensors (Purple Air PA-II) Under Variable Urban Air Quality Conditions, in Greece. Atmosphere 2020, 11, 926. [Google Scholar] [CrossRef]
  16. Pinardi, G.; Van Roozendael, M.; Abuhassan, N.; Adams, C.; Cede, A.; Clémer, K.; Fayt, C.; Frieß, U.; Gil, M.; Herman, J.; et al. MAXDOAS formaldehyde slant column measurements during CINDI: Intercomparison and analysis improvement. Atmos. Meas. Tech. 2013, 6, 167–185. [Google Scholar] [CrossRef] [Green Version]
  17. Wang, Y.; Lampel, J.; Xie, P.; Beirle, S.; Li, A.; Wu, D.; Wagner, T. Ground-based MAX-DOAS observations of tropospheric aerosols, NO2, SO2 and HCHO in Wuxi, China, from 2011 to 2014. Atmos. Chem. Phys. 2017, 17, 2189–2215. [Google Scholar] [CrossRef] [Green Version]
  18. Chan, K.L.; Wiegner, M.; van Geffen, J.; De Smedt, I.; Alberti, C.; Cheng, Z.; Ye, S.; Wenig, M. MAX-DOAS measurements of tropospheric NO2 and HCHO in Munich and the comparison to OMI and TROPOMI satellite observations. Atmos. Meas. Tech. 2020, 13, 4499–4520. [Google Scholar] [CrossRef]
  19. Hönninger, G.; von Friedeburg, C.; Platt, U. Multi axis differential optical absorption spectroscopy (MAX-DOAS). Atmos. Chem. Phys. 2004, 4, 231–254. [Google Scholar] [CrossRef] [Green Version]
  20. Platt, U.; Stutz, J. Differential Optical Absorption Spectroscopy; Springer: Berlin/Heidelberg, Germany, 2008. [Google Scholar] [CrossRef] [Green Version]
  21. Drosoglou, T.; Bais, A.F.; Zyrichidou, I.; Kouremeti, N.; Poupkou, A.; Liora, N.; Giannaros, C.; Koukouli, M.E.; Balis, D.; Melas, D. Comparisons of ground-based tropospheric NO2 MAX-DOAS measurements to satellite observations with the aid of an air quality model over the Thessaloniki area, Greece. Atmos. Chem. Phys. 2017, 17, 5829–5849. [Google Scholar] [CrossRef] [Green Version]
  22. Drosoglou, T.; Koukouli, M.E.; Kouremeti, N.; Bais, A.F.; Zyrichidou, I.; Balis, D.; van der A, R.J.; Xu, J.; Li, A. MAXDOAS NO2 observations over Guangzhou, China; ground-based and satellite comparisons. Atmos. Meas. Tech. 2018, 11, 2239–2255. [Google Scholar] [CrossRef] [Green Version]
  23. Gkertsi, F.; Bais, A.; Kouremeti, N.; Drosoglou, T.; Fountoulakis, I.; Fragkos, K. DOAS-based total column ozone retrieval from Phaethon system. Atmos. Environ. 2018, 180, 51–58. [Google Scholar] [CrossRef]
  24. Karagkiozidis, D.; Friedrich, M.M.; Beirle, S.; Bais, A.; Hendrick, F.; Voudouri, K.A.; Fountoulakis, I.; Karanikolas, A.; Tzoumaka, P.; Van Roozendael, M.; et al. Retrieval of tropospheric aerosol, NO2, and HCHO vertical profiles from MAX-DOAS observations over Thessaloniki, Greece: Intercomparison and validation of two inversion algorithms. Atmos. Meas. Tech. 2022, 15, 1269–1301. [Google Scholar] [CrossRef]
  25. Friedrich, M.M.; Rivera, C.; Stremme, W.; Ojeda, Z.; Arellano, J.; Bezanilla, A.; García-Reynoso, J.A.; Grutter, M. NO2 vertical profiles and column densities from MAX-DOAS measurements in Mexico City. Atmos. Meas. Tech. 2019, 12, 2545–2565. [Google Scholar] [CrossRef] [Green Version]
  26. Veefkind, J.P.; Aben, I.; McMullan, K.; Förster, H.; de Vries, J.; Otter, G.; Claas, J.; Eskes, H.J.; de Haan, J.F.; Kleipool, Q.; et al. TROPOMI on the ESA Sentinel-5 Precursor: A GMES mission for global observations of the atmospheric composition for climate, air quality and ozone layer applications. Remote Sens. Environ. 2012, 120, 70–83. [Google Scholar] [CrossRef]
  27. van Geffen, J.H.G.M.; Eskes, H.J.; Boersma, K.F.; Maasakkers, J.D.; Veefkind, J.P. TROPOMI ATBD of the Total and Tropospheric NO2 Data Products, Report S5P-KNMI-L2-0005-RP; Issue 2.2.0; KNMI: De Bilt, The Netherlands, 16 June 2021; Available online: https://sentinel.esa.int/documents/247904/2476257/Sentinel-5P-TROPOMI-ATBD-NO2-data-products (accessed on 26 April 2022).
  28. van Geffen, J.; Boersma, K.F.; Eskes, H.; Sneep, M.; Ter Linden, M.; Zara, M.; Veefkind, J.P. S5P TROPOMI NO2 slant column retrieval: Method, stability, uncertainties and comparisons with OMI. Atmos. Meas. Tech. 2020, 13, 1315–1335. [Google Scholar] [CrossRef] [Green Version]
  29. S5P MPC Routine Operations Consolidated Validation Report (ROCVR). Quarterly Validation Report of the Copernicus Sentinel-5 Precursor Operational Data Products #13: April 2018–December 2021, version 06.0.1, S5P-MPC-IASB-ROCVR-13.01.00-20211217; Lambert, J.-C., Keppens, A., Eds.; Sentinel-5 Precursor Mission Performance Centre, 17 December 2021; Available online: https://s5p-mpc-vdaf.aeronomie.be/ProjectDir/reports//pdf/S5P-MPC-IASB-ROCVR-13.00.10-20211217_signed.pdf (accessed on 26 April 2022).
  30. Manders, A.M.M.; Builtjes, P.J.H.; Curier, L.; Denier van der Gon, H.A.C.; Hendriks, C.; Jonkers, S.; Kranenburg, R.; Kuenen, J.J.P.; Segers, A.J.; Timmermans, R.M.A.; et al. Curriculum vitae of the LOTOS–EUROS (v2.0) chemistry transport model. Geosci. Model Dev. 2017, 10, 4145–4173. [Google Scholar] [CrossRef] [Green Version]
  31. Lopez-Restrepo, S.; Yarce, A.; Pinel, N.; Quintero, O.L.; Segers, A.; Heemink, A.W. Urban Air Quality, Modeling Using Low-Cost Sensor Network and Data Assimilation in the Aburrá Valley, Colombia. Atmosphere 2021, 12, 91. [Google Scholar] [CrossRef]
  32. Blechschmidt, A.-M.; Arteta, J.; Coman, A.; Curier, L.; Eskes, H.; Foret, G.; Gielen, C.; Hendrick, F.; Marécal, V.; Meleux, F.; et al. Comparison of tropospheric NO2 columns from MAX-DOAS retrievals and regional air quality model simulations. Atmos. Chem. Phys. 2020, 20, 2795–2823. [Google Scholar] [CrossRef] [Green Version]
  33. Skoulidou, I.; Koukouli, M.-E.; Manders, A.; Segers, A.; Karagkiozidis, D.; Gratsea, M.; Balis, D.; Bais, A.; Gerasopoulos, E.; Stavrakou, T.; et al. Evaluation of the LOTOS-EUROS NO2 simulations using ground-based measurements and S5P/TROPOMI observations over Greece. Atmos. Chem. Phys. 2021, 21, 5269–5288. [Google Scholar] [CrossRef]
  34. Gery, M.W.; Whitten, G.Z.; Killus, J.P.; Dodge, M.C. A photochemical kinetics mechanism for urban and regional scale computer modeling. J. Geophys. Res. Earth Surf. 1989, 94, 12925–12956. [Google Scholar] [CrossRef]
  35. Fountoukis, C.; Nenes, A. ISORROPIA II: A computationally efficient thermodynamic equilibrium model for K+–Ca2+–Mg2+–NH4+–Na+–SO42−–NO3–Cl–H2O aerosols. Atmos. Chem. Phys. 2007, 7, 4639–4659. [Google Scholar] [CrossRef] [Green Version]
  36. Novak, J.H.; Pierce, T.E. Natural emissions of oxidant precursors. Water Air Soil Pollut. 1993, 67, 57–77. [Google Scholar] [CrossRef]
  37. Beirle, S.; Platt, U.; Wenig, M.; Wagner, T. Weekly cycle of NO2 by GOME measurements: A signature of anthropogenic sources. Atmos. Chem. Phys. 2003, 3, 2225–2232. [Google Scholar] [CrossRef] [Green Version]
  38. Stavrakou, T.; Müller, J.-F.; Bauwens, M.; Boersma, K.F.; Van Geffen, J. Satellite evidence for changes in the NO2 weekly cycle over large cities. Sci. Rep. 2020, 10, 10066. [Google Scholar] [CrossRef]
  39. Goldberg, D.L.; Anenberg, S.C.; Kerr, G.H.; Mohegh, A.; Lu, Z.; Streets, D.G. TROPOMI NO 2 in the United States: A Detailed Look at the Annual Averages, Weekly Cycles, Effects of Temperature, and Correlation with Surface NO2 Concentrations. Earth’s Futur. 2021, 9, e2020EF001665. [Google Scholar] [CrossRef]
  40. Wang, H.; Gong, F.-Y.; Newman, S.; Zeng, Z.-C. Consistent weekly cycles of atmospheric NO2, CO, and CO2 in a North American megacity from ground-based, mountaintop, and satellite measurements. Atmos. Environ. 2022, 268, 118809. [Google Scholar] [CrossRef]
  41. Ialongo, I.; Virta, H.; Eskes, H.; Hovila, J.; Douros, J. Comparison of TROPOMI/Sentinel-5 Precursor NO2 observations with ground-based measurements in Helsinki. Atmos. Meas. Tech. 2020, 13, 205–218. [Google Scholar] [CrossRef] [Green Version]
  42. Kuenen, J.J.P.; Visschedijk, A.J.H.; Jozwicka, M.; Denier van der Gon, H.A.C. TNO-MACC_II emission inventory; a multi-year (2003–2009) consistent high-resolution European emission inventory for air quality modelling. Atmos. Chem. Phys. 2014, 14, 10963–10976. [Google Scholar] [CrossRef] [Green Version]
  43. Kuenen, J.; Dellaert, S.; Visschedijk, A.; Jalkanen, J.-P.; Super, I.; Denier van der Gon, H. CAMS-REG-v4: A state-of-the-art high-resolution European emission inventory for air quality modelling. Earth Syst. Sci. Data 2022, 14, 491–515. [Google Scholar] [CrossRef]
  44. Guevara, M.; Jorba, O.; Tena, C.; Denier van der Gon, H.; Kuenen, J.; Elguindi, N.; Darras, S.; Granier, C.; Pérez García-Pando, C. Copernicus Atmosphere Monitoring Service TEMPOral profiles (CAMS-TEMPO): Global and European emission temporal profile maps for atmospheric chemistry modelling. Earth Syst. Sci. Data 2021, 13, 367–404. [Google Scholar] [CrossRef]
  45. ESA. Copernicus Open Access Hub. Available online: https://scihub.copernicus.eu/ (accessed on 12 March 2022).
Figure 1. The Thessaloniki (a) and Ioannina (b) urban areas, including the location of the MAX-DOAS instrument and their respective viewing geometries.
Atmosphere 13 00840 g001
Figure 2. TROPOMI tropospheric NO2 seasonal load (1015 molecules/cm2) over Thessaloniki during wintertime (a) and summertime (b). Important locations of possible NO2 emitting sources are also shown. Coloured cells represent the cells used in the analysis.
Atmosphere 13 00840 g002
Figure 3. Monthly mean TROPOMI tropospheric NO2 columns (1015 molecules/cm2) over Thessaloniki for specific locations according to their known emission capabilities. The shaded areas represent the standard deviation of the spatial mean.
Atmosphere 13 00840 g003
Figure 4. (a) Monthly mean MAX-DOAS tropospheric NO2 columns (1015 molecules/cm2) over Thessaloniki. Diurnal variability during wintertime (b) and summertime (c).
Atmosphere 13 00840 g004
Figure 5. (a) Monthly mean LOTOS-EUROS tropospheric NO2 columns (1015 molecules/cm2) over Thessaloniki for specific locations as per Figure 3. Diurnal variability during wintertime (b) and summertime (c).
Atmosphere 13 00840 g005
Figure 6. Day-of-week variability of tropospheric NO2 columns (1015 molecules/cm2) over Thessaloniki revealed by TROPOMI observations during wintertime (a) and summertime (b), LOTOS-EUROS simulations during wintertime (c) and summertime (d) and MAX-DOAS observations during wintertime (e) and summertime (f).
Atmosphere 13 00840 g006aAtmosphere 13 00840 g006b
Figure 7. TROPOMI tropospheric NO2 seasonal load over Ioannina in wintertime (a) and summertime (b). Important locations of possible NO2 emitting sources are also shown. Coloured cells represent the cells used in the analysis.
Atmosphere 13 00840 g007
Figure 8. Monthly mean TROPOMI tropospheric NO2 columns (1015 molecules/cm2) over Ioannina for specific locations according to their known emission capabilities. The shaded areas represent the standard deviation of the spatial mean.
Atmosphere 13 00840 g008
Figure 9. (a) Daily mean time series of MAX-DOAS tropospheric NO2 columns (1015 molecules/cm2) during wintertime over Ioannina. (b) The respective diurnal variability.
Atmosphere 13 00840 g009
Figure 10. (a) Monthly mean LOTOS-EUROS tropospheric NO2 columns (1015 molecules/cm2) over Ioannina for specific locations as per Figure 3. Diurnal variability during wintertime (b) and summertime (c).
Atmosphere 13 00840 g010
Figure 11. Day-of-week variability of tropospheric NO2 columns (1015 molecules/cm2) over Ioannina revealed by TROPOMI observations during wintertime (a) and summertime (b), LOTOS-EUROS simulations during wintertime (c) and summertime (d) and MAX-DOAS observations during wintertime (e).
Atmosphere 13 00840 g011
Table 1. The important characteristics of each dataset discussed in this work.
DatasetTemporal ResolutionSpatial ResolutionStrong PointsLimitations
TROPOMI/S5POnce per day3.5 × 5.5 km pixelHigh spatial coverageTemporal coverage
MAX-DOASEvery 15 m in daylightPoint location, ~15 km horizontal viewingHigh temporal coverageSpatial coverage
LOTOS-EUROS CTMEvery 1 hDepending on input parametersHigh spatiotemporal coverageInput information
Table 2. The percentage deviation of day-of-week NO2 columns from the weekly average for Thessaloniki. The std values represent the variability of the different locations sensed, where applicable.
MondayTuesdayWednesdayThursdayFridaySaturdaySunday
WinterTROPOMI11.5 ± 5.5%−2.1 ± 4.0%−5.7 ± 1.0%8.6 ± 1.8%15.7 ± 3.8%−7.8 ± 4.1%−20.2 ± 1.1%
LOTOS-EUROS−2.5 ± 3.9%−7.2 ± 2.4%−3.8 ± 4.1%8.3 ± 1.7%10.5 ± 2.8%9.8 ± 4.0%−15.2 ± 2.1%
MAX-DOAS3.5%−1.6%5.8%11.1%0.2%6.4%−25.3%
SummerTROPOMI5.8 ± 1.7%9.1 ± 1.9%0.4 ± 3.6%4.6 ± 2.0%10.0 ± 4.7%−7.7 ± 1.2%−22.1 ± 2.5%
LOTOS-EUROS4.3 ± 2.0%1.1 ± 0.9%4.8 ± 1.7%5.0 ± 1.6%6.0 ± 4.0%−13.4 ± 3.7%−7.8 ± 0.9%
MAX-DOAS6.2%16.4%3.6%7.2%13%−13.4%−33.1%
Table 3. The percentage deviation of day-of-week NO2 columns from the weekly average for Ioannina. The std values represent the variability of the different locations sensed, where applicable.
MondayTuesdayWednesdayThursdayFridaySaturdaySunday
WinterTROPOMI1.1 ± 1.1%−2.9 ± 1.0%9.4 ± 1.2%−3.3 ± 5.5%8.6 ± 0.7%3.4 ± 5.6%−16.3 ± 0.5%
LOTOS-EUROS−0.1 ± 4.2%3.9 ± 0.8%9.5 ± 6.3%2.8 ± 0.2%7.3 ± 2.8%−6.2 ± 1.1%−17.3 ± 2.8%
MAX-DOAS24.4%23.4%9.8%−10.7%0.1%2%−49%
SummerTROPOMI15.2 ± 2.8%−10.0 ± 1.3%−0.1 ± 4.8%9.8 ± 4.7%11.1 ± 1.2%−4.6 ± 4.6%−21.5 ± 5.2%
LOTOS-EUROS2.0 ± 0.9%−0.6 ± 1.9%3.6 ± 1.6%4.4 ± 0.8%2.4 ± 0.5%−5.0 ± 0.3%−6.8 ± 1.2%
MAX-DOASn/a
Publisher’s Note: MDPI stays neutral with regard to jurisdictional claims in published maps and institutional affiliations.

