Article

Characteristics of Ocean Waves in the Southern Ocean and Seasonal Prediction of Difficulty for the Vessels Crossing the Westerlies

1
Frontier Research Center, Southern Marine Science and Engineering Guangdong Laboratory (Zhuhai), Zhuhai 519000, China
2
National Marine Environment Forecasting Center, Ministry of Natural Resources, Beijing 100081, China
*
Author to whom correspondence should be addressed.
Atmosphere 2022, 13(6), 916; https://doi.org/10.3390/atmos13060916
Submission received: 13 April 2022 / Revised: 30 May 2022 / Accepted: 2 June 2022 / Published: 5 June 2022

Abstract

:
In this study, the European Centre for Medium-Range Weather Forecasts reanalysis v5 (ERA5) wave height reanalysis data and sea-level pressure data from two seasonal prediction systems were used to study the wave characteristics of the Southern Ocean and the seasonal prediction of difficulty for the vessels crossing the westerlies. The results show that significant wave height, extreme wave height, and extreme wave processes were all much stronger in austral winter than in austral summer, making it more difficult for vessels to cross the westerlies in winter. Furthermore, the difficulty of crossing the westerlies has increased over the last 40 years, except in areas east of South America. We found that the monthly frequency of crossing the westerlies between 100° E and 75° W could be accurately estimated point by point using the monthly mean sea-level pressure difference between 30° S and 65° S. With a 1-month lead, the multi-model forecasts gave a fairly accurate forecast of such sea-level pressure difference signal between 150° E to 60° W for target months from May to December. Based on these assessments, we could estimate the difficulty of crossing the westerlies in some specific months in advance using a seasonal prediction system. We also found that the seasonal prediction system produced inaccurate predictions of sea-level pressure at high latitudes, which is the main barrier to further accurately estimating the difficulty of crossing the westerlies. These findings may provide support for predicting difficulty for the vessels crossing the westerlies with a 1-month lead and can provide planning for the route and the allocation of material reserves.

1. Introduction

Antarctica, our southernmost continent, contains only one-tenth of the planet’s land surface but has nearly 90% of Earth’s ice and about 70% of its freshwater [1]. Climate change has driven the Antarctic to the forefront of research because of the unique role it plays in the Earth’s systems [2,3,4]. The Antarctic bottom water is crucial for global meridional overturning circulation, which has a significant regulatory effect on climate systems and biogeochemical cycles [5,6]. The Antarctic also provides rich resources to ecosystems and the humankind, from food and fresh water to mineral resources. For all of these reasons, many countries have accelerated the pace of the Antarctic scientific research over the past decades to not fall behind in understanding and exploiting the Antarctic.
From the point of view of ocean waves, the Southern Ocean is most appropriately defined as an enormous body of water north of the Antarctic ice edge and south of other main landmasses such as Africa, Australia, and South America. It is unbroken by any land barriers, which allows the westerly winds to build up the windiest and roughest wave field in all of the world’s oceans. The prevailing strong westerly winds in the Southern Ocean generate a relatively unique distribution of significant wave height (SWH) centered at about 50° S, with the mean wave energy propagating from west to east [7]. It has been shown that a statistically significant increase in the mean significant wave height and the 90th percentile wave height occurs in the Southern Ocean [8,9]. Extreme waves always co-occur with cyclones in the Southern Ocean. Analysis shows that the frequency of cyclones increased from 1979 to 2013 [10]. The wave spectrum can be decomposed into wind sea waves, which are directly affected by local winds, and swells, the waves generated by the wind at a different location and time. The swells are high-energy and can be surprisingly destructive, which can lead to phenomena such as hogging and sagging that can cause serious damage to vessels [11]. Moreover, the change of significant wave height comes more from the change of swells in the ocean [12]. Polar scientific research vessels (PSRVs) are indispensable in constructing and operating Antarctic investigation stations, delivering material supplies, and conducting on-site scientific investigations of the Southern Ocean. The westerlies are the only barrier for PSRVs to reach the Antarctic, and the extreme waves in the westerlies threaten navigation and scientific research safety for PSRVs. Therefore, a full understanding of ocean wave variability in the westerlies is of great significance to improve the support capacity and safety of PSRVs.
The Southern Annular Mode (SAM) is a low-frequency mode of climate variability in the middle to high latitudes of the southern hemisphere. This mode is closely related to cyclone activities and the north–south shift of westerly winds in the Southern Ocean [13,14]. Previous studies showed that the time interval between two successive cyclones is negatively correlated with the summer’s SAM index. In other words, when the SAM is in a positive phase, cyclones occur more frequently and the probability for a PSRV to cross the westerlies is smaller [15]. It is worth noting that this relationship was obtained using the relatively sparse observations of China’s Antarctic scientific surveys which all took place during austral summer (December to February of the following year, similarly hereinafter). However, the relationship between the opportunity for PSRVs to cross the westerlies starting from the middle latitudes and the large-scale atmospheric system in other seasons is still unknown. The ERA5 data, with its high temporospatial resolution and sufficient accuracy [16], enabled us to study the characteristics of waves in the Southern Ocean and their influence on the route of research vessels. The impact of waves on the navigation of PSRVs can be quantitatively expressed as the number of “windows” per month when a vessel can cross the westerlies. If the number of time windows per month has a good linear relationship with monthly atmospheric circulation, the difficulties for the vessels crossing the westerlies can be estimated in advance using seasonal prediction systems. Previous studies mostly focused on the study of physical characteristics of waves and paid little attention to their impact on the vessel’s route, especially with a lead time longer than 1 month. This study intended to analyze not only the characteristics of waves in the Southern Ocean, but also the relationship between the number of time windows for crossing the westerlies and the large-scale atmospheric circulation by month, and evaluated the feasibility of using seasonal prediction systems to infer the difficulty of crossing the westerlies. This work is of great practical significance because it could provide a scientific basis for the formulation of Antarctic scientific research plans and the prediction of the best routes for Antarctic scientific research vessels.
This paper is structured as follows. The ERA5 reanalysis, the hindcast data of two seasonal prediction systems, and the method of the study are shown in Section 2. Section 3.1 presents the results of seasonal variations of significant and extreme wave height (EWH). Analysis of the historic characteristics of the PSRVs crossing the westerlies at different longitudes is shown in Section 3.2, and the relationships between the number of time windows for the PSRVs crossing the westerlies and atmospheric circulation are also discussed. In Section 3.3, we evaluated the ability of two seasonal prediction systems to predict atmospheric circulation, which is strongly related to PSRV navigation. Concluding remarks and suggestions for further research are presented in Section 4.

2. Data and Methods of Analysis

2.1. ERA5 Reanalysis Data

ERA5 is the latest ECMWF reanalysis of global climate and weather, providing hourly data for atmospheric, ocean wave, and land surface variables [16]. We used sea-level pressure, SWH, and sea ice concentration datasets in this study. The sea-level pressure is available hourly on regular latitude–longitude grids at 0.25° × 0.25°, while the hourly SWH has a resolution of 0.5° × 0.5°. Both of these two variables were extracted from 1979 to 2018. The sea ice concentration data were used to calculate the climatology from 1979 to 2018. The 15% ice concentration represents the outer edge of the Antarctic sea ice in this study. The SAM index (SAMI) was defined as the difference between the normalized zonal mean sea-level pressure values at 40° S and 65° S [13].
This study relies fundamentally on the assumption that the ERA5 datasets could represent the ground truth of the wave conditions, which were evaluated comprehensively in previous works [17,18,19].

2.2. Hindcast Data

The hindcast of sea-level pressure for two seasonal prediction systems are used in this study, the Canadian Centre for Climate Modelling and Analysis (CCCma) Coupled Climate model version 4 with improved initialization (CanCM4i [20]) and the Global Environmental Multiscale model and Nucleus for European Modelling of the Ocean coupled model (GEM–NEMO [21]). These two models were selected based on two reasons. One, they were participating in the North American Multi-Model Ensemble (NMME [22], a multi-model forecasting system consisting of a series of coupled climate models from US modeling centers, including the National Centers for Environmental Prediction (NCEP), the Geophysical Fluid Dynamics Laboratory (GFDL), the National Aeronautics and Space Administration (NASA), the National Center for Atmospheric Research (NCAR), and the Canadian Meteorological Centre (CMC) real-time forecasting in 2022, which represents the sufficient recognitions of these two models. Second, only these two models provide the sea-level pressure hindcast data. Following convention, a 1-month lead prediction was treated as a prediction initialized in the previous month. All the hindcast data from 1982 to 2018 were interpolated onto a regular 1° × 1° grid before evaluation. The mean of the sea-level pressure hindcast data from these two seasonal prediction systems was treated as multi-model forecast results.

2.3. Routes for PSRV

To cross the westerlies, PSRVs should avoid huge waves caused by cyclones and make full use of time windows with good weather and sea conditions under the control of high pressure or high-pressure ridge systems. By 2022, China had conducted 38 scientific explorations in Antarctica [23] and accumulated a lot of experience in crossing the westerlies. Generally speaking, crossing the westerlies directly from north to south is most efficient for three main reasons. First, from middle latitudes to the polar region, the higher the latitude the shorter the distance between two meridians. Therefore, the total voyage is shorter than when crossing the westerlies in an oblique direction. Second, crossing the westerlies directly from north to south can effectively avoid the influence of strong winds and waves brought by cyclones. In contrast, taking a southwest route may increase the probability of encountering cyclones, bringing uncertainty and danger to navigation. Third, crossing the westerlies directly from north to south can ensure that vessels can enter the floating ice area at top speed, allowing vessels to avoid the influence of extreme waves and make effective use of each weather window.
Currently, the economic speed of mainstream icebreakers such as Xuelong 2, Nuyina, and Sir David Attenborough owned and maintained by China, Australia, and Britain, respectively, is 12–13 knots (1 knot = 1.852 km/h) [24]. However, many factors can affect the route of a PSRV. Therefore, we made several assumptions and simplifications for our calculations. (1) We assumed that vessels cross only along the meridians directly to the Antarctic. (2) We assumed that vessels travel at an almost constant speed of about 12 knots. The basis for this assumption is that if the weather and sea conditions are favorable, the 12-knot speed is a fuel-efficient speed that can reduce fuel consumption; if the weather and sea conditions are rough, surging waves may restrict the maneuverability of vessels; in this case, accelerating the speed will increase the navigation risk. (3) We take the average value of the wave within two degrees in the east–west direction in front of the route as the wave strength to be borne by the vessel to judge whether the route is safe and effective. (4) We assumed that a complete 8-day or 4-day time window is counted only once when calculating the number of time windows for passing through the westerlies. (5) We used an hourly SWH larger than 5 m as a threshold for navigation safety. If a vessel encountered waves with an SWH of more than 5 m on a route, the window was deemed invalid, and the SWH would be changed to judge whether the time window from the subsequent hour was valid. For a time window that fell between the end of one month and the beginning of the next month, the number of favorable days in each month within this time window was calculated, and the time window was counted in the month in which the majority of days fell.
In addition to these assumptions and simplifications, we also had to consider different starting points in the middle latitudes. Hobart in Australia, Christchurch in New Zealand, and Ushuaia in Argentina are popular ports for voyages to Antarctica because of their geographic locations and the surrounding environmental conditions. We assumed that when vessels sail between 135 °E and 160° E, they should take Hobart (147° E, 43° S) as the transfer station and directly cross the westerlies from north to south. Christchurch (172.5° E, 43° S) and Ushuaia (68° W, 55° S) are also transfer stations for vessels between 160° E and 180° E and from 75° W to 55° W, respectively (Figure 1). For vessels sailing in other areas, as they are far away from the three transfer stations, we assumed that they should choose to cross the westerlies directly from 35° S from north to south. The terminal point for departures from Ushuaia was the Antarctic Peninsula (64° S), while the terminal point for vessels starting from other areas was 60° S. We chose 60° S as the terminal point because this latitude overlaps roughly with the 15% sea ice extent. When a vessel reaches this latitude, the wave dissipation effect of the floating ice significantly reduces the risk of extreme waves. Therefore, a vessel reaching this latitude can be considered to have finished crossing the westerlies.

3. Results

3.1. Characteristics of Waves in the Southern Ocean

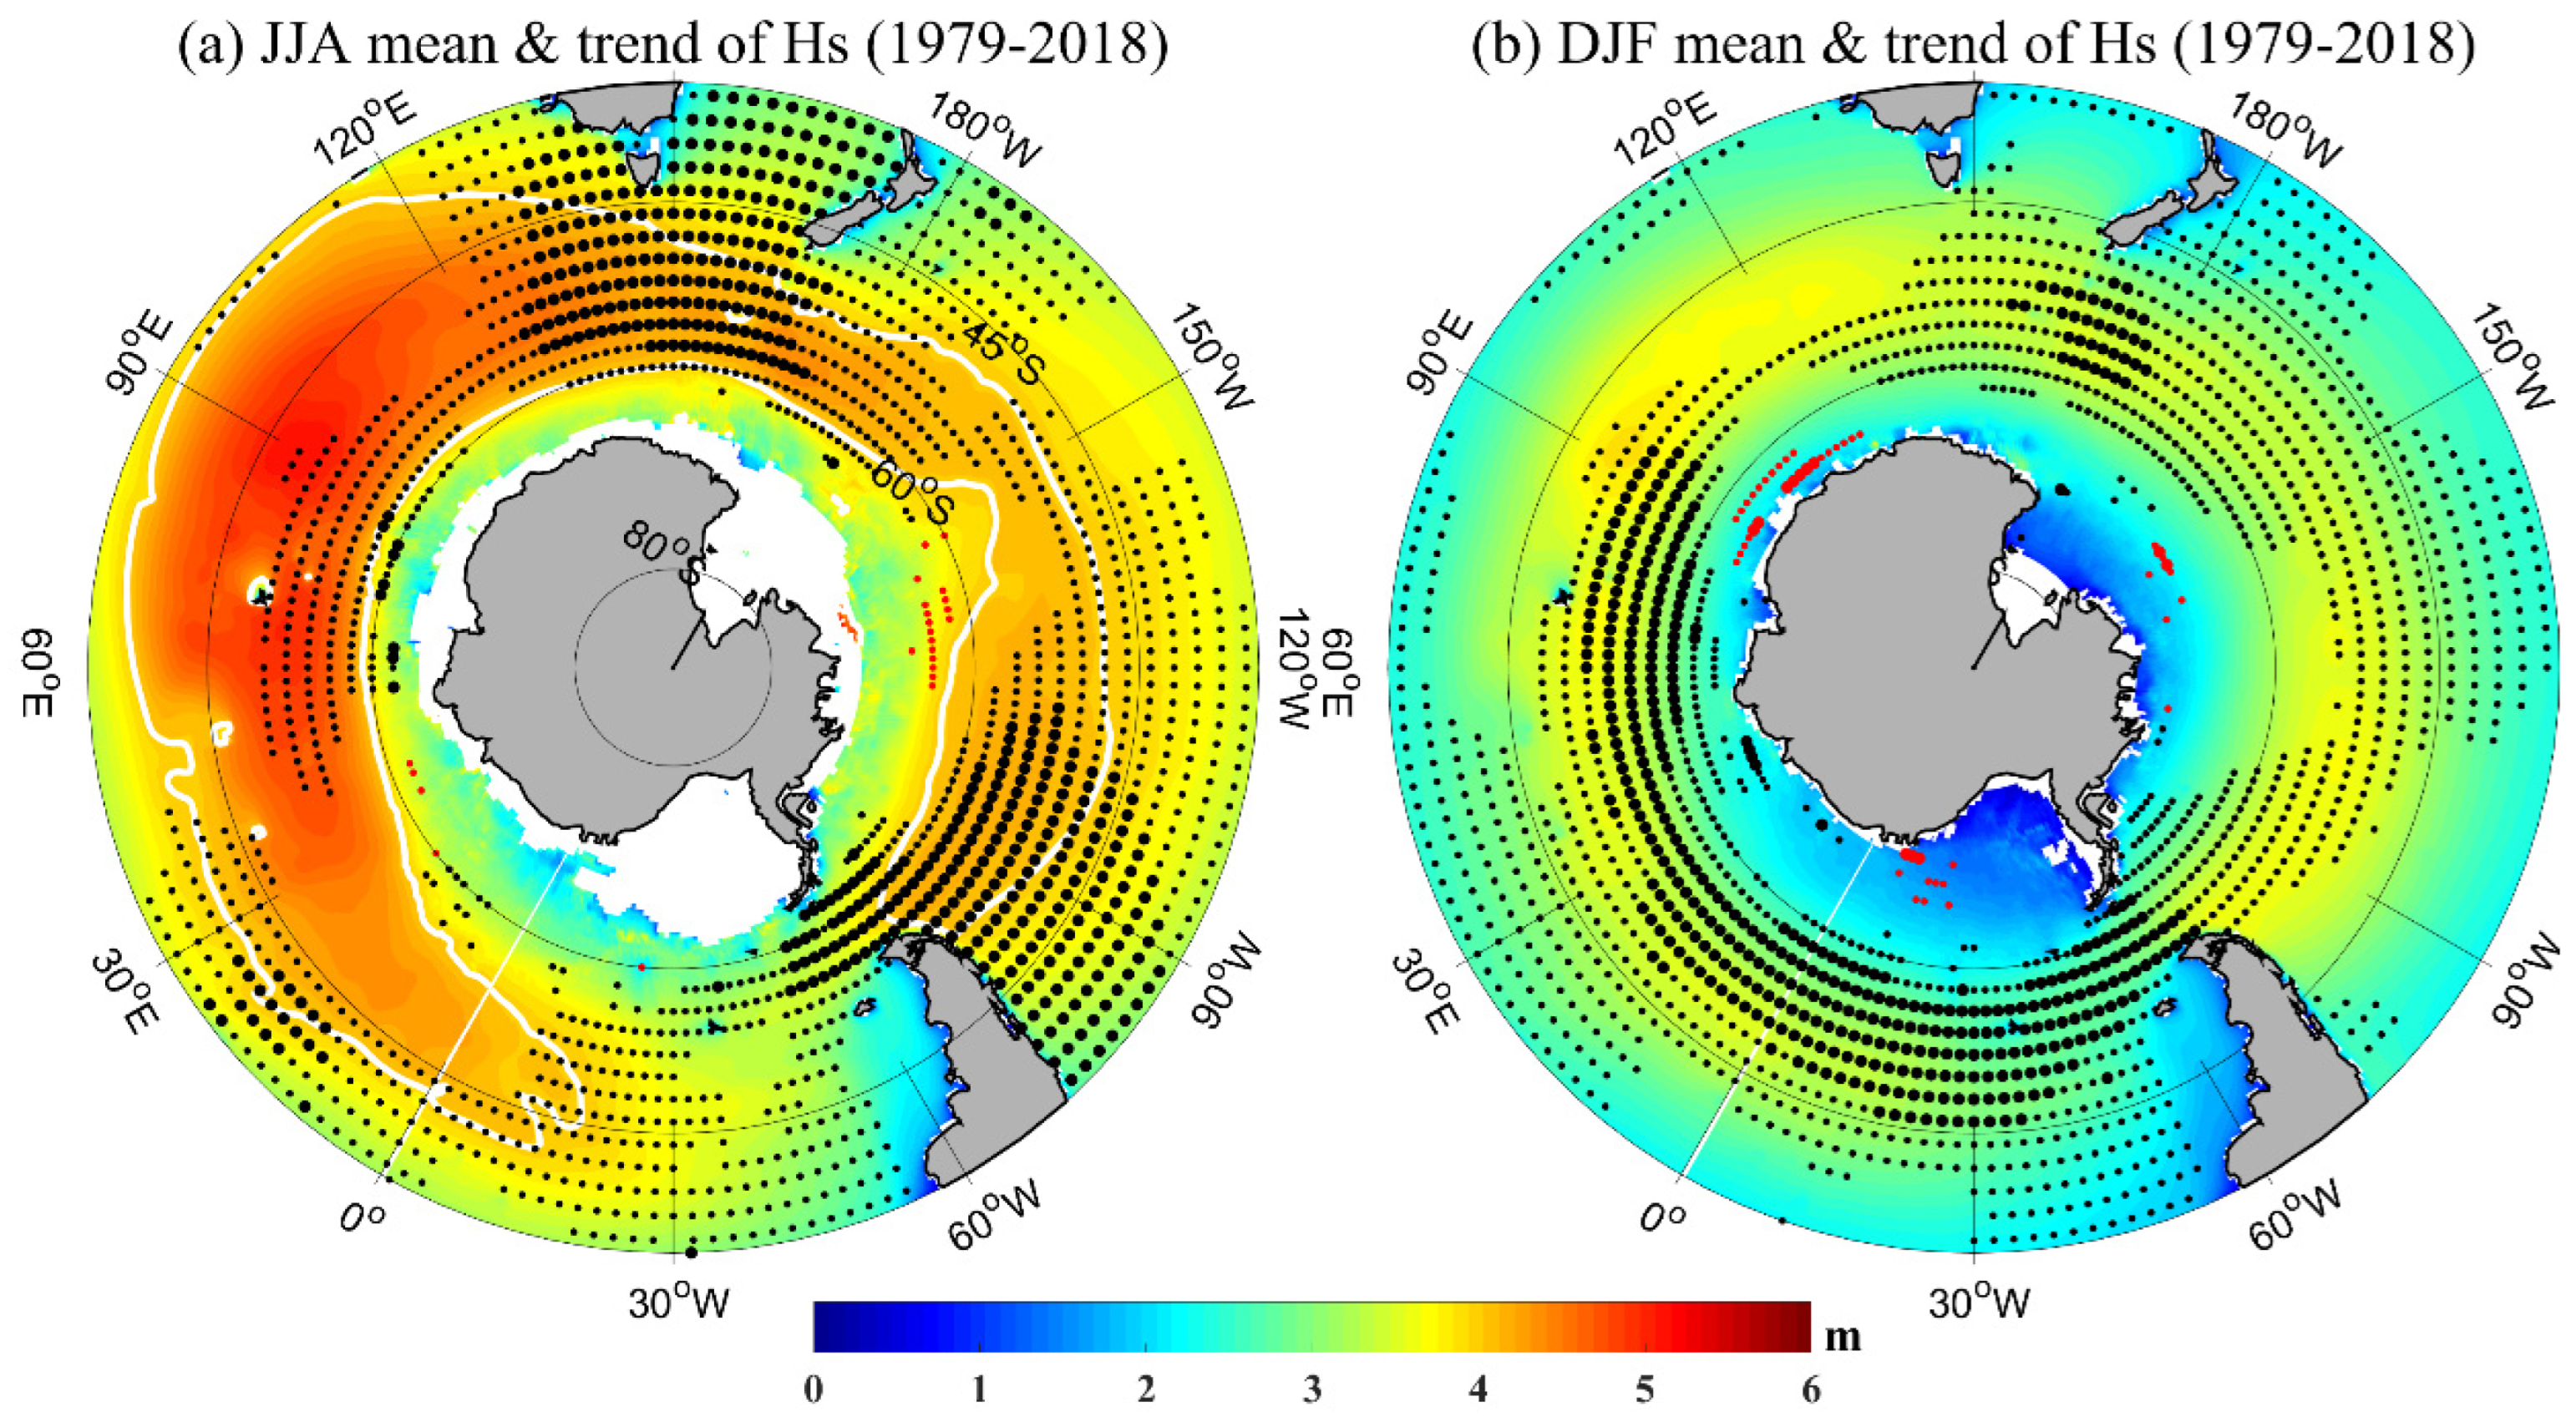
Figure 2 shows the spatial distribution of the climatology and the trend of the SWH during winter and summer in the Southern Ocean from 1979 to 2018. The SWH was significantly higher in winter than in summer. The highest SWH in winter, about 6 m, was centered in the Indian Ocean sector of the Southern Ocean. The SWH was much lower in the Atlantic sector. The SWH was lower in the seas adjacent to the east side of the South American continent than on the west side of the South American continent, owing to a phenomenon called “wave shadow” [7]. This phenomenon is presumably due to blockage by the terrain of South America, which counteracts much of the swell propagating from the west. The spatial distribution of the mean SWH in summer was consistent with that in winter, but the magnitude of the SWH was much smaller, generally lower than 4 m. The spatial distribution of the SWH largely mirrored the distribution of wind speeds, which can be considered to be the direct result of cyclones on the ocean surface (not shown, [25,26]).
Over the past four decades, the SWH in the westerlies has generally increased in both winter and summer. In winter, the SWH increased most significantly south of Australia and New Zealand, as well as in the southwestern part of South America. The maximum in these areas exceeded 0.32 m. In summer, the SWH in the Atlantic sector and the West Indian Ocean sector of the Southern Ocean showed an obvious increasing trend. The closer to the Antarctic continent, the greater the increasing trend of the SWH. A declining trend in the SWH was not seen in winter or summer over almost the entire Southern Ocean. Although there was a declining trend in waves (represented by red dots) in some areas south of 60° S, the ice–wave interaction mechanism is complex, and the distribution of red dots is particularly sparse, lacking sufficient reliability.
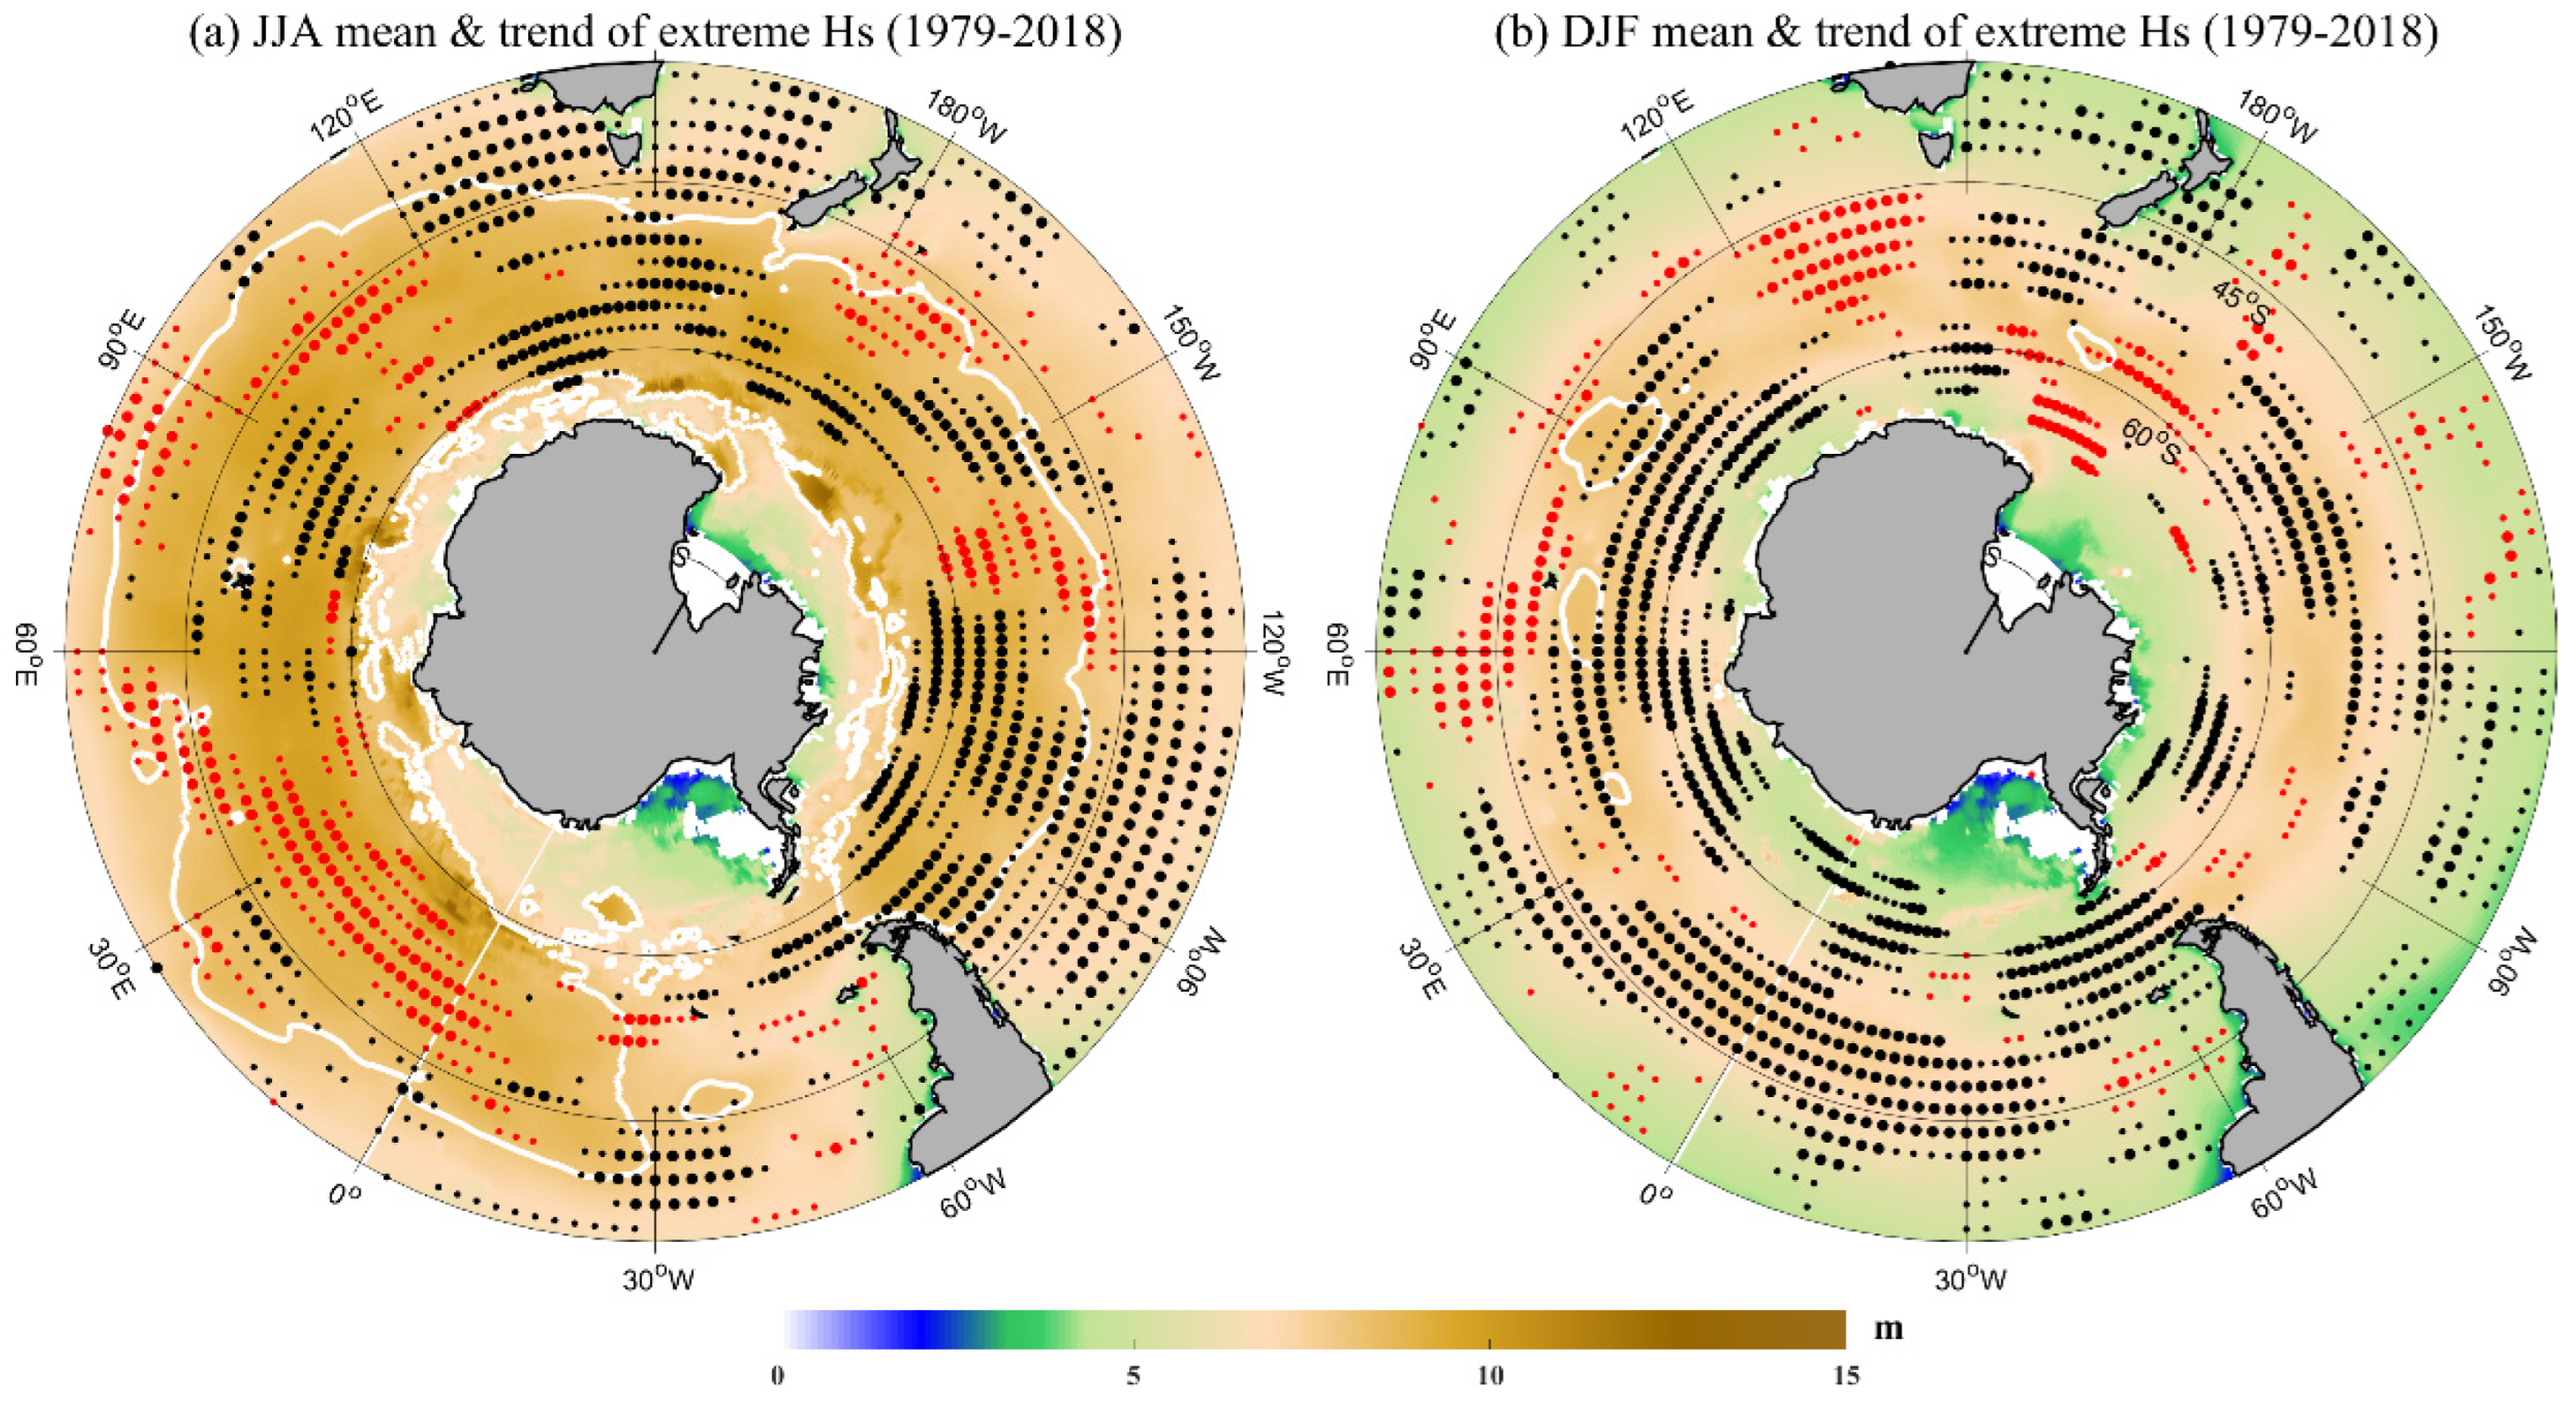
Extreme waves represent a strong and serious wave process, and their intensity and changes have a very significant impact on route adjustment, design of offshore structures, coastal erosion, etc. Figure 3 depicts the spatial distribution and trend of the EWH in winter and summer. The EWH in winter (summer) is defined as the maximum hourly SWH from June to August (December to the following February). The figure shows that the spatial distribution of the winter EWH was consistent with that of the SWH. The EWH of the entire westerlies exceeded 8 m, except in the areas east of South America. In contrast, the extreme waves were much weaker in summer, where only the Indian Ocean sector of the Southern Ocean had the EWH exceeding 8 m. The spatial distribution of the EWH trend was more complicated than that of the SWH, showing an overall increasing trend, but also a significant decreasing trend regionally. Specifically, the EWH increased significantly around the Antarctic continent but decreased away from the Antarctic continent, especially during the austral summer season. This may be related to the poleward strengthening of the westerlies [27,28], which makes cyclones shift towards the Antarctic and makes the increase in the extreme wave height near the Antarctic more obvious. On the whole, the SWH and the EWH in the seas adjacent to Australia, New Zealand, as well as the southwestern part of South America, showed an obvious increasing trend. The southern part of the South African and middle-latitude regions of the South Indian Ocean were the areas where the extreme waves decreased most significantly. The SWH and the EWH showed a similar increasing pattern in summer, but in winter, the EWH in the middle-latitude region of the Indian Ocean sector and the region south of New Zealand decreased substantially.
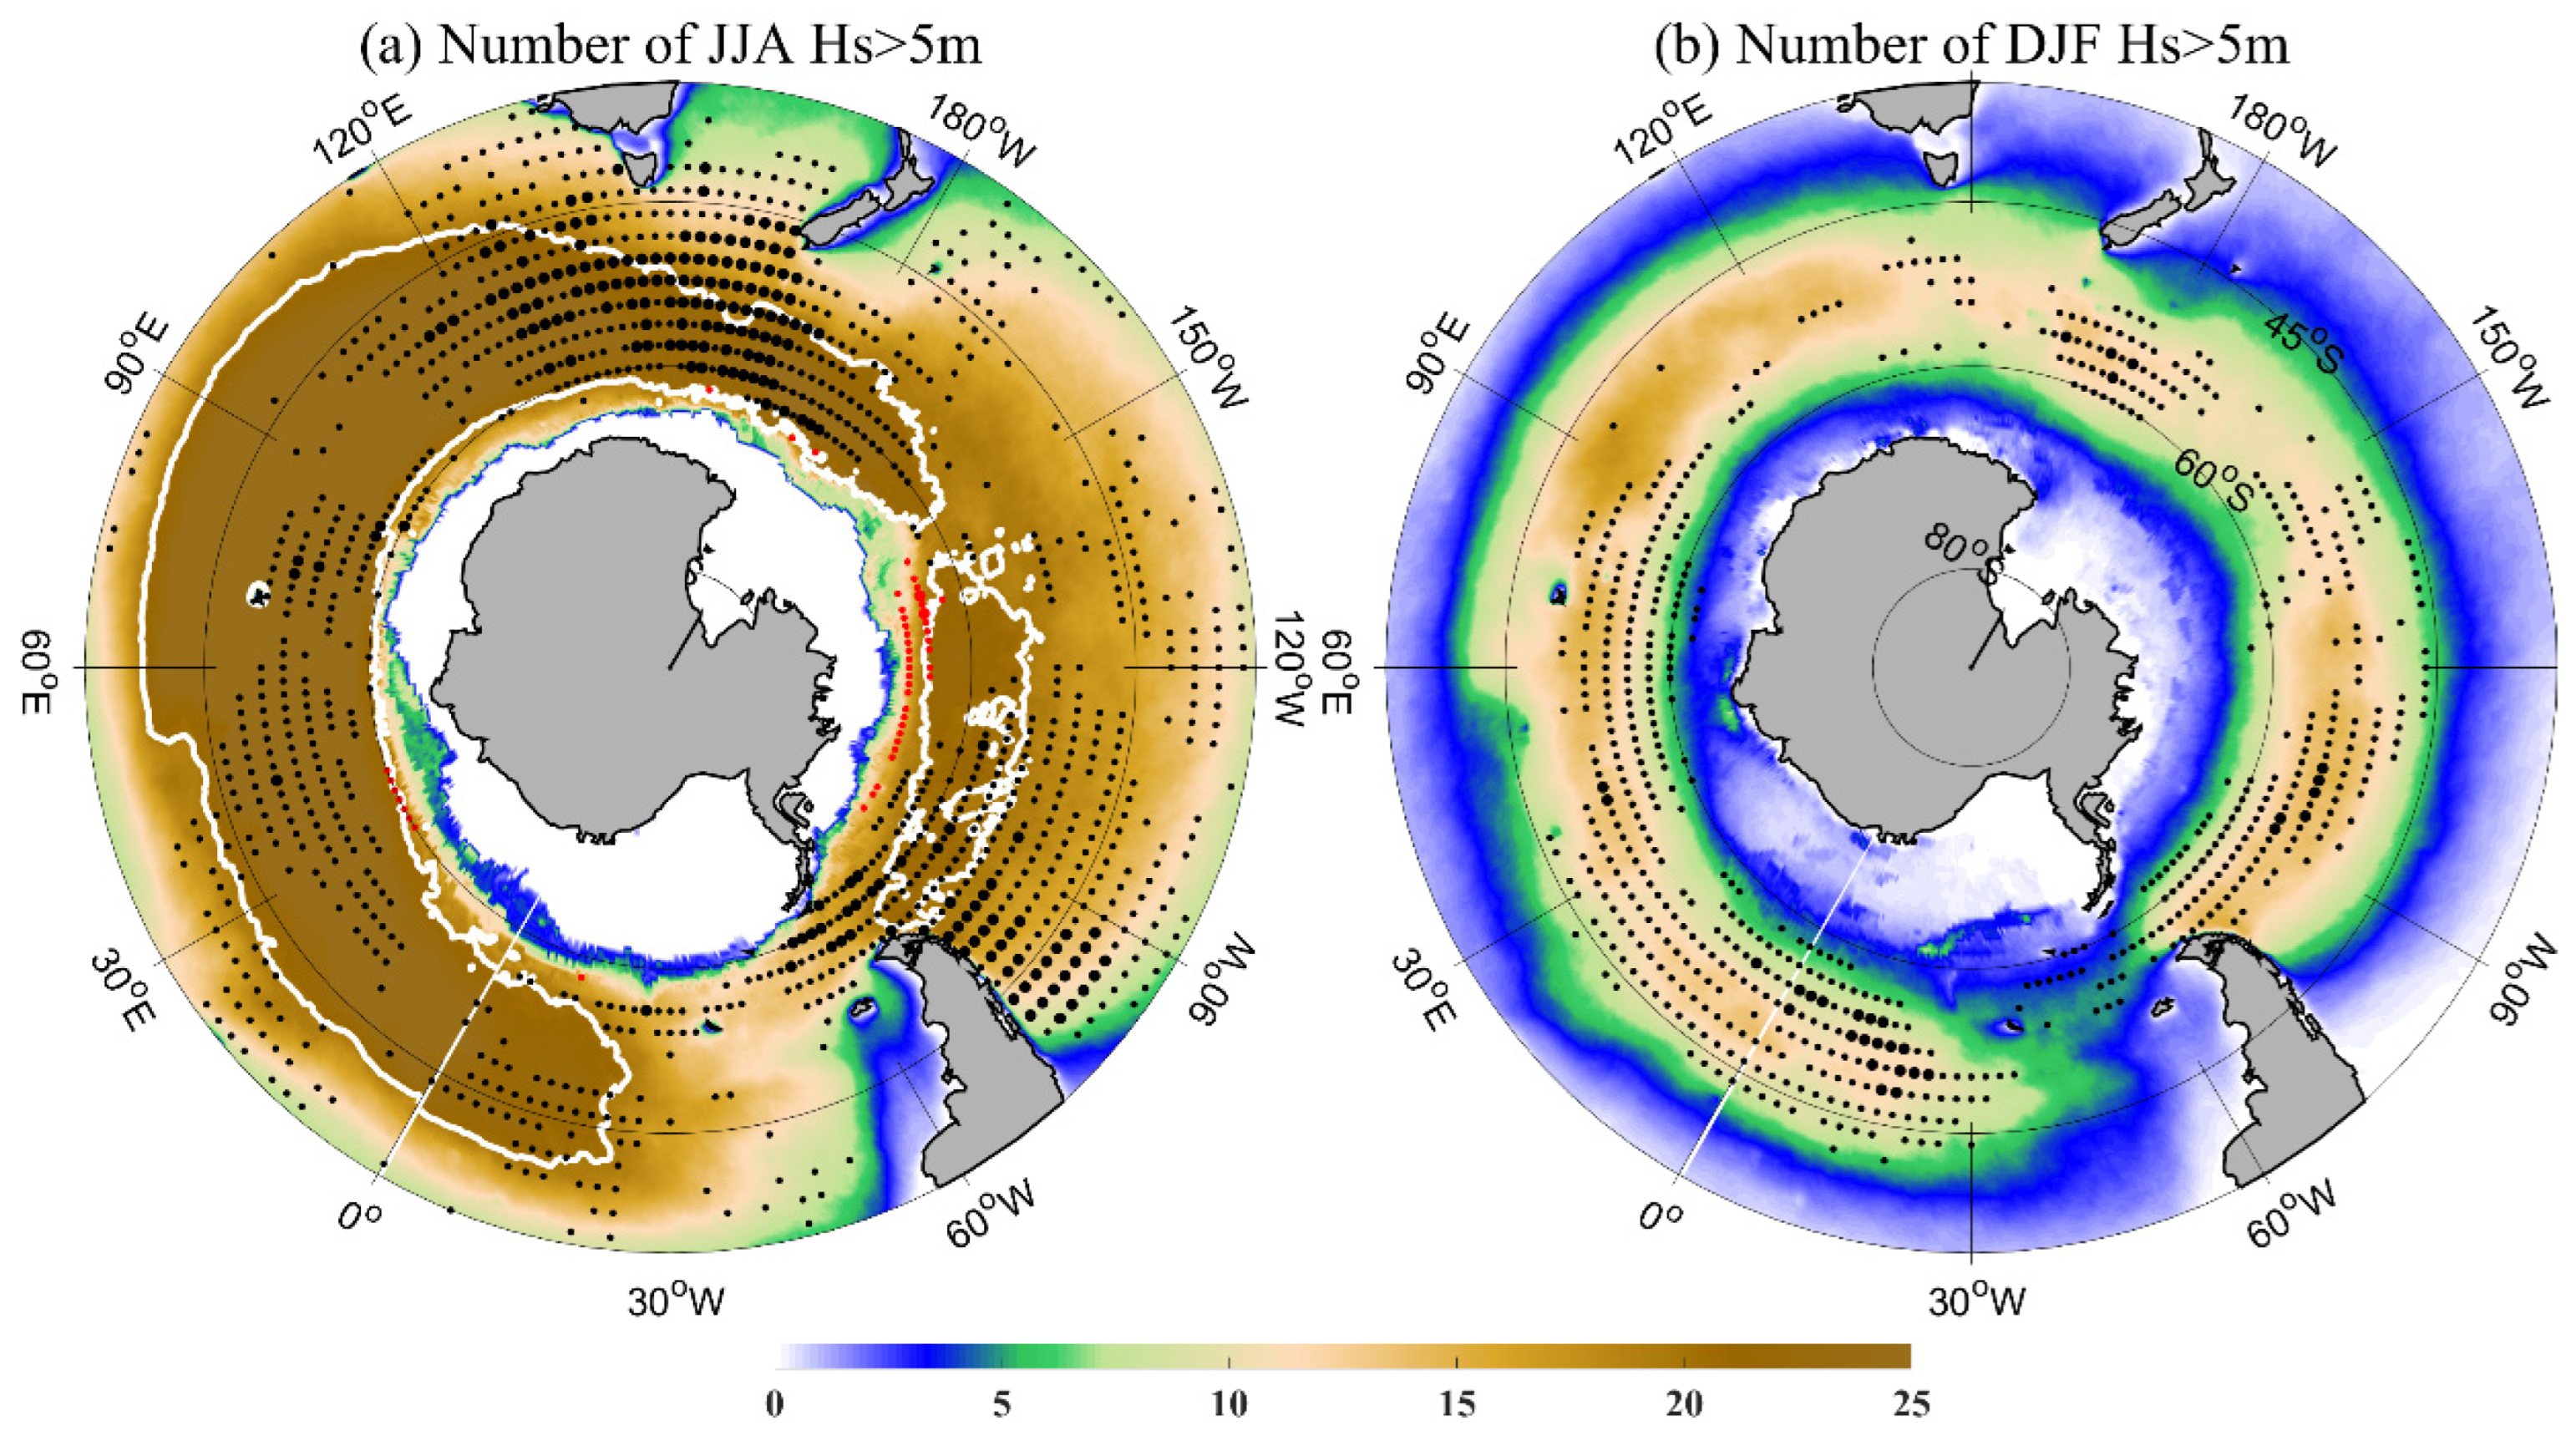
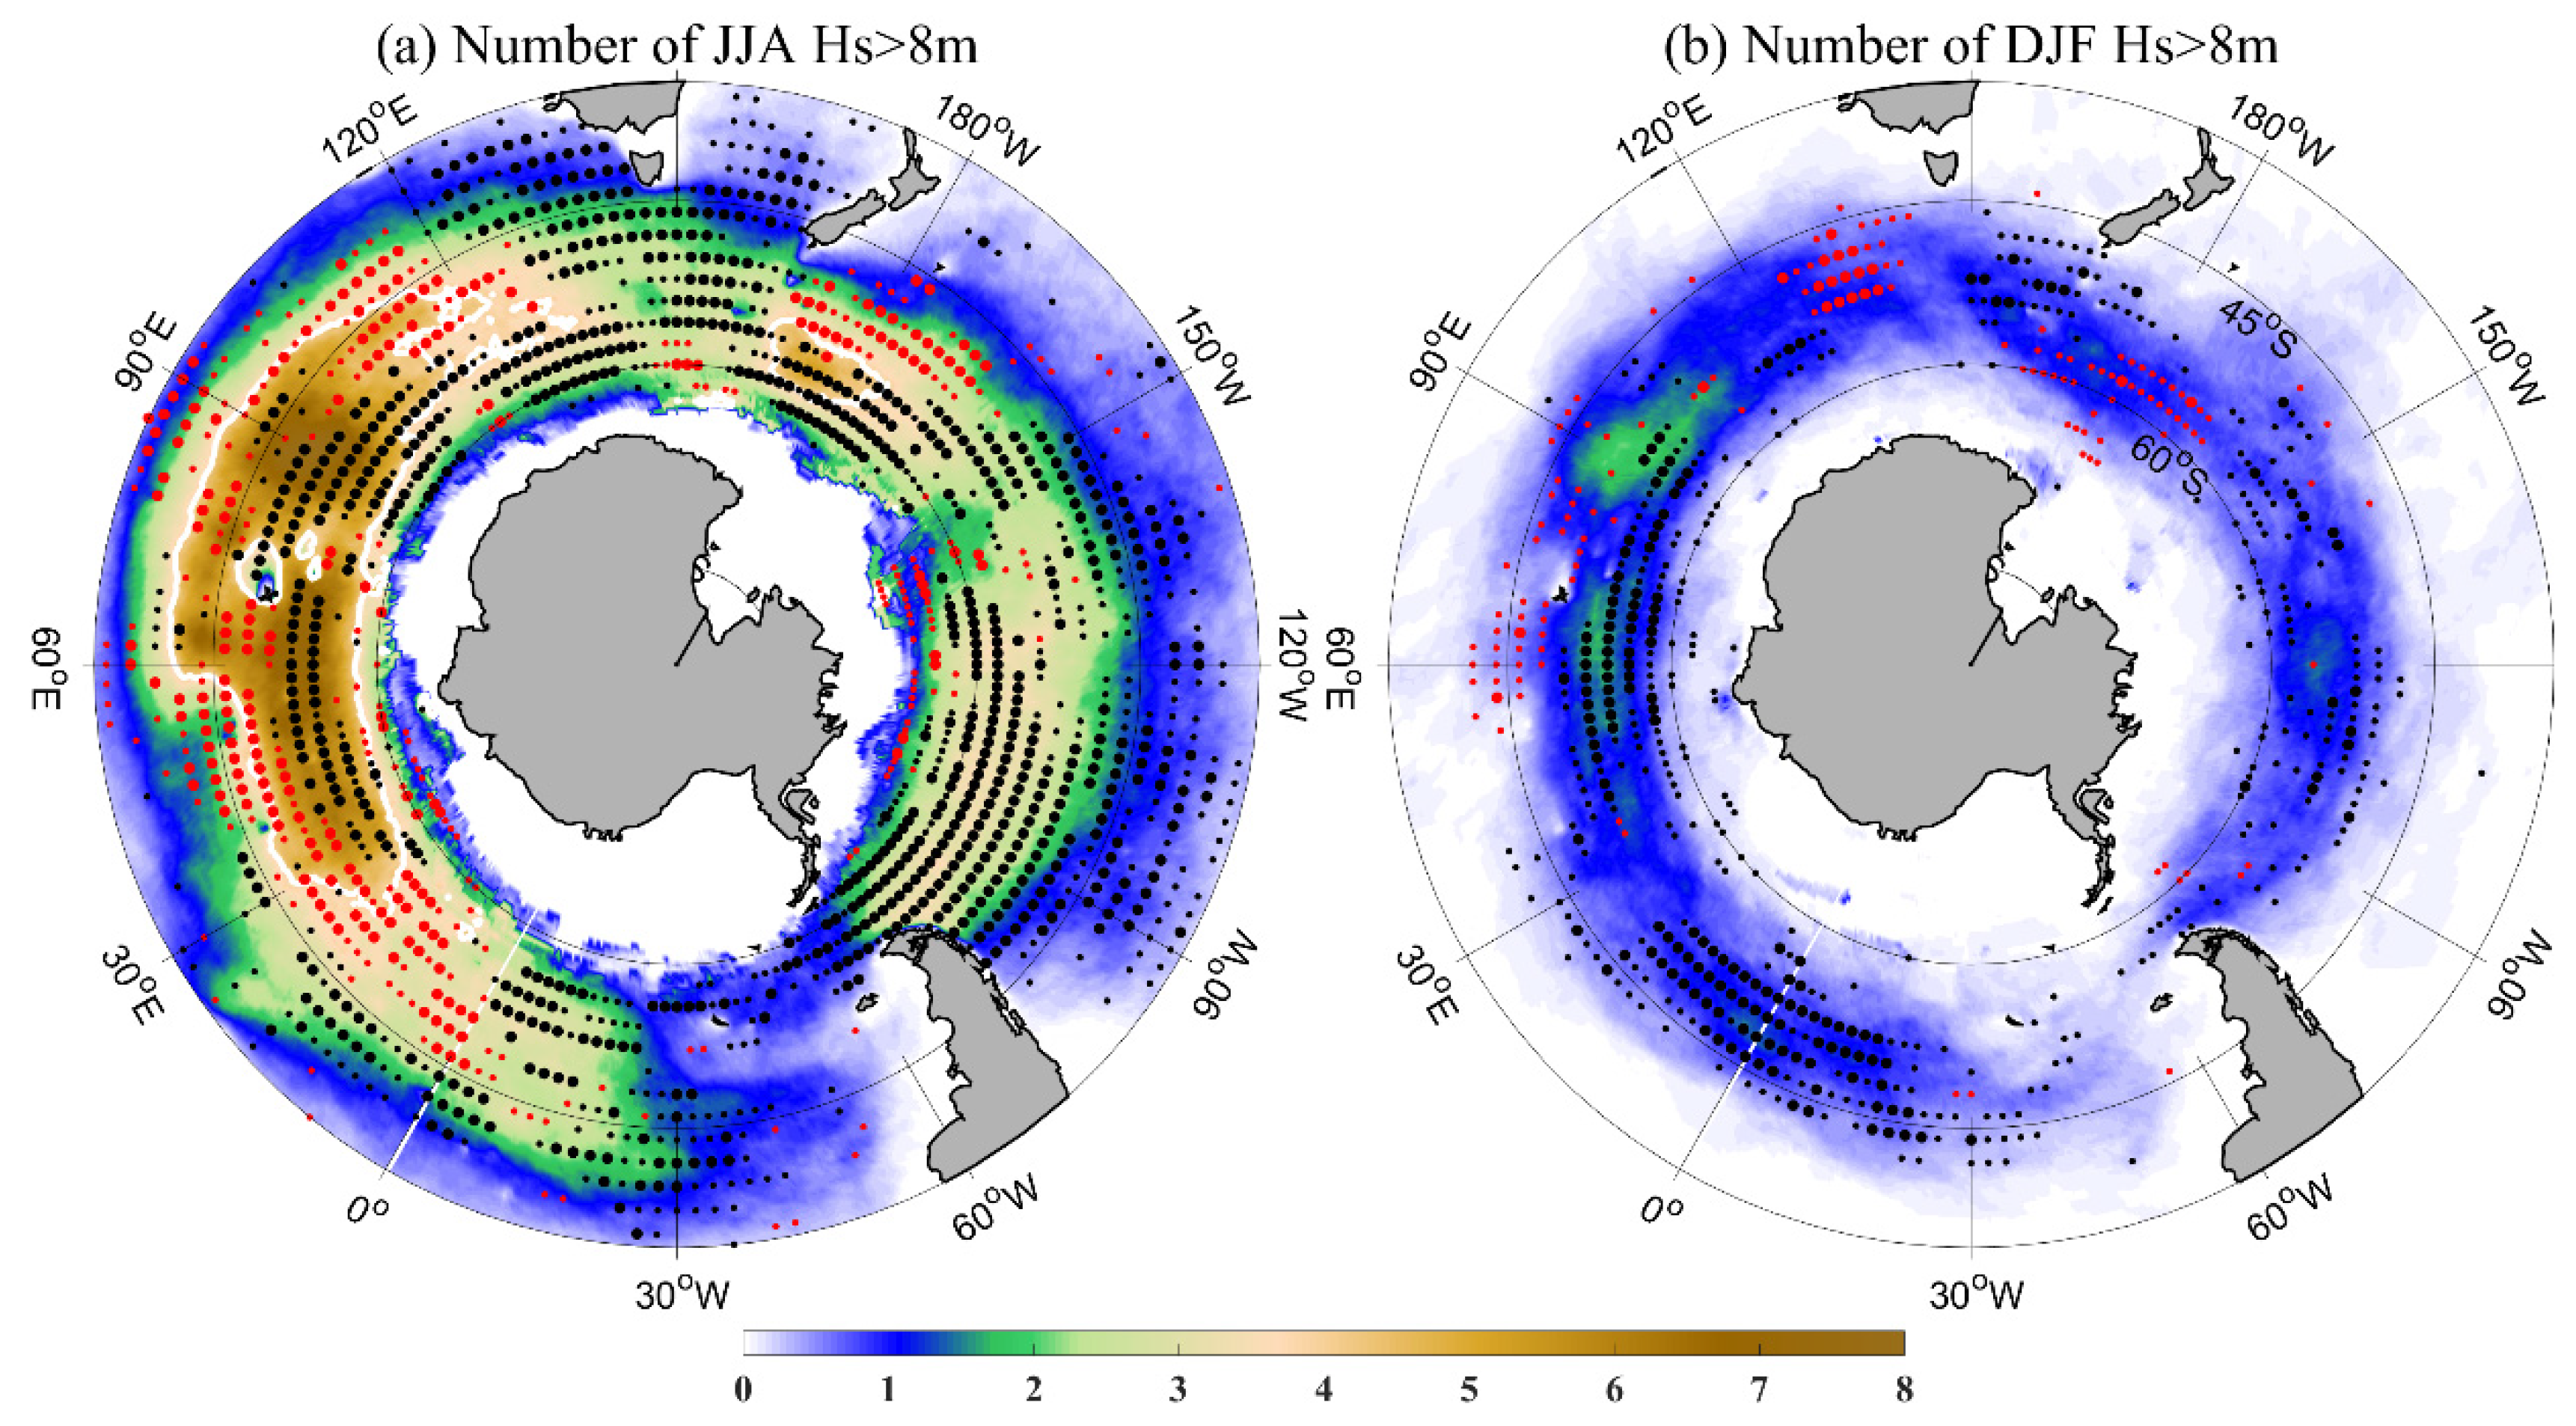
The climatology features of ocean waves are an averaged characteristic, but extreme ocean waves are more destructive and riskier. Based on the experiences of the historical crossing of the westerlies by Chinese Antarctic scientific research vessels, it is considered that if the wave height is high, close to 5 m, it should be treated with caution, especially when the wind blows from the stern; thus, 5 m is an important threshold of the extreme wave height for crossing the westerlies to ensure navigation safety. In contrast, waves exceeding 8 m are usually an absolute forbidden threshold for navigation safety of PSRVs because they may cause fatal damage to vessels and life safety. In particular, attention should be paid to avoid entering the main wave area where the waves are even higher than 10 m. Statistics of wave processes exceeding some representative thresholds are of great significance for understanding the difficulty of crossing the westerlies. Thus, we calculated the number of wave processes in which the SWH exceeded 5 m and 8 m, respectively (Figure 4 and Figure 5). We found that the spatial distribution of the number of processes with the SWH exceeding 5 m is consistent with that of climatology features of the SWH regardless of the season, winter or summer. In winter, except for the eastern part of South America and the region around 150° W, the occurrence frequency of extreme wave processes above 5 m in other areas generally exceeded 15. Extreme wave processes above 5 m occurred less frequently in summer, which is reflected in that there was no region where there were more than 15 extreme wave processes above 5 m in the entire westerlies. In terms of the trend, the number of wave processes with the SWH exceeding 5 m showed a consistently increasing trend over the entire westerlies and was identical to the spatial distribution of the SWH trend shown in Figure 2. In contrast, the spatial distribution and trend of the number of wave processes larger than 8 m (Figure 5) were consistent with those of the EWH shown in Figure 3. Therefore, due to the fact that wave processes with wave height above 5 m occur frequently, the statistical results of the number of wave processes above 5 m are more inclined to concur with the results of climate state. In contrast, the statistical results of the number of wave processes above 8 m are more inclined to concur with the results of extreme waves.
In conclusion, the SWH, EWH, and extreme wave processes larger than 5 m and 8 m were significantly stronger in winter than in summer. The climatology of the SWH and the statistical results of wave processes higher than 5 m all show that the intensity and frequency of waves increased in both winter and summer. The statistics of the extreme climate state of the SWH and the wave processes larger than 8 m show that the extreme wave intensity and frequency near the Antarctic continent in winter were stronger than those far away from the Antarctic continent, which may be due to the poleward intensification of the westerlies. The spatial distribution of the number of wave processes with wave height exceeding 8 m in winter and summer was consistent with the EWH distribution.

3.2. Statistical Characteristics of Time Windows Crossing the Westerlies

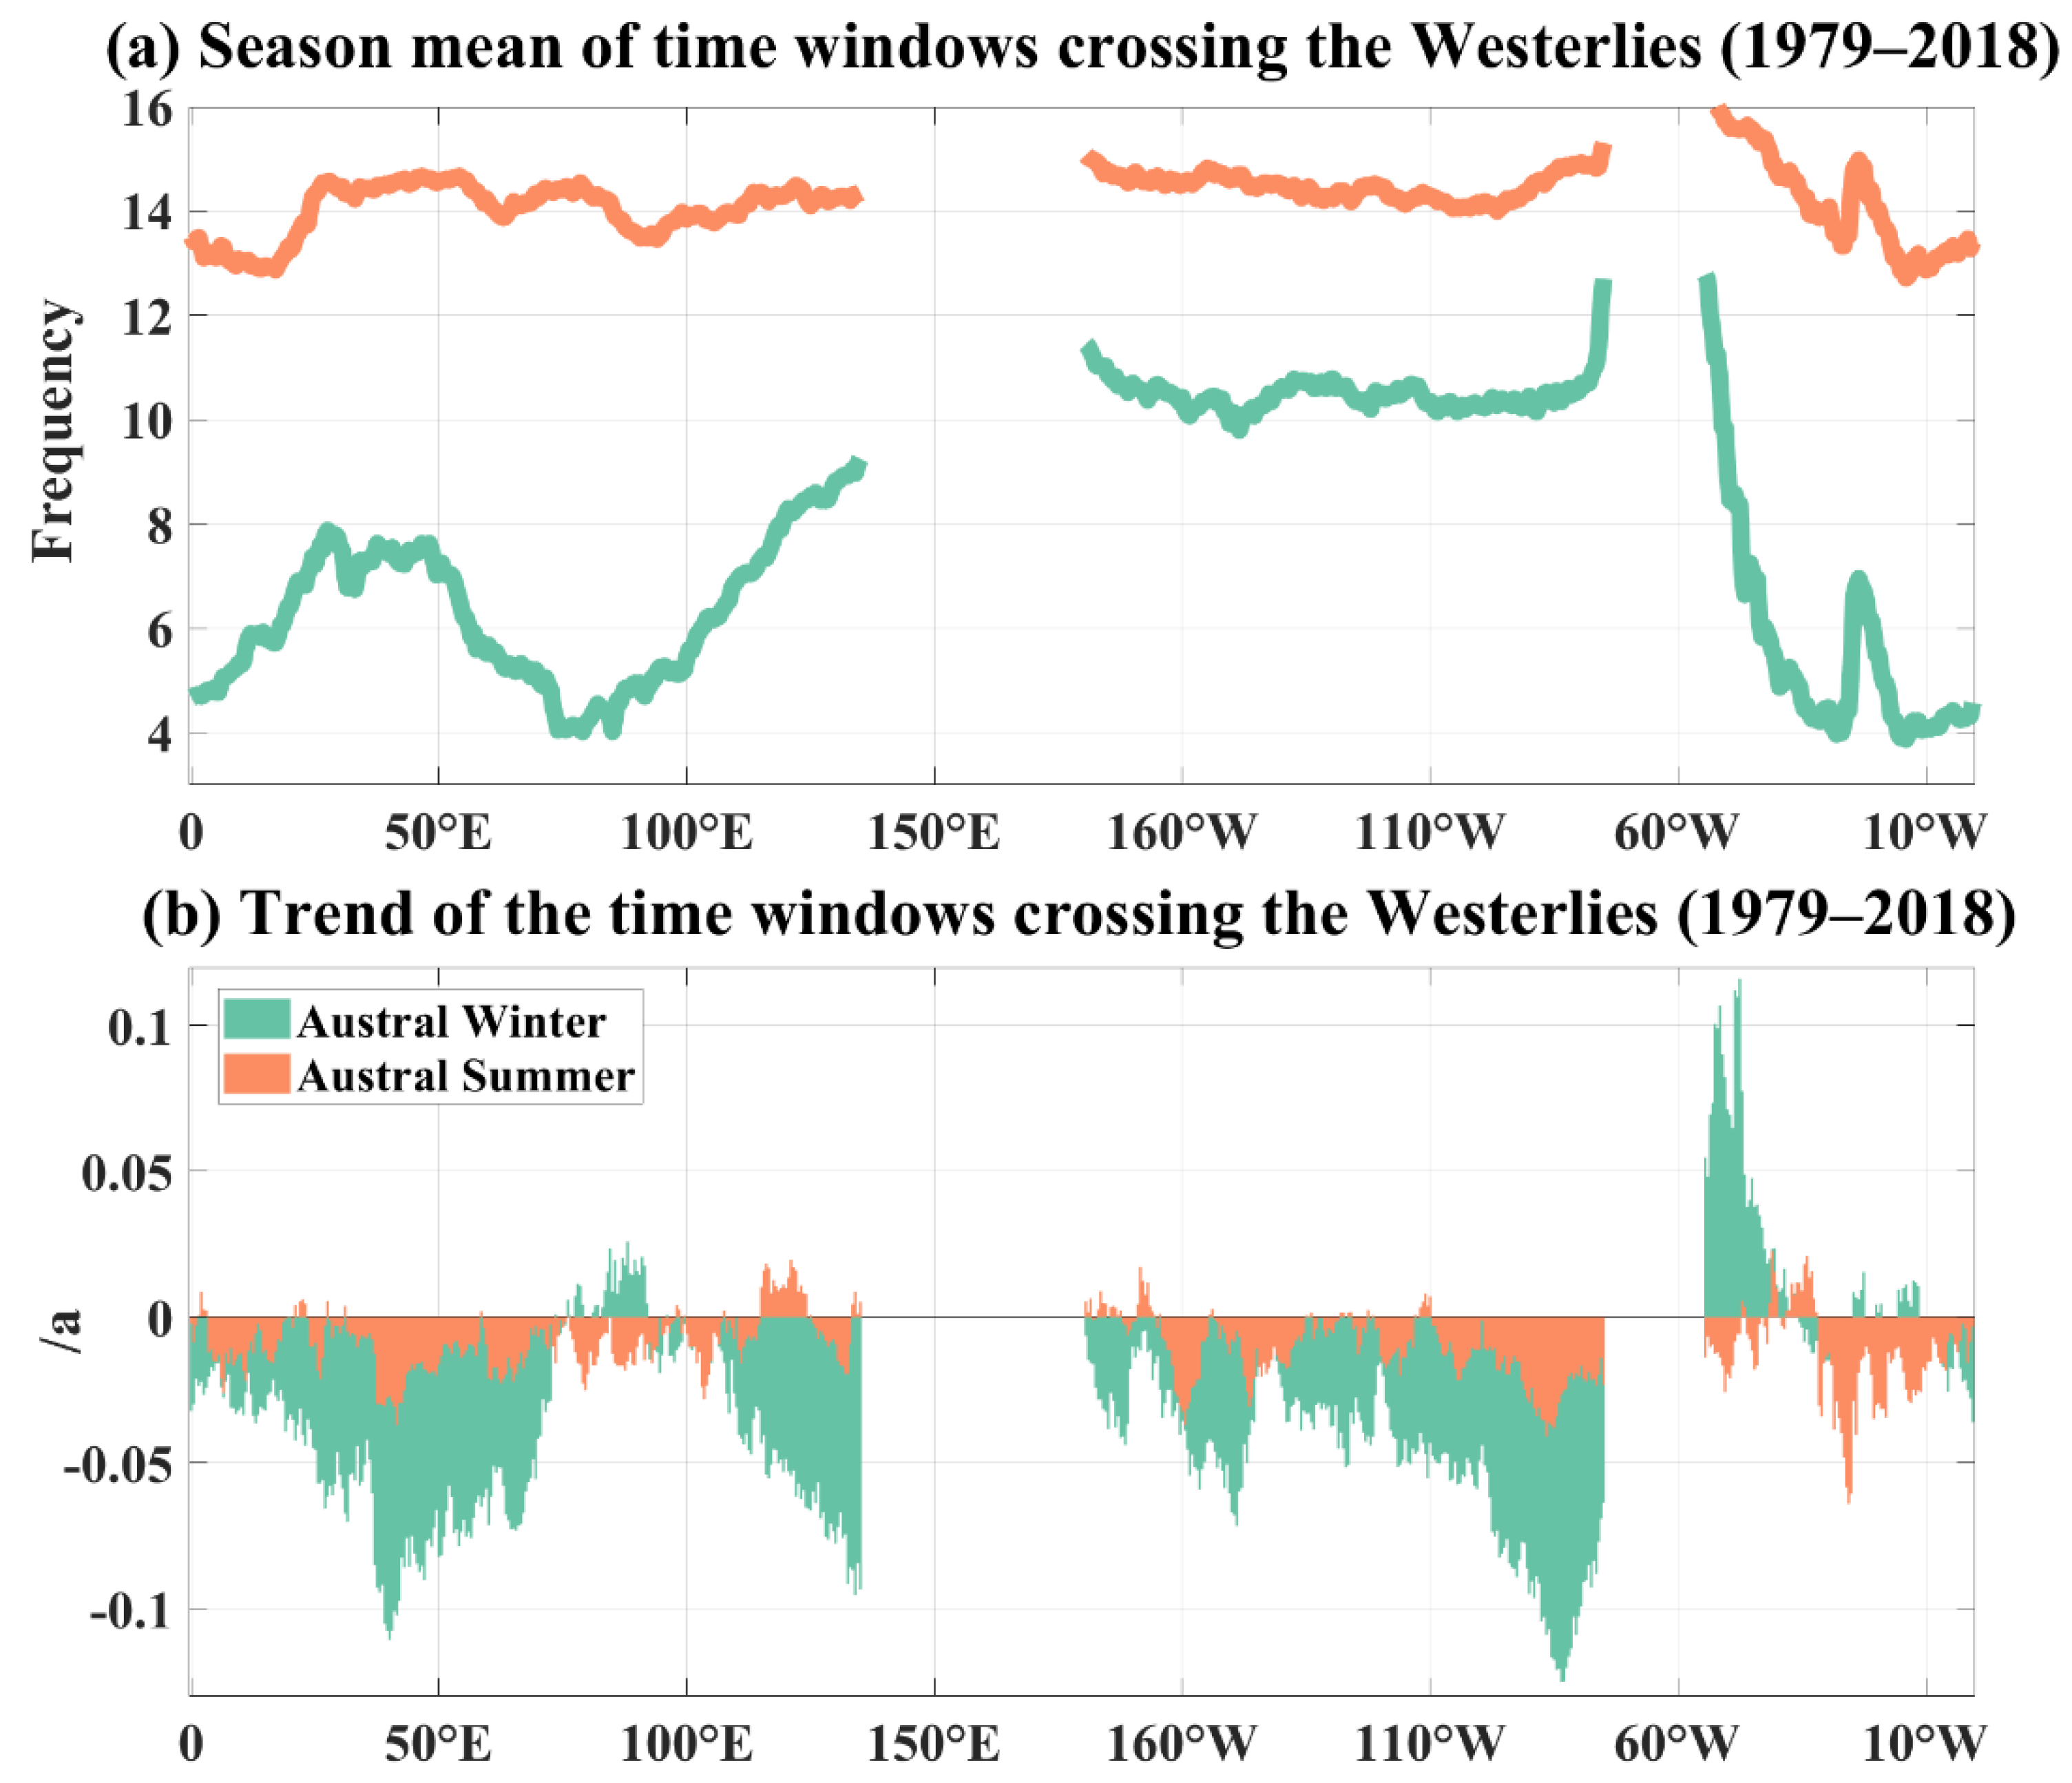
In the previous chapter, we examined wave characteristics in the westerlies, and to intuitively show the impact of waves on the vessels crossing the westerlies, we statistically analyzed the time windows of the vessels crossing the westerlies. The upper panel of Figure 6 shows the average frequency of time windows in which a vessel can cross the westerlies from different longitudes in summer and winter, as well as the trend from 1979 to 2018. For convenience, three ports were analyzed separately. We found that in summer, the seasonal average values were roughly the same at different longitudes, about 14. In winter, the number of time windows was much smaller than in summer and varied greatly between different longitudes. There were more time windows for crossing the westerlies from New Zealand to South America, while there were fewer in other regions. The range of the long-term trend of the number of time windows was significantly lower in summer than in winter and was mainly dominated by a weak negative trend. In winter, except for some areas east of South America, there was a very significant negative trend for the rest of the starting points from different longitudes, which shows that it is getting more and more difficult for vessels to cross the westerlies in winter. To describe the extreme situation of crossing the westerlies, we first recorded the time windows that occur no more than three times a month and then calculated the sum and trend in winter and summer from 1979 to 2018. The seasonal sum of these extreme situations was contrary to the seasonal mean distribution (not shown). In other words, the greater the total number of time windows for crossing, the fewer the total number of non-passable time windows. Similar characteristics also occurred with the trend. As the seasonal mean number showed a decreasing trend, the difficulty of crossing gradually increased.
Figure 7 illustrates the number of time windows for crossing the westerlies in winter and summer from three ports. It can be clearly seen that from these three ports, the number of time windows crossing the westerlies was significantly fewer in winter than in summer. The number of time windows was relatively close when departing from Hobart and Christchurch both in winter and summer, which is mainly because these two locations are nearby, and the routes are successively affected by the same cyclones. The number of time windows for voyages from Ushuaia was significantly greater than that number from Hobart and Christchurch due to the relatively shorter distance. In addition, when starting from Hobart and Christchurch, the number of time windows decreased in winter, reaching −0.12 /a and −0.06 /a, respectively. In summer, the decreasing trend from Christchurch was small (−0.04 /a), and it was insignificant from Hobart (−0.01 /a). In contrast, when starting from Ushuaia, the number of time windows increased in both winter and summer, with a trend of 0.11 /a in winter and 0.04 /a in summer.
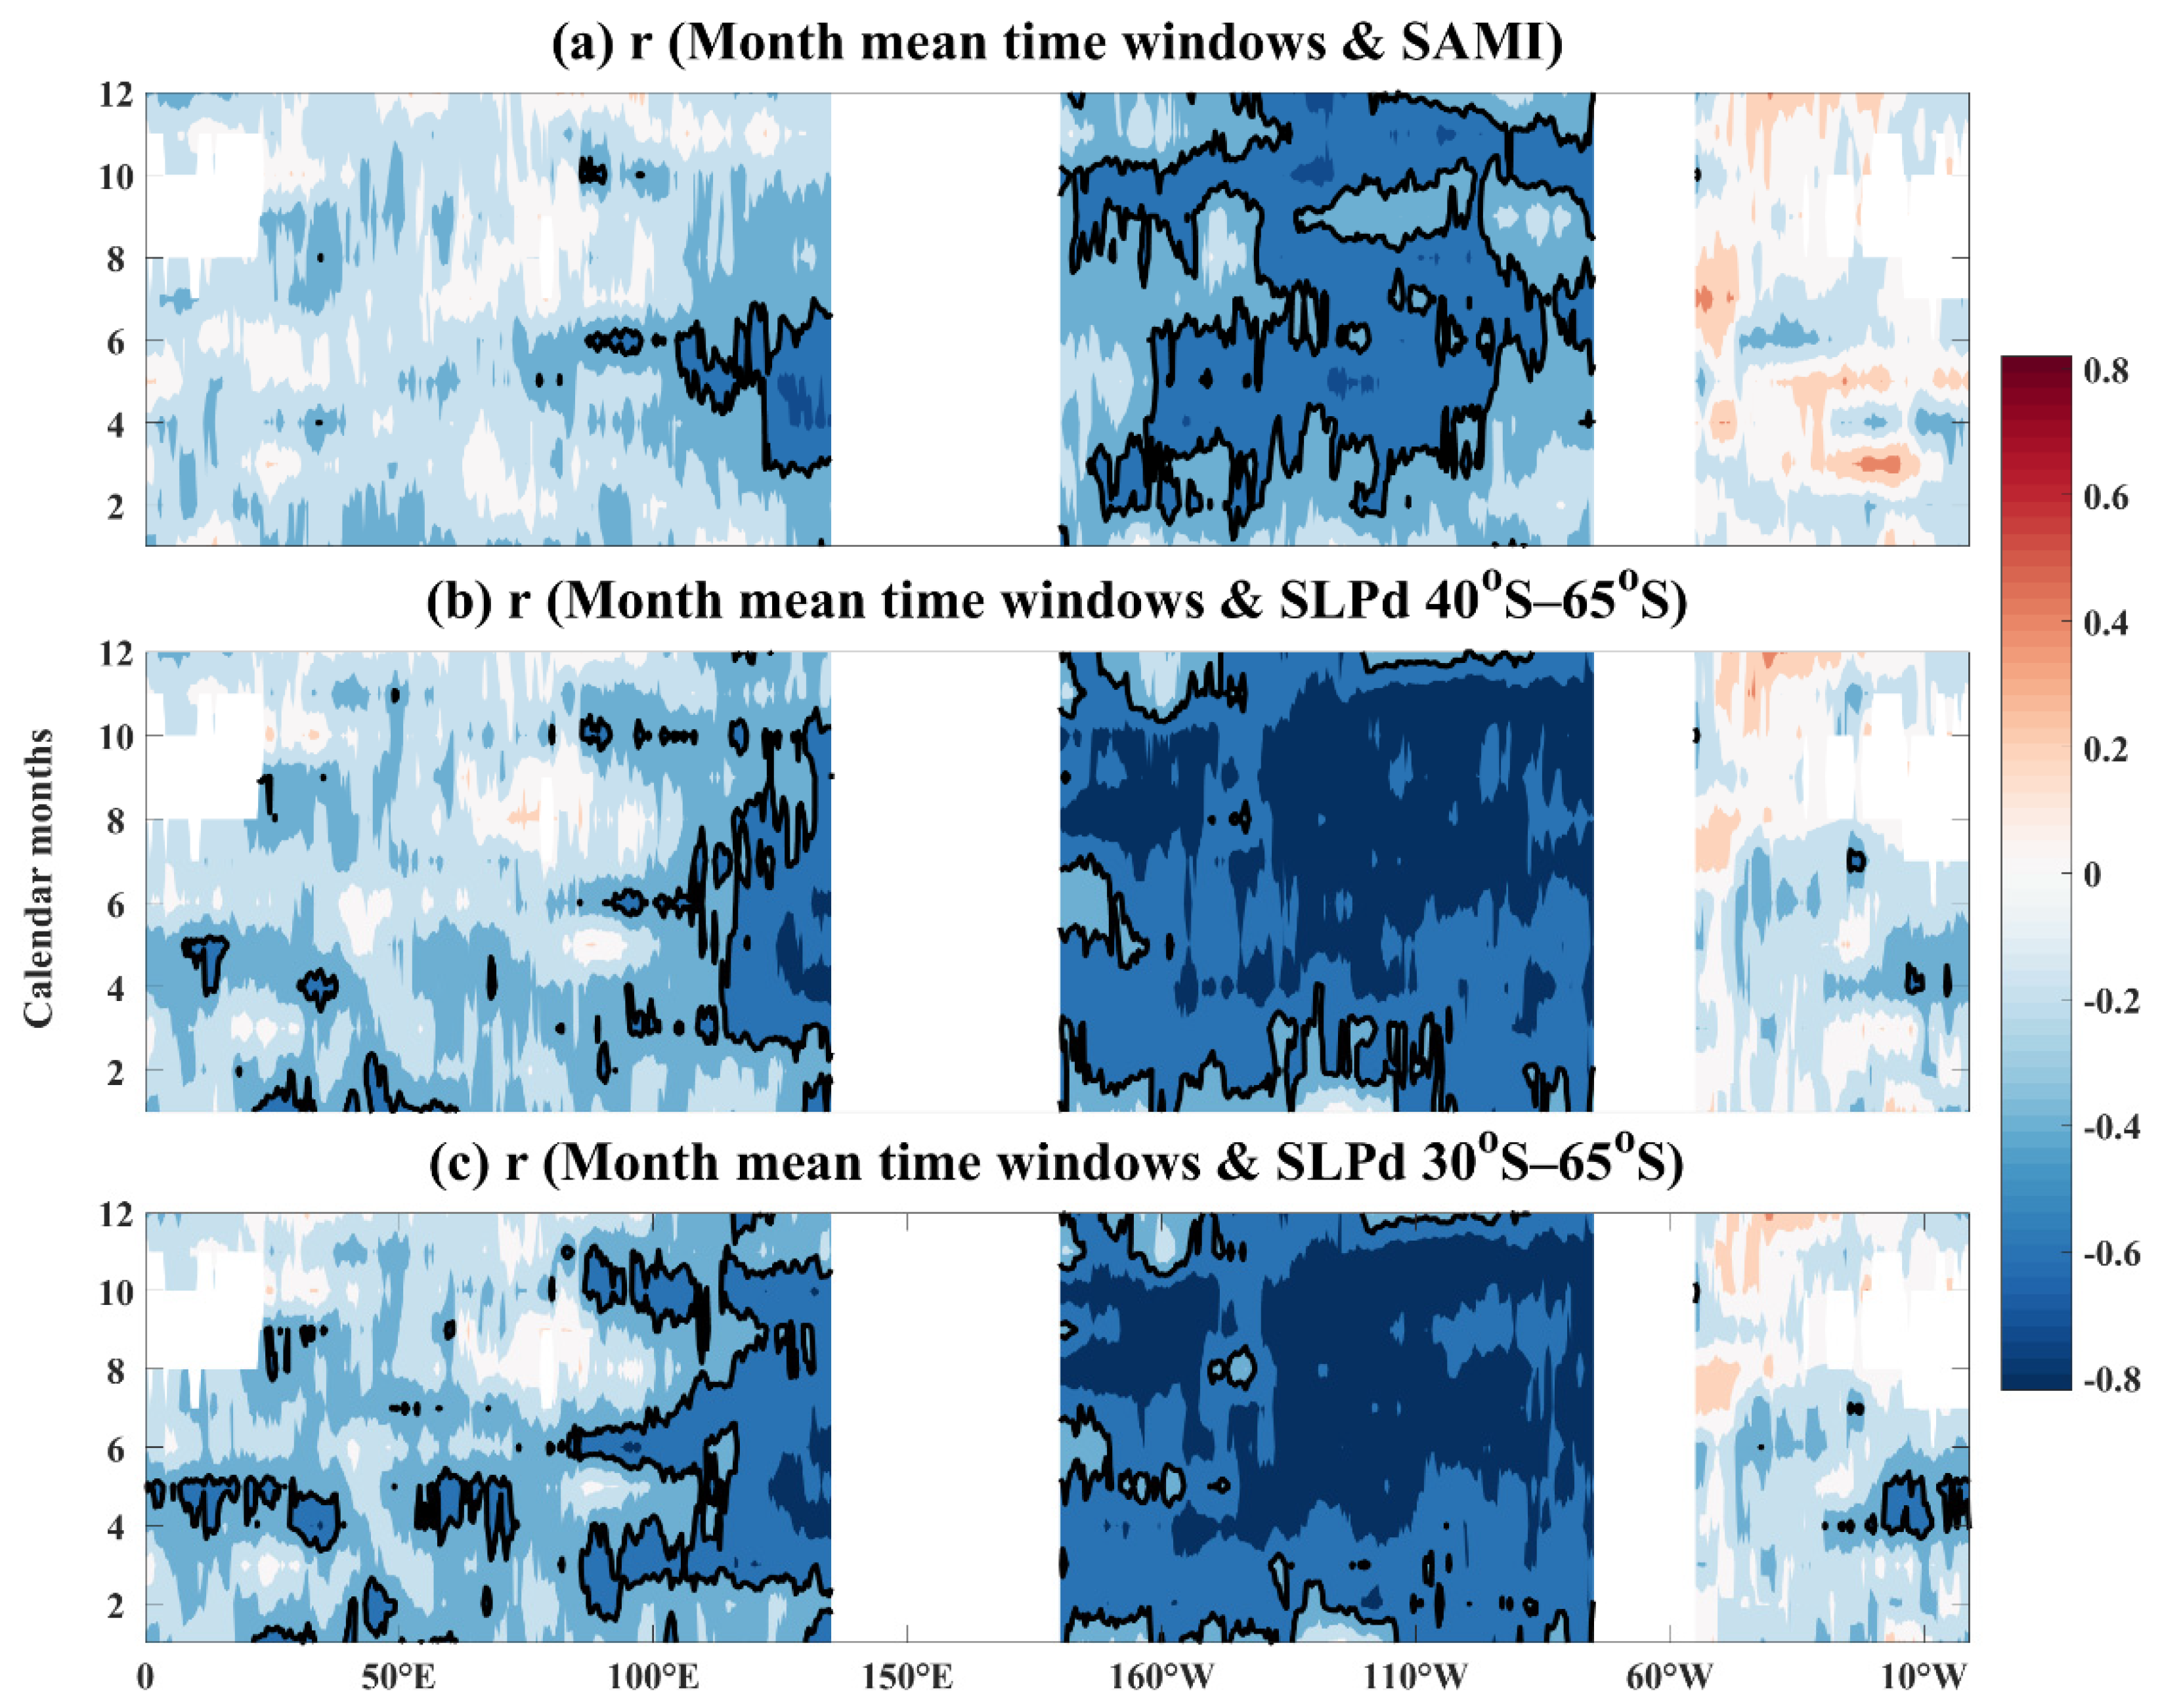
After assembling the statistical characteristics of time windows for vessels crossing the westerlies, we studied the connection between the time windows of crossing the westerlies with large-scale atmospheric modes. We hypothesized that if the relationship between them can be established on the seasonal timescale, the number of time windows for crossing the westerlies can be approximately estimated by predicting large-scale atmospheric modes. Previous studies showed that there is a good correlation between the SAMI and the westerlies cyclones, in which waves directly mirror the impact of cyclones [29,30]. Therefore, we calculated the correlation coefficient between the SAMI and the monthly number of westerlies crossings point by point at different longitudes (Figure 8a). The maximum negative correlation coefficient between the SAMI and the monthly number of westerlies crossings is located in the region between New Zealand and South America. The negative correlation is particularly strong from March to December. Since the SAMI is defined as the average of the entire latitude circle, we also calculated the correlation coefficient between the number of westerlies crossings at different longitudes and the sea-level pressure differences between 40° S and 65° S (Figure 8b). We found that if we replace the SAMI with the point-by-point sea-level pressure differences and calculate its relationship with the number of westerlies crossings, the negative correlation between the regions of New Zealand and South America increases further, and it is significant for almost all months. The sea-level pressure differences between 30° S and 65° S are considered to accurately show the characteristics of cyclones in the westerlies [31]. Therefore, we also calculated the correlation coefficient between the sea-level pressure differences between 30° S and 65° S and the number of crossings at the corresponding longitude points. We found that the relationship between the eastern regions of New Zealand improved slightly and the relationship in the western part of Hobart strengthened (Figure 8c). In conclusion, the monthly sea-level pressure differences between 30° S and 65° S at different longitudes can be used to estimate the number of windows per month for crossing the westerlies between 100° E and 75° W.

3.3. Estimating the Windows for Crossing the Westerlies

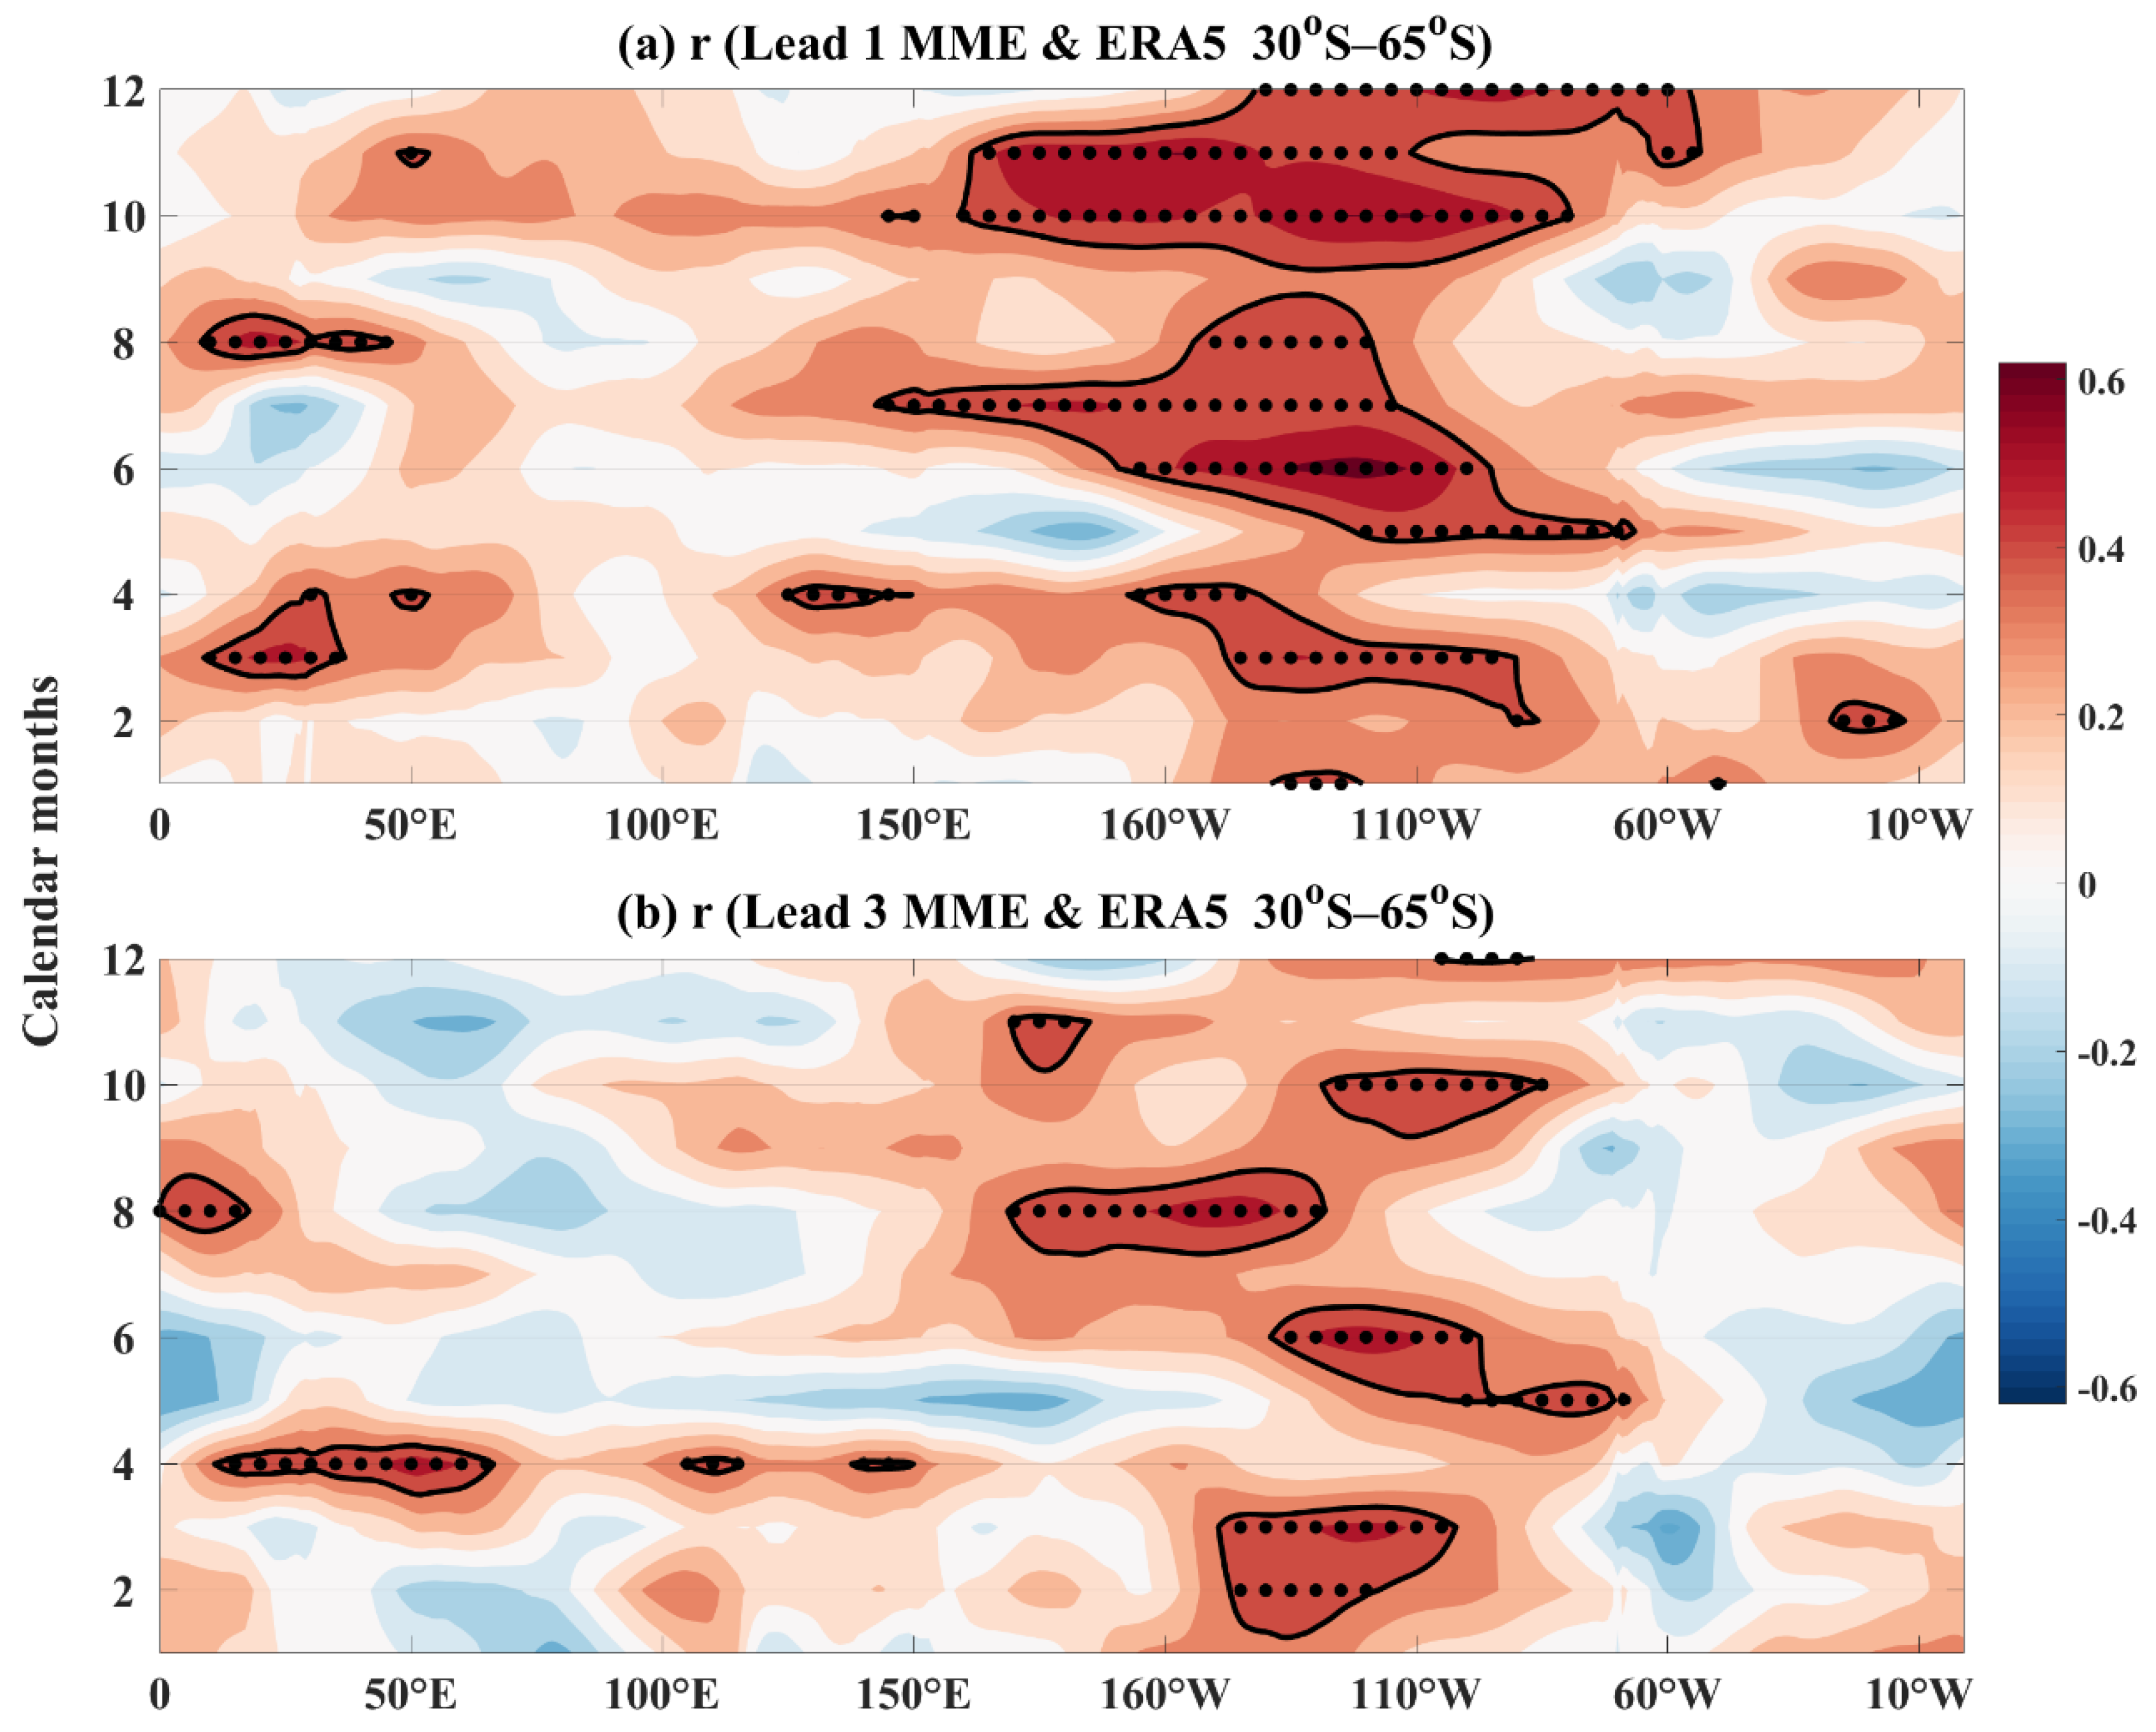
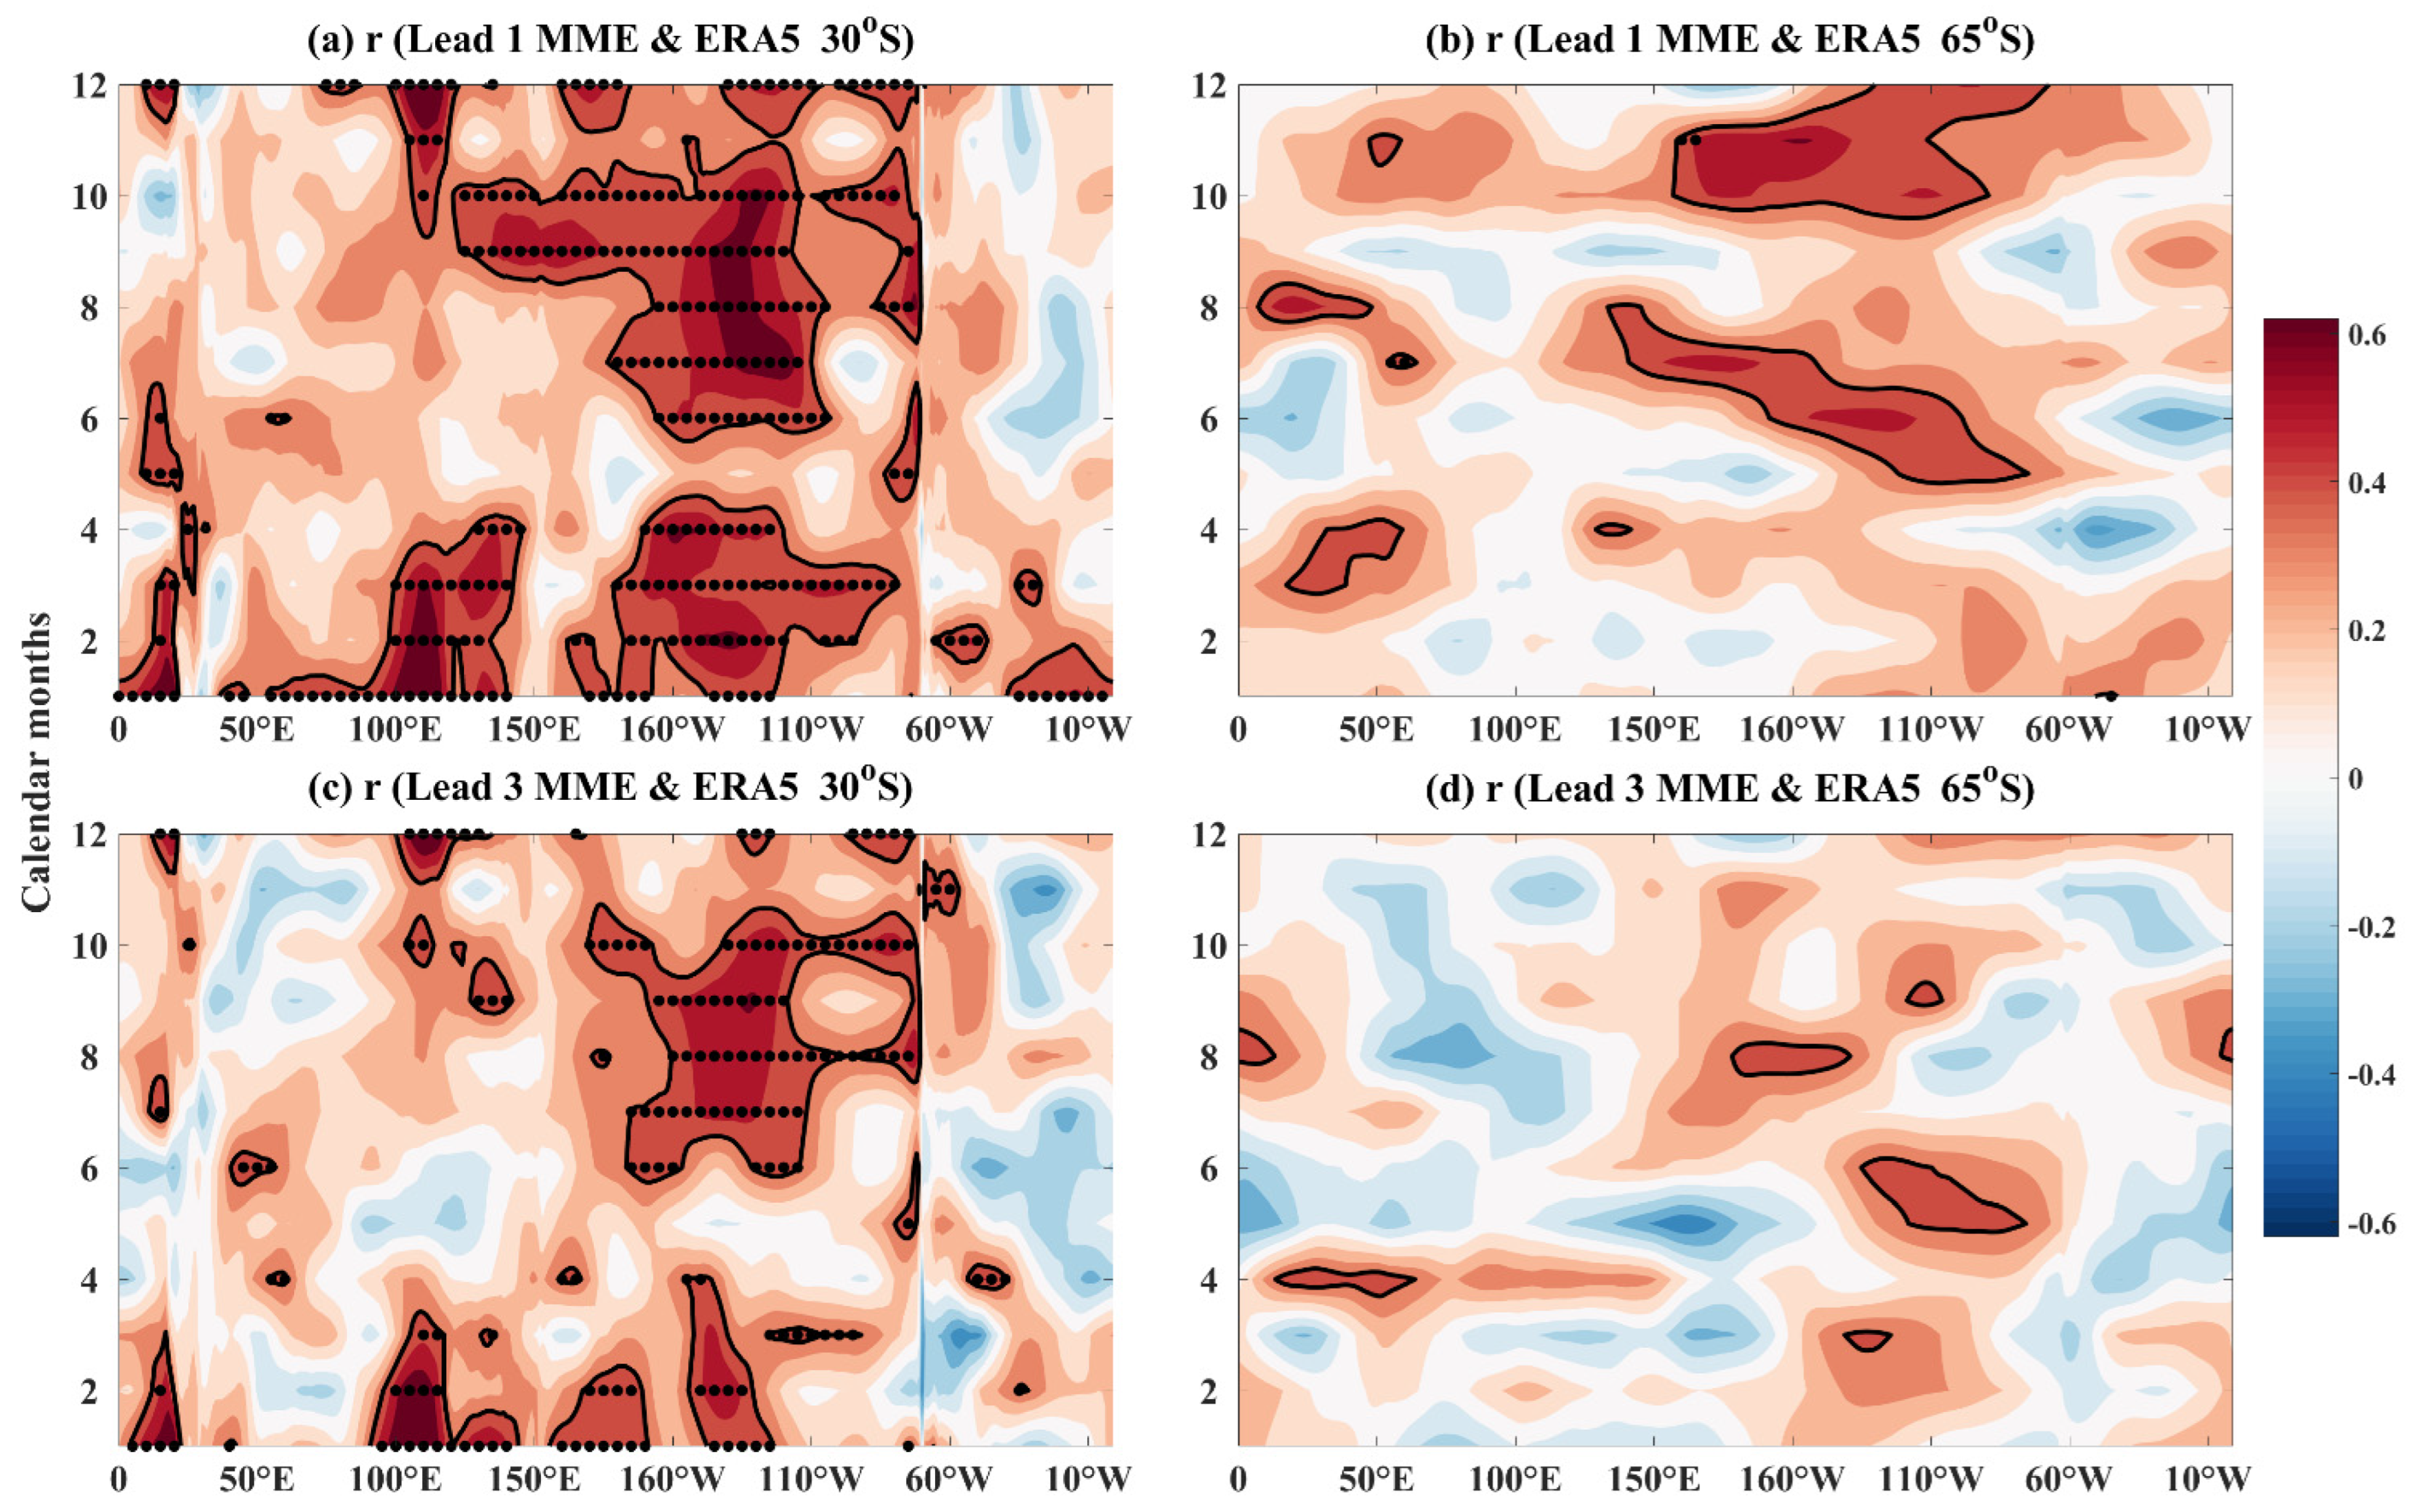
In the previous section, we showed that using the monthly sea-level pressure differences between 30° S and 65° S at different longitudes, we can estimate the number of time windows for crossing the westerlies for the region from 100° E to 75° W. Therefore, it is necessary to evaluate the forecast results of sea-level pressure differences using seasonal prediction systems to examine whether models can be used to estimate the number of time windows for crossing the Westerlies. We found that with a 1-month lead, the multi-model results of seasonal prediction systems had certain prediction skills for the sea-level pressure differences between 30° S and 60° S between 150° E and 60° W in the targeted calendar months from May to December (Figure 9). In comparison, the prediction skills for the sea-level pressure differences between 30° S and 65° S with a 3-month lead were greatly reduced. We investigated the reasons for the poor prediction results of the sea-level pressure differences between 30° S and 65° S using the multi-model method. We found that the multi-model could better forecast the sea-level pressure at 30° S with a 1-month lead, but the prediction results for 65° S were worse. Similarly, for the forecast results with a 3-month lead, the sea-level pressure prediction results at 65° S were also significantly worse than those at 30° S, and the prediction results at both 30° S and 65° S with a 3-month lead were worse than those with a 1-month lead (Figure 10). These results indicate that such poor prediction ability of the sea-level pressure differences between 30° S and 65° S in the seasonal prediction systems was mainly due to the forecast deviation of sea-level pressure at high latitudes, which may be related to the defection of the simulation of sea ice–atmosphere interaction processes in climate prediction systems.
On balance, with a 1-month lead, multi-model forecasts can give a relatively accurate forecast of sea-level pressure differences between 30° S and 65° S between 150° E and 60° W for the targeted calendar months during May to December so as to roughly estimate the relative difficulty of crossing the westerlies of the corresponding month with 1-month lead. It is worth noting that the actual situations for crossing the westerlies are far more complicated and depend more on accurate weather forecasting. However, from a short-term climate prediction perspective, our results can provide a suitable way of determining the difficulty of crossing the westerlies with a 1-month lead, which can provide a certain scheme for planning and improving the reserve of vital supplies.

4. Conclusions and Discussion

In this study, the wave height reanalysis data of ERA5 and the sea-level pressure hindcast data from two seasonal prediction systems were used. We first studied the wave characteristics in the Southern Ocean, then calculated the number of time windows for vessels to cross the westerlies month by month according to a series of assumptions, and then studied the relationship between the monthly number of time windows crossing the westerlies and the monthly sea-level pressure differences between middle latitudes and high latitudes. Finally, by evaluating the prediction skills for sea-level pressure difference in seasonal prediction systems, we identified the areas with high prediction skills for sea-level pressure difference, and thus can roughly estimate the difficulty of crossing the westerlies with a 1-month lead under certain conditions.
The results showed that the SWH, EWH, and extreme wave processes larger than 5 m and 8 m in winter are significantly stronger than those in summer. The SWH and the wave processes larger than 5 m increase in intensity and frequency both in winter and summer, while the climate state of the EWH and the wave processes larger than 8 m have stronger intensity and frequency near the Antarctic continent than those far away from the Antarctic continent. This makes it more difficult for vessels to cross the westerlies in winter than in summer; the difficulty of crossing in winter has been increasing except for some regions east of South America for the past 40 years. Correspondingly, the season mean of the time windows for crossing the westerlies from Hobart and Christchurch has been decreasing year by year, while the number of time windows for Ushuaia has been increasing, especially in winter.
We found that compared with the SAMI, monthly sea-level pressure differences between 30° S and 65° S can better estimate the monthly number of time windows for crossing the westerlies between 100° E and 75° W. A multi-model seasonal prediction system can provide a relatively accurate forecast of the sea-level pressure difference between 30° S and 65° S with a 1-month lead between 150° E to 60° W for the targeted calendar months from May to December. Multi-model forecasts can roughly estimate the relative difficulty of crossing the westerlies from specified departure points and targeted months with a 1-month lead. However, at a longer lead time, multi-model ensemble forecasts still have large defects, mainly due to the sea-level pressure forecast deviation at high latitudes, which may be related to the insufficient understanding of sea ice–atmosphere coupling processes in climate prediction systems.
Our findings make it possible to estimate with a 1-month lead the difficulty of crossing the westerlies for some specified locations and targeted months. In the past, to cross the westerlies, vessel captains usually paid more attention to weather forecasting. ECMWF can provide an operational wave forecast for the next 10 days, the Global Forecast System (GFS) can also produce hourly forecasts from 0 to 120 h and for every 3 h from 120 to 384 h. Weather forecasting is closely related to the initial values; with the increase in forecasting time, the forecasting rapidly becomes less reliable and cannot meet the requirements of estimating the difficulty of crossing the westerlies with a longer lead time. However, our research shows that if the accuracy of the seasonal forecast is improved, the difficulty of crossing the westerlies can be estimated, thus plans for the route and material reserves can be made a long time ahead. It should be noted that many assumptions are used in this study to quantify the number of available time windows for crossing the westerlies by month, which will have a certain statistical error. In real situations, there are many other factors that should be considered when crossing the westerlies, such as the direction of waves, wind speed, and wind direction, which also affect the vessel’s route. Furthermore, vessels cannot always maintain a southward route at a constant speed of 12 knots. However, by making these assumptions, we can obtain the influence of wave processes on crossing the westerlies, and the effectiveness of these assumptions has also been verified by the experience of China’s PSRVs crossing the westerlies. Therefore, we can obtain preliminary results for the vessels crossing the westerlies, and thus establish a connection with a large-scale atmospheric mode. Further work should model the route of vessels in more detail and use a more definitive representation of the departure and arrival locations. These improvements could make the quantified results more accurate. At the same time, it also puts forward new requirements for studying the reasons for the poor prediction skills with regard to high-latitude sea-level pressure in seasonal prediction systems and improving its prediction.

Author Contributions

S.Z. and H.J. conceived and designed the overall project and wrote the manuscript. Y.Y. supplied suggestions and comments for the manuscript. All authors have read and agreed to the published version of the manuscript.

Funding

This research was supported by the Southern Marine and Engineering Guangdong Laboratory (Zhuhai) (No. SML2020SP008), National Key R&D Program of China (Grant Nos. 2020YFA0608804 and 2019YFA0606703).

Institutional Review Board Statement

Not applicable.

Informed Consent Statement

Not applicable.

Data Availability Statement

The retrospective forecast data of CanCM4i and GEM–NEMO are available at http://iridl.ldeo.columbia.edu/SOURCES/.Models/.NMME/ (accessed on 4 June 2022). The ERA5 reanalysis dataset is available at https://www.ecmwf.int/en/forecasts/dataset/ecmwf-reanalysis-v5 (accessed on 4 June 2022).

Acknowledgments

We acknowledge the agencies that support the NMME-Phase II system, and we thank the climate modeling groups for producing and making their model outputs available. In particular, we would like to thank Yanping Zhao, the captain of Xuelong 2, for his guidance on onboard meteorological forecasting and route safety during China’s 36th Antarctic scientific expedition, which is also the initial source of my research ideas.

Conflicts of Interest

The authors declare that there are no conflict of interest.

References

  1. Kennicutt, M.; Chown, S.; Cassano, J.; Liggett, D.; Massom, R.; Peck, L.; Rintoul, S.; Storey, J.; Vaughan, D.; Wilson, T.; et al. Polar research: Six priorities for Antarctic science. Nature 2014, 512, 23–25. [Google Scholar] [CrossRef] [PubMed] [Green Version]
  2. Solomon, S. Stratospheric ozone depletion on Antarctic ozone. Rev. Geophys. 1999, 37, 275–316. [Google Scholar] [CrossRef]
  3. Turner, J.; Barrand, N.E.; Bracegirdle, T.J.; Convey, P.; Hodgson, D.A.; Jarvis, M.; Jenkins, A.; Marshall, G.; Meredith, M.P.; Roscoe, H.; et al. Antarctic climate change and the environment: An update. Polar Rec. 2013, 50, 237–259. [Google Scholar] [CrossRef] [Green Version]
  4. Kennicutt II, M.C.; Bromwich, D.; Liggett, D.; Njastad, B.; Peck, L.; Rintoul, S.R.; Ritz, C.; Siegert, M.J.; Aitken, A.; Brooks, C.M.; et al. Sustained Antarctic research: A 21st century imperative. One Earth 2019, 1, 95–113. [Google Scholar] [CrossRef] [Green Version]
  5. Orsi, A.H.; Johnson, G.C.; Bullister, J.L. Circulation, mixing, and production of Antarctic bottom water. Prog. Oceanogr. 1999, 43, 55–109. [Google Scholar] [CrossRef]
  6. Marshall, G.J.; Speer, K. Closure of the meridional overturning circulation through Southern Ocean upwelling. Nat. Geosci. 2012, 5, 171–180. [Google Scholar] [CrossRef] [Green Version]
  7. Young, I.R.; Fontaine, E.; Liu, Q.X.; Babanin, A.V. The Wave Climate of the Southern Ocean. J. Clim. 2020, 33, 1417–1433. [Google Scholar] [CrossRef] [Green Version]
  8. Young, I.R.; Ribal, A. Multi-platform evaluation of global trends in wind speed and wave height. Science 2019, 364, 548–552. [Google Scholar] [CrossRef]
  9. Meucci, A.; Young, I.R.; Aarnes, O.J.; Breivik, O. Comparison of wind speed and wave height trends from twentieth century models and satellite altimeters. J. Clim. 2020, 33, 611–624. [Google Scholar] [CrossRef]
  10. Wei, L.X.; Qin, T. Characteristics of cyclone climatology and variability in the Southern Ocean. Acta Oceanol. Sin. 2016, 35, 59–67. [Google Scholar] [CrossRef]
  11. Zheng, C.; Li, C.; Wu, H.; Wang, M. Wind-Sea, Swell and Mixed Wave Energy. In 21st Century Maritime Silk Road: Construction of Remote Islands and Reefs; Springer Oceanography: Singapore, 2019. [Google Scholar]
  12. Semedo, A.; Sušeljet, K.; Rutgersson, A.; Sterl, A. A global view on the wind sea and swell climate and variability from ERA-40. J. Clim. 2011, 24, 1461–1479. [Google Scholar] [CrossRef]
  13. Gong, D.Y.; Wang, S.W. Definition of Antarctic oscillation index. Geophys. Res. Lett. 1999, 26, 459–462. [Google Scholar] [CrossRef] [Green Version]
  14. Pezza, A.B.; Rashid, H.A.; Simmonds, I. Climate links and recent extremes in Antarctic sea ice, high-latitude cyclones, Southern Annular Mode and ENSO. Clim. Dyn. 2012, 38, 57–73. [Google Scholar] [CrossRef]
  15. Sun, H.L.; Qin, T.; Wei, L.X.; Wang, L.; Ma, J. A statistical analysis on cyclonic gale processes along Chinese Antarctic Research Expedition routes. Haiyang Xuebao 2020, 42, 54–66. (In Chinese) [Google Scholar]
  16. Hersbach, H.; Bell, B.; Berrisford, P.; Hirahara, S.; Horányi, A.; Muñoz-Sabater, J.; Nicolas, J.; Peubey, C.; Radu, R.; Schepers, D.; et al. The ERA5 global reanalysis. Q. J. Roy. Meteorol. Soc. 2020, 146, 1999–2049. [Google Scholar] [CrossRef]
  17. Takbash, A.; Young, I. Long-term and seasonal trends in global wave height extremes derived from ERA-5 reanalysis data. J. Mar. Sci. Eng. 2020, 8, 1015. [Google Scholar] [CrossRef]
  18. Timmermans, B.; Gommenginger, C.; Dodet, G.; Bidlot, J. Global wave height trends and variability from new multimission satellite altimeter products, re-analyses, and wave buoys. Geophys. Res. Lett. 2020, 47, e2019GL086880. [Google Scholar] [CrossRef]
  19. Nielsen, U.D.; Ikonomakis, A. Wave conditions encountered by ships—A report from a larger shipping company based on ERA5. Ocean Eng. 2021, 237, 109584. [Google Scholar] [CrossRef]
  20. Merryfield, W.J.; Lee, W.S.; Boer, G.J.; Kharin, V.V.; Scinocca, J.F.; Flato, G.M.; Ajayamohan, R.S.; Fyfe, J.C.; Tang, Y.M.; Polavarapu, S. The Canadian seasonal to interannual prediction system. Part I: Models and initialization. Mon. Weather Rev. 2013, 141, 2910–2945. [Google Scholar] [CrossRef]
  21. Côté, J.; Gravel, S.; Méthot, A.; Patoine, A.; Roch, M.; Staniforth, A. The operational CMC-MRB Global Environmental Multiscale (GEM) model. Part I: Design considerations and formulation. Mon. Weather Rev. 1998, 126, 1373–1395. [Google Scholar] [CrossRef]
  22. Kirtman, B.P.; Min, D.; Infanti, J.M.; Kinter III, J.L.; Paolino, D.A.; Zhang, Q.; van den Dool, H.; Saha, S.; Mendez, M.P.; Becker, E.; et al. The North American Multimodel Ensemble: Phase-1 Seasonal-to-Interannual Prediction; Phase-2 toward Developing Intraseasonal Prediction. Bull. Am. Meteorol. Soc. 2014, 95, 585–601. [Google Scholar] [CrossRef]
  23. China Concludes 38th Antarctic Expedition. Available online: http://en.people.cn/n3/2022/0427/c90000-10089775.html (accessed on 10 May 2022).
  24. Müller, F.; Schøyen, H. Polar research and supply vessel capabilities-An exploratory study. Ocean Eng. 2021, 224, 108671. [Google Scholar] [CrossRef]
  25. Young, I.R. Seasonal variability of the global ocean wind and wave climate. Int. J. Climatol. 1999, 19, 931–950. [Google Scholar] [CrossRef]
  26. Han, S.Z.; Zhang, H.R.; Zheng, Y.X. A global study of temporal and spatial variation of SWH and wind speed and their correlation. Acta Oceanol. Sin. 2014, 33, 48–54. [Google Scholar] [CrossRef]
  27. Marshall, G.J. Trends in the Southern Annular Mode from observations and reanalyses. J. Clim. 2003, 16, 4134–4143. [Google Scholar] [CrossRef]
  28. Bender, F.A.M.; Ramanathan, V.; Tselioudis, G. Changes in extratropical storm track cloudiness 1983–2008: Observational support for a poleward shift. Clim. Dyn. 2012, 38, 2037–2053. [Google Scholar] [CrossRef] [Green Version]
  29. Lubin, D.; Wittenmyer, R.A.; Bromwich, D.H.; Marshall, G.J. Antarctic Peninsula mesoscale cyclone variability and climatic impacts influenced by the SAM. Geophys. Res. Lett. 2008, 35, L02808. [Google Scholar] [CrossRef] [Green Version]
  30. Uotila, P.; Vihma, T.; Tsukernik, M. Close interactions between the Antarctic cyclone budget and large-scale atmospheric circulation. Geophys. Res. Lett. 2013, 40, 3237–3241. [Google Scholar] [CrossRef]
  31. Gao, H. Seasonal and Interannual Variations of the Southern Hemisphere Circulation and Their Influences on East Asian Summer Monsoon; Nanjing Institute of Meteorology: Nanjing, China, 2004; pp. 1–171. (In Chinese) [Google Scholar]
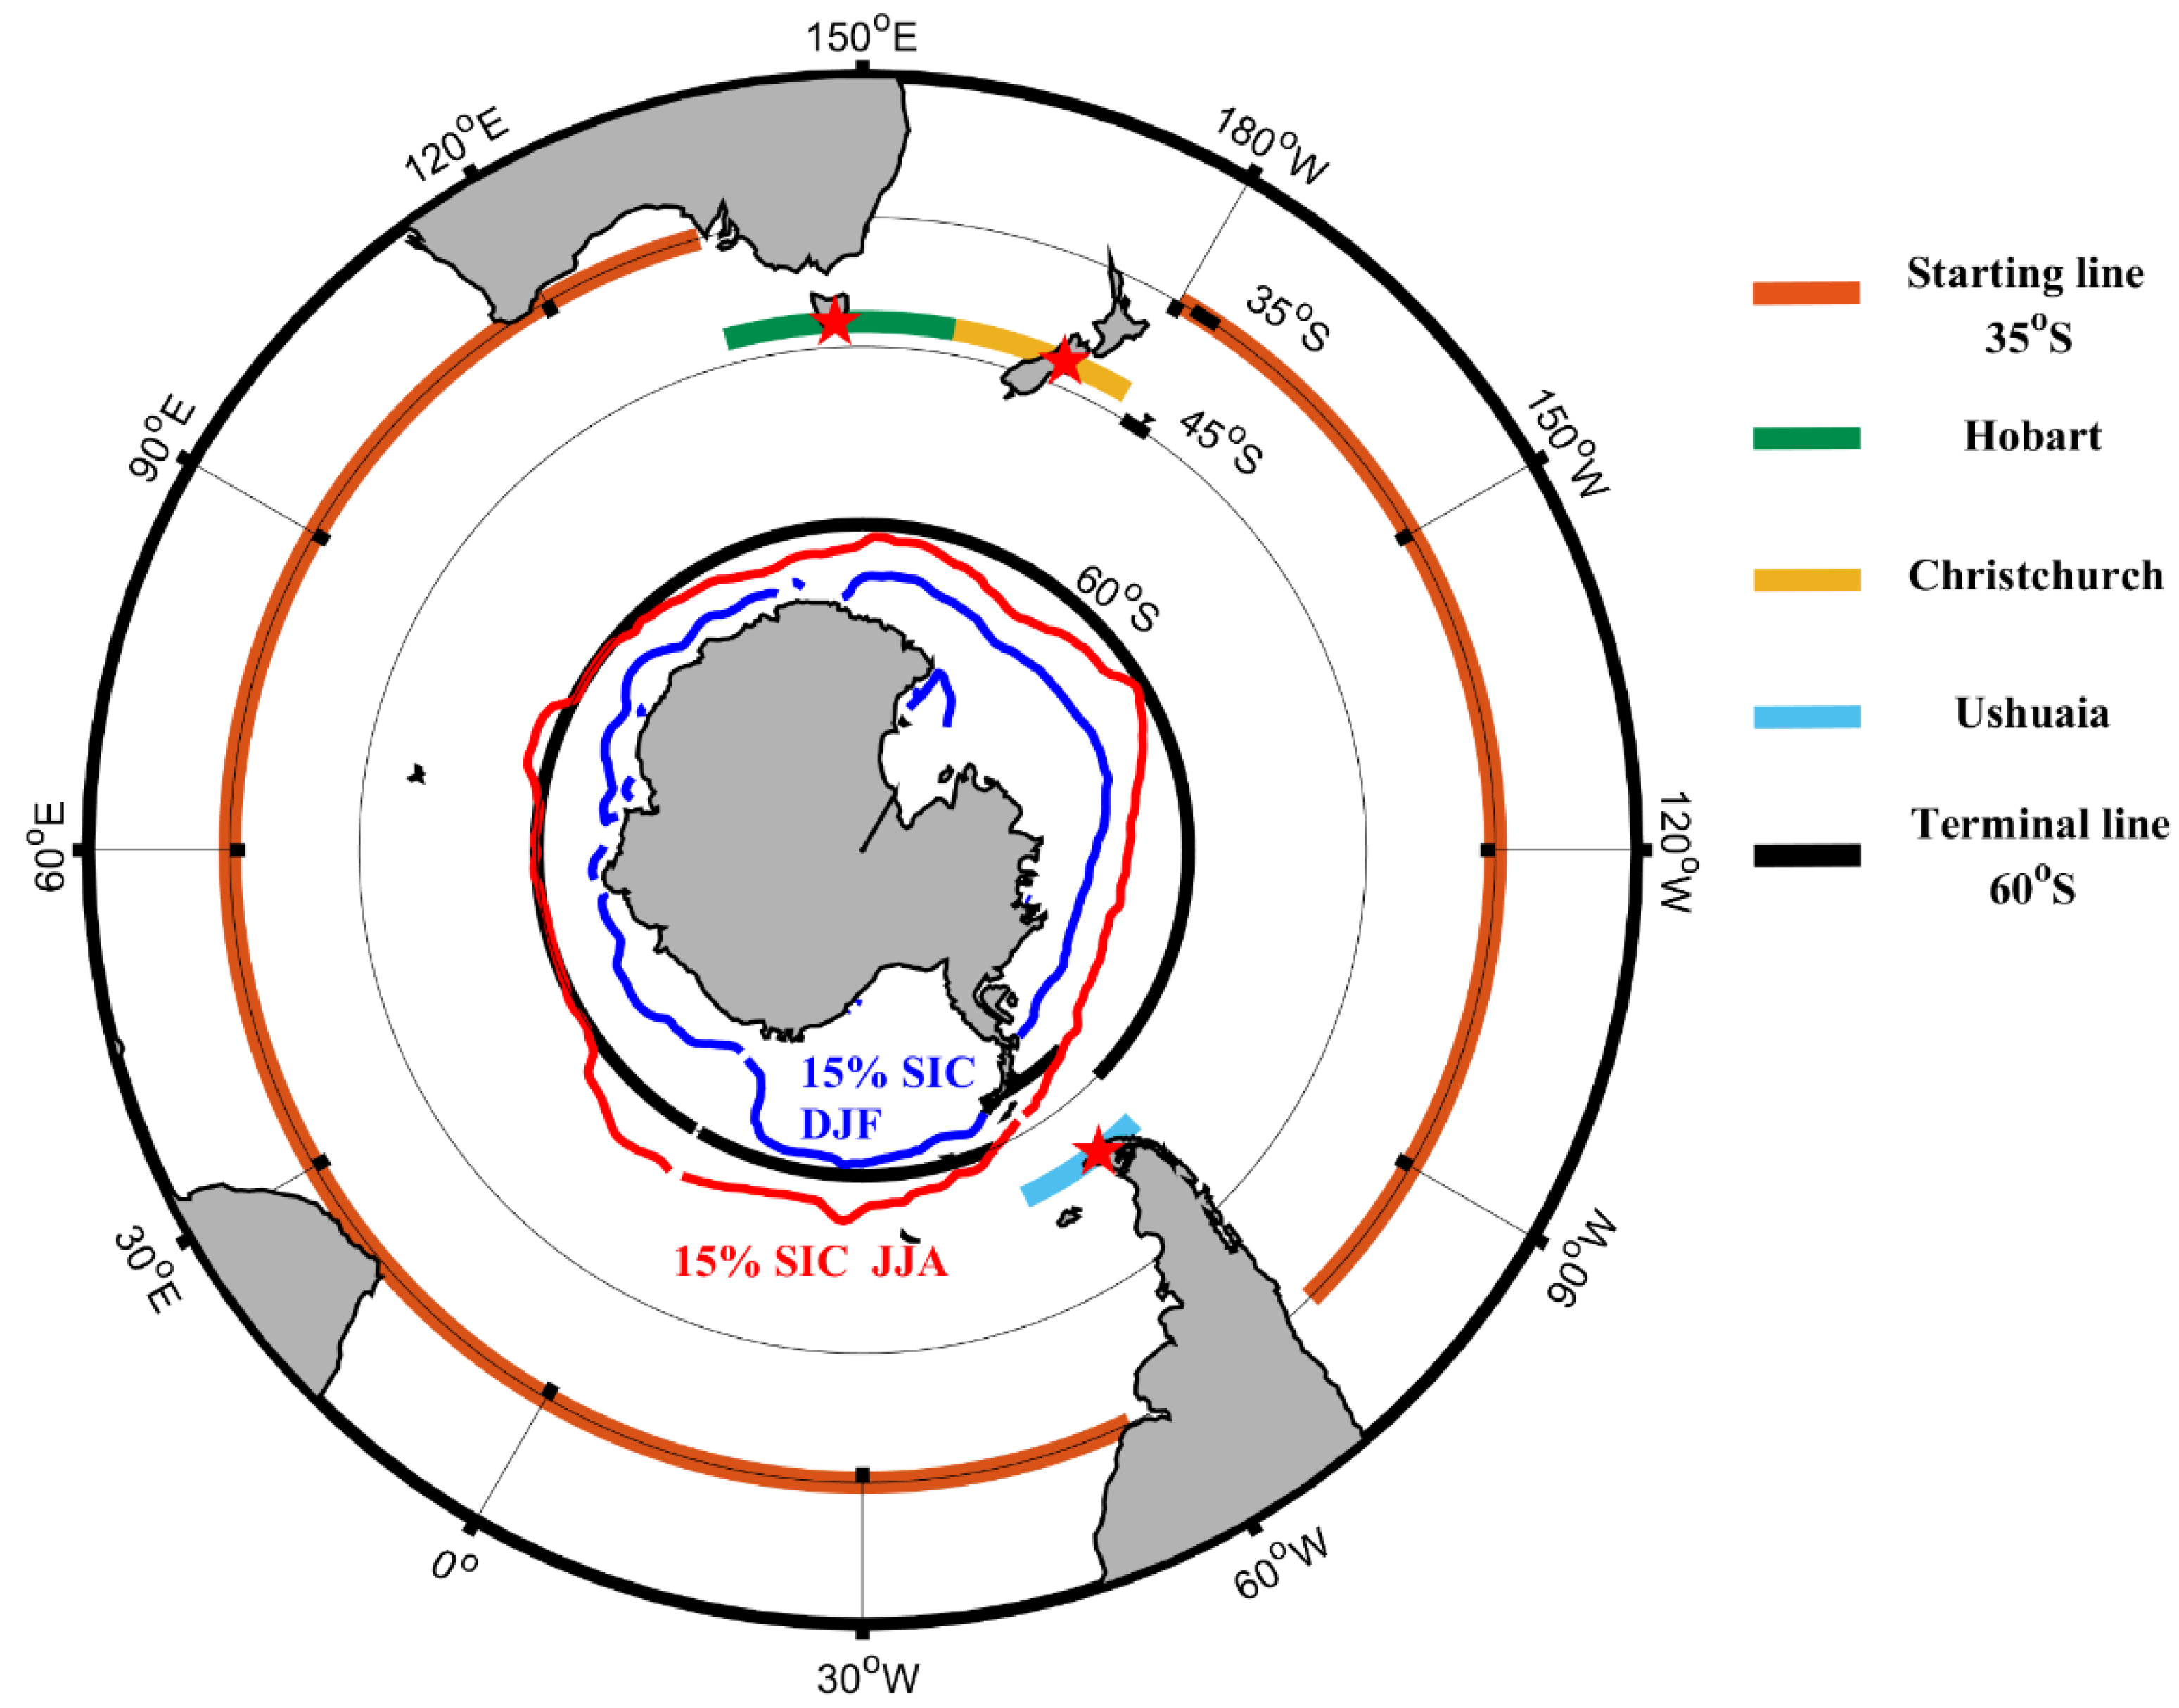
Figure 1. Schematic diagram of the starting and terminal locations of the routes crossing the westerlies toward Antarctica. Three ports, Hobart, Christchurch, and Ushuaia, are marked with red stars. The black solid line at 60° S and the area inside it are the locations indicating where vessels cross the westerlies. The blue and red lines mark the 15% sea ice extent in austral summer and austral winter, respectively.
Atmosphere 13 00916 g001
Figure 2. Mean SWH and trend during 1979–2018: (a) in winter (JJA), (b) in summer (DJF). The white contours are the 4 m isoline. The small black dots indicate where the trend was higher than 0.004 m/a and less than 0.008 m/a, the larger black dots show where the trend was larger than 0.008 m/a, and the red dots indicate a decreasing trend with the criteria similar to those of the black dots.
Atmosphere 13 00916 g002
Figure 3. Similar to Figure 2, but for the EWH. The white contour is the 8 m isoline. The small black dots indicate the trend is higher than 0.01 m/a and less than 0.02 m/a, the larger black dots indicate the trend is larger than 0.02 m/a, and the red dots indicate a decreasing trend with the criteria similar to those of the black dots.
Atmosphere 13 00916 g003
Figure 4. Similar to Figure 2, but for the number of wave processes larger than 5 m. The white contours show where the number was more than 15, the small black dots indicate where the trend was higher than 0.1 /a and less than 0.2 /a, the larger black dots show where the trend was larger than 0.2 /a, and the red dots indicate a decreasing trend with the criteria similar to those of the black dots.
Atmosphere 13 00916 g004
Figure 5. Similar to Figure 2, but for the number of wave processes larger than 8 m. The white contours show the area where the number was more than 4, the small black dots indicate where the trend was higher than 0.01 /a and less than 0.02 /a, the larger black dots show where the trend was larger than 0.02 /a, and the red dots indicate a decreasing trend with the criteria similar to those of the black dots.
Atmosphere 13 00916 g005
Figure 6. Season mean (a) and its trend (b) for the time windows for crossing the westerlies during 1979–2018.
Atmosphere 13 00916 g006
Figure 7. Sum and trend of the time windows for crossing the westerlies from three ports: (a) Hobart, (b) Christchurch, and (c) Ushuaia.
Atmosphere 13 00916 g007
Figure 8. Correlation between the number of time windows for crossing the westerlies and (a) the SAMI, (b) the sea-level pressure differences between 40° S and 65° S, and (c) the sea-level pressure differences between 30° S and 65° S. The black contours indicate the 0.4 isoline indicating statistical significance at the 95% level.
Atmosphere 13 00916 g008
Figure 9. Correlation between the seasonal prediction results and the ERA5 reanalysis for the sea-level pressure differences between 30° S and 65° S with (a) a 1-month and (b) 3-month lead for 12 targeted months. The black contours indicate the 0.4 isoline indicating statistical significance at the 95% level, the black dots indicate that the sign of correlation results between the two seasonal prediction systems and the ERA5 reanalysis data are consistent.
Atmosphere 13 00916 g009
Figure 10. Similar to Figure 9, but for the evaluation of the sea-level pressure at 30° S and 65° S.
Atmosphere 13 00916 g010
Publisher’s Note: MDPI stays neutral with regard to jurisdictional claims in published maps and institutional affiliations.