Article

Centennial Precipitation Characteristics Change in Haihe River Basin, China

1
School of Civil Engineering, Tianjin University, Tianjin 300072, China
2
State Key Laboratory of Hydrology-Water Resources and Hydraulic Engineering, Nanjing Hydraulic Research Institute, Nanjing 210098, China
3
Yangtze Institute for Conservation and Development, Nanjing 210098, China
4
Research Center for Climate Change of Ministry of Water Resources, Nanjing 210029, China
*
Author to whom correspondence should be addressed.
Atmosphere 2022, 13(7), 1025; https://doi.org/10.3390/atmos13071025
Submission received: 18 April 2022 / Revised: 23 June 2022 / Accepted: 24 June 2022 / Published: 28 June 2022
(This article belongs to the Section Climatology)

Abstract

:
Research on precipitation regularity in the past 120 years is an important link in analyzing the precipitation characteristics of watersheds. This paper systematically analyzes the characteristic changes of centennial precipitation data in the Haihe River basin with the help of CRU data, PCI, SPI, and the Pearson type III curve. The results show that the spatial and temporal distribution of precipitation in the Haihe River basin has a more obvious inconsistency. The temporal distribution shows the characteristics of relatively stable in the early period and increasing fluctuation in the later period, the concentration of precipitation gradually decreases, and the overall drought level decreases. The spatial distribution shows a general pattern of gradually decreasing from southwest to northeast, the overall trend of summer precipitation changes from stable to north–south extremes, and the distribution probability of extreme precipitation events in the basin decreases from southeast to northwest, while the drought-prone area transitions from the northeast to the west and southwest of the basin. Under the influence of both climate change and human activities, the seasonal distribution of precipitation tends to be average, the area affected by extreme precipitation rises, and the arid area shifts to the inland area.

1. Introduction

Precipitation is a basic and important meteorological phenomenon in nature and an important link in the hydrological cycle [1]. On the premise of climate change and intensified human activities, precipitation around the world shows obvious regional characteristics [2], which has a certain impact on the development of the natural environment and human society [3]. Moreover, the probability of regional extreme climate disaster events is increasing [4], which poses an increasingly serious threat to regional economic development, human survival [5], and the safety of water conservancy projects [6]. Therefore, the study on regional precipitation variation and its regularity is helpful to understand the mechanism of regional water cycle variation and plays an important role in regional water resource protection, ecological construction, and economic development. However, the study of the hydrological cycle under climate change requires extra-long series such as centennial precipitation data, while the existing observation data are often only several decades. The insufficient data series length is one of the main obstacles to the related research on climate change [7].
For the study of regional precipitation variation patterns, precipitation products are a useful supplement and substitute for actual measurement data [8]. CRU data is the rainfall data produced by the Climate Research Center of the University of East Anglia, UK. It is constructed on the basis of observations from global meteorological stations. It has a long time series (1901–2020) and a high spatial resolution (0.5 degrees × 0.5 degrees). Since the CRU data set was developed, it has been widely used by many scholars to detect global climate system changes, to develop and analyze instrument observation data, to understand the interaction between atmosphere, ocean, and ice, and to quantify and reduce uncertainties in the process of simulating climate change. Mutti P. R [9] uses CRU data as an alternative data source in the São Francisco watershed basin in Brazil to evaluate the correlation between potential evapotranspiration and precipitation; Kalisa W [10] uses CRU data to assessed drought exceedance and return years over East Africa from 1920 to 2016; Morice CP [11] uses CRU data to analyze and correct the abnormal phenomenon of monthly average near surface temperature from 1961 to 1990; Richard G [12] used CRU data to track the trend of summer maximum temperature, humidity, and heat index in three time periods, and clarified the advantages and disadvantages of CRU data compared with merra-2 and era data; Li [13] used CRU data to study the possible impact of observed surface temperature heterogeneity on trend estimation, and demonstrated that the impact of spatiotemporal heterogeneity in observed data on trend estimation is significant for regions with low data coverage (such as Africa), but not for countries with high data coverage (such as the United States). Through the above research, it can be seen that CRU data has a good performance in different scales. CRU data could provide a solution for a long series for centennial precipitation analysis. Therefore, a large number of studies [14,15,16,17,18,19,20] have shown that before using precipitation product data to study regional precipitation changes, its applicability in this area needs to be evaluated first.
As one of the important economic, political, and cultural centers in eastern China, the Haihe River basin has many water systems and dense river networks, which has important strategic significance and research value. Since this century, many scholars have studied the applicability of precipitation products in the basin and obtained more research results. Zou [21] used the hourly precipitation observation data of 232 meteorological stations in Haihe River basin from 1961 to 2012 to evaluate six interpolation methods to generate water level maps of different return periods; using global satellite data, Wang [22] estimated the rational utilization of water resources in the Haihe River basin using a gradient advancing regression tree; Wu [23] used the double temperature threshold method in the form of an exponential equation to analyze the temporal and spatial variation of snowfall in the Haihe River basin according to the daily temperature, snowfall, and precipitation data of 43 meteorological stations in the Haihe River basin and its surroundings from 1960 to 1979; using the daily precipitation data of 148 surface meteorological stations in the Haihe River basin since 1960 and NCEP/NCAR reanalysis data, He [24] analyzed the distribution changes of monthly precipitation key areas in the basin in summer and the intraseasonal configuration differences of its corresponding atmospheric circulation system, and quantitatively calculated the influence of the main circulation system on the precipitation in monthly key areas in the season; Shao [25] analyzed the precipitation data of the Haihe River in the recent 60 years, divided the consistent area based on the hydrometeorological zoning linear moment method, selected the optimal distribution, and calculated the frequency estimation value of the precipitation extreme value, and analyzed its spatial distribution characteristics; Ren comprehensively analyzed the characteristics of river water change in Haihe River Basin, and explored the possible mechanism affecting the multi decadal scale change of precipitation [26]. From the research conclusions of the above scholars, although the data of the Haihe River basin are relatively rich, most scholars study after 1960, which is mainly due to the late start time of meteorological stations covered in China. However, current research focuses on several decades, which does not reflect the precipitation change in the centennial scale. The exploration of a long series of precipitation data suitable for the Haihe River basin has important research value and significance for studying climate change, analyzing the regional flood and drought risk, and predicting the water resources regimes in future.
This study firstly discussed the applicability and credibility of CRU data in the Haihe River Bain. The characteristics of 100-year precipitation in the Haihe River basin are analyzed by using CRU data and site data. Based on the results of mutation point diagnosis and periodic diagnosis, the precipitation distribution in different periods of the Haihe River Basin, the tendency rate of precipitation in all seasons, and the spatial distribution of extreme precipitation are studied and summarized. The results show that the precipitation process in the Haihe River basin is divided into three stages, in which the distribution range of extreme precipitation gradually increases with the transition of stages, and the drought-prone area undergoes a change process from the northern part of the basin to the northeastern part of the basin and then to the western part of the basin, and in the future precipitation process, the distribution range of extreme precipitation time may further expand, while the drought distribution will expand to the northeastern region.

2. Materials and Methods

2.1. Study Area

The Haihe River basin (Figure 1) is located between 112°~120° E and 35°~43° N, covering an area of 318,200 square kilometers, with a high northwest and low southeast topography. The Haihe River basin belongs to temperate Southeast Asia monsoon climate zone with annual average relative humidity of 50~70%, annual average precipitation of 539 mm, and annual average land surface evaporation of 470 mm. Influenced by topographic and climatic factors, precipitation in the Haihe River basin shows remarkable characteristics in time and space. From the perspective of interannual changes, precipitation in the Haihe River basin continued to decrease from 1960s to the end of the century and showed a slight upward trend till the beginning of the 21st century. From the spatial distribution, the general trend is that the windward area in front of Taihang Mountains and Yanshan Mountains decreases to the northwest and southeast sides, respectively. As the watershed covers Beijing, Tianjin, and Hebei, it is densely populated and has many large and medium-sized cities, so it has a high political and economic status. At the same time, the per capita water resources of Haihe River basin are the lowest in all major river basins of China [27].

2.2. Data

CRU (Climate Research Unit) ts4.05 version is provided by the Climate Research Office of the University of East Anglia, with a time span of 1901–2020, a time scale of months and a spatial scale of 0.5°. The CRU data product contains a variety of meteorological elements including maximum/minimum temperature, potential evaporation and transpiration, precipitation, day-night temperature range, average temperature, number of rainy days, and vapor pressure. This paper selects the precipitation series as the main research object to study the distribution law of precipitation change in Haihe River basin from 1901 to 2020.

2.3. Methods

2.3.1. Applicability Evaluation Index

In order to better evaluate the applicability of CRU precipitation products, the following evaluation indicators are selected in this paper: Pearson correlation coefficient (R), root mean square error (RMSE), mean absolute error (MAE), and bias. The calculation formula is as follows:
R = ( X i X ¯ ) ( Y i Y ¯ ) ( X i X ¯ ) 2 ( Y i Y ¯ ) 2
BIAS = i = 1 n ( Y i X i ) i = 1 n X i × 100 %
MSE = 1 n i = 1 n ( X i Y i ) 2
MAE = 1 n i = 1 n | X i Y i |
where, Xi is the station observed precipitation value, Yi is the estimated value of precipitation product, i is the month, X and Y, respectively, represent the mean value of precipitation product and station-observed precipitation, and n is the total month of evaluation.

2.3.2. Mutation Point and Periodic Change Identification

(1) Mann–Kendall mutation point test
Mann–Kendall mutation point test method [28] is a nonparametric test method widely used in the hydrological field at present, this method will be used to determine the abrupt point of precipitation time series. Its formula is as follows:
var ( x n ) = n ( n 1 ) ( 2 n + 5 ) 72
UF k = x n x n ¯ var ( x n ) ,   k = 1 , 2 , n
where, n is the sample size and X is the sequence to be detected. Repeat the above process according to the inverse sequence of time series, make UBk = −UFk, UB1 = 0, and draw two curves, respectively. If >0, the sequence has an upward trend; on the contrary, the sequence has a downward trend. If UFk and UBk curves intersect and the intersection is between the critical lines, the time corresponding to the intersection is the time when the mutation starts.
(2) Morlet wavelet
Because Morlet wavelet has a good balance between time and frequency localization [29], this paper uses Morlet wavelet function as the basis function of wavelet change to study the periodicity of hydrological series. Morlet wavelet formula is:
Ψ 0 ( t ) = π 1 / 4 e iw 0 t e t 2 / 2
where: t is the time and w0 is the dimensionless frequency.

2.3.3. Pearson Type III Distribution Probability Density Function

Pearson type III curve [30] is a finite and infinite asymmetric unimodal and positive offset curve, which can be used to calculate the probability of weather time for annual, seasonal, and monthly precipitation, this method will be used as the calculation method of extreme precipitation probability in this paper, and its probability density function is:
f ( x ) = 1 α Γ ( β ) ( x ξ α ) β     1 exp ( x ξ α )
where, Γ(·) is a gamma function, α is a scale parameter, and β is a shape parameter, obeying G2 distribution. Because this method is widely used in hydrological frequency analysis and calculation in China and has a large number of research bases, this probability distribution is used to describe the distribution of extreme precipitation in this paper.

2.3.4. Precipitation Concentration Index

The currently used precipitation concentration index calculation methods are based on a modification of the PCI defined by Oliver [31]. It is now widely used in the analysis of precipitation processes on annual as well as seasonal used to analyze precipitation processes. Its calculation is as follows:
PCI = i = 1 12 P i 2 ( i = 1 12 P i ) 2 × 100
where Pi is the precipitation of the ith month.
From Equations (2)–(9), if the annual precipitation is concentrated in one month, the PCI value is 100, which is the highest; if the annual precipitation is uniformly distributed in 12 months, the PCI value reaches the minimum, which is about 0.08. In the actual application process, it is generally defined that when the PCI ≤ 10, it means that the monthly distribution of its annual precipitation is more uniform; when 11 ≤ PCI < 20, it means that its annual precipitation is more concentrated. When PCI ≥ 20, it can be considered that the distribution of annual precipitation in the region has abnormal concentration within the year, and the monthly variation of precipitation is great.

2.3.5. Standardized Precipitation Index

SPI index is often used to calculate and analyze the drought degree of the region. Its main method is to calculate the precipitation by establishing a normal distribution model of monthly precipitation data Γ. The SPI index obtained by standardized processing after distribution probability is finally used to divide the meteorological drought grade by standardized precipitation cumulative frequency distribution. This paper will use this method as a tool for drought analysis in Haihe River basin, and the criteria for class classification [32] are shown in Table 1. The SPI calculation formula based on the Γ fitting function is as follows:
SPI = S t ( c 2 t + c 1 ) t + c 0 [ ( d 3 t + d 2 ) t + d 1 ] t + 1 . 0
where, t = ln 1 G ( x ) 2 , G(x) is the probability of precipitation distribution associated with the Γ function; x is the sample of precipitation data, S is the positive and negative coefficient of the probability distribution, S = 1 when G(x) > 0.5; S = −1 when G(x) ≤ 0.5; c0, c1, c2 and d1, d2, d3 are the calculated parameters of the Γ distribution function transformed into the simplified approximate solution formula of cumulative frequency.
G(x) is calculated using the Γ distribution function probability density integral formula:
G ( x ) = 1 β γ Γ ( γ ) 0 x x γ 1 e x / β dx , x > 0
where, γ, β are the shape and size parameters of the Γ function, respectively, estimated by the maximum likelihood method.
For the spatial and temporal variation characteristics of regional drought, the drought frequency Fi was used to assess the frequency of drought events, and the drought area ratio Pi was used to evaluate the impact range of drought. Their calculation equations are, respectively,
F i = m i M × 100 %
P j = n j N × 100 %
where M is the total number of years, mi is the number of drought years for different grids in the study time period, N is the total number of grids, and nj is the number of grids with drought in the jth year. When Pj ≥ 50% is a region-wide drought, 33% ≤ Pj < 50% is a regional drought, 25% ≤ Pj < 33% is a partial regional drought, 10% ≤ Pj < 25% is a local drought, and Pj < 10% is no significant drought.

3. Results

3.1. Applicability Analysis

In order to fully verify the applicability of the data, 24 rain gauges and a monthly grid point data set in Haihe River basin are selected as the reference objects for evaluation, and the reliability of the CRU data is analyzed on site and surface scales, respectively. Station data and monthly grid point data of surface precipitation in China are derived from China Meteorological Data Sharing Network (0.5° × 0.5°, http://data.cma.cn/, accessed on 1 January 2021). In order to facilitate the comparison and analysis with the station data, the inverse distance interpolation method is used to interpolate the CRU data to the corresponding station position during the calculation. The results of the comparative analysis are shown in Table 2. It can be seen that the CRU data show good reliability in both site and surface rainfall descriptions. At the same time, due to the lack of 1901–1950 data, this paper compares the calculation results of CRU data in 1901–1950 with those of other scholars [33,34], and verifies that this data still maintains a good applicability in this time period. Therefore, it can be considered that CRU data has a good applicability in the Haihe River Basin.

3.2. Precipitation Characteristics of the Haihe River Basin

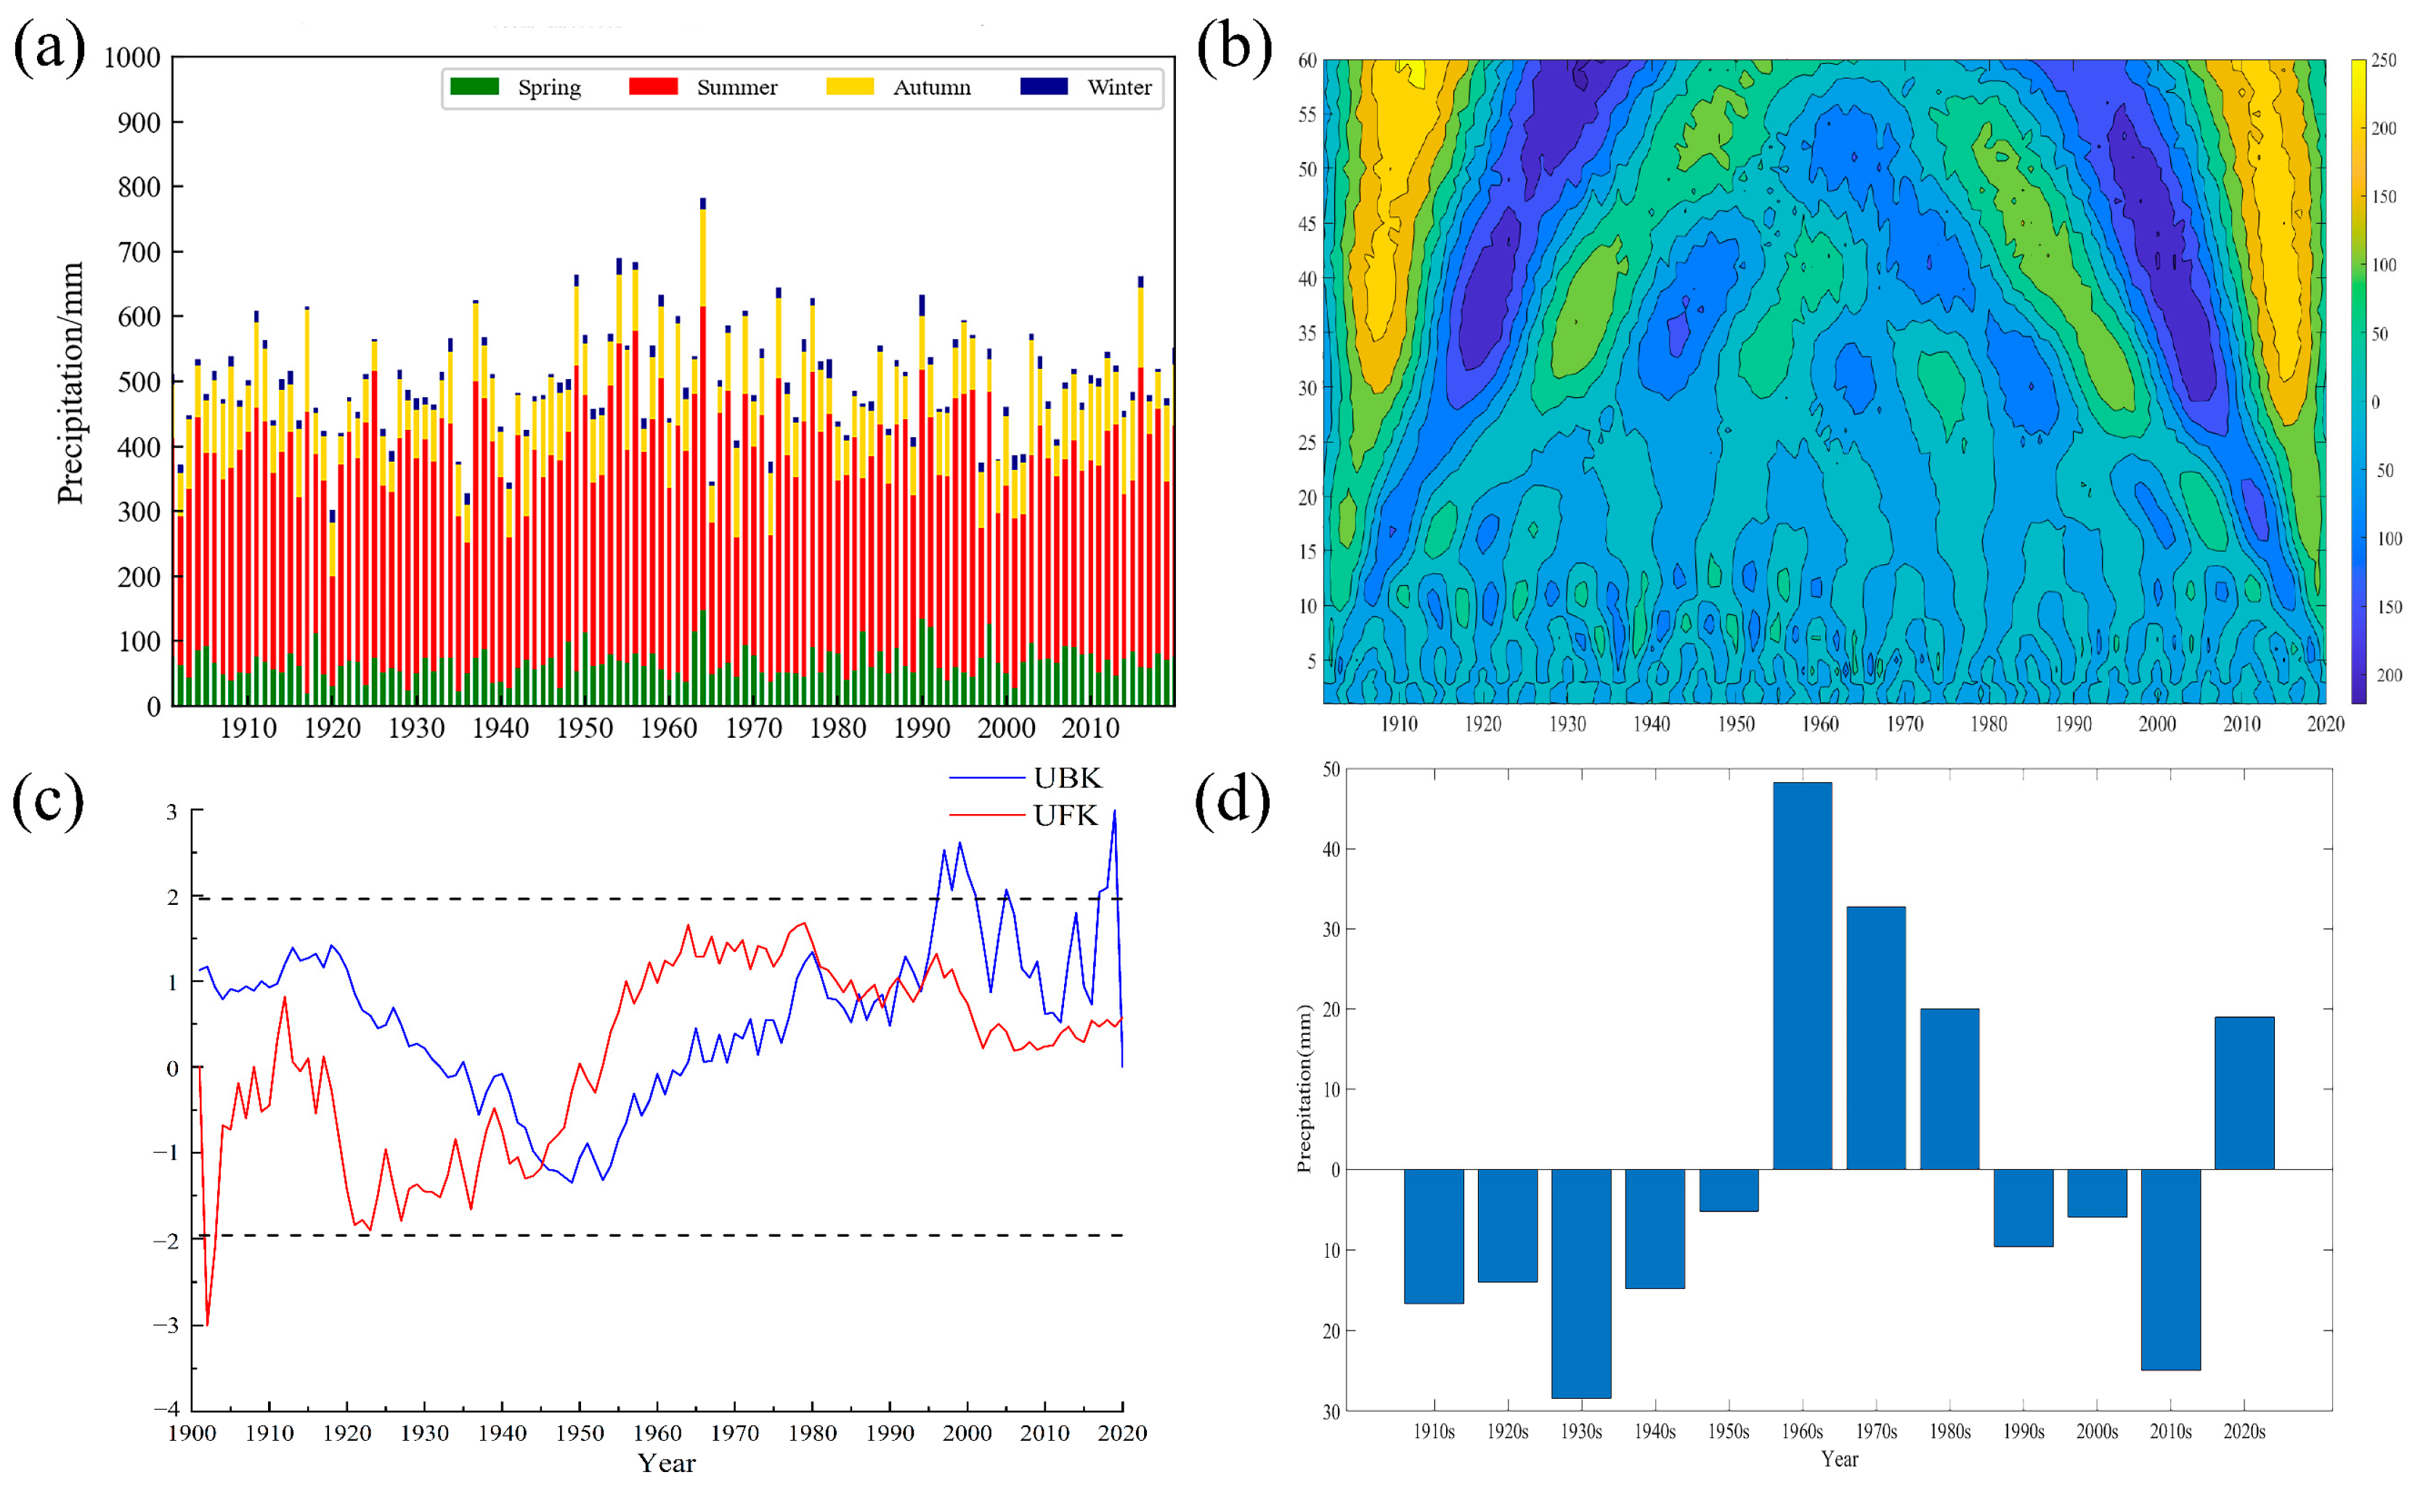
The annual and seasonal precipitation sequences of the Haihe River basin are shown in Figure 2a. The Mann–Kendall trend test for the time series of annual precipitation yields a Z-value result of 0.87, which shows a non-significant increasing trend. In terms of the distribution of seasonal precipitation, the average percentage of spring precipitation is 13.12%, summer precipitation is 66.51%, autumn precipitation is 17.94%, and winter precipitation is 2.43%. Among them, the variation of summer precipitation is the most obvious, with an average difference between different years of 52.16 mm. The change of the spring and autumn season is relatively flat, with the average change of 18 mm and 22.65 mm, respectively, and the minimum change of winter precipitation is 4.35 mm. The test results of the Morlet wavelet are shown in Figure 2b, and it can be seen that the frequency scales of the precipitation series in the basin are mainly concentrated around 5, 40, and 60 years, and the significance test shows that 40 years is the significant period. The whole precipitation event sequence shows a cyclical change of decreasing and then increasing, which is similar to the performance results in Figure 2a. The Mann–Kendall mutation point test (Figure 2c) shows that there are two mutation points in the precipitation sequence, the first of which is more obvious in 1945. However, since the values of the UB and UK series are close in 1980–1990, the mutation point test is carried out for 24 stations and 133 grid points in the catchment based on the results of the surface average precipitation test. The results show that the average result is 1988. Most of the results were between 1987 and 1990, so 1988 was chosen as the second point of change in this paper. At the same time, it can be seen from the 10a cumulative anomaly change results (Figure 2d), that before 1950, all the anomalies were negative, the precipitation in this period was less, positive anomaly during 1950–1990, negative anomaly between 1990 and 2010 and positive anomaly in 2020, which basically coincided with the mutation test results.
In general, precipitation in the Haihe River basin has changed to a certain extent over the past 120 years, with the basin showing a slow increase in precipitation and exhibiting more obvious cyclical characteristics. From the characteristics of seasonal precipitation changes, precipitation changes significantly in summer and autumn, and smoothly in spring and winter, showing the typical characteristics of the temperate East Asian monsoon climate zone. After determining the overall regularity of precipitation changes in the Haihe River basin, in order to better study the precipitation change patterns and trends of extreme precipitation events in the basin over the past hundred years, it is divided into three periods based on the results of the mutation test of the precipitation time series. Among them, the first period is 1901–1945, the second period is 1946–1988, and the third period is 1989–2020.

3.3. Spatial and Temporal Variation Patterns of Precipitation in the Haihe River Basin in Different Periods

  • Changes in seasonal precipitation tendency rate
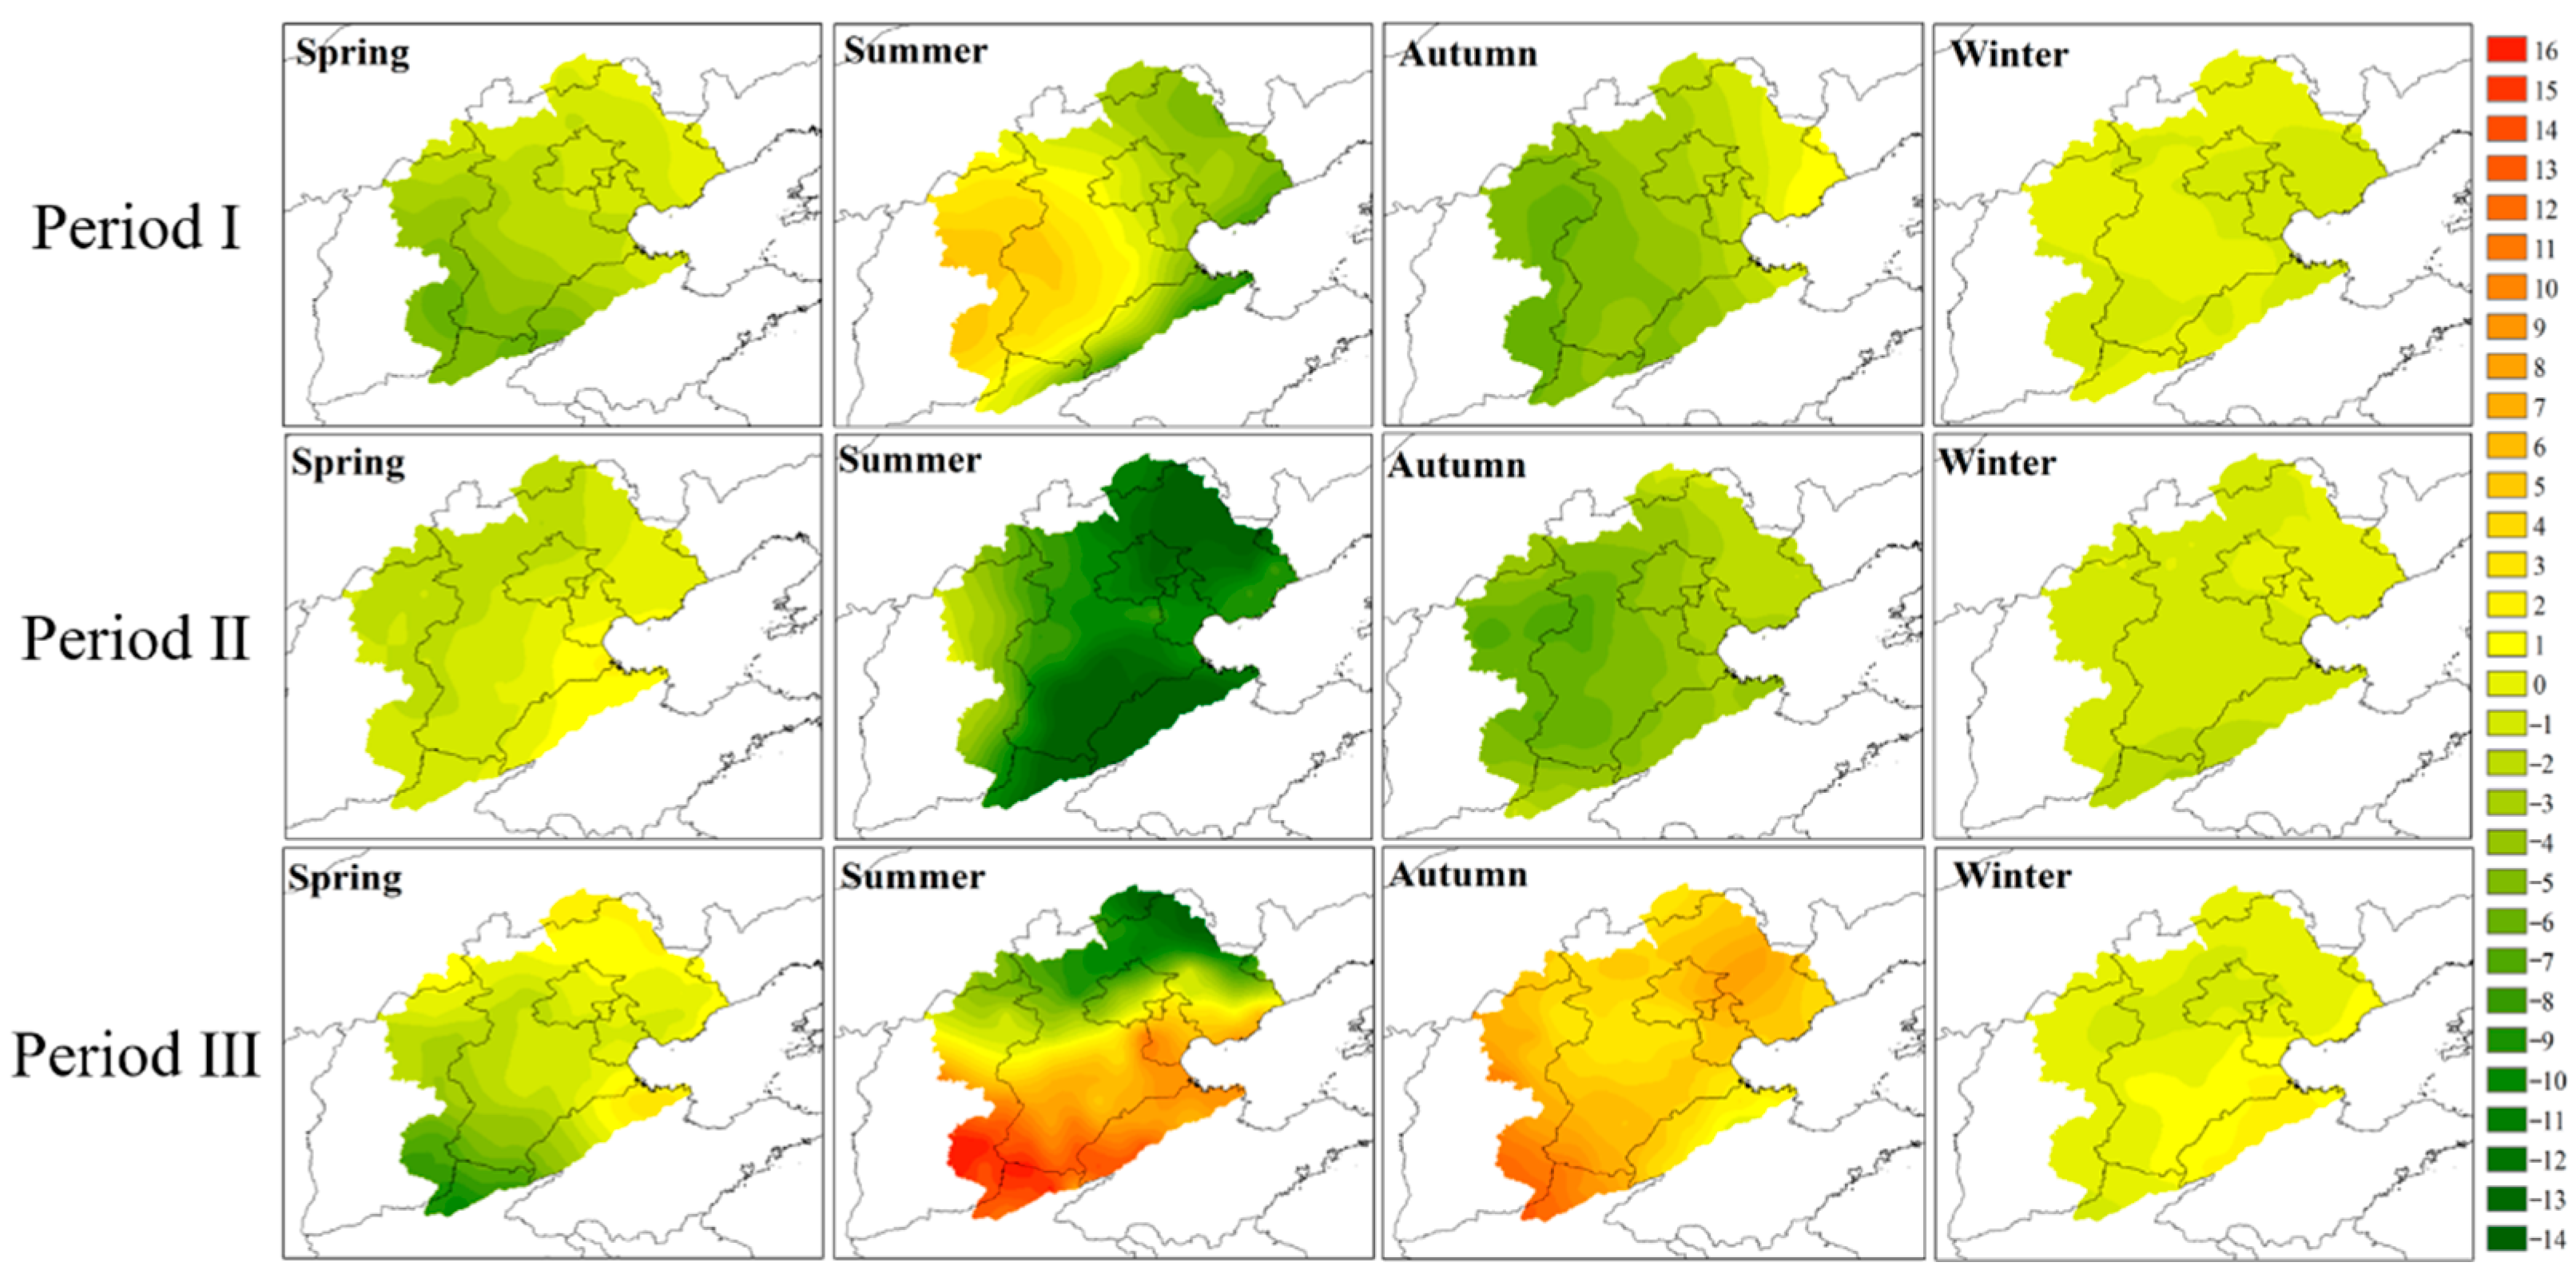
The change of seasonal precipitation shows that the average precipitation in spring and autumn increases slowly with time, while the average precipitation in summer increases first and then decreases. The differences in precipitation between the two summer periods are 19 mm and 33 mm, respectively, and there is no significant change in precipitation in winter. In addition, there were significant differences in the seasonal precipitation trend rate characteristics for each period. After calculating the seasonal precipitation deviations for each grid point and passing the 95% significance test, Figure 3 can be obtained.
The average precipitation tendency in the first period is −6.287 mm/10a, including −2.56 mm/10a in spring, −0.24 mm/10a in summer, −3.50 mm/10a in autumn, and −0.50 mm/10a in winter. From the percentage of precipitation, the average proportion of precipitation in four seasons is 12.25% in spring, 67.96% in summer, 17.53% in autumn, and 2.26% in winter, which is close to the average level of one hundred years. Among the four-season precipitation tendencies in the basin at this time, the summer variation tendency rate fluctuates the most, showing an overall increase in precipitation in the west and a slight decrease in precipitation in the east, while the spring and autumn precipitation tendency rates are basically similar, showing an increase in precipitation in the northeast and a decrease in precipitation in the southwest.
Compared with the previous period, the second period of the Haihe basin was relatively abundant in precipitation, but since the abundant precipitation was concentrated in the early period, after 1960, the annual precipitation decreased significantly comparing with the period of 1946–1960, so the overall precipitation tendency rate of this period was −11.51 mm/10a, including −0.86 mm/10a in spring, −10.79 mm/10a in summer, and −10.79 mm/10a in autumn. The seasonal precipitation tendency rate in this period has obvious differences, among which the summer precipitation tendency rate changes the most, 10.54 mm/10a, and the whole basin shows a significant decline, while the remaining three seasons do not change significantly. From the viewpoint of precipitation proportion, the precipitation proportion of four seasons in this period is 13% in spring, 67.18% in summer, 17.46% in autumn, and 2.36% in winter, respectively. Although the seasonal precipitation ratio did not change much in this period, the tendency rate of each season had obvious differences, among which the decreasing trend of precipitation in summer was the greatest, which also made the precipitation in this period show a gradually decreasing trend.
In the third period, the average precipitation tendency rate in the basin is 11.82 mm/10a, among which, the average precipitation tendency rate is −1.59 mm/10a in spring, 2.60 mm/10a in summer, 5.46 mm/10a in autumn, and 0.20 mm/10a in winter, which can be seen that the precipitation tendency in summer and autumn has obvious changes compared with the last two periods, and the regionalization of precipitation has become more obvious. From the perspective of seasonal precipitation tendency change in three periods, the climate pattern of the Haihe River basin has changed due to the influence of climate change and human activities, together with the emission of greenhouse gases and the change of the underlying surface, the stability of seasonal precipitation has changed. Especially in summer and autumn, the change trend is more intense, and the probability of seasonal disasters in the Haihe River basin with precipitation in summer and autumn as the main source of precipitation is significantly higher than before.
  • Changes in precipitation concentration index
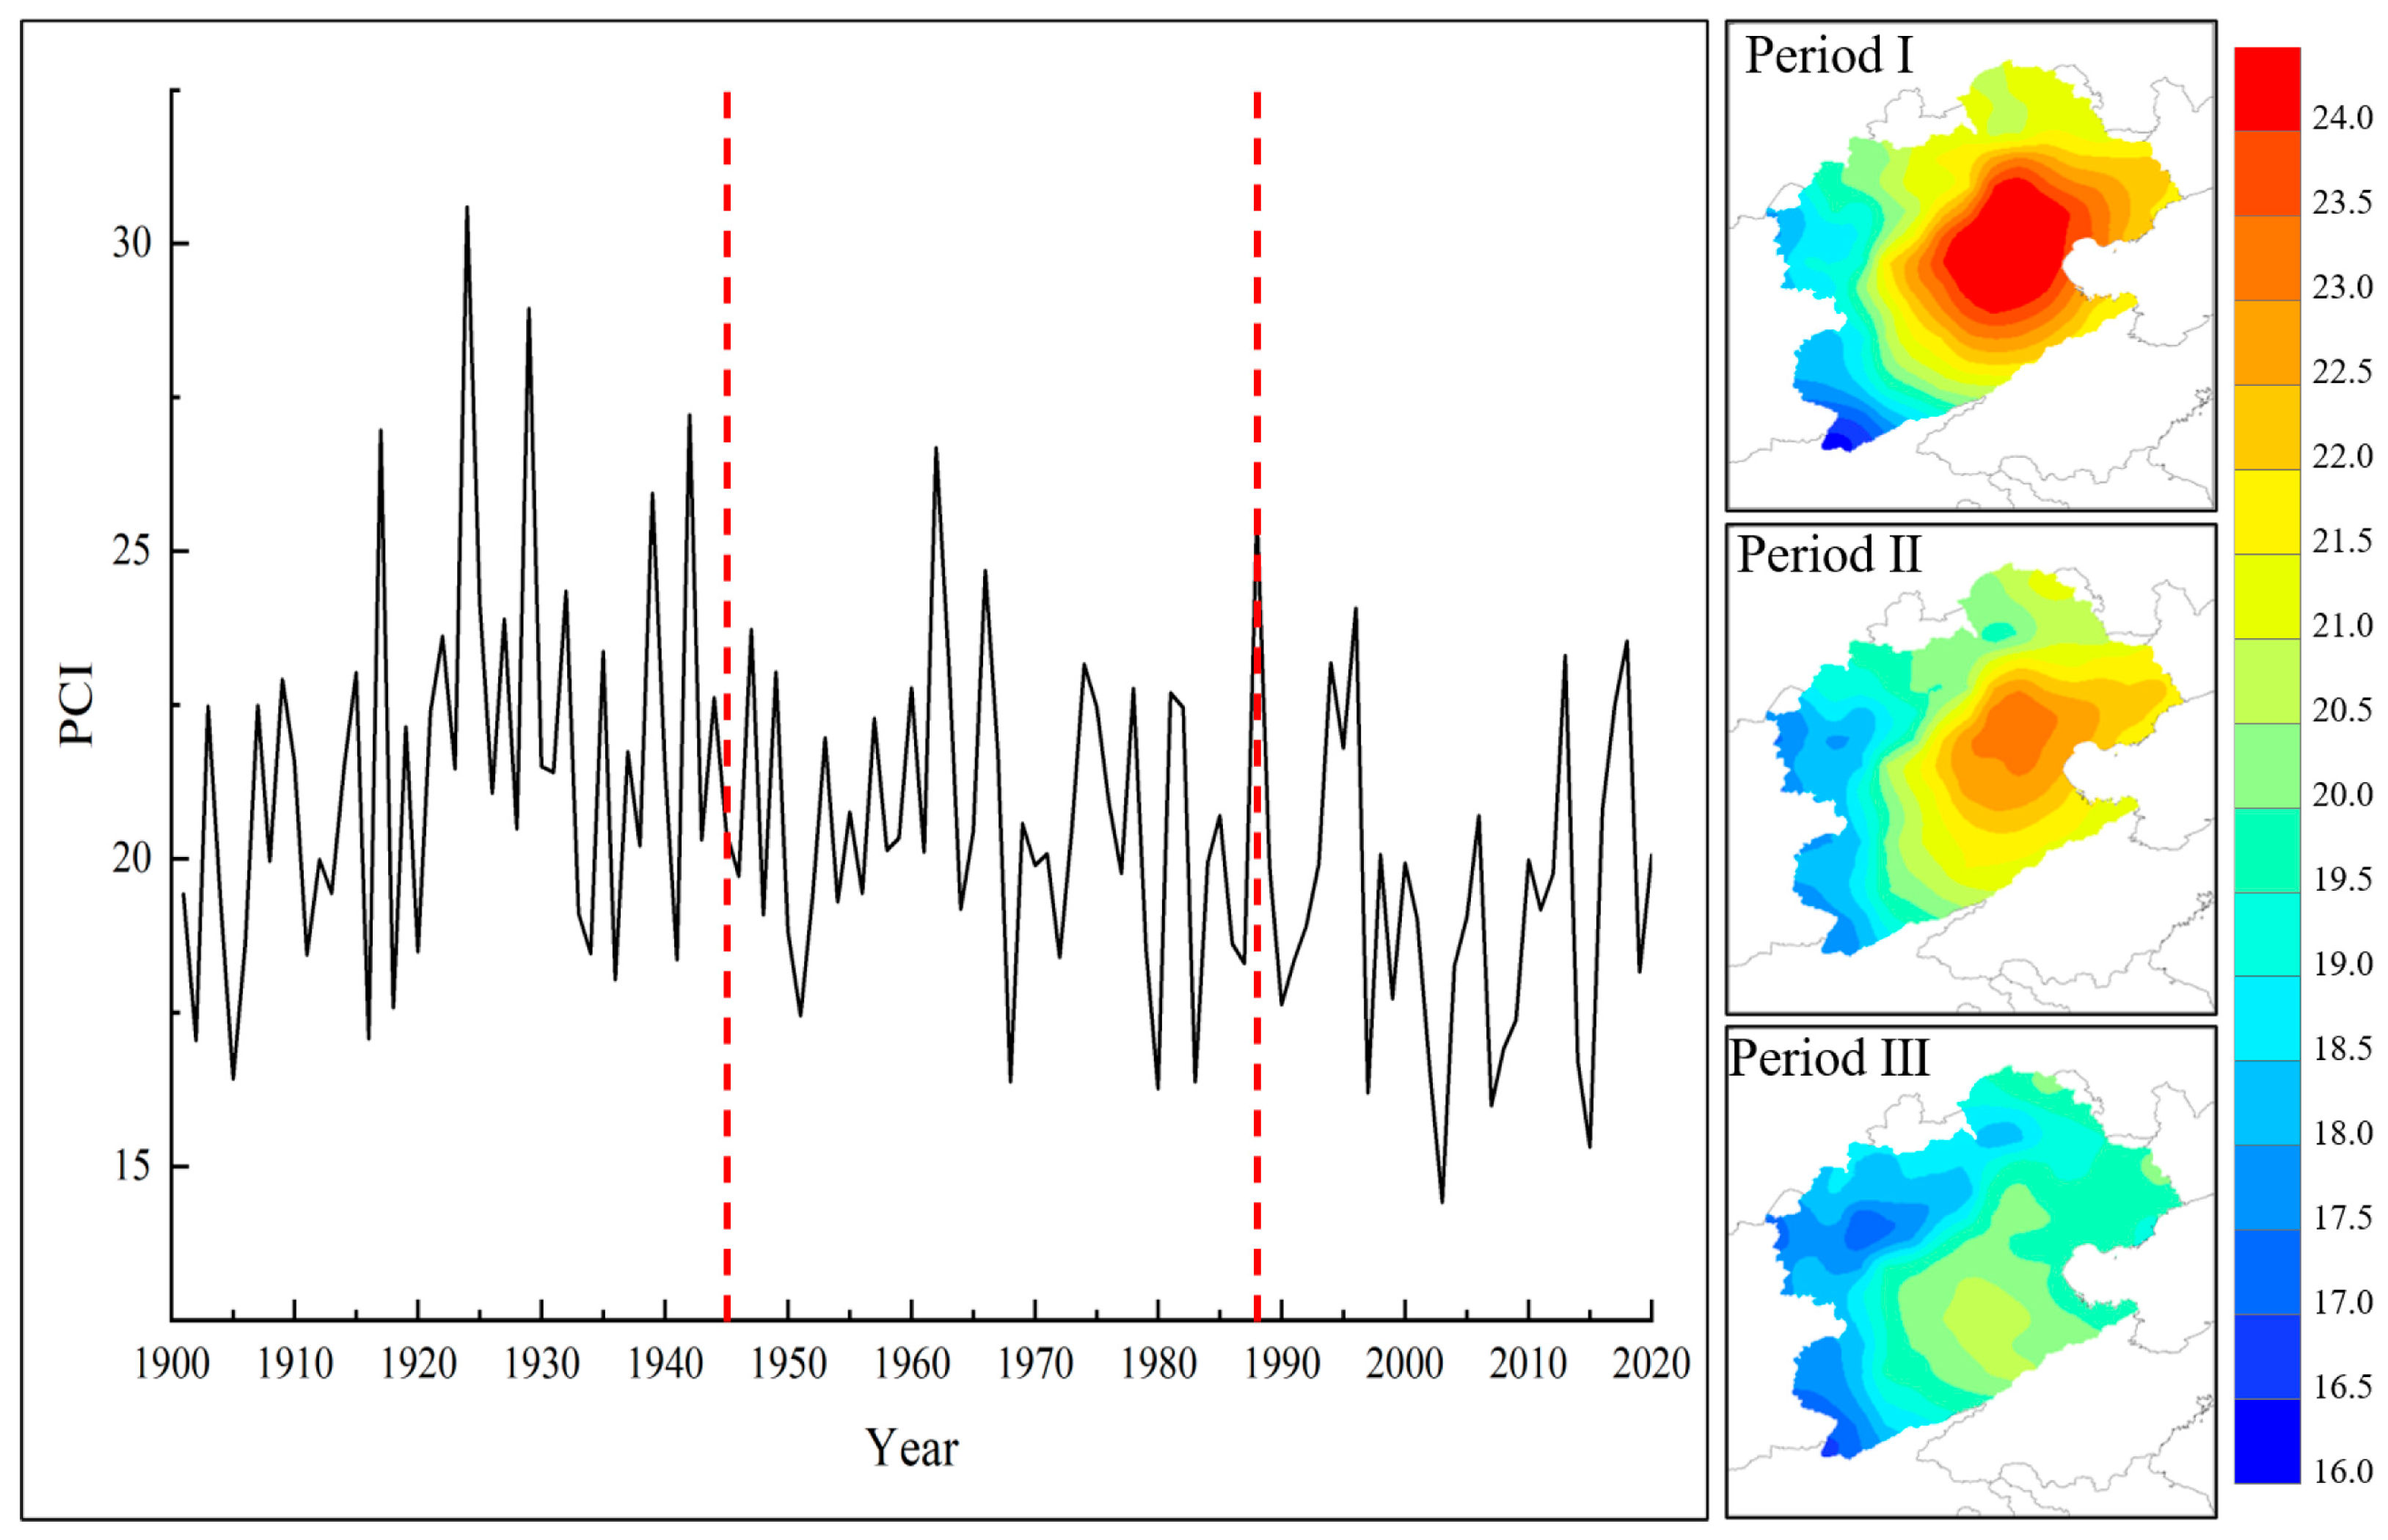
The change of the PCI reflects the distribution change of precipitation in each month of the year and the change of the PCI in the Haihe River basin in the past 120 years is shown in the Figure 4. The fold line diagram on the left side reflects the time variation regularity of the average PCI of the watershed. In terms of the spatial and temporal variation of the PCI, in the first stage, the number of years with PCI values greater than 20 is 25 years, accounting for 55.6% of all the years in the first period. This shows that the precipitation in the first stage is more concentrated in the year and the seasonal precipitation is more obvious. Three sub-maps on the right side reflect the spatial changes of PCI at different stages. It can be seen that PCI is usually more than 20 in the east and middle of the basin. Precipitation distribution is unusually concentrated and monthly changes are large during the year. However, the seasonality of precipitation in the west and south of the basin is not obvious.
In the second period, climate change began to intensify [35,36], making the interannual precipitation variability in this period characterized by strong fluctuations. Between 1960 and 1970, the precipitation process in the basin changed drastically, and the precipitation variability in the four seasons was mostly summer precipitation variability, which led to an increase in the number of years with the basin precipitation PCI greater than 20 in this period compared with the previous period, and the number of years with the basin precipitation PCI greater than 20 in this period is 29, accounting for 67.44%, but from the distribution of mean and extreme values, the concentration of precipitation in this period has begun to decline, which is also reflected in the spatial distribution of PCI. Relative to the first period, the distribution characteristics of PCI in the east–central part of the basin changed significantly, but the western part of the basin and the northern part of the basin maintained the distribution characteristics of the previous period. This indicates that in the second period of climate change, the intra-annual precipitation distribution characteristics of the regions strongly influenced by the climate are changing, which is reflected in the decrease of the precipitation concentration index and the gradual moderating of the intra-annual precipitation distribution.
After entering the third period, due to the rapid economic development, the Haihe River basin entered a period of strong human activities [37,38], and the precipitation in the basin showed new characteristics during this period under the dual influence of climate change and human activities. It can be seen that the climate state of the watershed begins to change due to the increasing influence factors of human activities, especially the continuous development of coastal ports, and the impact of this period is more extensive than that of the single climate change period.
  • Changes in standardized precipitation index
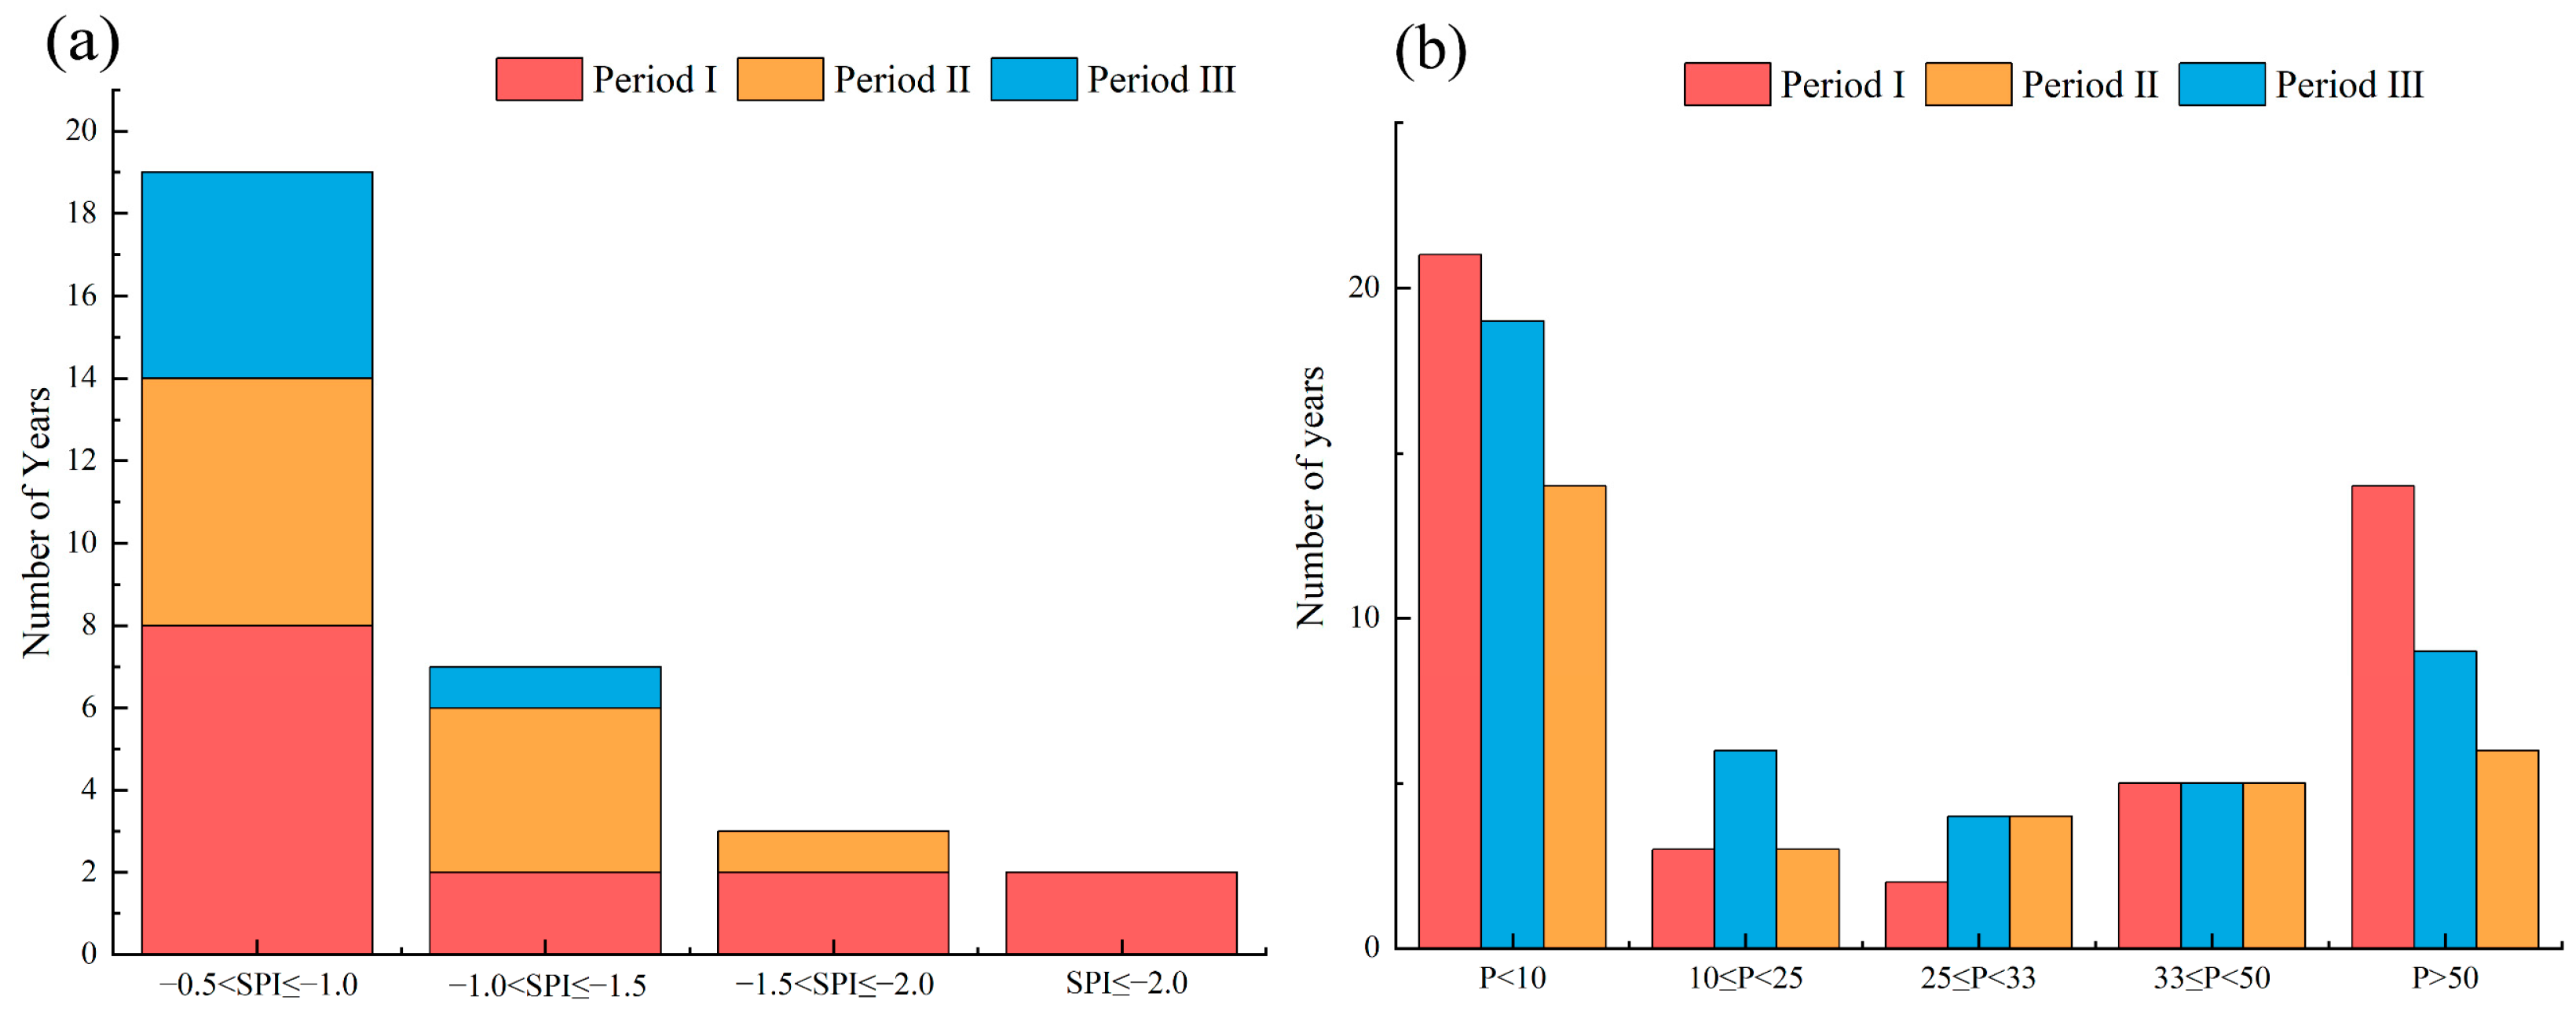
The SPI index can reflect the change of drought degree in the watershed, and combined with the drought frequency F (Figure 5a) and drought area ratio P (Figure 5b), the change of the drought process in the three periods can be more clearly understood. The results of the drought degree in different stages (Figure 5a) and the drought area distribution (Figure 5b) show that the frequency of drought in the first stage of the Haihe River basin is 31%, including 8 years of mild drought, 2 years of severe drought, and 2 years of extreme drought, and the first stage is the most severe drought among the three stages. After entering the second stage, due to the high total precipitation in this stage, the phenomenon of large-scale drought decreases, and there are no severe drought years or extreme drought years. After entering the third stage, the number of drought years increased due to the decrease in precipitation compared with the previous stage, but the overall change was not significant, which indicates that the precipitation in this stage increased compared with the first stage and the overall drought situation in the basin was alleviated.
The spatial distribution of drought frequency F (Figure 6) reflects the migration process of drought areas in the basin. In the first time period, due to the more concentrated distribution of precipitation, the probability of drought is higher in the central and northeastern regions where the total precipitation is small, and its spatial variation is consistent with the distribution pattern of precipitation contours. The mean value of SPI in the second period is 0.12, and the drought frequency F is 23%, including 6 years of mild drought, and 4 years of moderate drought. The number of drought years in the whole basin decreased significantly, and the overall drought level in the basin decreased, but the regional drought events started to increase, which was better reflected in the spatial drought frequency distribution. The high incidence of drought events in this period was mainly concentrated in the eastern and northern areas of the basin, and the impact range and impact area were significantly smaller than those in the previous period. The mean value of SPI in the third period is 0.14, maintaining the characteristics of the change in the previous period, and the drought frequency F is 31%, which is the same as the first period, but in which the number of years of mild drought is reduced to 5, moderate drought to 1, and severe drought to 1. The number of years of drought in the whole basin is reduced from 14 to 6, and the overall drought level has changed significantly, but is influenced by the increase of human activities. The distribution of regional drought shows different characteristics from the previous two impact periods, and the center of gravity of drought shifts from the original northeast to the west and south of the basin, and although its overall probability decreases more significantly, its impact area far exceeds that of the previous two periods.
  • Changes in extreme precipitation probability
The Pearson type III probability distribution was used to calculate the 1% and 2% extreme precipitation probability distributions for each of the three periods, which can reflect the migration of the precipitation center of gravity and the change of disaster-prone areas in the basin, and the results are shown in Figure 7. It can be seen that, regardless of the 1% and 2% probability, the extreme precipitation probability distribution in the second period accounts for the largest proportion, and the high probability interval of extreme precipitation gradually moves from the southeastern part of the basin to the central and eastern coastal areas of the basin in terms of the change law of spatial distribution, which is consistent with the change law of precipitation tendency rate. Although the first period and the third period have the same periodic characteristics, there is a significant difference in the occurrence probability of the two extreme precipitations, where the extreme value of the 1% extreme precipitation probability changes from 1.74% to 5.86%, and the extreme value of the 2% extreme precipitation probability changes from 2.50% to 9.20%. From the changes in precipitation tendency rate extreme precipitation probability distribution, the precipitation in the Haihe River basin after 1990 showed an increasing trend, instability, and an increasing probability of extreme precipitation. It can be seen that under the environment of climate change, the characteristics of extreme precipitation in Haihe River Basin have changed gradually, the influence range of extreme precipitation events is enlarged, and the regularity of precipitation is gradually changing. The precipitation regularity summarized for a region in the past may no longer be applicable after entering a new climate state.

4. Discussion

According to the above results, the precipitation characteristics of Haihe River basin in the past 120 years have gradually become clear. In the precipitation process of the past 120 years, the precipitation in the basin has shown the characteristics of changes in different stages, and the distribution of drought events and extreme precipitation has also shown periodic changes. In addition to the analysis and summary of the precipitation laws and characteristics of the basin in the past, the significance of this paper is also to speculate on the future precipitation trend. From the perspective of the precipitation change law, due to the north–south difference in the summer precipitation tendency rate of the Haihe River basin in the future, the areas prone to flood disasters may change towards the central south region and the coastal region, while the drought in the northwest may expand towards the northeast of the basin. However, there are still some uncertainties in the arid regions and extreme precipitation regions analyzed only by precipitation. In fact, the research on disasters should be combined with the disaster situation in different periods of the basin to obtain a more accurate judgment. This paper relies on precipitation as a bridge for disaster analysis, which is more meaningful to understand the probability of disasters in different periods and assist in judging the possible time nodes of disasters, so as to provide ideas for the summary and analysis of different types of disasters in the future and lay the corresponding research foundation.

5. Conclusions

This study uses the precipitation dataset of CRU and analyzes the spatial and temporal patterns of precipitation variation over 120 years in the Haihe River Basin, China, while verifying its applicability. Compared with previous studies, this study systematically summarizes and investigates the spatial and temporal patterns of precipitation changes in the Haihe River basin over the past 100 years, and analyzes the overall precipitation patterns in the basin, the trends of precipitation changes in the four seasons, the intra-annual distribution changes of precipitation in the previous period, and the spatial and temporal evolution of extreme precipitation and drought areas. The results of the study can be used to study and apply the corresponding relationships between precipitation and runoff in the Haihe River basin under the influence of climate change and the future precipitation distribution patterns in the Haihe River basin. Since 1901, the overall trend of precipitation in the Haihe River basin has been characterized by a slow increase, and the interannual precipitation sequence has gradually changed from gentle to drastic with the influence of climate change and human activities. In terms of spatial distribution, precipitation in the Haihe River basin shows a trend of gradual decrease from the southeast to the northwest, and its distribution characteristics are consistent with those of the East Asian monsoon region. In terms of seasonal precipitation ratio, the precipitation in the Haihe River basin mainly relies on summer precipitation, accounting for 66.51%. From the characteristics of the annual precipitation series, the precipitation change period is about 40a. From the results of the abrupt change test, there are two mutation points in the precipitation time series of the basin, which are located around 1945 and 1988.
By dividing the precipitation sequence of the Haihe River basin into three stages with the help of the results of mutation point detection and the temporal changes of the Pearson’s Type III index and the spatial distribution of drought frequency, we studied the changes of extreme precipitation distribution and drought areas in the Haihe River basin and found out the change patterns of drought and flood areas. In the past hundred years, the extreme precipitation impact area in the Haihe River basin has been gradually expanding, while the frequency of droughts has been gradually decreasing, and the drought-prone areas have been gradually shifting from the northeast to the west and south of the basin. In the future, the extreme precipitation areas may expand to the south-central and eastern coastal areas of the basin due to the change of the summer precipitation tendency, while the drought areas may spread to the northern and northeastern areas of the basin.
Over the past 120 years, the precipitation pattern in the Haihe River basin has changed significantly. Under the combined influence of climate change and human activities, the seasonal precipitation tendency rate is changing, the concentration of precipitation is decreasing, and the extent and probability of regional droughts are changing significantly. Future research can analyze and summarize the effects of different components on precipitation by combining elements such as human activity patterns and can also combine methods such as deep learning to predict future flood disasters and regional drought phenomena.

Author Contributions

Conceptualization, X.C. and Y.L.; methodology, Y.L.; software, X.C. and Z.S.; validation, J.Z. and Y.L.; formal analysis, T.G.; investigation, J.J.; resources, Y.L.; data curation, X.C. and Y.L.; writing—original draft preparation, X.C.; writing—review and editing, Y.L.; visualization, C.L. and Z.B.; supervision, G.W.; project administration, Y.L.; funding acquisition, Y.L. All authors have read and agreed to the published version of the manuscript.

Funding

This research was funded by the National Natural Science Foundation of China (52079079), the National Key Research and Development Program of China (2018YFC1508104), the Natural Science Foundation of Jiangsu Province (BK20191129), and the Natural Science Foundation of Zhejiang Province (2021C03017).

Institutional Review Board Statement

Not applicable.

Informed Consent Statement

Not applicable.

Data Availability Statement

The data presented in this study are available on request from the corresponding author.

Acknowledgments

The author also knowledge the University of East Anglia for supplying the chimatic research unit data.

Conflicts of Interest

The authors declare no conflict of interest.

References

  1. Sun, H.; Su, F. Precipitation correction and reconstruction for streamflow simulation based on 262 rain gauges in the upper brahmaputra of southern Tibetan plateau. J. Hydrol. 2020, 590, 125484. [Google Scholar] [CrossRef]
  2. Wang, X.J.; Zhang, J.Y.; Shahid, S.; Guan, E.H.; He, R.M. Adaptation to climate change impacts on water demand. Mitig. Adapt. Strateg. Glob. Chang. 2016, 21, 81–99. [Google Scholar] [CrossRef]
  3. Lu, C.; Lott, F.C.; Sun, Y.; Stott, P.A.; Christidis, N. Detectable anthropogenic influence on changes in summer precipitation in China. J. Clim. 2020, 33, 5357–5369. [Google Scholar] [CrossRef] [Green Version]
  4. Dimri, A.P.; Allen, S.; Huggel, C.; Mal, S.; Pandey, A. Climate change, cryosphere and impacts in the Indian Himalayan region. Curr. Sci. 2021, 120, 775–790. [Google Scholar] [CrossRef]
  5. Uma, L.; Kamol, P.N.S.; Nigel, J. Climate change and dengue risk in central region of Thailand. Int. J. Environ. Health Res. 2019, 30, 327–333. [Google Scholar] [CrossRef]
  6. Boulange, J.; Hanasaki, N.; Dai, Y.; Pokhrel, Y. Role of dams in reducing global flood exposure under climate change. Nat. Commun. 2021, 12, 417. [Google Scholar] [CrossRef] [PubMed]
  7. Voropay, N.; Ryazanova, A.; Dyukarev, E. High-resolution bias-corrected precipitation data over South Siberia, Russia. Atmos. Res. 2021, 254, 107440. [Google Scholar] [CrossRef]
  8. Sidu, M.R.; Csaba, H.; Cheveresan, M.; Andric, I.; Stoica, F. Assessing hydrological impact of forested area change: A remote sensing case study. Atmosphere 2021, 12, 817. [Google Scholar] [CrossRef]
  9. Mutti, P.R.; Dubreuil, V.; Bezerra, B.G.; Arvor, D.; de Oliveira, C.P.; Santos e Silva, C.M. Assessment of Gridded CRU TS Data for Long-Term Climatic Water Balance Monitoring over the São Francisco Watershed, Brazil. Atmosphere 2020, 11, 1207. [Google Scholar] [CrossRef]
  10. Kalisa, W.; Zhang, J.; Igbawua, T.; Ujoh, F.; Ebohon, O.J.; Namugize, J.N.; Yao, F. Spatio-temporal analysis of drought and return periods over the east african region using standardized precipitation index from 1920 to 2016. Agric. Water Manag. 2020, 237, 106195. [Google Scholar] [CrossRef]
  11. Morice, C.P.; Kennedy, J.J.; Rayner, N.A.; Winn, J.P.; Simpson, I.R. An Updated Assessment of Near-Surface Temperature Change From 1850: The HadCRUT5 Data Set. J. Geophys. Res. Atmos. 2020, 126, e2019JD032361. [Google Scholar] [CrossRef]
  12. Richard, G.; Jonathan, H. Contiguous US summer maximum temperature and heat stress trends in CRU and NOAA Climate Division data plus comparisons to reanalyses. Sci. Rep. 2018, 8, 11146. [Google Scholar] [CrossRef]
  13. Li, Z.Y.; Zhang, W.J.; Xu, H.M. Possible impact of spatial and temporal non-uniformity in land surface temperature data on trend estimation. J. Meteorol. Res. 2018, 32, 819–828. [Google Scholar] [CrossRef]
  14. Bai, X.; Shen, W.; Wu, X.; Wang, P. Applicability of long-term satellite-based precipitation products for drought indices considering global warming. J. Environ. Manag. 2020, 255, 109846. [Google Scholar] [CrossRef]
  15. Chen, Y.H.; Xu, M.H.; Wang, Z.L.; Gao, P.; Lai, C.G. Applicability of two satellite-based precipitation products for assessing rainfall erosivity in China. Sci. Total Environ. 2020, 757, 143975. [Google Scholar] [CrossRef] [PubMed]
  16. Wang, X.; Li, B.; Chen, Y.; Guo, H.; Lian, L. Remote sensing applicability evaluation of multisource satellite precipitation data for hydrological research in arid mountainous areas. Remote Sens. 2020, 12, 2886. [Google Scholar] [CrossRef]
  17. Chen, X.; Huang, G. Applicability and hydrologic substitutability of tmpa satellite precipitation product in the feilaixia catchment, China. Water 2020, 12, 1803. [Google Scholar] [CrossRef]
  18. Fang, J.; Yang, W.; Luan, Y.; Du, J.; Lin, A.; Zhao, L. Evaluation of the TRMM 3b42 and GPM IMERG products for extreme precipitation analysis over China. Atmos. Res. 2019, 223, 24–38. [Google Scholar] [CrossRef]
  19. Zhou, C.; Gao, W.; Hu, J.; Du, L.; Du, L. Capability of imerg v6 early, late, and final precipitation products for monitoring extreme precipitation events. Remote Sens. 2021, 13, 689. [Google Scholar] [CrossRef]
  20. Chen, F.; Yuan, H.; Sun, R.; Yang, C. Streamflow simulations using error correction ensembles of satellite rainfall products over the Huaihe river basin. J. Hydrol. 2020, 589, 125179. [Google Scholar] [CrossRef]
  21. Zou, W.Y.; Yin, S.Q.; Wang, W.T. Spatial interpolation of the extreme hourly precipitation at different return levels in the haihe river basin. J. Hydrol. 2021, 598, 126273. [Google Scholar] [CrossRef]
  22. Wang, L.; Zhang, Y.; Yao, Y.; Xiao, Z.; Wang, J. Gbrt-based estimation of terrestrial latent heat flux in the haihe river basin from satellite and reanalysis datasets. Remote Sens. 2021, 13, 1054. [Google Scholar] [CrossRef]
  23. Wu, X.; Li, S.; Liu, B.; Xu, D. Spatial and temporal variation characteristics of snowfall in the haihe river basin from 1960 to 2016. Water 2021, 13, 1798. [Google Scholar] [CrossRef]
  24. He, L.Y.; Cheng, S.J.; Ma, N.; Guo, J. Intraseasonal evolution of the key areas of precipitation in the Haihe River Basin and quantitative analysis of its associated atmospheric circulation during summer. Acta Geogr. Sin. 2020, 75, 12. (In Chinese) [Google Scholar]
  25. Shao, Y.; Liu, L.; Liu, J.; Wu, J. Frequency analysis and its spatiotemporal characteristics of precipitation extremes in the Haihe River Basin during 1951–2010. Trans. Atmos. Sci. 2020, 43, 381–391. (In Chinese) [Google Scholar]
  26. Ren, G.; Wang, T.; Guo, J.; Hao, Z.; Zhan, Y. Characteristics of precipitation variations in Haihe River Basin in modern times. Adv. Sci. Technol. Water Resour. 2015, 35, 102–111. (In Chinese) [Google Scholar]
  27. He, R.M.; Zhang, J.Y.; Bao, Z.X.; Yan, X.L.; Wang, G.Q.; Liu, C.S. Response of runoff to climate change in the Haihe River basin. Adv. Water Sci. 2015, 26, 1–9. [Google Scholar] [CrossRef]
  28. Hamed, K.H.; Ramachandra Rao, A. A modified Mann-Kendall trend test for autocorrelated data. J. Hydrol. 1998, 204, 182–196. [Google Scholar] [CrossRef]
  29. Tian, J.; Fang, C.; Qiu, J.; Wang, J. Analysis of Ozone Pollution Characteristics and Influencing Factors in Northeast Economic Cooperation Region, China. Atmosphere 2021, 12, 843. [Google Scholar] [CrossRef]
  30. Singh, V.P.; Singh, K. Derivation of the Pearson type (PT) III distribution by using the principle of maximum entropy (POME). J. Hydrol. 1987, 80, 197–214. [Google Scholar] [CrossRef]
  31. Oliver, J.E. Monthly precipitation distribution: A comparative index. Prof. Geogr. 1980, 32, 300–309. [Google Scholar] [CrossRef]
  32. Mohammad, A.A.Z.; Bellie, S.; Ashish, S. Droughts in a warming climate: A global assessment of Standardized precipitation index (SPI) and Reconnaissance drought index (RDI). J. Hydrol. 2015, 526, 183–195. [Google Scholar] [CrossRef]
  33. Wang, S.; Gong, D.; Ye, J.; Chen, Z. Seasonal Precipitation Series of Eastern China Since 1880 and the Variability. Acta Geogr. Sin. 2000, 55, 281–293. [Google Scholar] [CrossRef]
  34. Liu, Y.; Hua, Y.; Zhou, H.; Ye, L.; Wang, G.; Jin, J.; Bao, Z. Precipitation variation and trend projection in the eastern monsoon region of China since 1470. Adv. Water Sci. 2022, 33, 1–14. [Google Scholar] [CrossRef]
  35. Han, Y.; Liu, B.; Xu, D.; Xu, Z. Temporal and Spatial Variation Characteristics of Precipitation in the Haihe River Basin under the Influence of Climate Change. Water 2021, 13, 1664. [Google Scholar] [CrossRef]
  36. Du, H.; Xia, J.; Zeng, S.; She, D.; Liu, J. Variations and statistical probability characteristic analysis of extreme precipitation events under climate change in Haihe River Basin, China. Hydrol. Processes 2014, 28, 913–925. [Google Scholar] [CrossRef]
  37. Han, L.; Men, B. Evaluation of Water Resources Carrying Capacity in Haihe River Basin Based on Combinatorial Game Theory. Water Resour. Power 2021, 39, 61–64. (In Chinese) [Google Scholar]
  38. Bao, Z.; Zhang, J.; Wang, G.; Fu, G.; He, R.; Yan, X.; Jin, J.; Liu, Y.; Zhang, A. Attribution for decreasing streamflow of the Haihe River basin, northern China: Climate variability or human activities? J. Hydrol. 2012, 460–461, 117–129. [Google Scholar] [CrossRef]
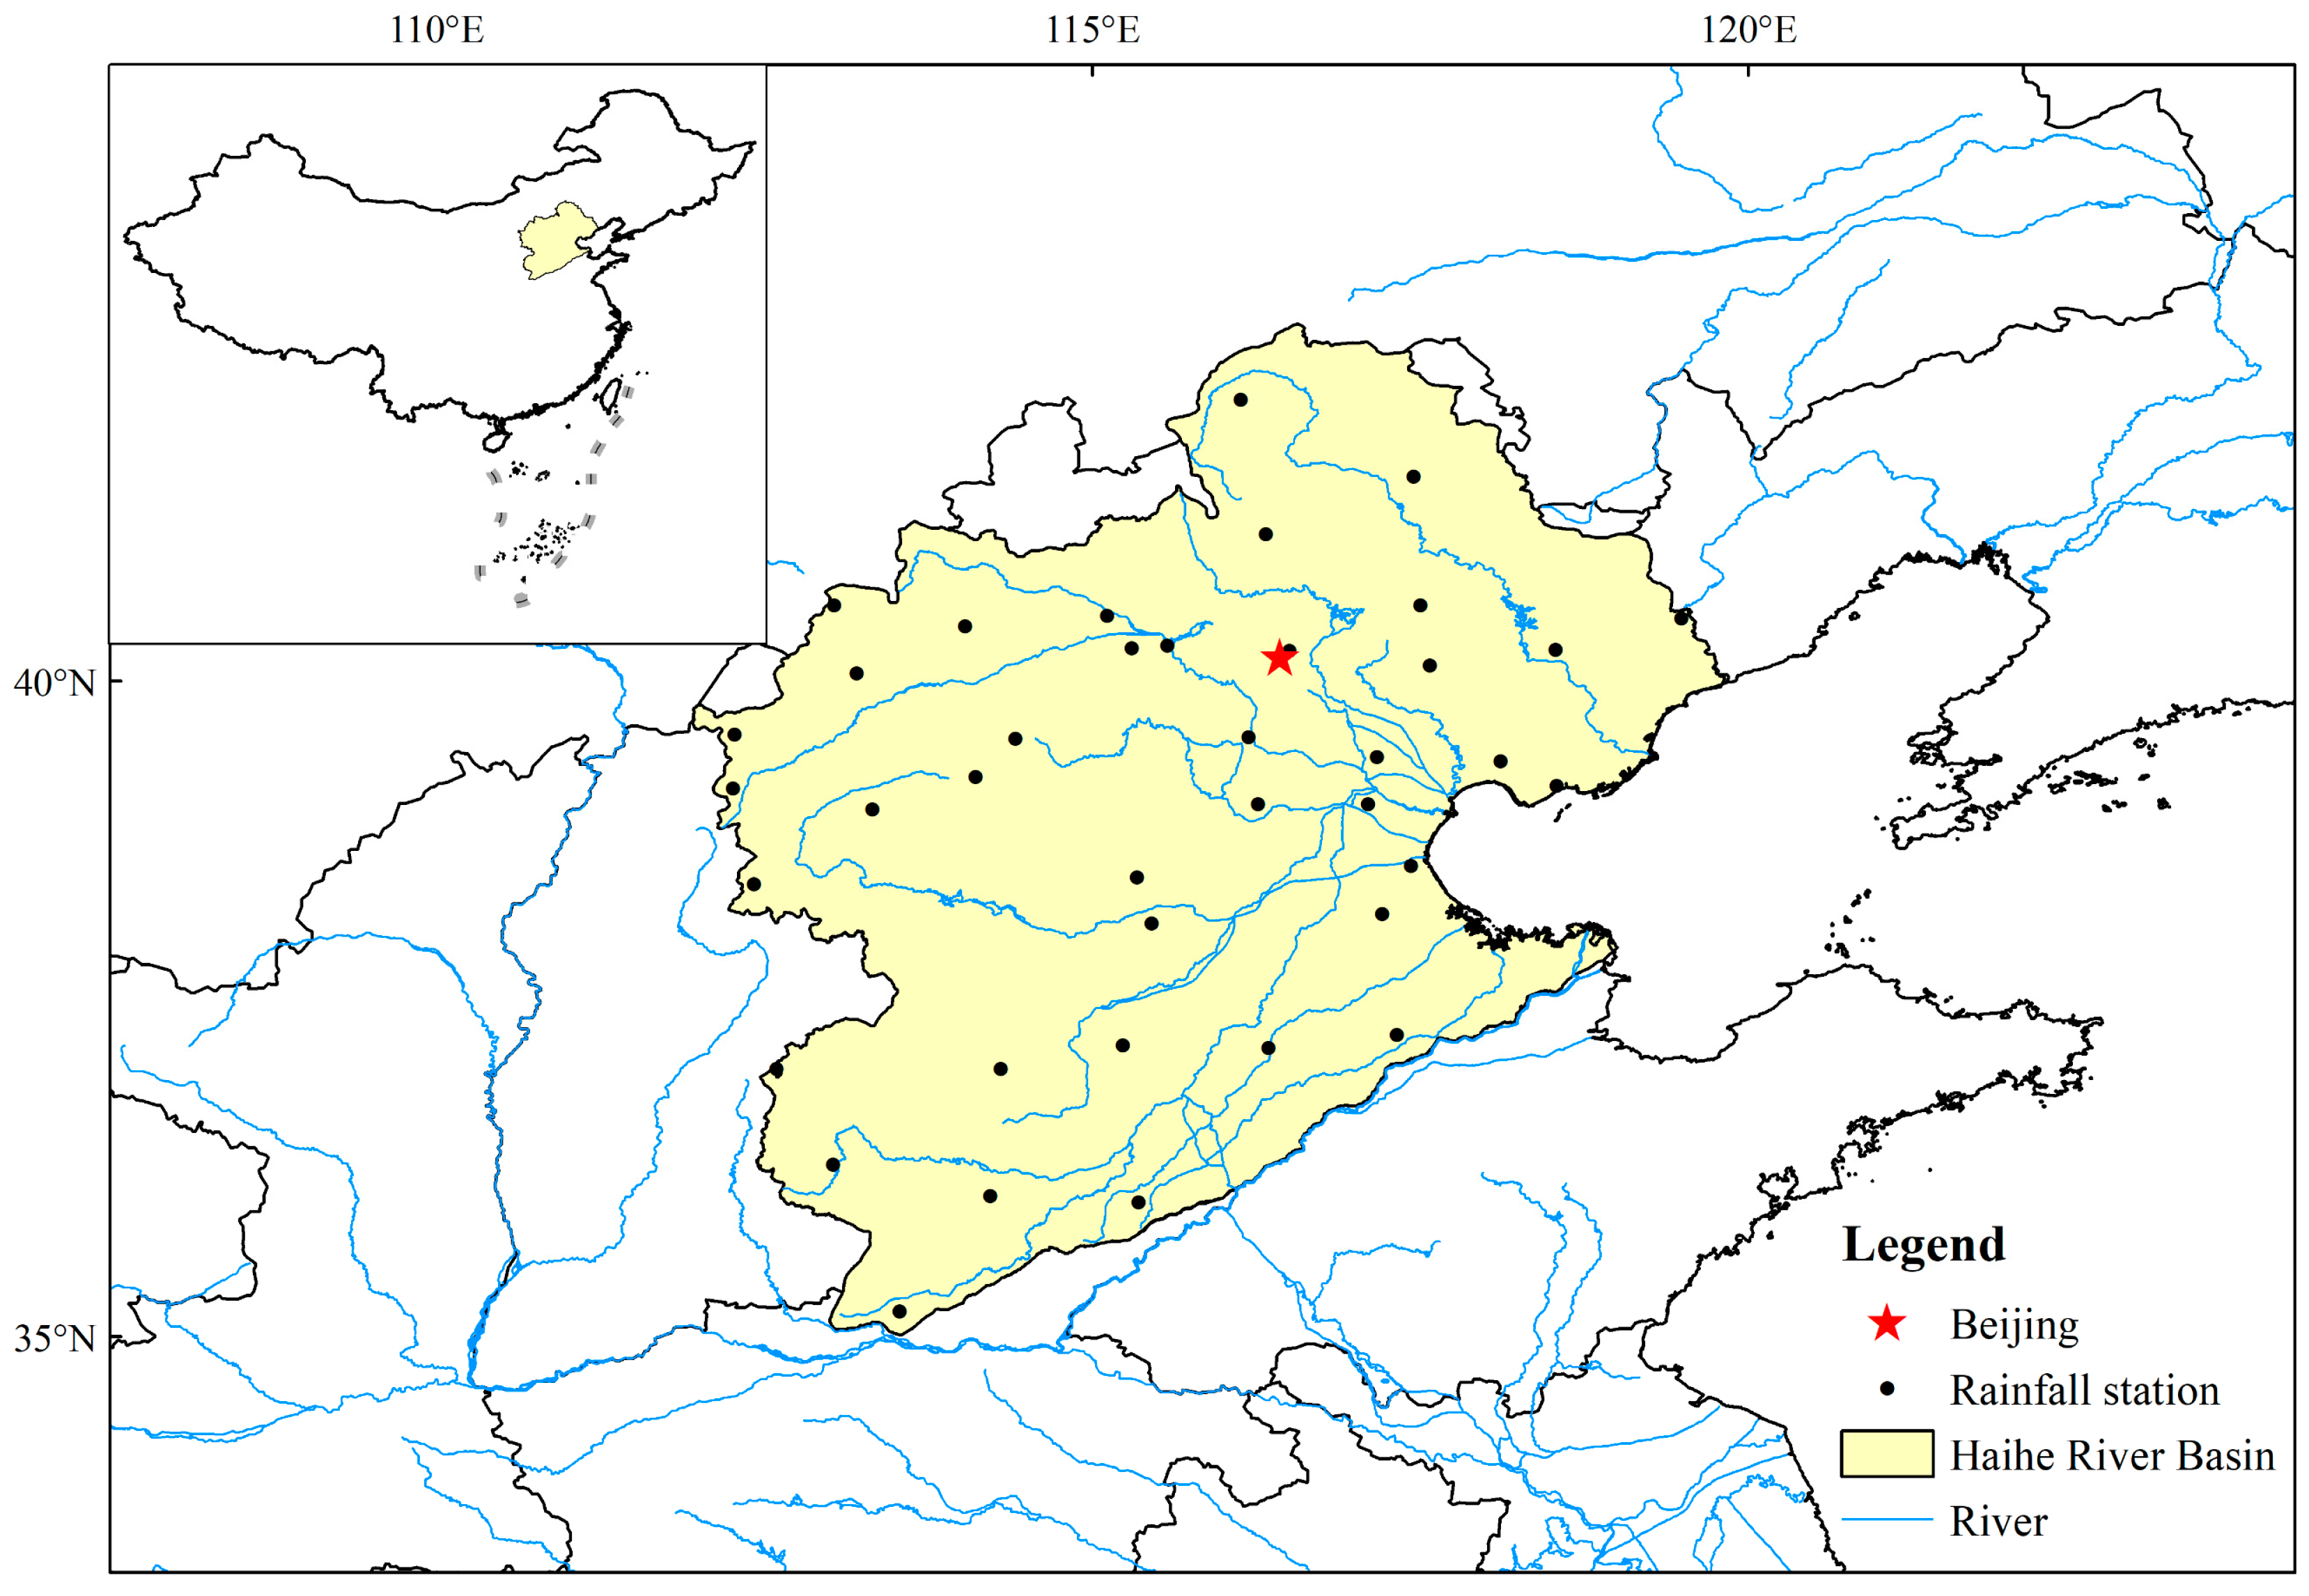
Figure 1. Geographic location of Haihe River Basin.
Atmosphere 13 01025 g001
Figure 2. Test results of precipitation inconsistency in Haihe River Basin. (a) The process of precipitation change in Haihe River Basin; (b) Morlet wavelet test results; (c) Mann–Kendall Mutation test results; and (d) Cumulative anomaly change results (10 years).
Atmosphere 13 01025 g002
Figure 3. Distribution of seasonal precipitation tendency rate in three periods (mm/10a).
Atmosphere 13 01025 g003
Figure 4. Spatial and temporal variation of PCI in the Haihe River Basin.
Atmosphere 13 01025 g004
Figure 5. The basin drought characteristics of three periods. (a) Changes in the distribution of drought species; and (b) Distribution of p-values in arid regions.
Atmosphere 13 01025 g005
Figure 6. Spatial variation map of drought range.
Atmosphere 13 01025 g006
Figure 7. Changes in the distribution of extreme precipitation in the basin.
Atmosphere 13 01025 g007
Table 1. Standardized precipitation index drought class classification criteria.
SPILevel
SPI ≤ −2.0Extremely Drought
−2.0 < SPI ≤ −1.5Severely Drought
−1.5 < SPI ≤ −1.0Moderately Drought
−1.0 < SPI ≤ −0.5Mild drought
−0.5 < SPINo Drought
Table 2. CRU data evaluation index results.
Reference ObjectRBIAS
(%)
RMSE
(mm/mon)
MAE
(mm/mon)
Area rainfall (based on ground station)0.9910.939.794.87
Dataset of gridded
daily precipitation in China
0.997.0010.153.26
Anyang Station0.8947.8431.9113.55
Baoding Station0.9033.2230.030.92
Beijing Station0.9231.5129.420.90
Datong Station0.9424.1912.687.54
Duolun Station0.9226.1815.380.92
Tianjin Station0.9327.8824.440.93
Wutaishan Station0.9338.9137.660.38
Weixian Station0.9136.3821.310.36
Yuanping Station0.9037.5322.500.37
Yushe Station0.8931.8325.340.31
Xingtai Station0.8139.9741.560.39
Xinxiang Station0.8240.4240.150.40
Fengning Station0.9231.1921.020.31
Weichang Station0.8935.0623.340.35
Zhangjiakou Station0.8937.7822.010.37
Huailai Station0.9139.2720.830.39
Miyun Station0.9139.9443.860.39
Chengde Station0.9030.5424.630.30
Zunhua Station0.9140.2753.610.40
Qinglong Station0.9238.2247.740.38
Langfang Station0.9036.1030.810.36
Tangshan Station0.9432.5732.090.32
Leting Station0.8935.8137.520.35
Raoyang Station0.8740.5334.890.40
Publisher’s Note: MDPI stays neutral with regard to jurisdictional claims in published maps and institutional affiliations.