Abstract
Under the background of intensifying global change, the frequent occurrence of agrometeorological disasters has an adverse impact on the social economy. Low-temperature weather in spring is one of the main agrometeorological disasters in Xinjiang. Studying the spatial and temporal characteristics of low temperatures in spring in Xinjiang is of great significance. However, research on the spatiotemporal variation of spring frost in arid areas is currently lacking, which limits our understanding of the occurrence and development mechanism of typical disastrous weather events in arid areas. Therefore, on the basis of the daily meteorological data of 40 meteorological stations in the Xinjiang Province of China from 1971 to 2020, we studied the spatiotemporal heterogeneity of spring frost in Xinjiang through trend analysis, the Mann–Kendall test, Kriging interpolation, and wavelet analysis. Results showed that the frequency of spring frost had the spatial trend from Northern Xinjiang to Southern Xinjiang. The occurrence frequency of spring frost in the entire and northern region of Xinjiang had an upward trend, whereas that in Southern Xinjiang showed a downward trend. Severe and moderate spring frost events mainly occurred in Xinjiang. The duration of spring frost had the characteristics of Northern Xinjiang to Southern Xinjiang. The spring frost in Northern Xinjiang mainly occurred in April, and that of Southern Xinjiang was in March. Obvious 15-, 10-, and 20-year oscillation cycles were observed in the occurrence frequency of spring frost in the entire, southern, and northern regions of Xinjiang, respectively. This study can provide a useful reference for the prediction and research corresponding to the occurrence mechanism of spring frost in arid areas.
1. Introduction
In the context of global warming, the characteristics of atmospheric circulation and frequency and intensity of extreme climate events have changed significantly [1,2], which not only makes extreme climate events more frequent [3], but increases the harmfulness and unpredictability of natural disasters and has a serious impact on regional environment and society [4]. Among all kinds of natural disasters, meteorological disasters have become one of the major disasters affecting agricultural production in China [5]. China is a large agricultural country, and the area of farmland affected by various meteorological disasters amounts to 3.4 × 10⁷ hm2 every year [6]. Spring frost (also known as late spring freeze [7], hereafter spring frost) is a cold-air induced meteorological disaster that occurs in late spring [8]. Although a warmer climate may trigger earlier spring phenology, which may bring potential benefits to agriculture during global warming, it could subject early-growing crops or plants to frost damage [9,10,11].
Currently, the research on spring frost in foreign countries mainly focuses on the resistance to spring frost and recovery ability of different plants. For instance, Leolini et al. [12] found that the frequency of frost events (Tmin < 0 °C) during the budding of grapes showed a wide variability across Europe, with a strong decrease in western regions (e.g., Spain and UK) and an increase in central Europe (e.g., Germany). The decrease in the frequency of frost events is particularly pronounced for very early and early varieties. Vitasse et al. [13] found that extreme weather events, such as severe droughts, heat waves, and late spring frosts, are rare but play a crucial role in shaping tree species distribution. Ma et al. [14] showed through their study that some species sensitive to phenological responses and many populations of a given species would experience more frost damage under future warming, even if the temperature increased in the future. Eccel et al. [15] plotted the number of frost occurrences and flowering dates by year to assess the risk of spring frost and confirmed that the risk of exposure to frost is currently lower than that in the past and is likely to remain constant or slightly lower in the future, especially given that physiological processes are expected to adapt to higher temperatures. In addition, the classification criteria and spatiotemporal distribution characteristics of spring frost have attracted wide attention. China has a vast land area and diverse climate types, and there are differences in classification criteria among different regions. Qiang et al. [16] believed that a daily average temperature of less than 11 °C for three consecutive days can be classified as a spring frost in southern Zhejiang. Lu et al. [17] established a zonal spring frost indicator based on the percentile method by using daily mean and minimum temperature records for March–April. Yang et al. [18] established spring frost classification criteria by using a mean temperature anomaly and duration. Regarding the spatial and temporal distribution characteristics of spring frost, Xu et al. [19] analyzed the spatial and temporal distribution characteristics of spring frost in Henan Province and found that the frequency of spring frost in Henan showed a spatial pattern of an increasing trend from the southwest to the northeast in the province. Gao et al. [20] evaluated the spatial and temporal distribution characteristics of spring frost in Shandong Province and found that the number of occurrences and duration of spring frost in different years were spatially high in the east and low in the west. Zhao [21] studied the spatiotemporal distribution characteristics of spring frost disasters in Jiangsu Province and determined that the frequency of spring frost in Jiangsu Province had the characteristics of northern Jiangsu, central Jiangsu, and southern Jiangsu. Li et al. [22] studied the temporal and spatial variations of frost in Qingdao and found that the spatial distribution characteristics of frost in Qingdao gradually decreased from the northwest region to the southeast coast.
The aforementioned studies have demonstrated that the criteria for classifying spring frost differ in diverse regions, and the distribution characteristics of spring frost also vary greatly depending on the geographical location and climatic characteristics. Therefore, further investigation into the classification criteria and spatiotemporal characteristics of spring frost in typical regions is necessary and could provide a reference for an in-depth understanding of the impact of spring frost on different types of ecosystems.
Xinjiang is one of the most important food and crop producing areas in China, but the crops in this area are often affected by spring frost [23]. In recent years, meteorologists have studied the spatiotemporal characteristics of disasters, including cold waves [24,25,26], hail [27,28,29], and heavy rainfall [30,31] in Xinjiang, but less attention has been paid to the spring frost in Xinjiang, which limits the understanding of the classification criteria and spatial and temporal distribution patterns of spring frost in the typical regions of arid zones. On this basis, this study plans to use the daily meteorological data of 40 stations in Xinjiang over a 50-year period (1971–2020) to investigate the classification criteria, spatiotemporal variation, abrupt change, and periodic characteristics of spring frost in Xinjiang. The relevant research will be helpful not only in revealing the spatiotemporal trend of spring frost in Xinjiang, but also in gaining a deeper understanding of the occurrence mechanism of extreme meteorological events in arid areas.
2. Materials and Methods
2.1. Study Area
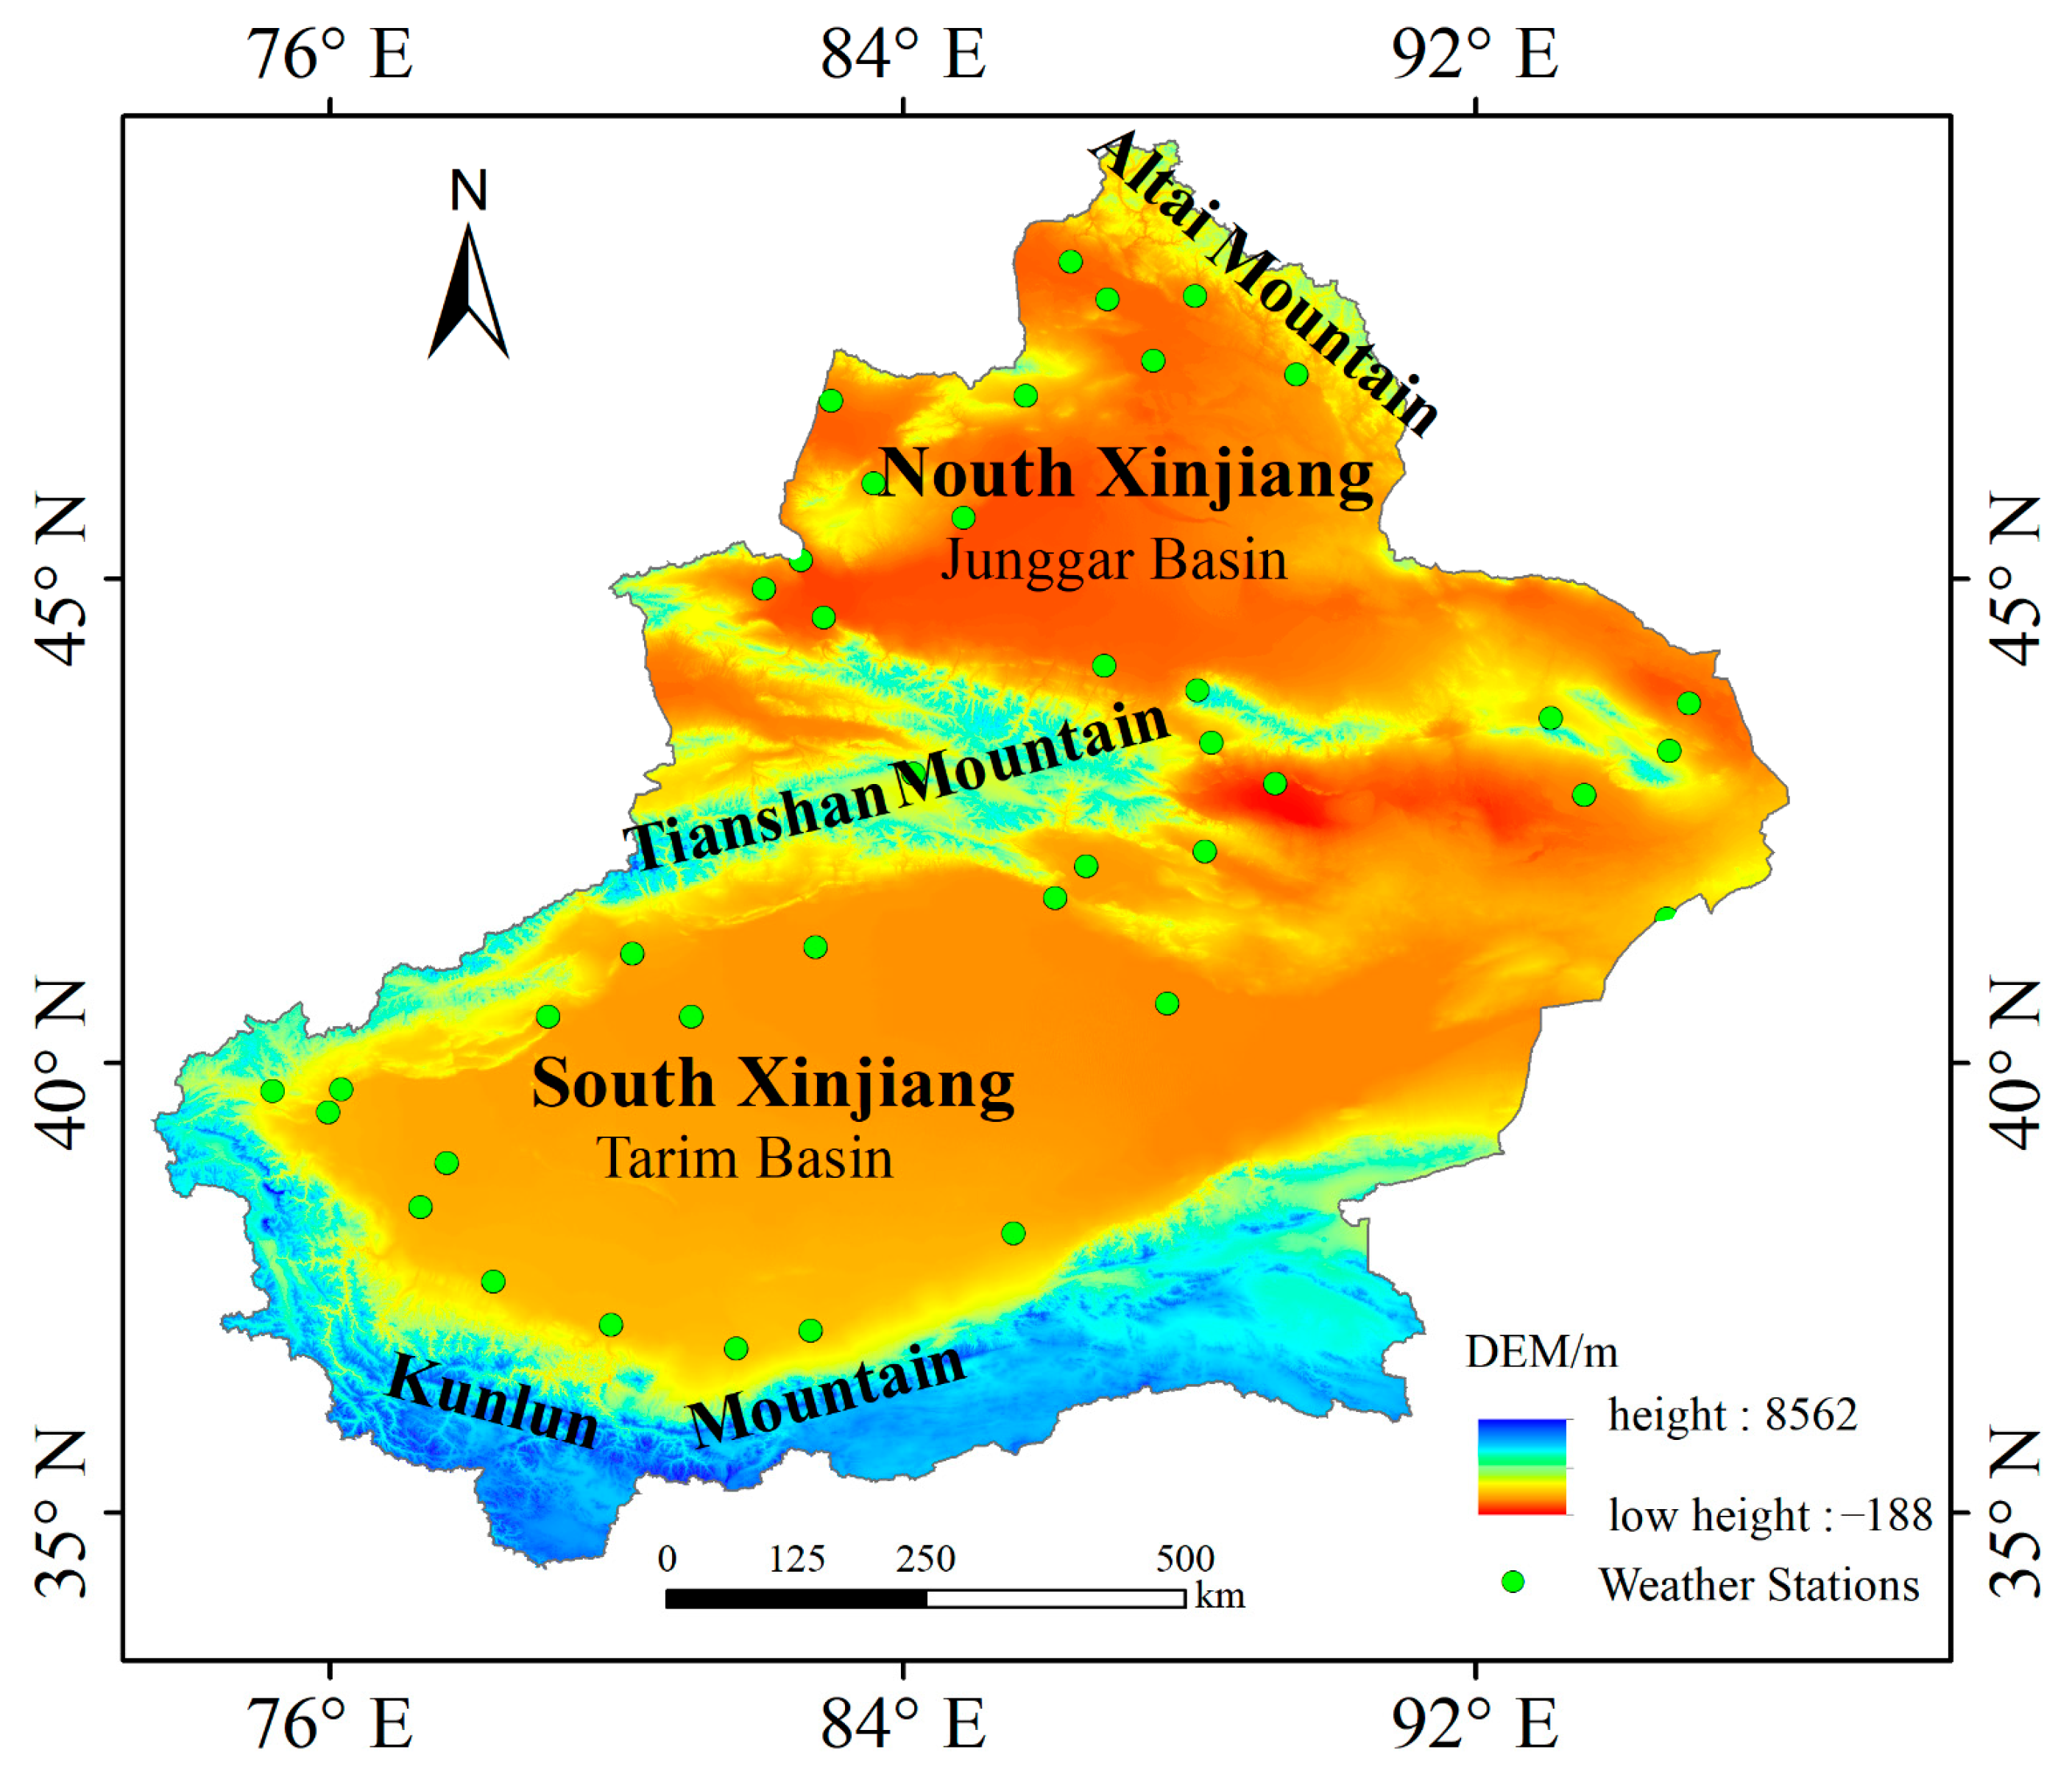
Xinjiang has various landforms with the characteristics of two basins (the Junggar Basin in the north and the Tarim Basin in the south) situated among three mountain ranges (the Altai Mountains in the north, the Tianshan Mountains in the middle, and the Kunlun Mountains in the south). The northern part of the Tianshan Mountains is called Northern Xinjiang, and the southern part is Southern Xinjiang (Figure 1). Owing to the influence of geographical location, topography, and landform, a significant difference in temperature and precipitation exists between the north and south of Xinjiang. Northern Xinjiang is shaped like a trumpet opening to the west, which is mainly influenced by wet air flows from the Atlantic Ocean and the Arctic Ocean region. The terrain of Southern Xinjiang is closed, and it is neither affected by the upper westerly flow nor by the southeast monsoon. Overall, the precipitation in Northern Xinjiang is greater than that in the south, and the temperature of Southern Xinjiang is higher than that of the north.

Figure 1.
Location of the study area and meteorological stations.
2.2. Meteorological Data
This study used the daily average temperature data from the Daily Value Dataset of Chinese Terrestrial Climate Information (V3.0) provided by the China Meteorological Data Sharing Service System (http://data.cma.cn/, accessed on 9 March 2021). The data included the meteorological data of daily average temperatures of 40 meteorological stations (Table 1) in Xinjiang from 1971 to 2020, which had undergone quality control.

Table 1.
Basic information of meteorological stations in the study area.
2.3. Spring Frost Criteria
The differences in climate and the affected objects result in differences in the criteria for meteorological disasters in different regions of China. On the basis of the climatic characteristics of Xinjiang, the characteristics of crops, and the results of available research, the following criteria for determining spring frost events in the study area were initially formulated: (1) definition of the start of spring. We used the 5-day moving average method to delineate the start of spring; i.e., if the moving average temperature sequence at the beginning of the year was greater than or equal to 10 °C for 5 consecutive days, the first date greater than or equal to 10 °C in the corresponding temperature series was used as the spring start date [32]. (2) Definition of spring frost events. An event with a daily mean temperature ≤ 6 °C for 3 or more days after the onset of spring [33] was defined as a spring frost event [34,35], and the spring frost event started when the daily mean temperature fell to 6 °C or below for the first time after the onset of spring and ended when the daily mean temperature rose to the mean temperature.
The severity of spring frost was based on two parameters, namely, duration D and daily mean temperature of a specific spring frost event. In accordance with the values of D and , we first classified specific spring frost events to different classes, as shown in Table 2. Then, the severity of the frost was determined using the criteria, as displayed in Table 3.
Table 2.
Different classes of spring frost classified in accordance with the values of D and .
Table 3.
Severity criteria of spring frost.
2.4. Statistical Analysis
2.4.1. Mann–Kendall (M–K) Test
The M–K test is a commonly used method to test the change point (trend from increase to decrease or vice versa) in meteorological and climatological time series [36]. The M–K change point test statistic is calculated on the basis of the following equation:
where
The index UF is calculated using the following equation:
where
and
UF and UB are the forward and backward sequences, respectively. UB is calculated as UF with an inverse series. The intersection of the UF and UB curve with a significant trend of the series which indicates an abrupt change point.
2.4.2. Wavelet Analysis
The principle of wavelet analysis is to decompose a time series into the time–frequency domain to obtain the periodic characteristics of the series [37]. In the present study, we used the Morlet wavelet function to investigate the periodic characteristics of collected temperature series. The Morlet wavelet cannot only reveal the different periodic characteristics in the temporal domain but can also provide a qualitative prediction of their future trends.
During the estimation, the wavelet coefficients (the contour map of the real part can be used to detect the periodic variation in time series at different time scales) were obtained through wavelet transformation, then wavelet variance was calculated by integrating the squared values of the wavelet coefficients in the time domain. The wavelet coefficient real part contour map can further determine the history of spring frost changes at different time scales by reflecting the periodic changes in spring frost at different time scales and its distribution in the time domain. The Morlet wavelet function, wavelet transformation, and wavelet variance were calculated using the following formulas:
where and denote the wavelet transform coefficients and wavelet base functions, respectively; and represent the scale and translation of the series, respectively; is a constant; and is a square integrable function.
3. Results
3.1. Spatial Distribution of Spring Frost
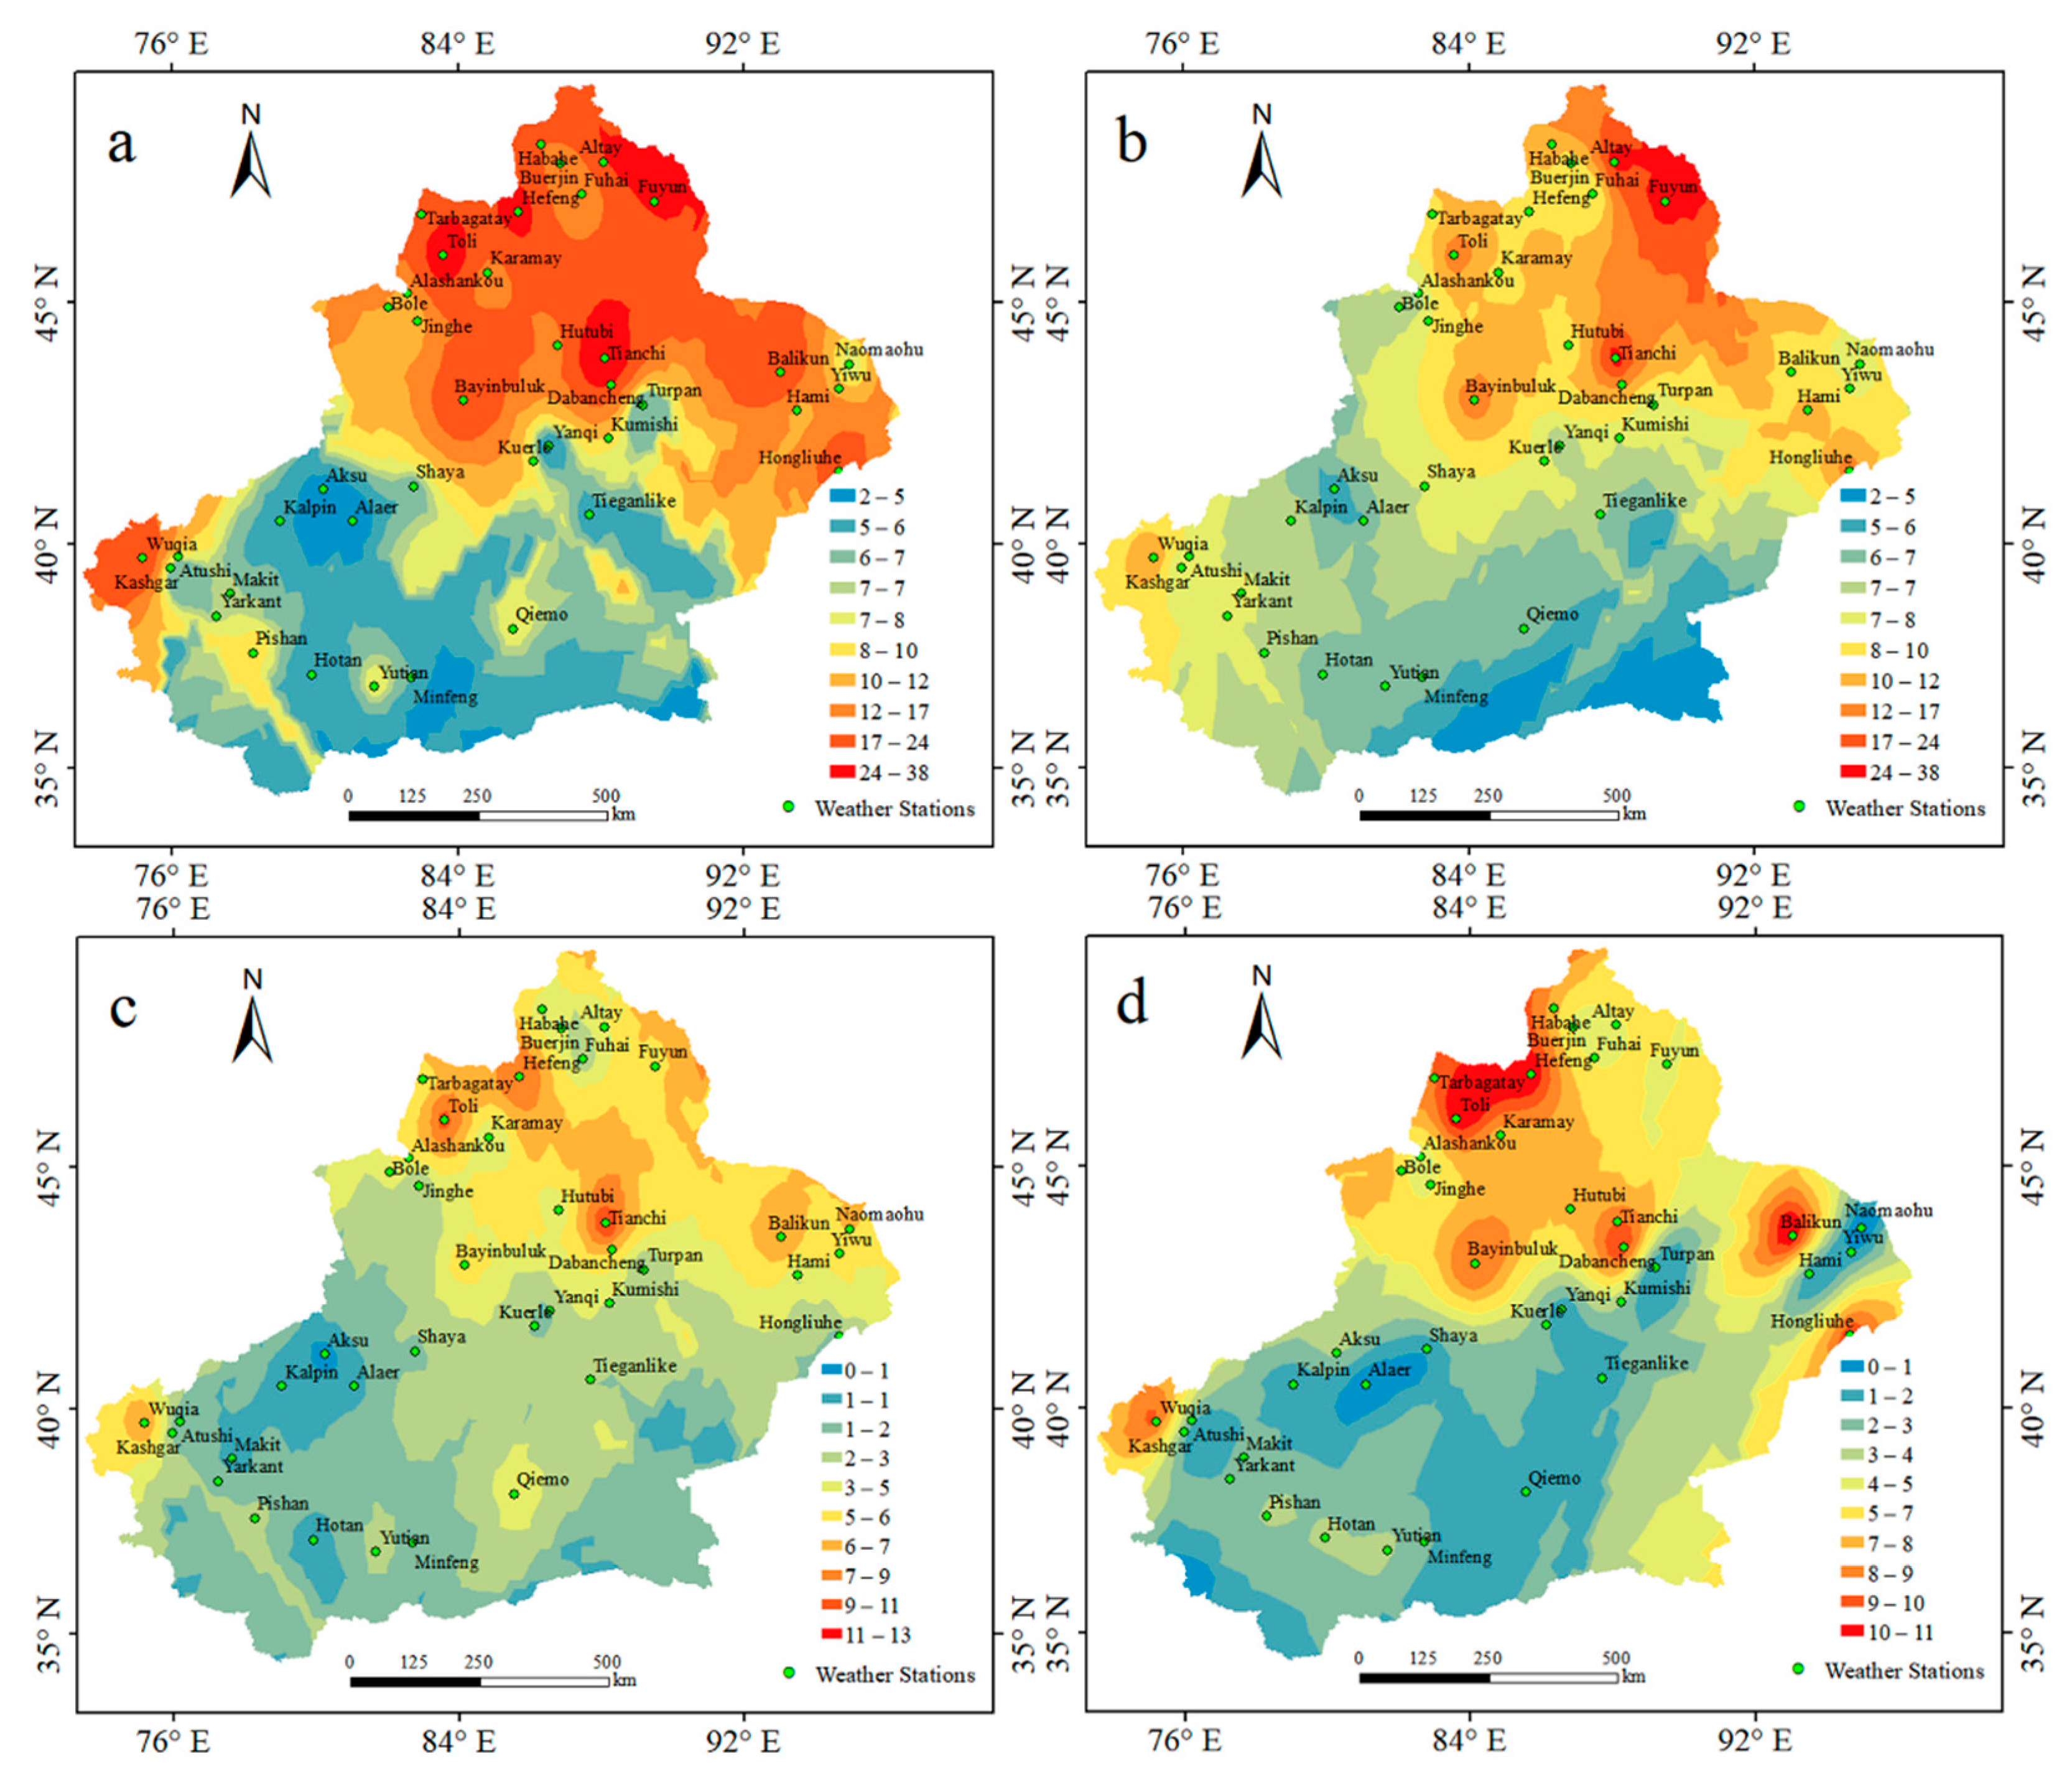
The spatial distribution of the frequency of spring frost in Xinjiang from 1971 to 2020 is displayed in Figure 2a. Obvious spatial differences in the frequency of spring frost in Xinjiang were observed, and the general pattern was a gradual increase from south to north with 147 occurrences in Southern Xinjiang and 375 occurrences in Northern Xinjiang during the past 50 years. In Northern Xinjiang, the Tianchi station witnessed the highest frequency of spring frost with 38 times in the past 50 years, followed by Toli with 30 times. The spring frost event appeared only three times in the Turpan station, which was the station with the least number of occurrences in Northern Xinjiang. In Southern Xinjiang, the spring frost event occurred 26 and 25 times at the Bayinbuluk and Wuqia stations, respectively, which were the most; the Alaer station had the least, with only 2 occurrences.

Figure 2.
Spatial distribution of spring frost occurrence frequency in Xinjiang. Total frequency (a), frequency of mild spring frost (b), frequency of moderate spring frost (c), frequency of severe spring frost (d).
Mild spring frost events mainly occurred in the stations of Northern Xinjiang, such as Fuyun (15 times), Altay (15 times), Tianchi (16 times), and their surrounding regions (Figure 2b). Moderate spring frost events were mainly witnessed by Toli (11 times), Hefeng (12 times), Tianchi (13 times), Balikun (9 times), and their surrounding regions (Figure 2c). Tarbagatay (9 times), Toli (11 times), Hefeng (11 times), Dabancheng (11 times), Balikun (11 times), the Hongliu River (10 times), and their surrounding regions were the stations with the most occurrences of severe spring frost events (Figure 2d). In total, the mild, moderate, and severe spring frost events accounted for 36%, 29%, and 35% of all the events in Southern Xinjiang, respectively. The corresponding ratios for Northern Xinjiang were 37%, 32%, and 30%. This finding demonstrated that Northern Xinjiang not only had a high frequency of spring frost events but was also the main area of moderate and severe spring frost events (the relatively higher number of events in total resulted in a relatively higher number of moderate and severe ones).
3.2. Temporal Characteristics of Spring Frost
3.2.1. Spring Frost Occurrence Month
The spring frost events that occurred in April in Northern Xinjiang accounted for 69.6% of the total number of occurrences. By contrast, the events mainly occurred in March in Southern Xinjiang with 50% of the total occurrences. Meanwhile, spring frost events appeared in June in Northern Xinjiang (Table 4). We found that most of them occurred at the Tianchi station, which is located at 43°53′ N, 88°07′ E, and the altitude of the station is 1942.5 m. In June, extreme spring frost events occurred in Southern Xinjiang, and the corresponding station was Bayinbuluk, where they occurred 15 times in the past 50 years.
Table 4.
Occurrence month of spring frost in Xinjiang.
3.2.2. Interannual Variation of Spring Frost
From the mid-1970s to the early 1990s, the frequency of spring frost events in Xinjiang showed an upward trend. Then, after a period with an inapparent trend, the frequency of occurrence gradually declined. In 2016, no spring frost events occurred in Xinjiang. Linear regression revealed a nonsignificant growth trend with a growth rate of 0.5 times/10 a (Figure 3a). The frequency of spring frost events in Northern Xinjiang also exhibited an upward trend from the mid-1970s to 2005, then a downward trend could be detected (Figure 3b). Overall, the growth rate of Northern Xinjiang was similar to that of the entire Xinjiang region (0.5 times/10 a). The 9-year moving average curve of spring frost events in Southern Xinjiang fluctuated greatly. Nevertheless, after the first 10 years of this century, a clear downward trend could be detected (Figure 3c).
The frequency of mild and moderate spring frost events was high from the 1990s to the early 21st century; from 2004, a decreasing trend can be observed (Figure 3d–f). Severe spring frost showed a fluctuating upward trend from the 1970s to the beginning of the 21st century, then the frequency decreased. Overall, mild spring frost events decreased at a rate of 0.0145 times/10 a (not significant with p > 0.05); moderate and severe spring frost events showed a nonsignificant growth trend, with growth rates of 0.034 and 0.032 times/10 a, respectively.
3.3. Periodic Variation and Change Point Detection
3.3.1. Change Point Detection
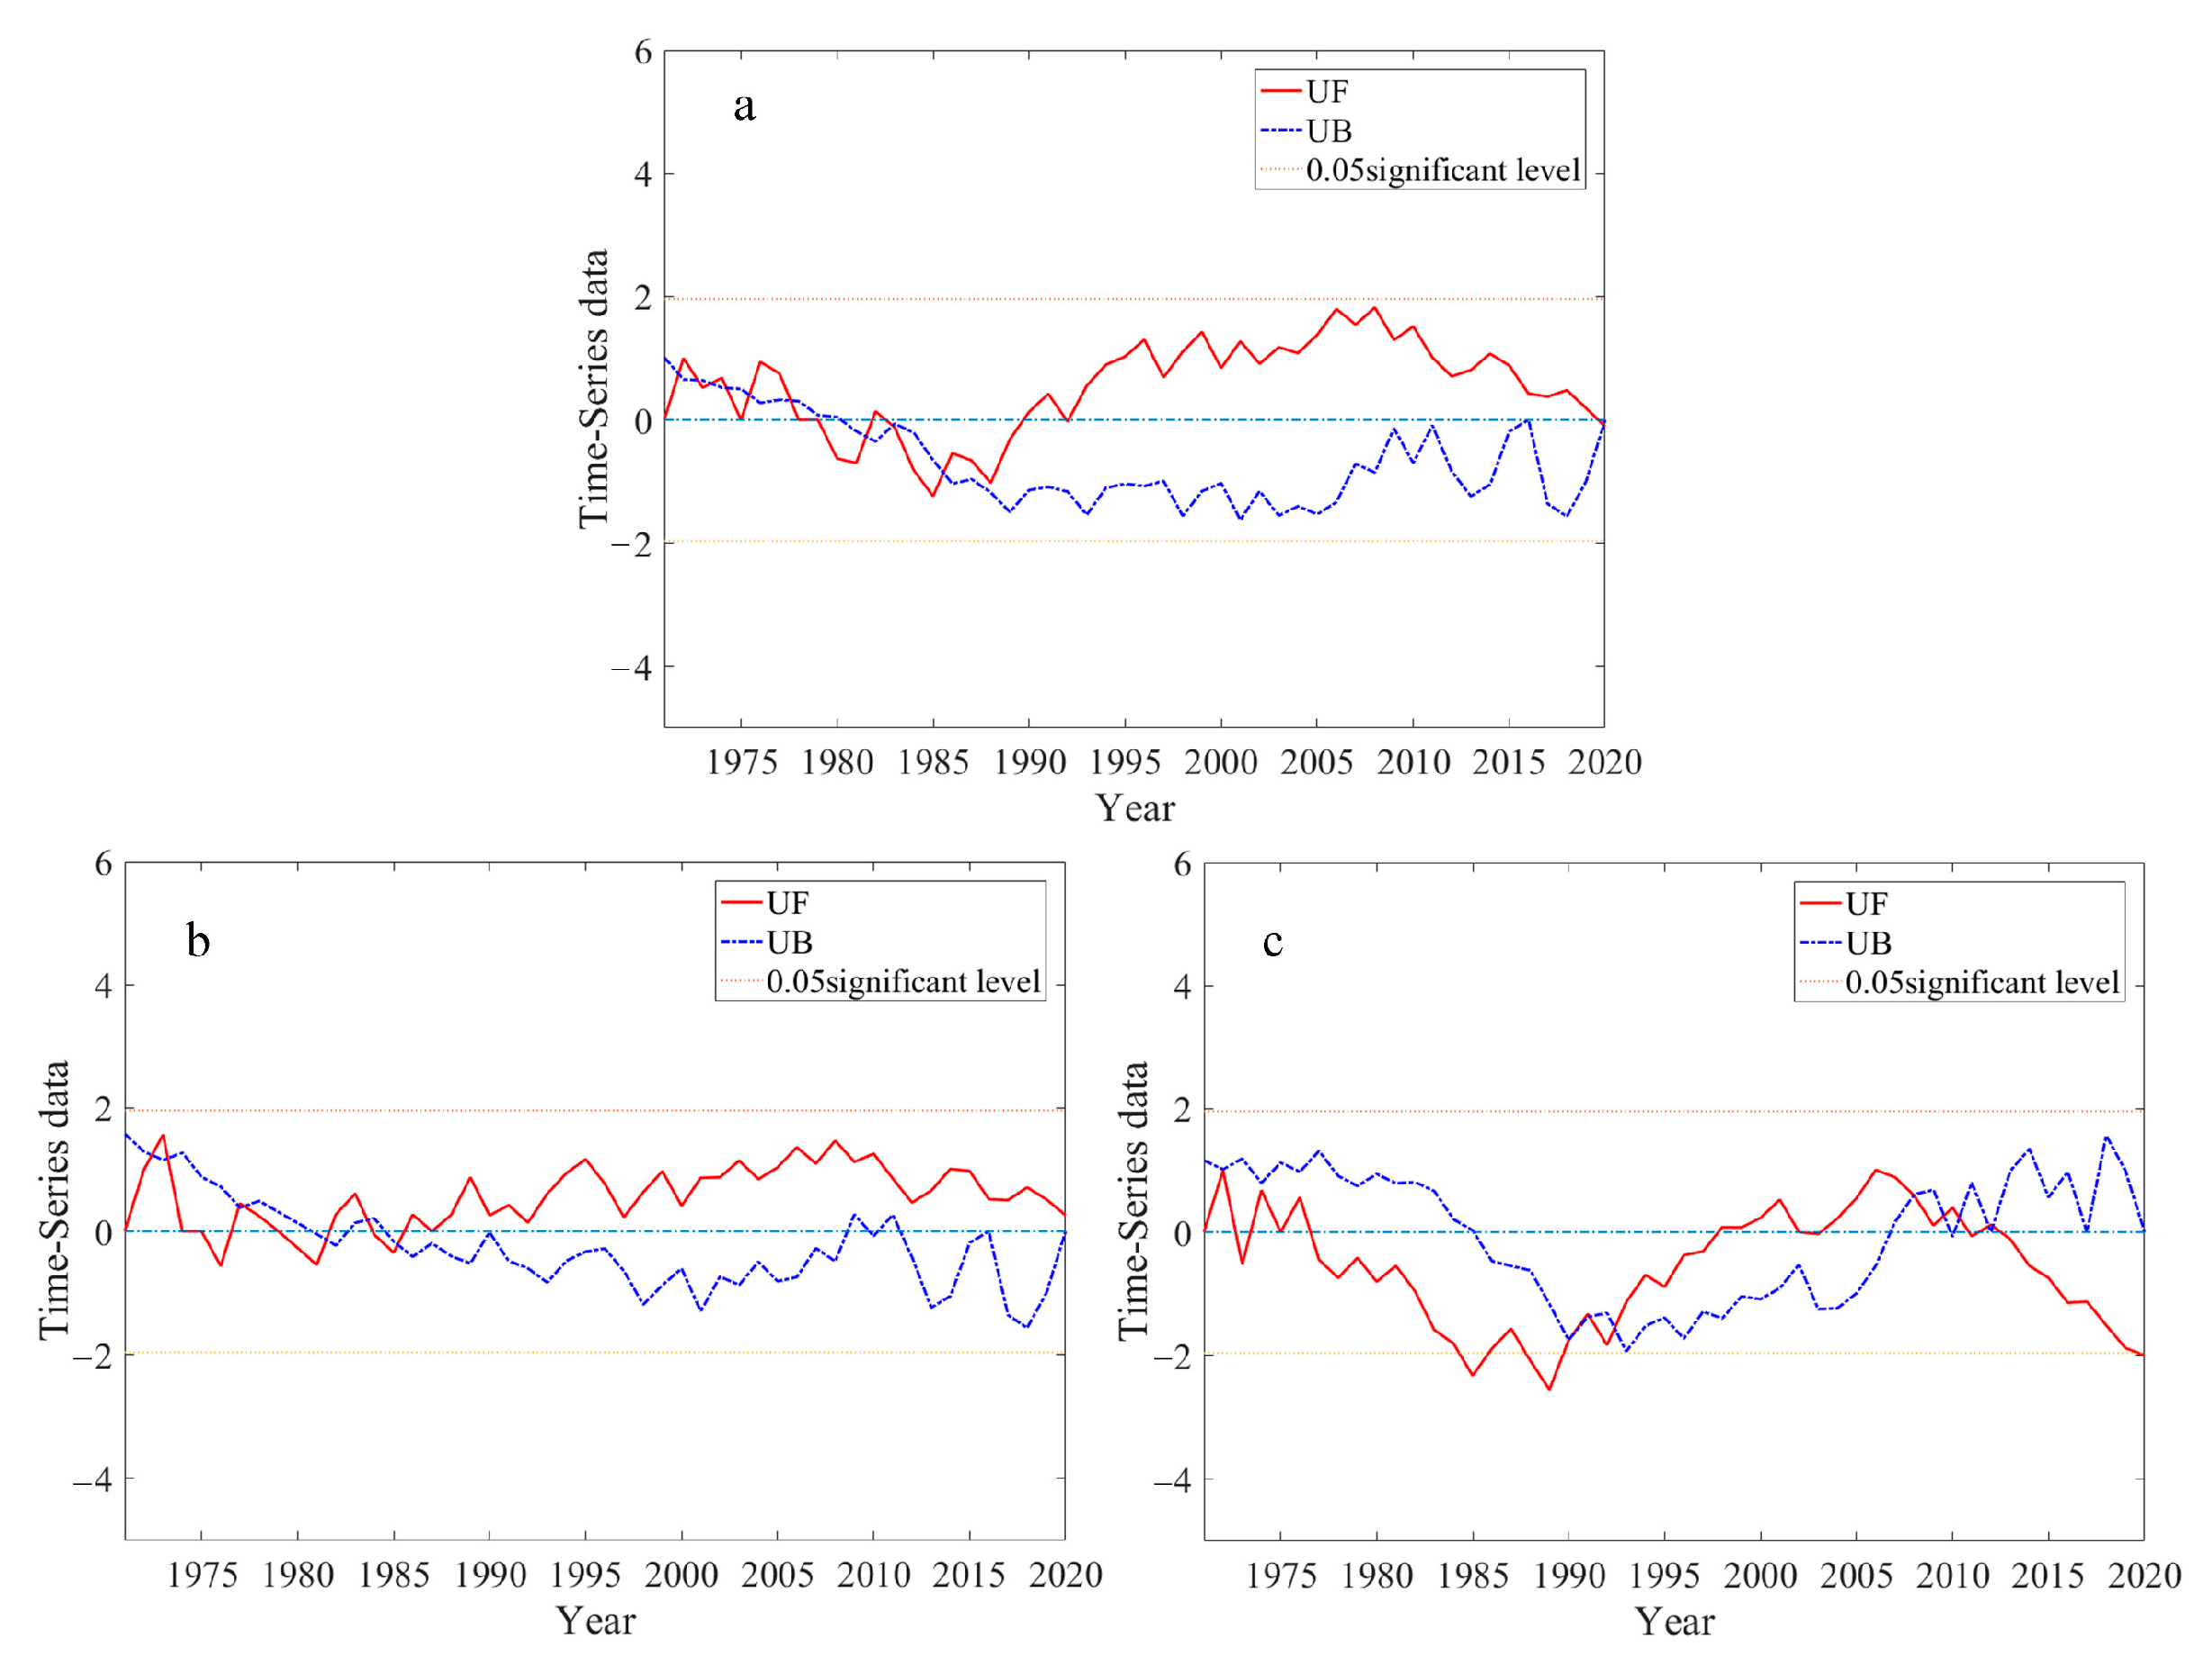
Although the frequency of mild, moderate, and severe spring frost showed a trend in Xinjiang and subregions (Figure 3), the change points of the frequencies were significantly different among various regions. The results of the M–K test showed that change points appeared in all regions (entire Xinjiang, Northern Xinjiang, and Southern Xinjiang, Figure 4). Among them, the change points in the entire region of Xinjiang were frequent between 1971 and 1985, indicating an unstable trend during this period. After 1985, an obvious upward trend existed. Similar to the situation in the entire region of Xinjiang, the frequency trend of spring frost in Northern Xinjiang was also unstable between 1972 and 1985, and an increasing trend was observed after 1985. The frequency of spring frost in Southern Xinjiang showed a different pattern from those in Xinjiang and Northern Xinjiang, with six change points between 1990 and 2012 (Figure 4).
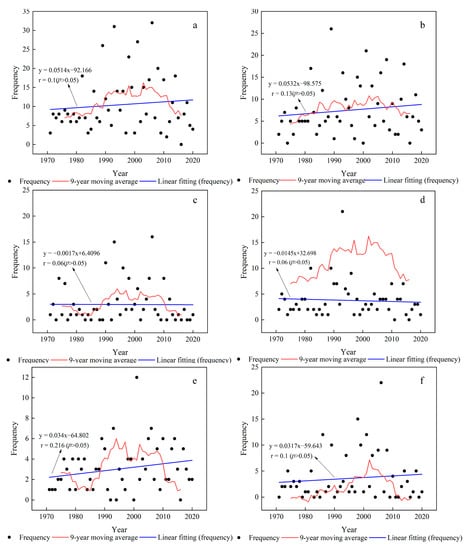
Figure 3.
Temporal variations of the occurrence of spring frost in the entire Xinjiang (a), Northern Xinjiang (b), and Southern Xinjiang (c), as well as the trend of mild (d), moderate (e), and severe (f) spring frost.
Figure 3.
Temporal variations of the occurrence of spring frost in the entire Xinjiang (a), Northern Xinjiang (b), and Southern Xinjiang (c), as well as the trend of mild (d), moderate (e), and severe (f) spring frost.
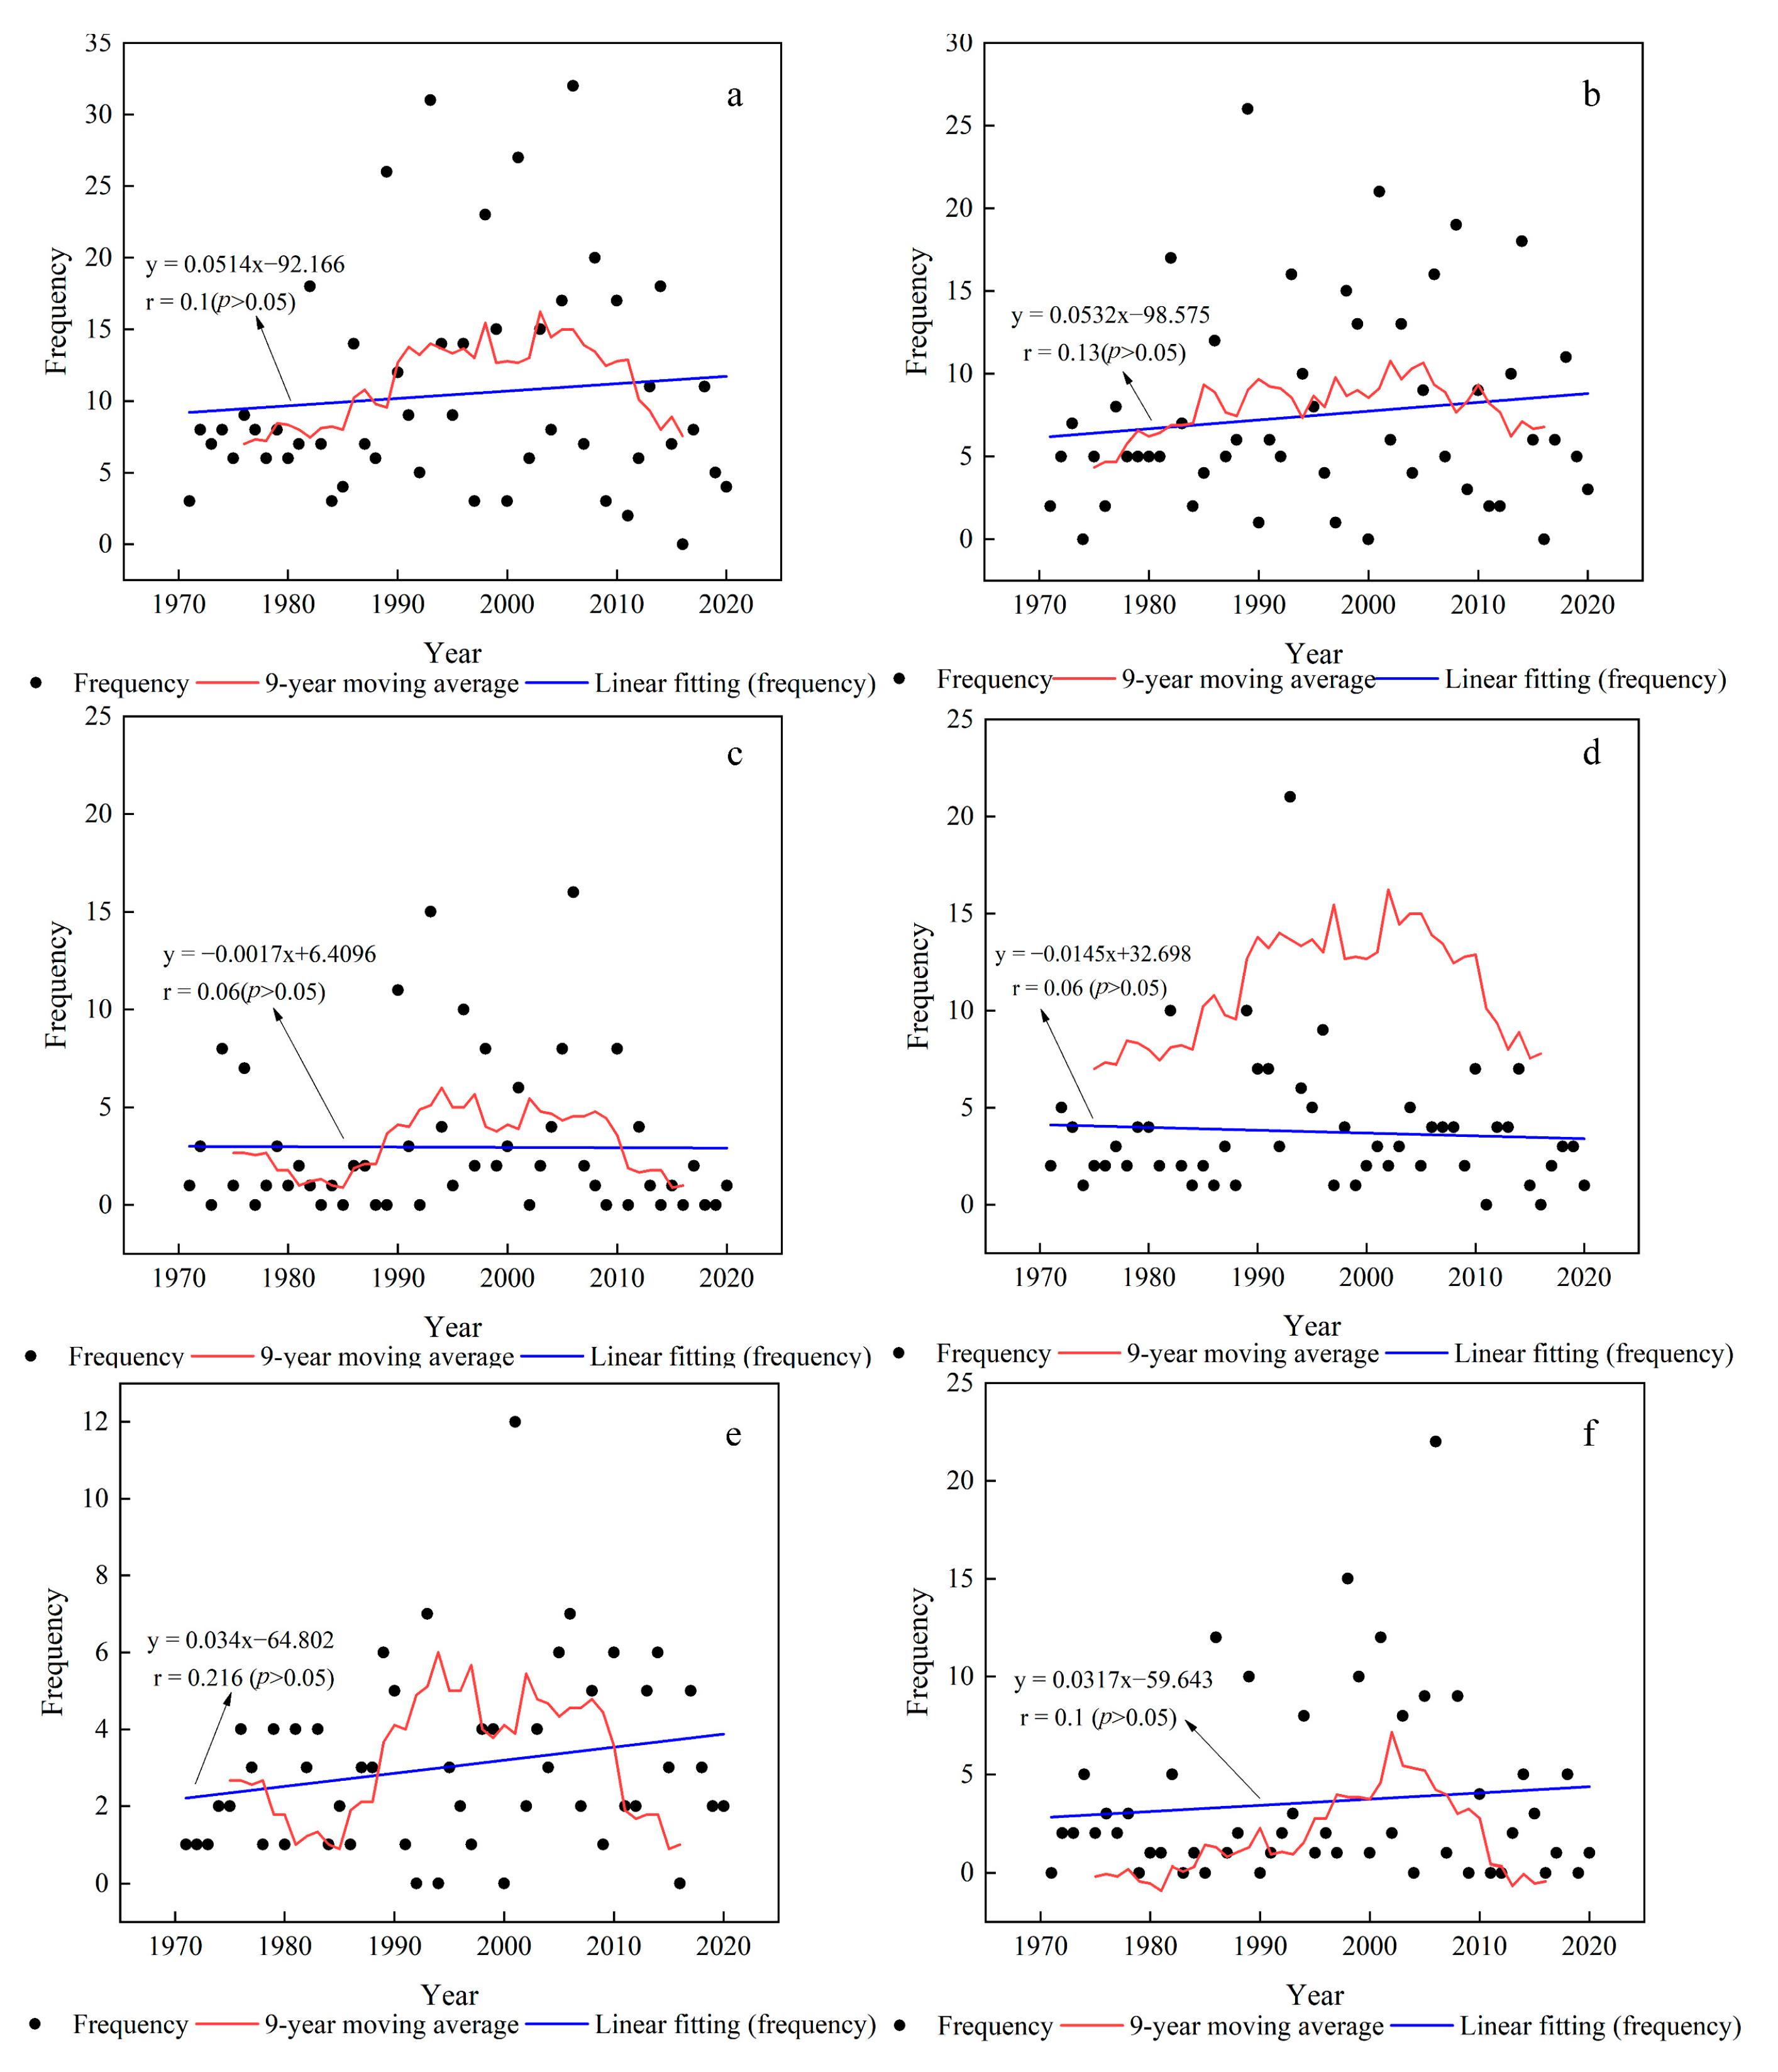
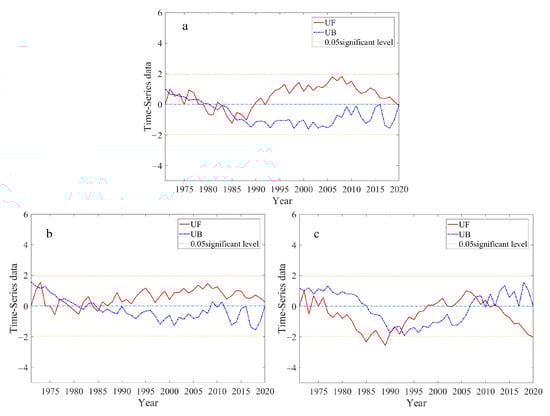
Figure 4.
Change points of the frequency of spring frost in the (a) entire Xinjiang, (b) Northern Xinjiang, and (c) Southern Xinjiang.
Figure 4.
Change points of the frequency of spring frost in the (a) entire Xinjiang, (b) Northern Xinjiang, and (c) Southern Xinjiang.
3.3.2. Periodic Cycle
An obvious 15-year periodic cycle of spring frost events existed in Xinjiang during the past 50 years, which could be divided into three periods of high frequency and four periods of low frequency. Currently, Xinjiang is in a transition period from low to high frequency (Figure 5a). An obvious quasi-20-year periodic cycle also occurred in Northern Xinjiang, with two periods of high frequency and three periods of low frequency. Similar to Xinjiang, Northern Xinjiang is also currently in a transition period from low to high frequency (Figure 5b). The cycling period of Southern Xinjiang included a 15-year cycle and two 10-year cycles during 1971–2000 and 2001–2020, respectively. In line with Xinjiang and Northern Xinjiang, Southern Xinjiang is also in a transition period from low to high frequency of spring frost (Figure 5c).
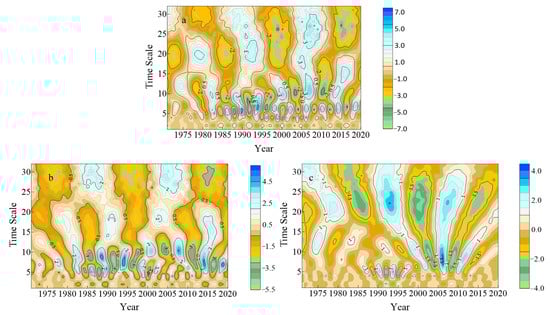
Figure 5.
Distribution of wavelet coefficients (real part) of the frequency of spring frost for (a) Xinjiang, (b) Northern Xinjiang, and (c) Southern Xinjiang.
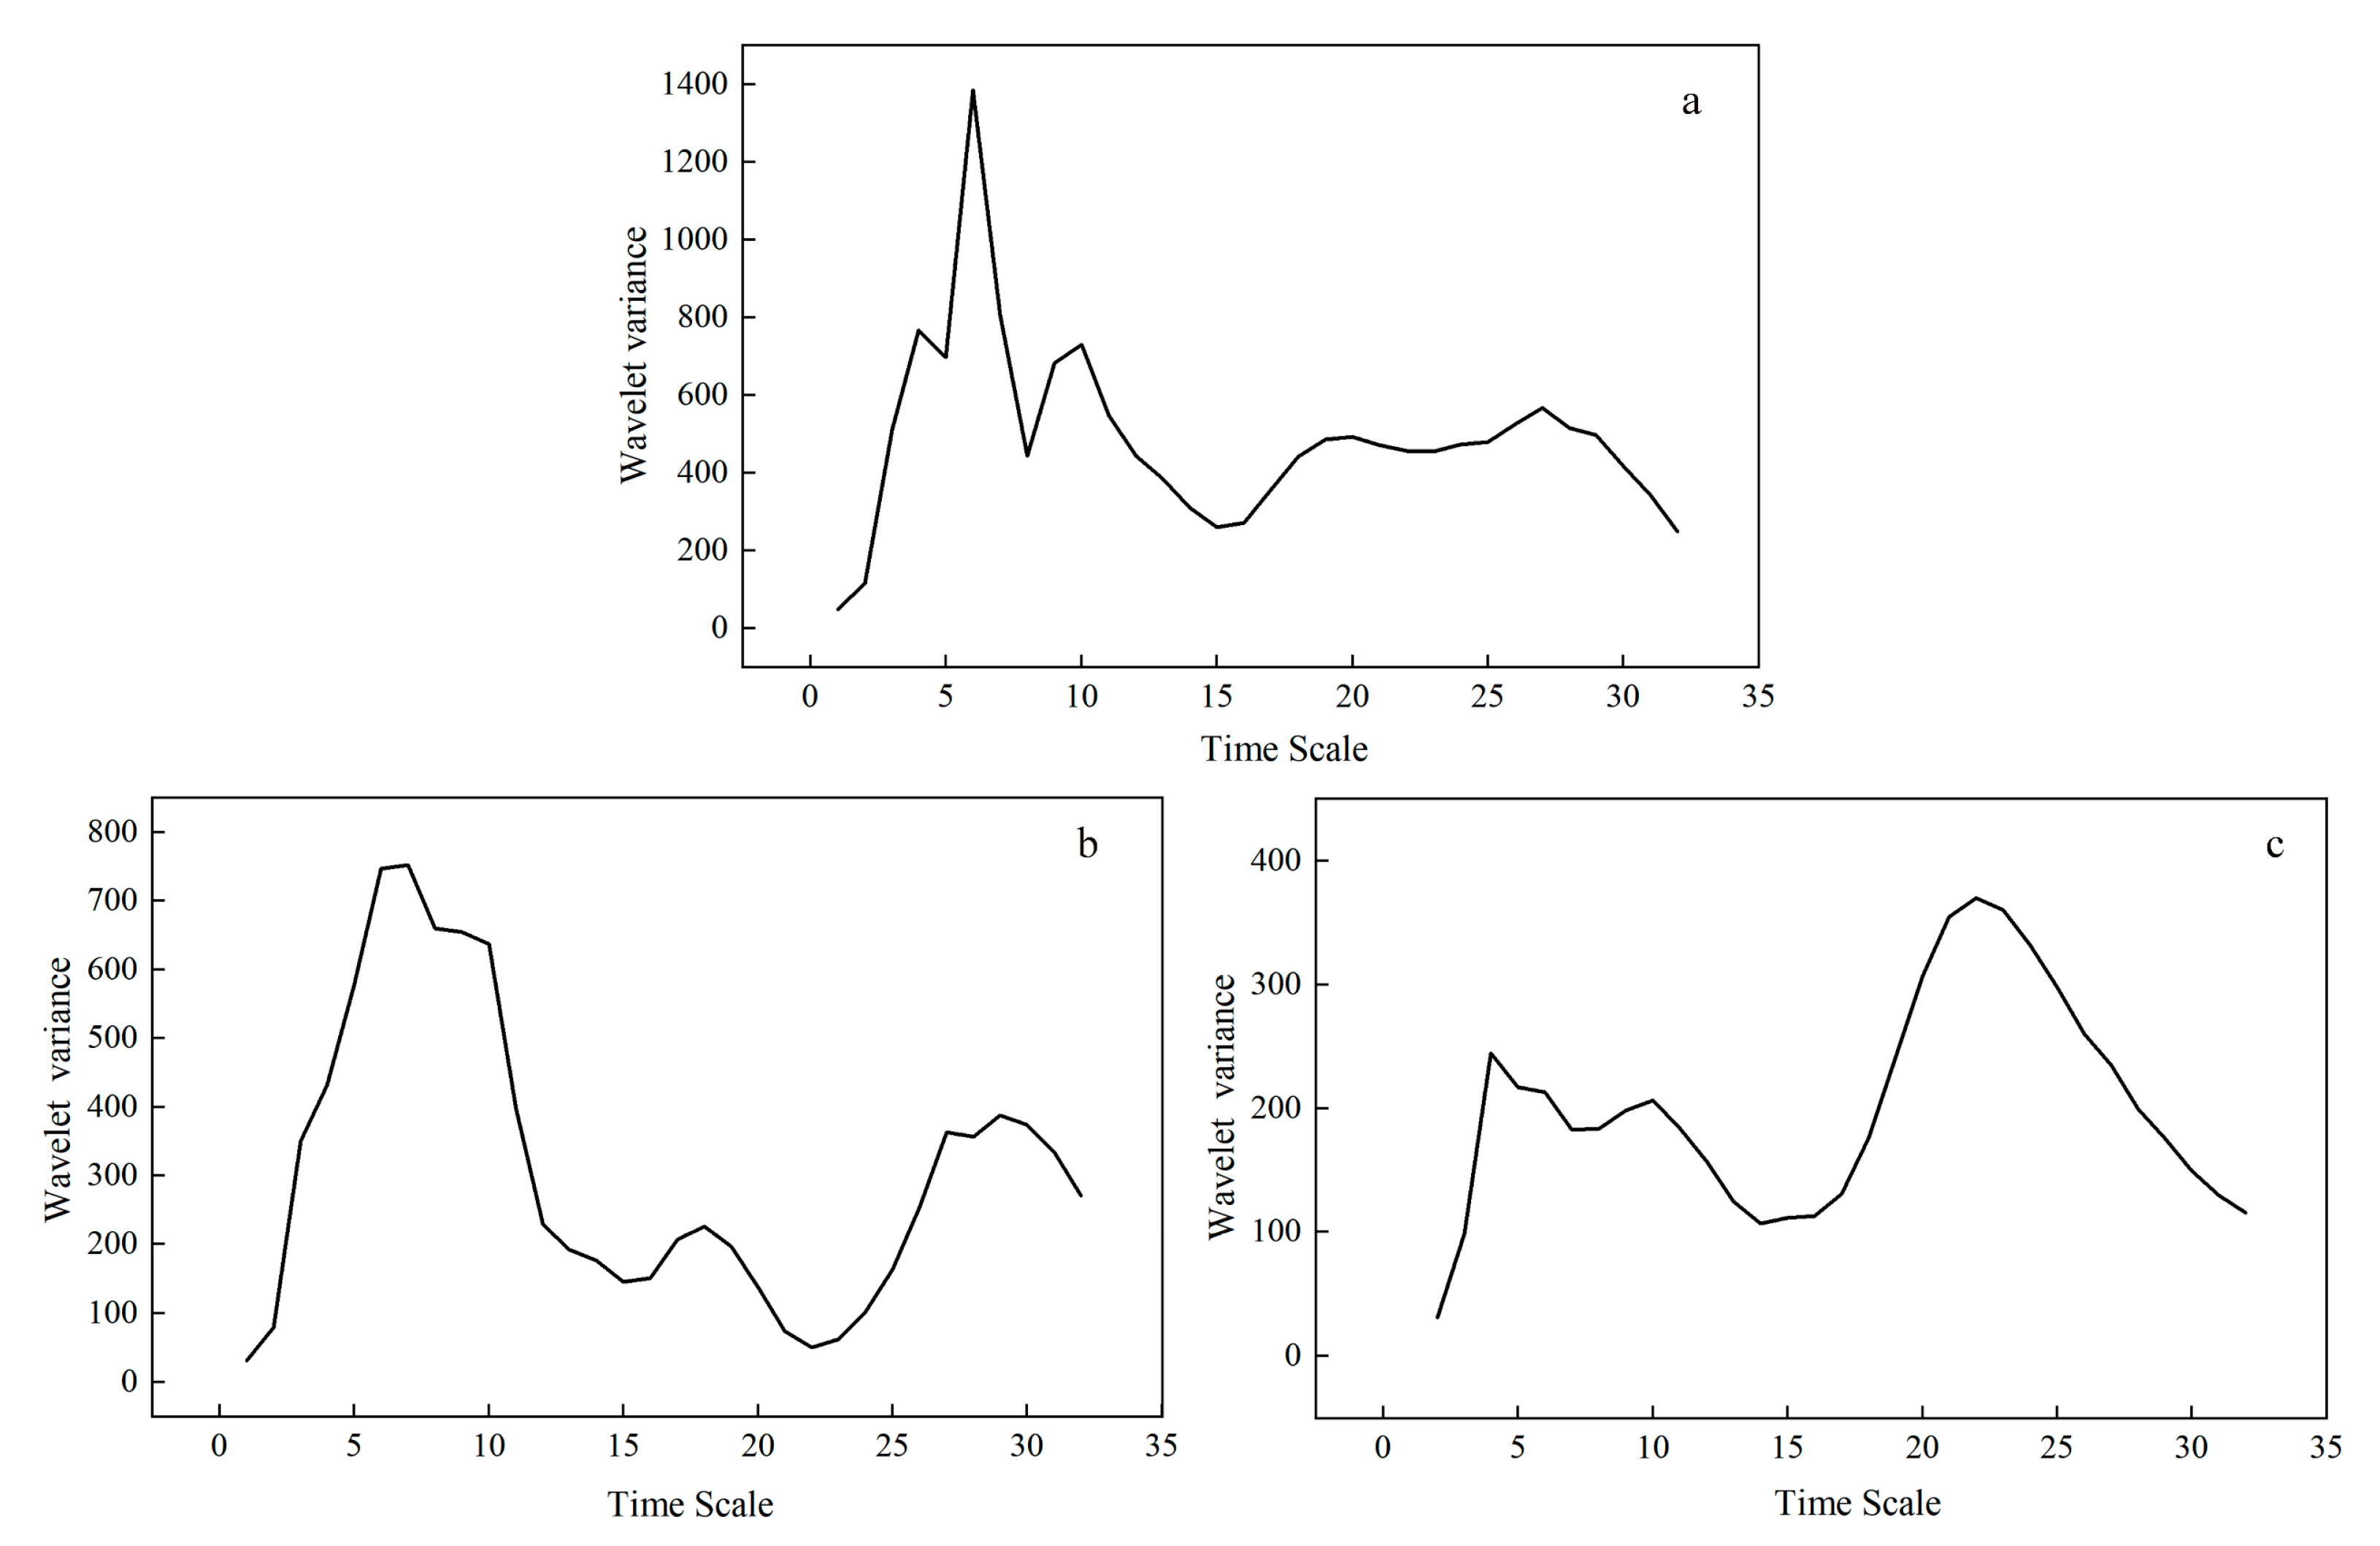
Four obvious peaks (corresponding to 4, 6, 10, and 27 years) were found in the variance plot of the wavelet coefficients (Figure 6a). Among which, the highest one corresponded to a 4-year cycle, demonstrating that the cycle that oscillated around 4 years was the strongest one and was the first major cycle of spring frost in Xinjiang. The second, third, and fourth peaks corresponded to 6-, 10-, and 27-year cycles, respectively, indicating that the occurrence of spring frost in Xinjiang was controlled by these four kinds of cycle. In Northern Xinjiang (Figure 6b), there were four obvious peaks in the variance plot of wavelet coefficients, which corresponded to 7, 18, 27, and 29 years. Among them, the peak corresponding to 7 years was the highest, indicating that the 7-year cycle oscillation was the first major cycle of spring frost occurrence in Northern Xinjiang. In Southern Xinjiang (Figure 6c), the scales of major cycles included 22, 10, and 4 years, with the strongest and first one of 22 years.
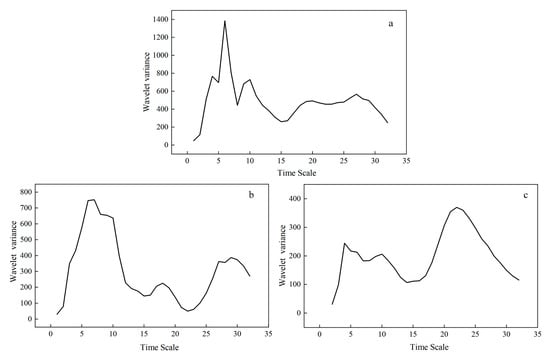
Figure 6.
Distribution of wavelet coefficient (variance) of the total number of spring frost events in Xinjiang in the past 50 years: (a) Xinjiang, (b) Northern Xinjiang, and (c) Southern Xinjiang.
4. Discussion
4.1. About the Definition of Spring Frost in Xinjiang
Although both daily mean temperature and daily diurnal temperature may increase in future climate scenarios, the effect of spring frost on vegetation depends more on the variation in mean temperature [38]. Therefore, in this study, the daily mean temperature was chosen to analyze the spatial and temporal distribution characteristics of spring frost in Xinjiang. Given the great differences in latitude, landform, and climate background, defining the onset of spring in Xinjiang in accordance with 24 solar terms or months was inappropriate. Thus, this study selected the “5-day moving average method” to determine the spring onset time in different regions of Xinjiang. This method is in line with the actual phenological phenomena, as reported previously [32,39], in which the onset of spring was found to be around mid-April in most areas of Northern Xinjiang and early-mid March in Southern Xinjiang. Regarding the criteria of spring frost in Xinjiang, there are still no clear definitions and records. Zhang and Zhang considered that an event with an average daily temperature ≤ 6 °C after the onset of spring could be classified as spring frost [34], but they did not provide a clear description of the duration of spring frost. Xinjiang Agroclimatic Resources and Zoning recorded that the foliage of cotton seedlings could be damaged when the temperature fell below 6 °C [40]. Yu considered an average daily temperature ≤ 6 °C after the onset of spring, and a situation that lasts more than 1 day could be classified as a spring frost event [35]. However, the spring temperatures in Xinjiang rebound rapidly, and there is a certain degree of fluctuation and instability [41]. Hence, classifying an event with duration of 1 day as spring frost is unsuitable. During the statistical analysis in the present study, we also considered the duration of 2 days, but it was reported that events lasting at least 3 days will have an obvious impact on crops [33]. In addition, most studies conducted in regions beyond Xinjiang believed that only an event with temperature drops to a certain value that lasts for 3 days or more can be considered spring frost (e.g., [18,19,22,42]). Therefore, we proposed a classification criterion for spring frost events in Xinjiang: after the onset of spring, an event with an average daily temperature ≤ 6 °C lasting for more than 2 days (≥3 days) can be classified as a spring frost event.
4.2. Historical Event Verification
The China Meteorological Disasters Dictionary (Xinjiang Volume) recorded that Altay City and Fuyun and Toli counties suffered severe frost damage from May 3 to 6, 1991 [43]. According to the records, the spring frost that occurred in Altay City on May 3-5 was characterized by daily temperature of 5.3 °C, 4.1 °C, and 5.6 °C during the event. The average daily temperature for Fuyun County was 5.9 °C, 4.6 °C, and 4.5 °C during the 3 days of the event. For Toli County, the temperature was 3.9 °C, 2.5 °C, and 4.6 °C. In addition, a frost event occurred in the Tarbagatay area from 8 to 10 May 1993, which had average daily temperatures of 3.9 °C, 2.5 °C, and 4.6 °C [43]. The Dictionary also recorded that heavy spring frost usually occurred in the Tarbagatay area, Hutubi, Bole, Jinghe, Dabancheng, and those regions around the north slope of the Tianshan Mountains. Moderate and mild events always took place along the Tianshan Mountains in Northern Xinjiang and most parts of Southern Xinjiang [43]. The present study discovered a similar spatial pattern (with a greater frequency in the north than in the south, with the least frequency of spring frost occurring in Turpan in the north and the highest incidence in Tarbagatay, Hefeng, and Dabancheng) in Xinjiang Province (Figure 2), indicating that the quantitative method adopted in this study was both feasible and suitable.
4.3. Environmental Background of Spring Frost
We found that the frequency of spring frost in Xinjiang in the early 21st century showed a decreasing trend at all spatial scales, as reported by Emanuele et al. [15]. Han et al. [44] also reported that the damage caused by spring frost decreased after the 20th century. However, our investigation revealed that although the frequency of spring frost in Southern Xinjiang showed a slight downward trend, the frequency in the entire Xinjiang and Northern Xinjiang regions showed an upward trend (Figure 3), which indicated that the temporal variation of spring frost risk actually depends on the geographical location [14,45]. Meanwhile, although mild spring frost showed a decreasing trend, moderate and severe events increased (Figure 3), which suggested that the temporal variations of spring frost also depend on the severity. The difference in time and space of spring frost in northern and southern Xinjiang is related to the climate difference and the causes of frost formation in such areas. The spring frost in Northern Xinjiang is mainly formed by the influence of cold air activities, whereas that in Southern Xinjiang is formed by the combined action of cold air activities and ground radiation cooling [43]. The initial frost in northern and southern Xinjiang is almost related to a strong invasion of cold air or cold waves, which is more obvious in the northern part. At the same time, vertical climate change is obvious. The terrain height difference in Xinjiang is wide. The vertical climate change caused by the height difference is more obvious than the north–south climate difference caused by the latitude difference [43].
This study provided a comprehensive analysis of the spatiotemporal variation of spring frost in Xinjiang and proposed classification criteria for spring frost applicable to Xinjiang, which fills the gap of related studies in Xinjiang. Nonetheless, the detailed climatic background that resulted in the spatiotemporal variation of spring frost in the region still needs to be analyzed and is a scientific issue worthy of further investigation.
5. Conclusions
In this study, on the basis of the daily average temperature data of 40 stations in the Xinjiang Uygur Autonomous Region from 1971 to 2020, the spatiotemporal variation of spring frost in Xinjiang was analyzed by Kriging interpolation, trend analysis, the M–K test, and wavelet analysis. The conclusions are as follows:
- (1)
- Spatially, the frequency of spring frost in Xinjiang gradually increased from south to north, with the characteristic that the frequency in Northern Xinjiang is higher than that in Southern Xinjiang. Meanwhile, moderate and severe spring frost events occurred mainly in Northern Xinjiang.
- (2)
- In terms of time, spring frost occurred most frequently in April in Northern Xinjiang and in March in Southern Xinjiang. In terms of interannual trends, the frequency of spring frost events in the whole and Northern Xinjiang showed a nonsignificant increasing trend with a growth rate of 0.5 times/10 a, whereas Southern Xinjiang showed a nonsignificant decreasing trend at −0.02 times/10 a. For the three degrees of spring frost events, the overall frequency of mild spring frost events decreased with a rate of 0.0145 times/10 a, whereas medium and severe spring frost events showed a nonsignificant increasing trend at 0.034 and 0.032 times/10 a, respectively.
- (3)
- For mutability, the M–K test was used to analyze the mutation years of the frequency in the study area. Different degrees of mutation were found in all three regions, and there were more mutation years. Specifically, the mutation years in the whole territory were mainly between 1971 and 1988 and 2020. The frequency of spring frost in Northern Xinjiang was relatively stable, and the mutation years were mainly from 1972 to 1980. In Southern Xinjiang, the abrupt changes were mainly concentrated in 1990–1992, 2008, 2010, and 2012.
- (4)
- With regard to periodicity, a significant quasi-15-year cycle turbulence in the frequency of spring frost occurrence existed in the whole territory in the past 50 years, and there was a 20-year cycle turbulence in the northern territory and a 15-year cycle turbulence in the southern territory. On multiple time scales, the periodicity was more pronounced in the whole Xinjiang and Northern Xinjiang, whereas the periodicity was weaker in Southern Xinjiang without a significant main cycle of oscillation. The time scales of 4, 7, and 22 years were the first main cycles for the whole, Northern, and Southern Xinjiang, respectively. The analysis revealed that all three study areas are currently in a period of low frequency of spring frost occurrence, and the results are consistent with the results of linear trend analysis.
Author Contributions
Methodology and investigation, Z.Y. and Z.X.; data curation, and writing—original draft preparation, Z.Y.; writing—review and editing, Z.Y., Z.X. and Y.W.; funding acquisition, Z.X. All authors have read and agreed to the published version of the manuscript.
Funding
The research was funded by National Natural Science Foundation of China (NSFC 41761013) and Xinjiang Uygur autonomous region innovation environment construction special project & science and technology innovation base construction project (PT2107).
Data Availability Statement
The data used in this study are from the data center of China Meteorological Administration (http://data.cma.cn, accessed on 9 March 2021).
Conflicts of Interest
The authors declare no conflict of interest.
References
- Liu, X.F.; Zhu, X.F.; Pan, Y.Z.; Zhao, A.Z.; Li, Y.Z. Spatiotemporal changes of cold surges in Inner Mongolia between 1960 and 2012. J. Geogr. Sci. 2015, 25, 259–273. [Google Scholar] [CrossRef]
- Noh, I.; Lee, S.-J.; Lee, S.; Kim, S.-J.; Yang, S.-D. A High-Resolution (20 m) Simulation of Nighttime Low Temperature Inducing Agricultural Crop Damage with the WRF–LES Modeling System. Atmosphere 2021, 12, 1562. [Google Scholar] [CrossRef]
- Hartmann, D.L.; Tank, A.M.K.; Rusticucci, M.; Alexander, L.V.; Brönnimann, S.; Charabi, Y.A.R.; Dentener, F.J.; Dlugokencky, E.J.; Easterling, D.R.; Kaplan, A. Observations: Atmosphere and surface. In Climate Change 2013 the Physical Science Basis: Working Group I Contribution to the Fifth Assessment Report of the Intergovernmental Panel on Climate Change; Cambridge University Press: Cambridge, UK, 2013; pp. 159–254. [Google Scholar]
- Valjarević, A.; Filipović, D.; Valjarević, D.; Milanović, M.; Milošević, S.; Živić, N.; Lukić, T. GIS and remote sensing techniques for the estimation of dew volume in the Republic of Serbia. Meteorol. Appl. 2020, 27, e1930. [Google Scholar] [CrossRef]
- Liu, L.S. Study on Time Symmetry of Meteorological Disasters in Xinjiang. Master’s Thesis, Shanxi Normal University, Xi’an, China, 2014. [Google Scholar]
- Sang, J.; Hao, L. Spatio-temporal patterns of typical agro-meteorological disasters in China in past 30 years. Chin. J. Eco-Agric. 2018, 26, 1302–1314. [Google Scholar]
- Zhu, Y.L.; Wang, H.; Wang, T.; Guo, D. Extreme spring cold spells in North China during 1961–2014 and the evolving processed. Atmos. Ocean. Sci. Lett. 2018, 11, 432–437. [Google Scholar]
- You, H.; Zhou, H.; Yang, H.; Jiang, Y. Analysis on the Late Spring Coldness Processes in Yunnan. Meteorol. Mon. 2013, 39, 738–748. [Google Scholar]
- Vitasse, Y.; Rebetez, M. Unprecedented risk of spring frost damage in Switzerland and Germany in 2017. Clim. Chang. 2018, 149, 233–246. [Google Scholar] [CrossRef]
- Wang, S.; Chen, J.; Rao, Y.H.; Liu, L.C.; Wang, W.Q.; Dong, Q. Response of winter wheat to spring frost from a remote sensing perspective: Damage estimation and influential factors. ISPRS J. Photogramm. Remote Sens. 2020, 168, 221–235. [Google Scholar] [CrossRef]
- Peterson, A.G.; Abatzoglou, J.T. Observed changes in false springs over the contiguous United States. Geophys. Res. Lett. 2014, 41, 2156–2162. [Google Scholar] [CrossRef]
- Leolini, L.; Moriondo, M.; Fila, G.; Costafreda-Aumedes, S.; Ferrise, R.; Bindi, M. Late spring frost impacts on future grapevine distribution in Europe. Field Crops Res. 2018, 222, 197–208. [Google Scholar] [CrossRef]
- Vitasse, Y.; Bottero, A.; Cailleret, M.; Bigler, C.; Fonti, P.; Gessler, A.; Levesque, M.; Rohner, B.; Weber, P.; Rigling, A.; et al. Contrasting resistance and resilience to extreme drought and late spring frost in five major European tree species. Glob. Chang. Biol. 2019, 25, 3781–3792. [Google Scholar] [CrossRef] [PubMed]
- Ma, Q.; Huang, J.G.; Hanninen, H.; Berninger, F. Divergent trends in the risk of spring frost damage to trees in Europe with recent warming. Glob. Chang. Biol. 2019, 25, 351–360. [Google Scholar] [CrossRef] [PubMed] [Green Version]
- Eccel, E.; Rea, R.; Caffarra, A.; Crisci, A. Risk of spring frost to apple production under future climate scenarios: The role of phenological acclimation. Int. J. Biometeorol. 2009, 53, 273–286. [Google Scholar] [CrossRef] [PubMed]
- Qiang, Y.H.; Gao, Y.; Lu, Z. Characteristics of the Late Spring Coldness and Its Cause Analysis in Lishui. Meteorol. Environ. Sci. 2011, 34, 62–64. [Google Scholar]
- Lu, Y.; Shen, Y.; Yang, Q.Q.; Jiang, L. Meteorological Indexes of Late Spring Cold in Jiangsu Province. J. Henan Sci. 2021, 39, 1333–1339. [Google Scholar]
- Yang, W.G.; Huang, Y.X.; Liu, K.Q.; Fan, J.J.; Meng, C.L. Study on the Meteorological Index and Grading of Late Spring Coldness. Hubei Agric. Sci. 2018, 57, 49–53. [Google Scholar]
- Xu, Y.Y.; Chang, J. Spatial and temporal Distribution Analysis of Late Spring Cold in Henan Province based on EEMD Method. Meteorol. Environ. Sci. 2017, 40, 28–32. [Google Scholar]
- Gao, C.; Xing, L.Z.; Zhang, F.M.; Wen, C.; Liu, Q.; Li, L.X. Spatio-temporal distribution characteristics of late spring cold in Shandong Province. Jiangsu Agric. Sci. 2020, 48, 238–245. [Google Scholar]
- Zhao, G. The Spatial-Temporal Dynamics of Late Spring Coldness in Jiangsu and It Influence on Agriculture and Forestry. Master’s Thesis, Nanjing University of Information Science & Technology, Nan’jing, China, 2018. [Google Scholar]
- Li, D.P.; Zhang, K.J.; Zhang, L.; Dong, H.Y.; Guo, L.N.; Liu, X.G. Spatial and temporal characteristics and meteorological indexes of late spring coldness in Qingdao. Chin. J. Eco-Agric. 2020, 28, 1673–1681. [Google Scholar]
- Ci, H.; Zhang, Q.; Singh, V.P.; Xiao, M.; Liu, L. Spatiotemporal properties of growing season indices during 1961–2010 and possible association with agroclimatological regionalization of dominant crops in Xinjiang, China. Meteorol. Atmos. Phys. 2016, 128, 513–524. [Google Scholar] [CrossRef]
- Luo, J.; Dai, J.M.; Yang, H.; Qu, L.L.; Zhao, X. Climatic Characteristics of Cold Wave in Xinjiang during the Period of 1971–2014. Arid. Zone Res. 2017, 34, 309–315. [Google Scholar]
- Sun, S.F.; Zhang, G.X.; Li, M. Evolution features of frontal structure on the 22nd april 2014 cold wave process in Xinjiang. Desert Oasis Meteorol. 2018, 12, 40–48. [Google Scholar]
- Zhang, L.M.; Zhuang, X.C.; Hu, L. Analysis of a strong cold wave process in Aletai Area. J. Arid. Meteorol. 2010, 28, 71–75. [Google Scholar]
- Chen, H.W.; Ma, Y.; Wang, Y.; Yang, L.X. Climatic Characteristics of Hail Weather in Xinjiang. Meteorol. Mon. 2003, 11, 25–28. [Google Scholar]
- Abul, R.; Niu, S.J.; Wang, H.Y. Spatial temporal distribution characteristics of hail in Xinjiang. J. Nat. Disasters 2013, 22, 158–164. [Google Scholar]
- Shi, L.M.; Zhao, Z.P.; Wang, X. The temporal and spatial distribution features of hail disaster in Xinjiang from 1961 to 2014. J. Glaciol. Geocryol. 2015, 37, 898–904. [Google Scholar]
- Chen, Y.; Ma, Y. Spatial and temporal characteristics of flood and rainstorm disaster in Xinjiang. Arid. Land Geogr. 2021, 44, 1515–1524. [Google Scholar]
- Wang, N.; Cui, C.X.; Liu, Y. Temporal-spatial characteristics and the influencing factors of rainstorm-flood disasters in Xinjiang. Arid. Zone Res. 2020, 37, 325–330. [Google Scholar]
- China Meteorological Administration. Meteorological Industry Standard of the People’s Republic of China: Division of Climate and Seasons QX/T 152—2012; Meteorological Press: Beijing, China, 2012.
- Fu, W.D. The Influence of Latest Frost and Microthermal Damage in Spring on the Cotton’s Seeding Time. J. Arid. Land Resour. Environ. 2001, 02, 38–43. [Google Scholar]
- Zhang, X.W.; Zhang, J.B. Xinjiang Meteorological Manual; China Meteorological Press: Beijing, China, 2006; p. 204. [Google Scholar]
- Yu, X.J. Study on cold damage in spring in Xinjiang. Xinjiang Meteorol. 1993, 04, 42–48. [Google Scholar]
- Nyikadzino, B.; Chitakira, M.; Muchuru, S. Rainfall and runoff trend analysis in the Limpopo river basin using the Mann Kendall statistic. Phys. Chem. Earth 2020, 117, 102870. [Google Scholar] [CrossRef]
- Chen, X.; Li, F.-W.; Feng, P. Spatiotemporal variation of hydrological drought based on the Optimal Standardized Streamflow Index in Luanhe River basin, China. Nat. Hazards 2018, 91, 155–178. [Google Scholar] [CrossRef]
- Rigby, J.R.; Porporato, A. Spring frost risk in a changing climate. Geophys. Res. Lett. 2008, 35, L12703. [Google Scholar] [CrossRef]
- Chen, H.Y.; Qiu, B.J.; Zuo, D.K. Xinjiang Climate and Its Relationship with Agriculture; China Science Press: Beijing, China, 1963; pp. 177–178. [Google Scholar]
- Xu, D.Y. Agroclimatic Resources and Regionalization in Xinjiang; China Science Press: Beijing, China, 1989; pp. 91–92. [Google Scholar]
- Xu, D.Y.; Sang, X.C. Xinjiang Agricultural Climate; Xinjiang People ’s Publishing House: Urumqi, China, 1981; pp. 13–16. [Google Scholar]
- Zhang, S.H. The Circulation Background of Spring Coldness in Fujian. Meteorol. Mon. 1996, 03, 51–53. [Google Scholar]
- Shi, Y.G.; Wen, K.G. Annals of Meteorological Disasters in China (Xinjiang Volume) (Zhong Guo Qi Xiang Zai Hai Da Dian(Xinjiang Juan) Reference Pinyin); China Meteorological Press: Beijing, China, 2006; pp. 169–197. [Google Scholar]
- Han, R.Q.; Chen, L.J.; Li, W.J.; Zhang, P.Q. The spatial and temporal characteristics of China continuous cold rain weather and South Cold damage from february to may. J. Appl. Meteorol. 2009, 20, 312–320. [Google Scholar]
- Zohner, C.M.; Mo, L.; Renner, S.S.; Svenning, J.C.; Vitasse, Y.; Benito, B.M.; Alejandro, O.; Frederik, B.; Jean-François, B.; Veronica, S.; et al. Late-spring frost risk between 1959 and 2017 decreased in North America but increased in Europe and Asia. Proc. Natl. Acad. Sci. USA 2020, 117, 12192–12200. [Google Scholar] [CrossRef]

Publisher’s Note: MDPI stays neutral with regard to jurisdictional claims in published maps and institutional affiliations. |
© 2022 by the authors. Licensee MDPI, Basel, Switzerland. This article is an open access article distributed under the terms and conditions of the Creative Commons Attribution (CC BY) license (https://creativecommons.org/licenses/by/4.0/).