Abstract
Fire activity in 288 areas (2.5° N × 10° E) in the Arctic region (50°–70° N, 0°–360° E) was analyzed using about 4.4 million satellite hotspot (HS) data from 2002 to 2021. A total of 21 high fire density areas from eastern Europe to western Canada were selected, and their fire–weather conditions during each active fire period were analyzed using about 1820 various weather maps at the upper and the lower air level. Analysis results showed that the active fires in the Arctic region occurred under the fire–weather conditions associated with the northward movement of cut-off high (COH) and warm air masses detached from the south caused by large westerly meandering (LWM). LWM is a sign of the beginning of an active fire period. Very active fires on HS peak days occurred several days after the start of the northward movement of COHs and under mainly high-pressure conditions in the upper air and strong wind conditions in the lower air. The time lag of these several days suggests that we may be prepared for very active fires. The fire–weather analysis approach described in this paper has shown that future large-scale fire outbreaks are predictable.
1. Introduction
Arctic amplification (AA), referring to the enhancement of near-surface air temperature changes over the Arctic relative to lower latitudes, is a prominent feature of climate change with important impacts on human and natural systems [1]. The strong amplification of global warming in the Arctic has accelerated the thaw rate of the permafrost [2] and fire activity. Weather and climate are the most important factors influencing fire activity and these factors are changing due to human-caused climate change [2].
Under a warmer climate in the future, more severe fire weather, more area burned, more ignitions, and a longer fire season are expected [3]. An impending shift to a temperature-driven global fire regime in the 21st century is creating an unprecedentedly fire-prone environment [4]. In recent years, the pan-Arctic region has experienced increasingly extreme fire seasons [5]. Fire frequencies under conditions by 2050 are projected to increase by approximately 27% globally, relative to the levels in 2000, with changes in future fire meteorology playing the most important role in enhancing global wildfires [6].
Gillett et al., [7] have suggested that the observed increase in the total area burned in Canada during the last four decades is the result of human-induced climate change. Additionally, it appears that temperature is the most important predictor of total area burned in Canada and Alaska, with warmer temperatures associated with increased area burned [8,9].
Siberia is within the region of observed and predicted future accelerated climate change [10]. Increased air temperature may lead to an increase in wildfire frequency and total burned area [11]. According to some previous publications, the annual burned area in Russia was estimated at 40–200 thousand km2 [12,13]. According to official data, the annual burned area was 5.5–24 thousand km2 [14]. More than 70%, and up to 90% (i.e., 20–140 thousand km2 annually), of the total area burned in Russia occurred in Siberia [13,15].
The majority (>50%) of wildfires in Siberia were observed among larch trees (Larix sibirica), because they dominate forest communities and have low crown closures that easily spread surface fires [11]. The dense lichen and moss ground cover can support severe ground fires, covering up to several million hectares. Due to the shallow root zone (limited by permafrost), those wildfires were mostly stand-replacing fires [16]. Thus, the largest area of stand-replacement fires (5800 km2) in the last decade occurred in Sakha (northeast Siberia) [17].
Fire size is sensitive to weather in the days and weeks following ignition, particularly the post-ignition timing of precipitation [18]. For example, prolonged periods of warm and dry conditions coinciding with atmospheric blocking that persists for several weeks after ignition enables the growth of large forest fires. Extensive fires in 2004 may have been related to a persistent blocking ridge over Alaska [19,20]. The burned area in the North American boreal forest was controlled by the frequency of mid-tropospheric blocking highs that caused rapid fuel drying [21,22]. Furthermore, 500 hPa height anomalies were well correlated with the seasonal burned area over large regions of Canada and Alaska [23,24].
In earlier work, we collaborated with researchers in Alaska and Sakha in 2005 to analyze wildland fire using fire history and weather data (rainfall, temperature, and wind). Increased fire activity has been observed in Sakha and Alaska as temperatures have risen since around 1990 [2,7,25,26,27]. Subsequently, we performed a daily fire analysis using daily hotspot (HS) data and weather maps, including temperature and wind, to understand fire weather during the active fire period in eastern Siberia and Alaska. Our analysis results [28,29,30,31] clearly showed that fires during all active fire periods became very active as warm air masses (cTe: continental temperate [32]) from the south approached the four study regions. These movements of warm air masses were mainly related to the meandering of large westerlies. Strong wind conditions occurred when warm and dry air masses were approaching, stagnating, and passing over southern Sakha under various weather conditions at the lower air level [28,29,30,31].
This paper focuses on fires in North Eurasia and North America. Fire weather during active fire periods in 288 areas (2.5° N × 10° E) in the Arctic region (50°–70° N, 0°–360° E) was analyzed using various weather and temperature maps at the upper air and the lower air (925, 500, 200 hPa) to discuss fire activities in each area.
2. Material and Methods
2.1. Study Region
The study region is shown in Figure 1 and named as the Arctic region that covers the northern region of Eurasia and North America (50°–70° N, 0°–360° E) in this paper. The study region is divided into 288 areas (2.5° N × 10° E) to find fire prone areas and to discuss their fire weather conditions and fire regimes.
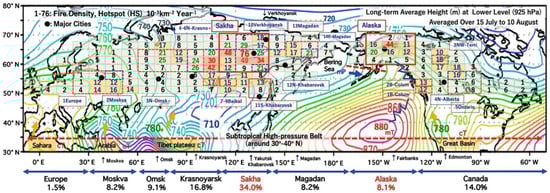
Figure 1.
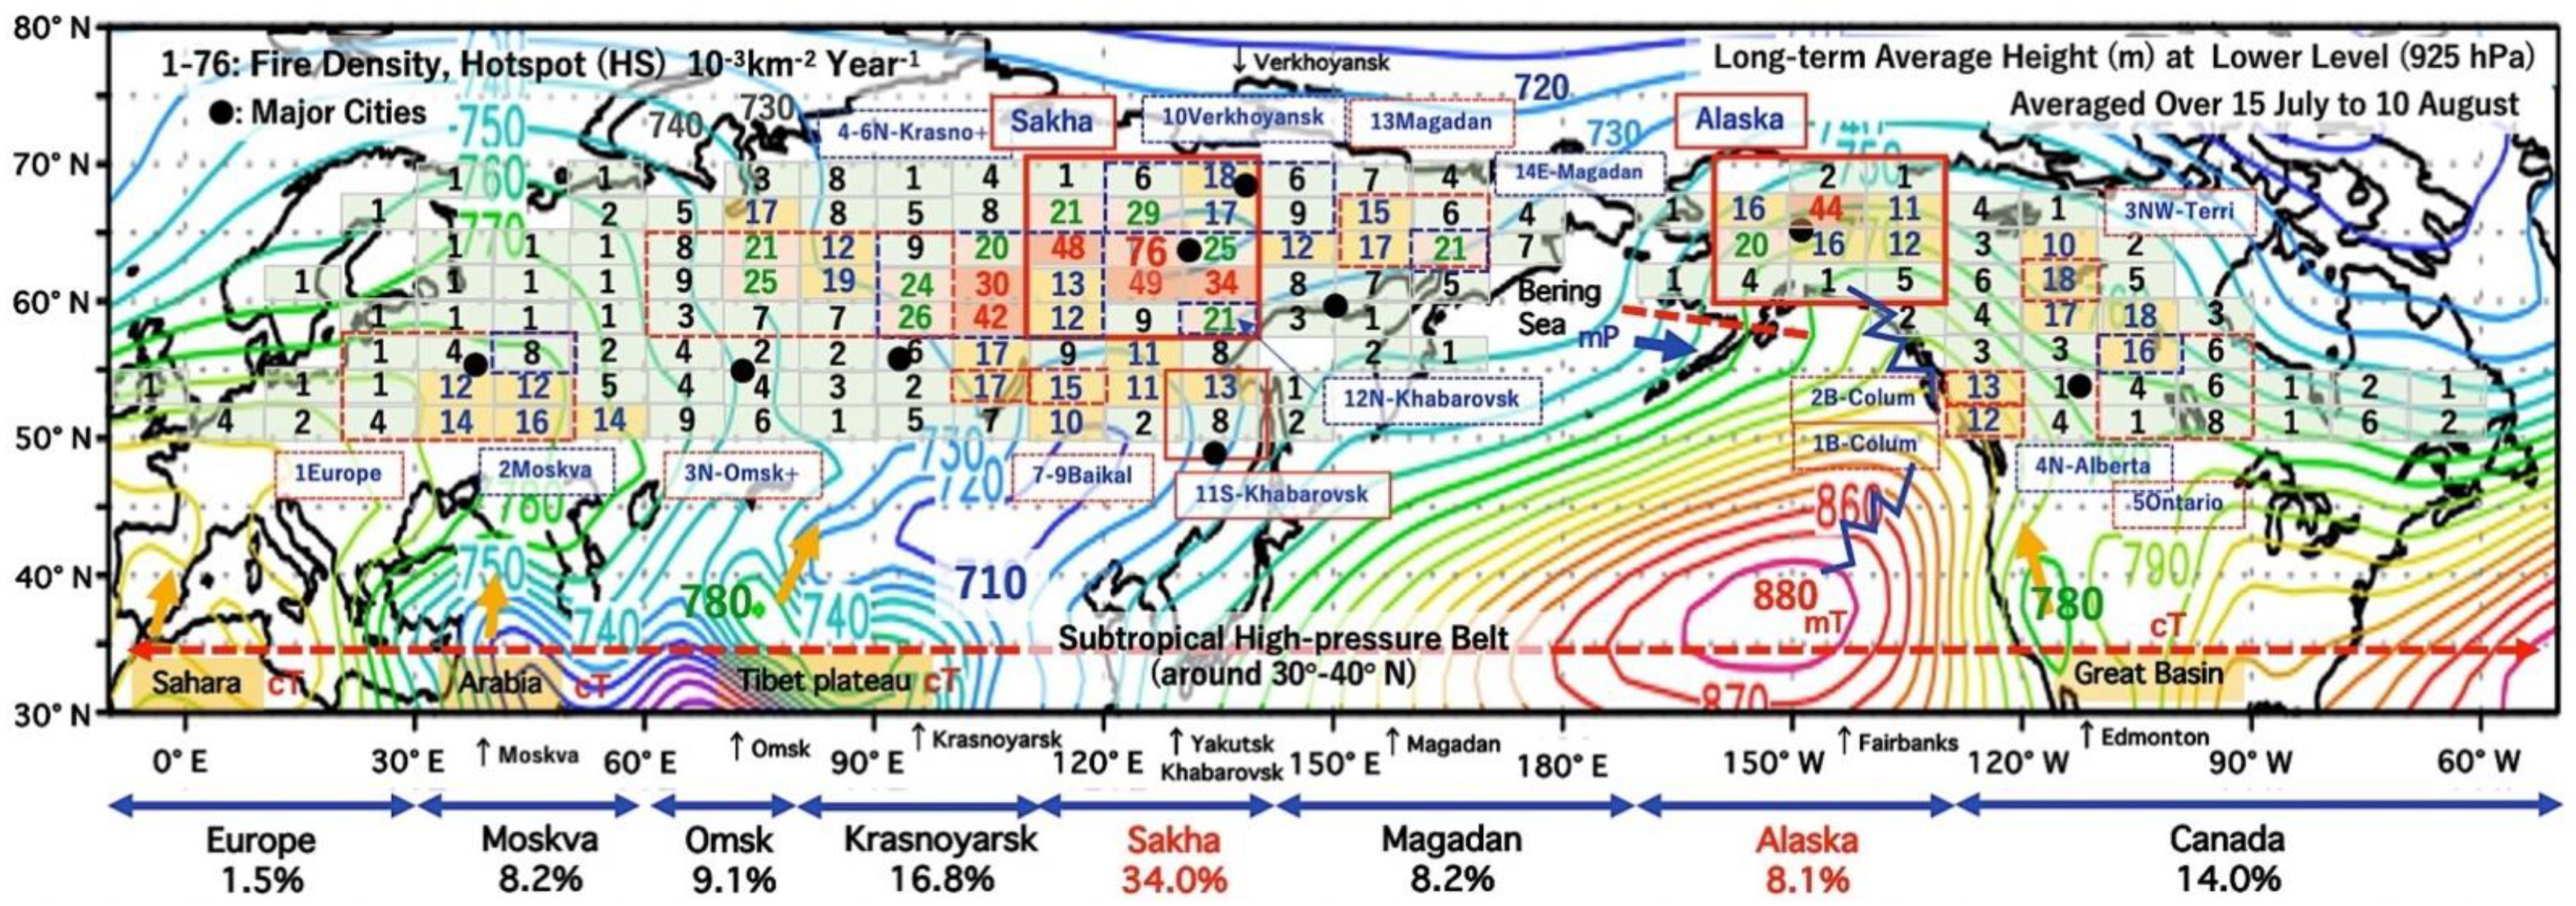
Map of part of the northern hemisphere (30°–80° N, −10°–310° E). The Arctic study region (50°–70° N, 0°–360° E) was divided into 288 areas (2.5° N × 10° E), showing their fire density (hotspot (HS) 10−3 km−2 Year−1). The area of each cell is calculated geometrically and does not consider landscapes such as seas and mountains. The fire density of each cell is indicated by the numbers 1 to 75 (smaller than 1 is not shown). Eight wide area names by longitude (20°–80° E)) are shown at the bottom of the figure such as “Europe”, “Moskva”, etc. Two rectangles with a red solid line show two major study regions of Sakha and Alaska. Rectangles with a red or blue dotted line show other study areas and their names are found near them, such as “3N-Omsk+”. The first number in the name is given in order from the west side and used in Table 1 and Table 2, such as “E2.Moskva”. The only exception area is “11S-Khabarovsk”, with a red solid line, analyzed in our past paper [30]. Based on those area names, abbreviatations in Table 1 and Table 2 are created according to their respective abbreviation formats. Major cities are indicated by black circles and their names are shown at the bottom of the figure. The base map is the lower air (925 hPa) weather map (long-term average map for 74 years from 1948) obtained from the NCEP/NCAR 40-year reanalysis data.
2.2. Hotspot (Fire) and Weather Data
Hotspot (HS) data over 20 years (from 1 July 2002 to 31 August 2021) detected by moderate resolution imaging spectroradiometer (MODIS) on the Terra and Aqua satellites were used to evaluate fires in the Arctic region. MODIS HS data were obtained from the NASA Fire Information for Resource Management System [33]. MODIS has a pixel resolution of 1 km. The number of daily HSs is used to identify an active fire period and the important dates of major HS peaks during the fire periods.
Active fire occurrence and weather conditions were also confirmed by checking the satellite imageries (corrected reflectance (true color), MODIS on Terra) of Worldview [34]. Worldview provides various fire-related information such as smoke from fire, smoke direction, surface conditions, cloud distribution, clear sky area, etc.
Various daily and long-term (74-year average from 1948) weather maps such as pressure, wind, and temperature at the upper air level (500 and 200 hPa) and the lower air level (925 hPa) are obtained from the NCEP/NCAR 40-year reanalysis data [35]. We analyzed them to find fire–weather conditions during active fire periods, fire-related synoptic scale circulation patterns, movement of warm and cool air masses, etc. We call air masses continental tropical (cT), maritime tropical (mT), and maritime polar (mP) in this paper. Coverage and spatial resolution of the NCEP reanalysis data are: geographic longitude and latitude: 0.0°–358.125° E, −88.542° N to 88.542° N; spatial resolution: about 2.5° × 2.5°; period and temporal resolution: 1 January 1948 to now, 6-hourly, daily, and monthly [35].
As the above-mentioned weather maps are usually used for weather forecasts, fire forecasts and alerts could easily made by adding real-time fire information from satellite HS data.
2.3. Analysis Methods
MODIS hotspot data from 1 June 2002 to 31 August 2021 were used to identify fire history, fire activity during the summer from 1 June to 31 August, and distribution in the Arctic region. An active fire period is defined here as consecutive fire days when the number of daily HSs is greater than 500 for fires in Eurasia (Sakha) and greater than 300 for fires in North America (Alaska and Canada) [25].
Analysis using various weather and temperature maps at the lower (925 hPa) and upper air levels (925, 500, 200 hPa) was carried out to confirm fire–weather conditions during active fire periods [27,28,29,30,31]. Analysis was performed by adding temperature maps at the upper air and long-term average weather maps (to reassessment results) in addition to the conventional weather maps. We already analyzed these three items during 13 active fire periods in four boreal areas in Sakha, Alaska, Krasnoyarsk, and Khabarovsk, and reported active fire occurrences under cT [28,29,30,31].
3. Results
We analyzed fire occurrence tendencies and fire weather conditions in the Arctic regions from Europe to Canada as shown in Figure 1. Detailed discussions using weather and temperature maps will focus primarily on the two most fire-prone areas of Sakha in Eurasia and Alaska in North America in Section 3.3. Analysis of these two areas is also necessary for reassessment of the results reported by the authors in the past [27,28,29,31].
3.1. Fire Distribution and History in the Arctic Region
Figure 1 shows the distribution of fire density (hotspot (HS) 10−3 km−2 Year−1) in the Arctic region. The grand total number of HSs for the 20 years (2002 to 2021) was 4,398,053 and the average number of HSs was 219,903 annually. Over 40 (HS 10−3 km−2 Year−1) fire-density cells are found in Sakha (57.5–70° N, 110–140° E) and its surrounding areas and in Alaska. Three cells are in Sakha. One cell is in Alaska+ (including northern Canada, 60–70° N, 130–160° W) and Krasnoyarsk (57.5–60° N, 100–110° E), respectively. The highest fire-density cell (75 (HS 10−3 km−2 Year−1)) is found in the central cell (62.5–65° N, 120–130° E) of Sakha, where very active fires occurred under very strong winds in 2021 [31]. Fire-density cells of 10 to 40 (HS 10−3 km−2 Year−1) are found in several areas from Europe to Canada.
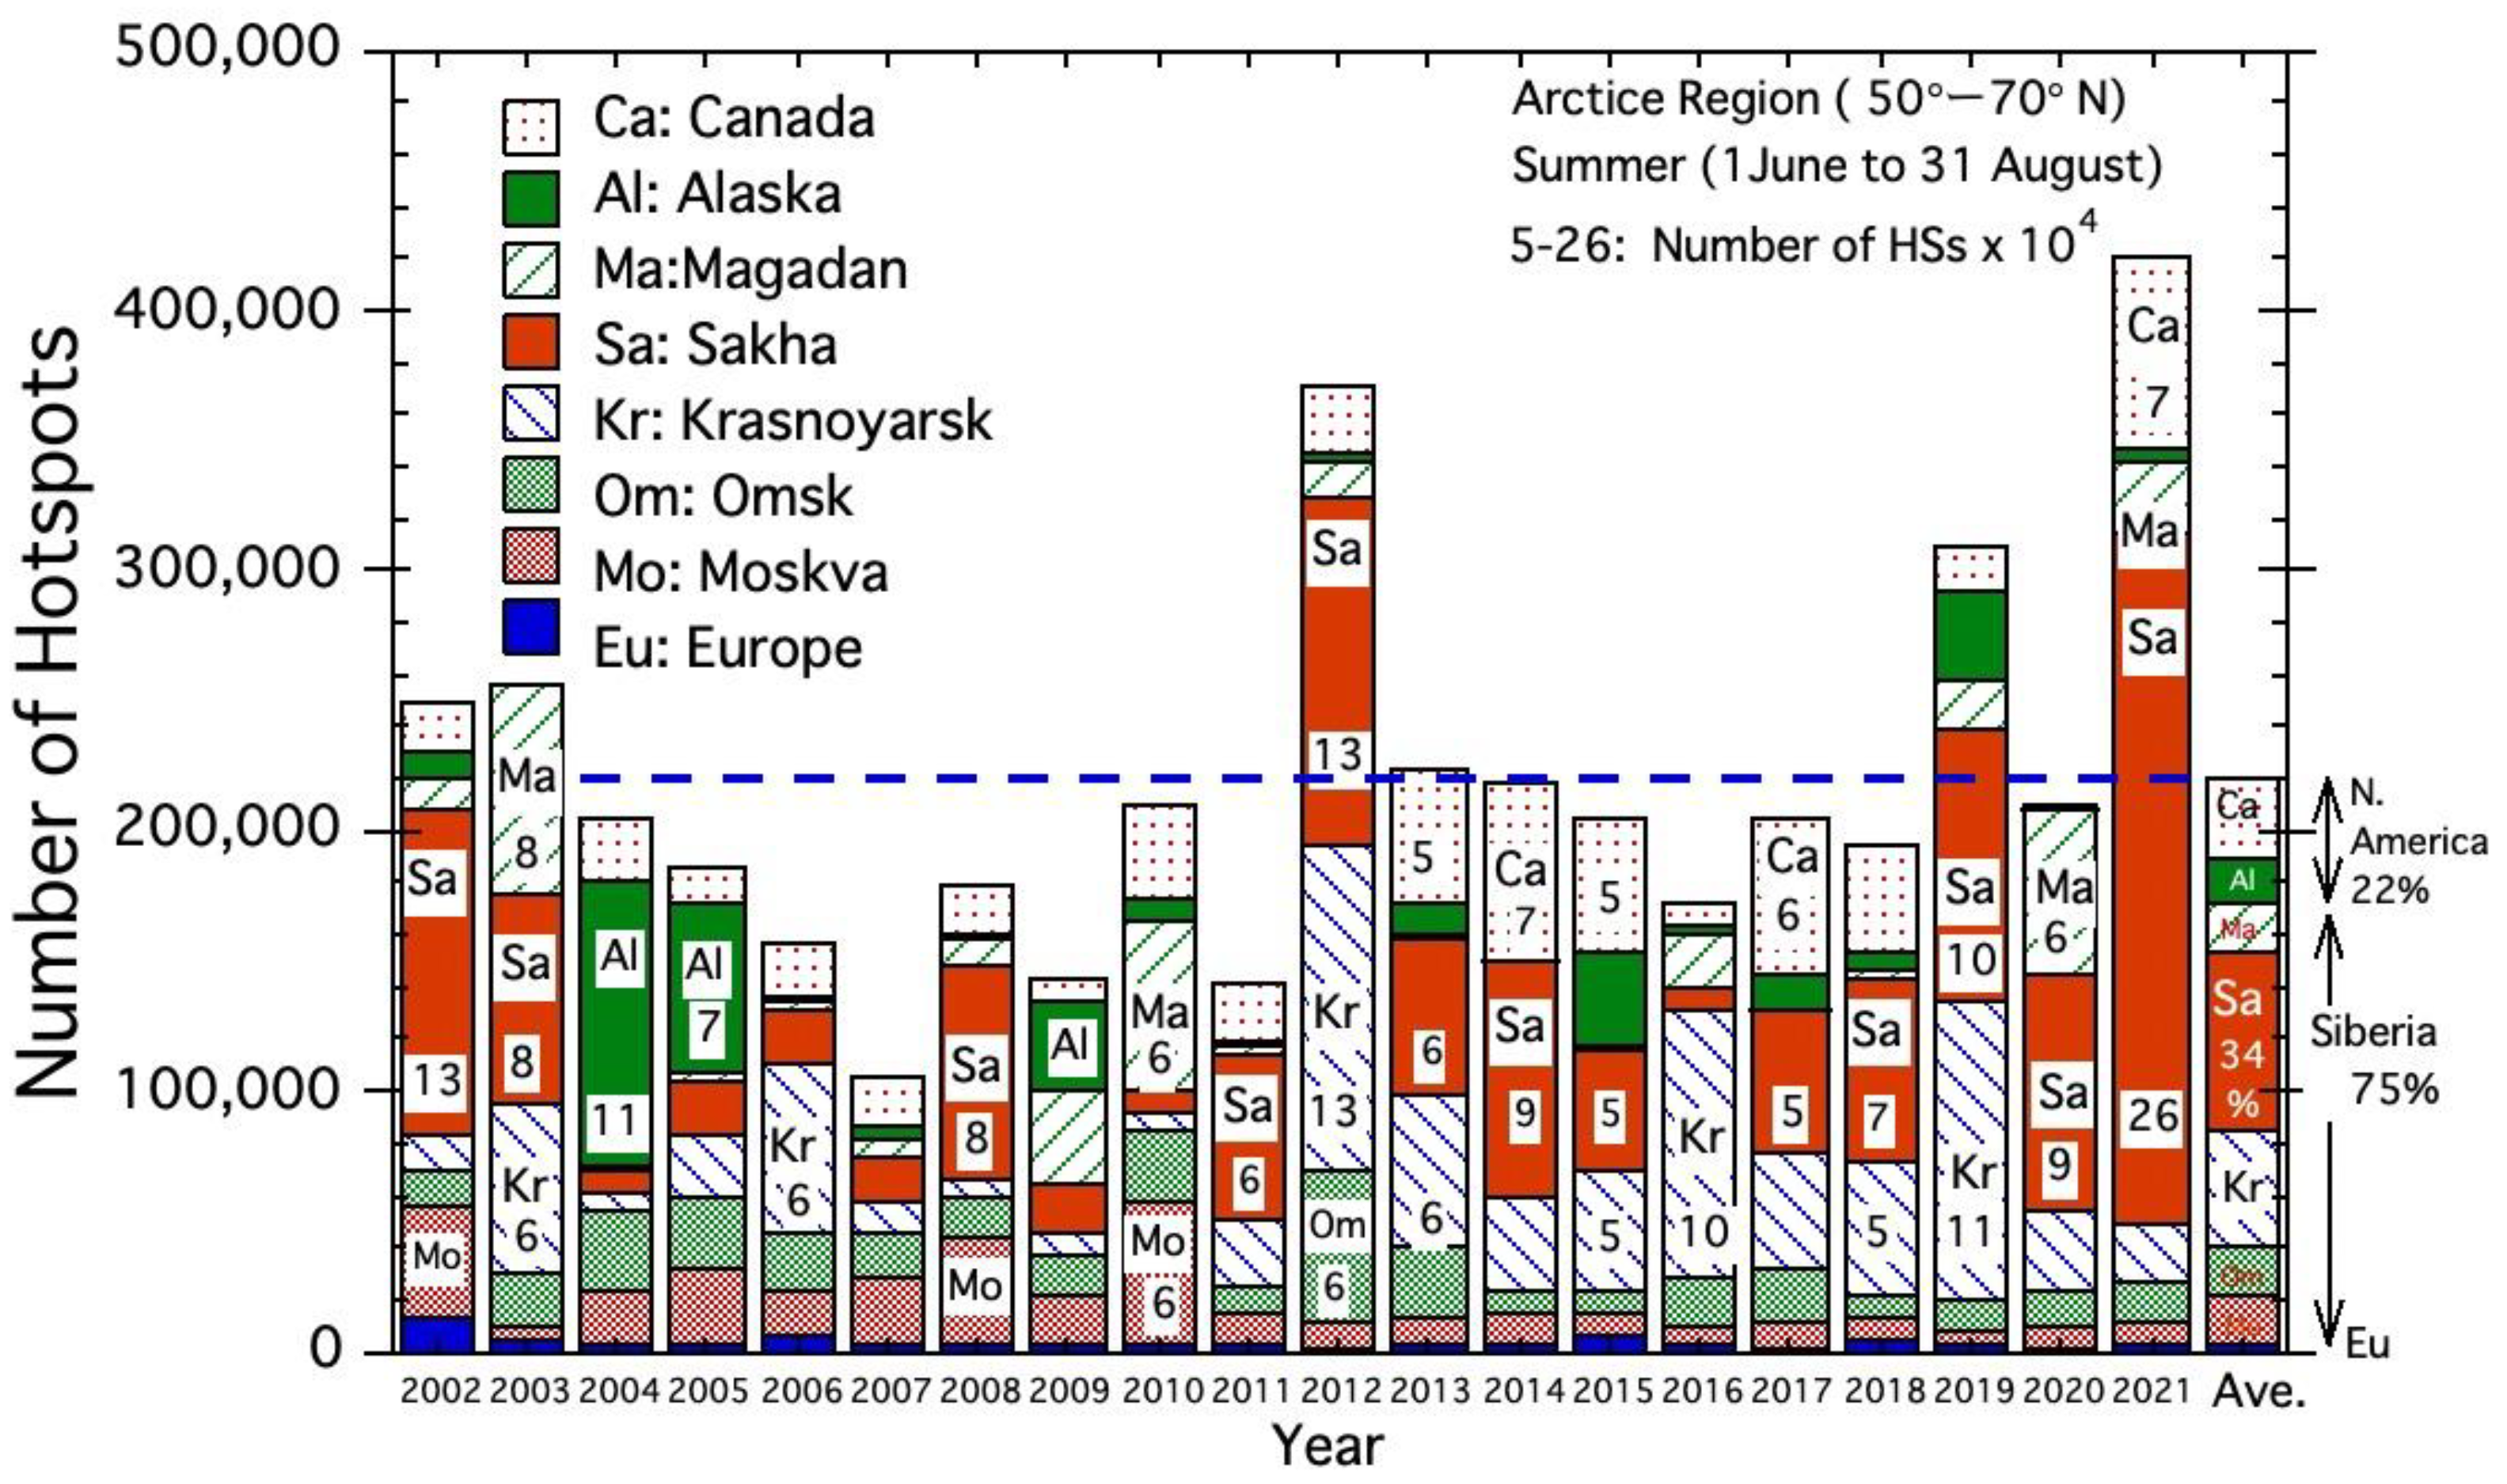
Figure 2 shows the fire history in the Arctic region during the 20 years from 2002 to 2021. The average annual number of HSs was about 220,000. Each bar graph in Figure 2 is divided into eight areas in the Arctic region shown at the bottom of Figure 1. The average bar graph in Figure 2 shows that about 75% of fires occurred in Eurasia (Siberia and Europe) and 22% in North America. Sakha alone is responsible for about 34% of all fires. Krasnoyarsk and Canada follow Sakha. Alaska is about 8%. One of the reasons for the high percentage for Sakha is mainly due to very active fires under very strong winds that occurred in 2021 [31].
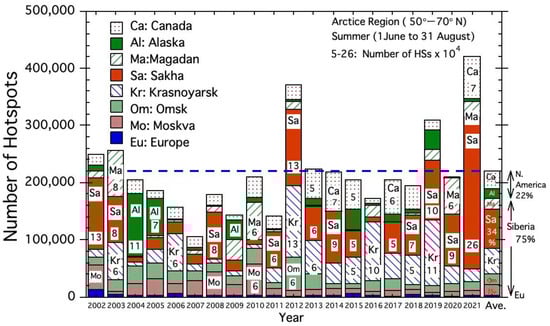
Figure 2.
Recent fire history in the Arctic region from 2002 to 2021. The eight regions are: Europe (10° W–30° E), Moskva (30°–60° E), Omsk (60°–80° E), Krasnoyarsk (80°–110° E), Sakha (110°–140° E), Magadan (140°–190° E), Alaska (190° E–30° W), and Canada (110°–50° W). These eight areas are shown by the different color and pattern of the bar graph with the number of HSs (approximate number, ×104).
3.2. High Fire Density Areas in the Arctic Region
Eight Arctic regions in Figure 2 are divided into 21 areas to discuss fire–weather conditions during each active fire period. These areas are selected by considering their fire density in Figure 1 and active fire occurrence during the last 20 years. A total of 21 areas are summarized in Table 1 for Eurasia and Table 2 for North America. In total, ten active fire periods (daily HS peaks exceeding 6000 in Sakha and 3000 in Alaska) are selected to discuss fire–weather conditions and summarized at the top of Table 1 and Table 2.

Table 1.
Top five active fires in Sakha and other active fires in Eurasia.
Table 2.
Top five active fires in Alaska and other active fires in North America.
Sakha, in the republic of the Russian Federation in eastern Siberia, lies between around 56–73° N and 106–160° E. HS (fire) data of 15 cells in Sakha (red rectangle at around 120° E in Figure 1) are analyzed. Yakutsk, the capital of Sakha, is located slightly east of the center of the study region “Sakha”. Alaska is one of states in the United States of America, located in the most northwest of North America (red rectangle in Figure 1). HS (fire) data of 12 cells in the Alaska+ area (red rectangle at around 150° W in Figure 1) that covers Alaska and northern Canada are analyzed. Fairbanks, the second largest city in Alaska, is located slightly west of the center of the study region “Alaska+”. Active fire periods in Sakha and Alaska are ranked according to the highest number of HSs during each fire period and named using the first initial of their name, weather condition (L,C,CH), ranking (1–5), and peak fire date (e.g., “S1L.2Aug.’21”, “A2C.15Aug.′05”, etc. See their format in Table 1 and Table 2). Their short names from S1L to S5L and from A1C to A5C without area name are used to create concise sentences for discussion.
Other areas, 14 in Eurasia and 5 in North America, are selected from relatively high fire-density cells more than about 10 (HS 10−3 km−2 Year−1) from Europe to Canada. We named them as Europe+, Moskva, N-Omsk, N-Krasno+, Baikal, S-Khabarovsk, N-Khabarovsk, Verkhoyansk, Magadan, E-Magadan, B-Colum, N-Alberta, Alberta, Ontario, NE-Terri, and N-Sakha. Their areas are shown by rectangles with a red and bule dotted line in Figure 1. We name them using the initial E or N, numbers in order from the west, weather condition (L,C,CH), and peak fire date (e.g., “E1C.Europe+20Aug.′02,”, “N1.B-Colum.12Aug. ’17,” etc. See their format in Table 1 and Table 2). They are summarized in Table 1 and Table 2. Their short names from E1C to E14C and from N1C to N6C without area name are used to create concise sentences for discussion.
3.3. Comparison of Fire Weather in Sakha and Alaska
3.3.1. Average Fire Activity during the Summer
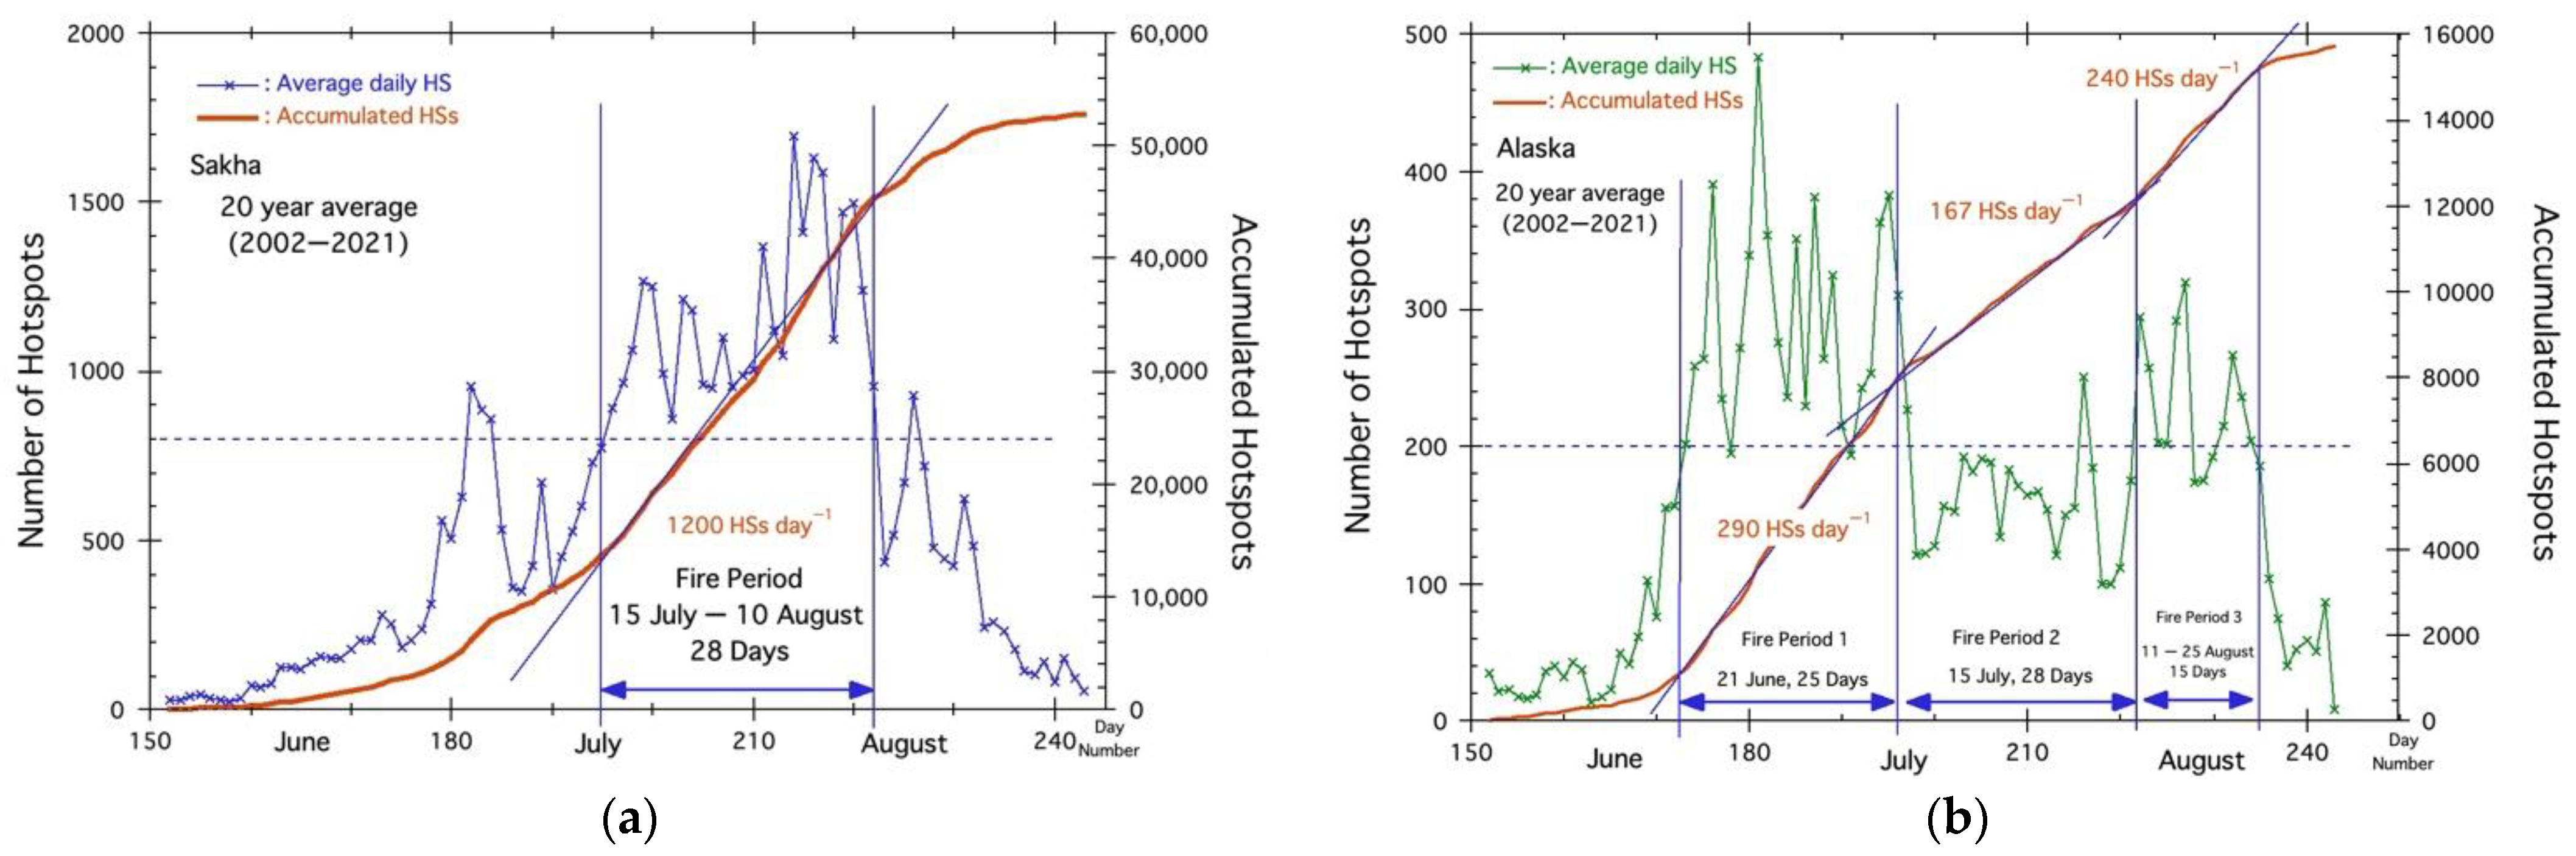
Figure 3 shows average daily HS for the last 20 years in Sakha and Alaska. Figure 3a shows daily fire trends during the summer from June 1 to August 31. A fire rate (HSs day−1) [29] is introduced to grasp fire activity during the summer. The fire rate is defined as follows:
where i and j are the day number (DN), j > i, i > DN = 2.
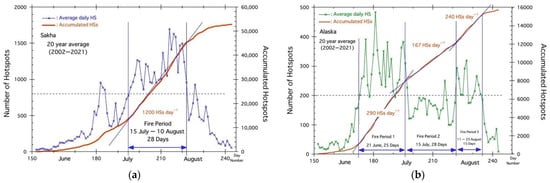
Figure 3.
Average Fire Period. (a) Sakha, (b) Alaska.
The fire rate (HSs day−1) derived from the gradient of the straight line on the accumulated HSs curve is used to evaluate active fire periods.
Figure 3a shows the daily HSs changes in Sakha during the summer. From 15 July, the number of daily HSs exceeded 800 and lasted until 10 August. The fire rate for this period, 1200 HSs day−1, is obtained from one straight line drawn on the accumulated HSs curve in Figure 3a. Thus, a 20-year average active fire period during summer is defined. Figure 1 is created to determine long-term average weather conditions in the lower air (925 hPa) during this period (15 July to 10 August).
A similar manner is applied to Alaska+. In Alaska, three straight lines are drawn on the accumulated HS curve in Figure 3b. Thus, three fire periods are defined from three different fire rates. The first fire period starts from 21 June, with 290 HSs day−1; the second period is from 15 July, with 167 HSs day−1; the third period starts from 11 August, with 240 HSs day−1.
In Sakha and Alaska, the total number of HSs is about 3.9 times different (52,500 versus 15,500), and the fire rate during the active summer fire period is 1200 versus 290, which is about 4.1 times different. Figure 1 is a long-term weather map of the Arctic region during the summer active fire period (15 July to 10 August) in Sakha.
3.3.2. Active Fire Period (Step 1/3)
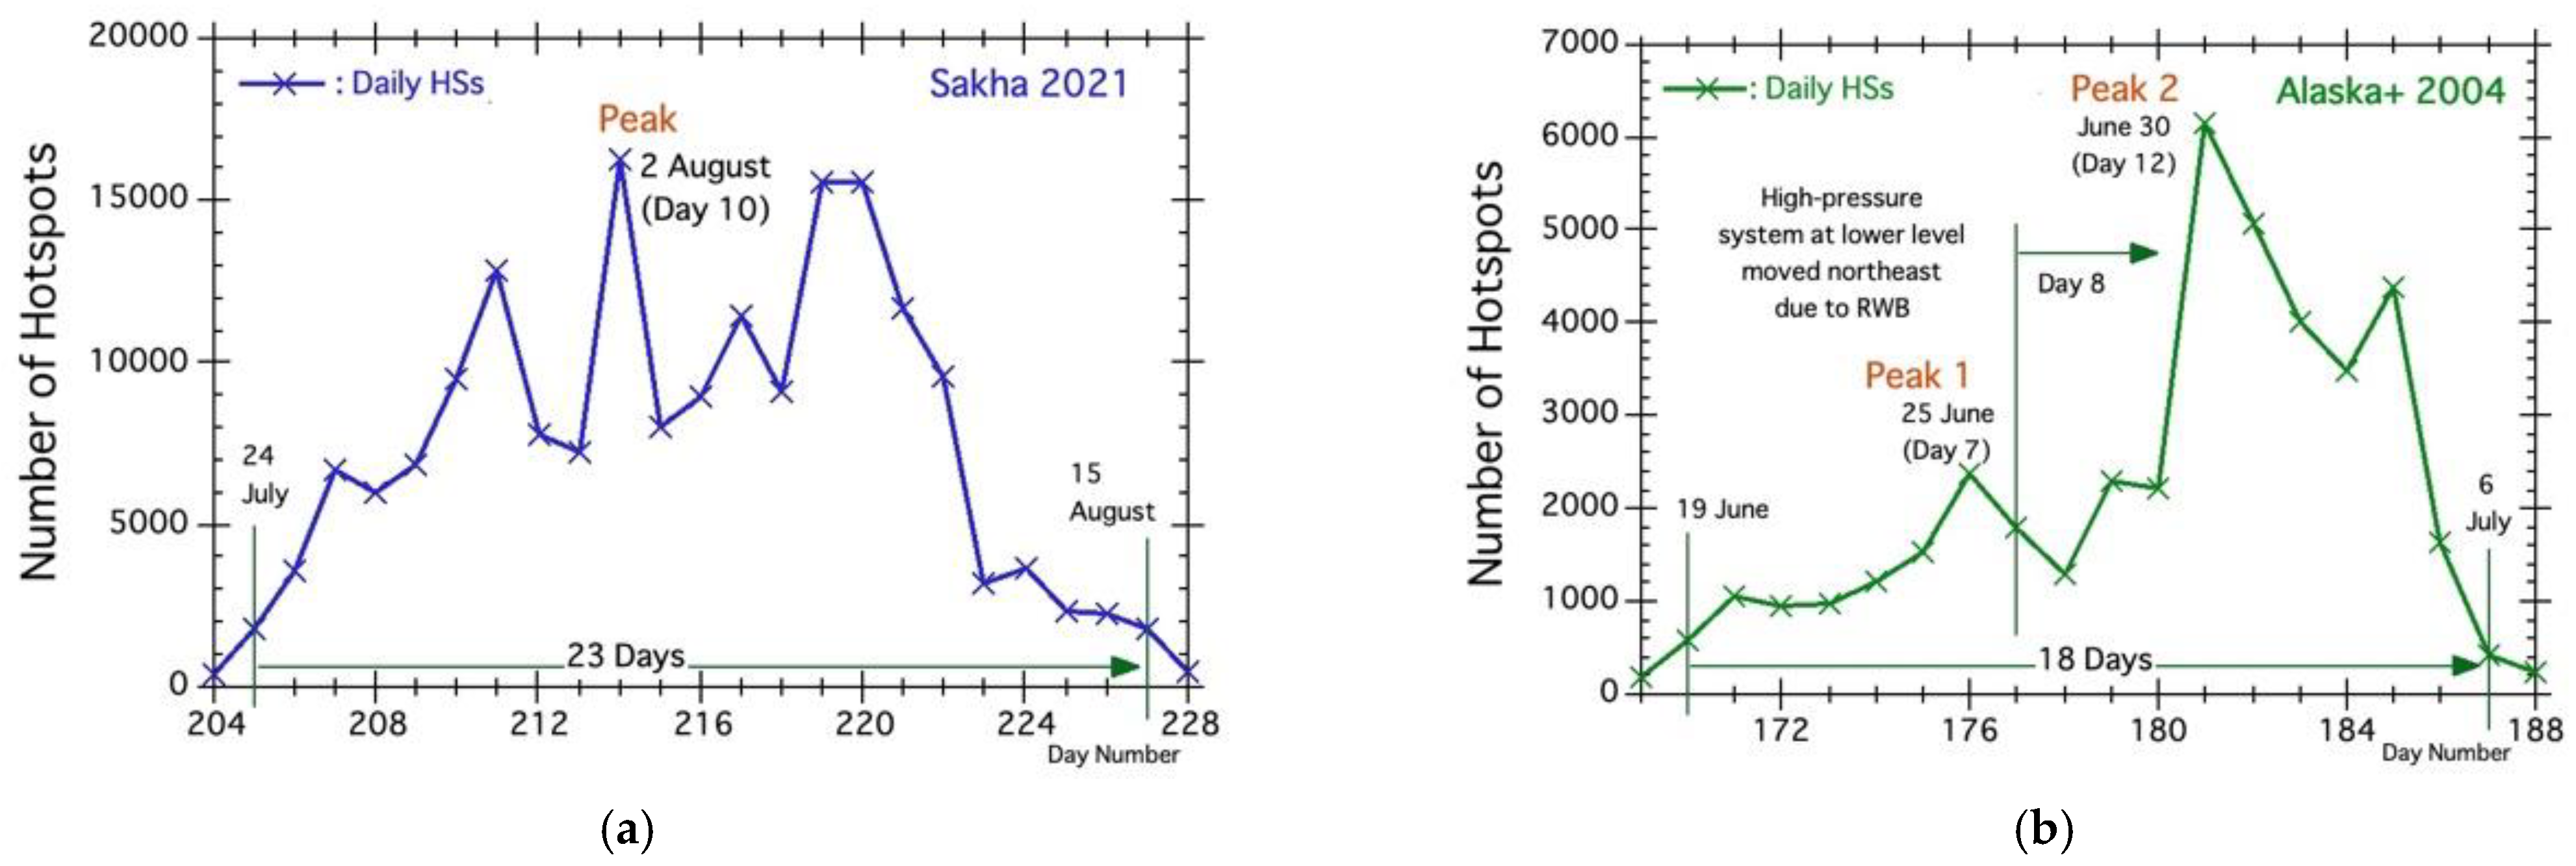
Daily fire activities during the top fire period “S1L.2Aug.′21” in Sakha and “A1C.30Jun.‘04” in Alaska are shown in Figure 4a,b. The number of HSs and the number of days during these two fire periods are summarized in Table 1 and Table 2.
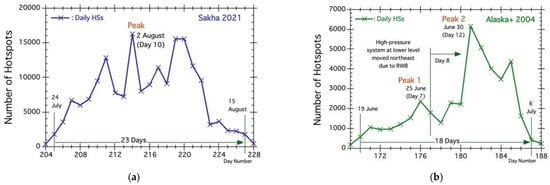
Figure 4.
2021 Fire Period. (a) Sakha, (b) Alaska.
In Sakha, very active fires occurred in 2021. The total number of HSs in 2021 exceeded 267,000; this is about 5.8 times the average number of fires over the last 19 years since 2002 [31]. A few HS peaks above 15,000 in Figure 4a were mainly created by strong winds. The highest HS peak during the fire period “S1L.2Aug.′21” in Figure 4a occurred under strong easterly winds (>10 m s−1) on 2 August 2021 [31]. The rapid increase in the number of HSs from about 500 to 16,000 in several days can be explained mainly by the increase in wind velocity [28,29,30,31].
In Alaska, several active fires occurred under similar unique high-pressure fire weather conditions related to Rossby wave breaking (RWB) [25]. Fire weather conditions related to RWB events typically result in two HS peaks occurring before and after high-pressure systems move from the south to the north across Alaska. A second HS peak (Peak 2) during the fire period “A1C.30Jun.′04” in Figure 4b occurred under strong easterly winds on 30 June 2004.
3.3.3. Initial Conditions: Onset of Large Westerly Meandering (LWM) (Step 2/3)
Major fire–weather conditions for the top five active fire periods in Sakha and Alaska will be discussed in this section and Section 3.3.5., briefly summarized in Table 3 and Table 4, and shown in Figure 5 and Figure 6. The names of each are the same as the names in Table 1 and Table 2. The other four items in the table are: (1) causes of LWM (500 hPa), (2) upper air weather conditions (500 hPa), (3) wind conditions in the lower air (925 hPa), and (4) warm air masses in the lower air (925 hPa). The first item (1) will be extracted from the weather map mainly on the first day of the active fire period and the other items from (2) to (4) will be obtained from the weather map and temperature map on the HS peak day.
Table 3.
Fire weather conditions of top five active fire periods in Sakha.
Table 4.
Fire weather conditions of top five active fire periods in Alaska.
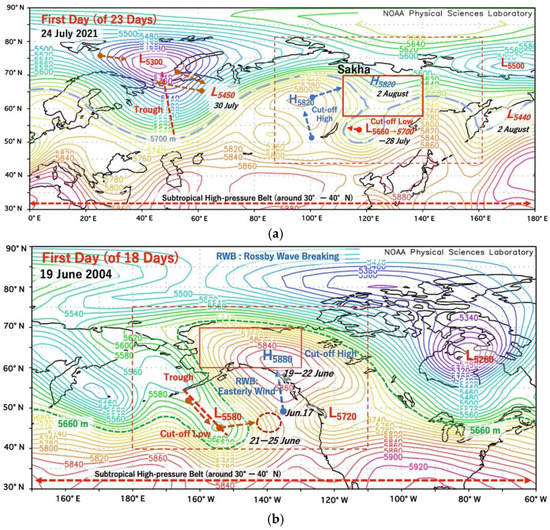
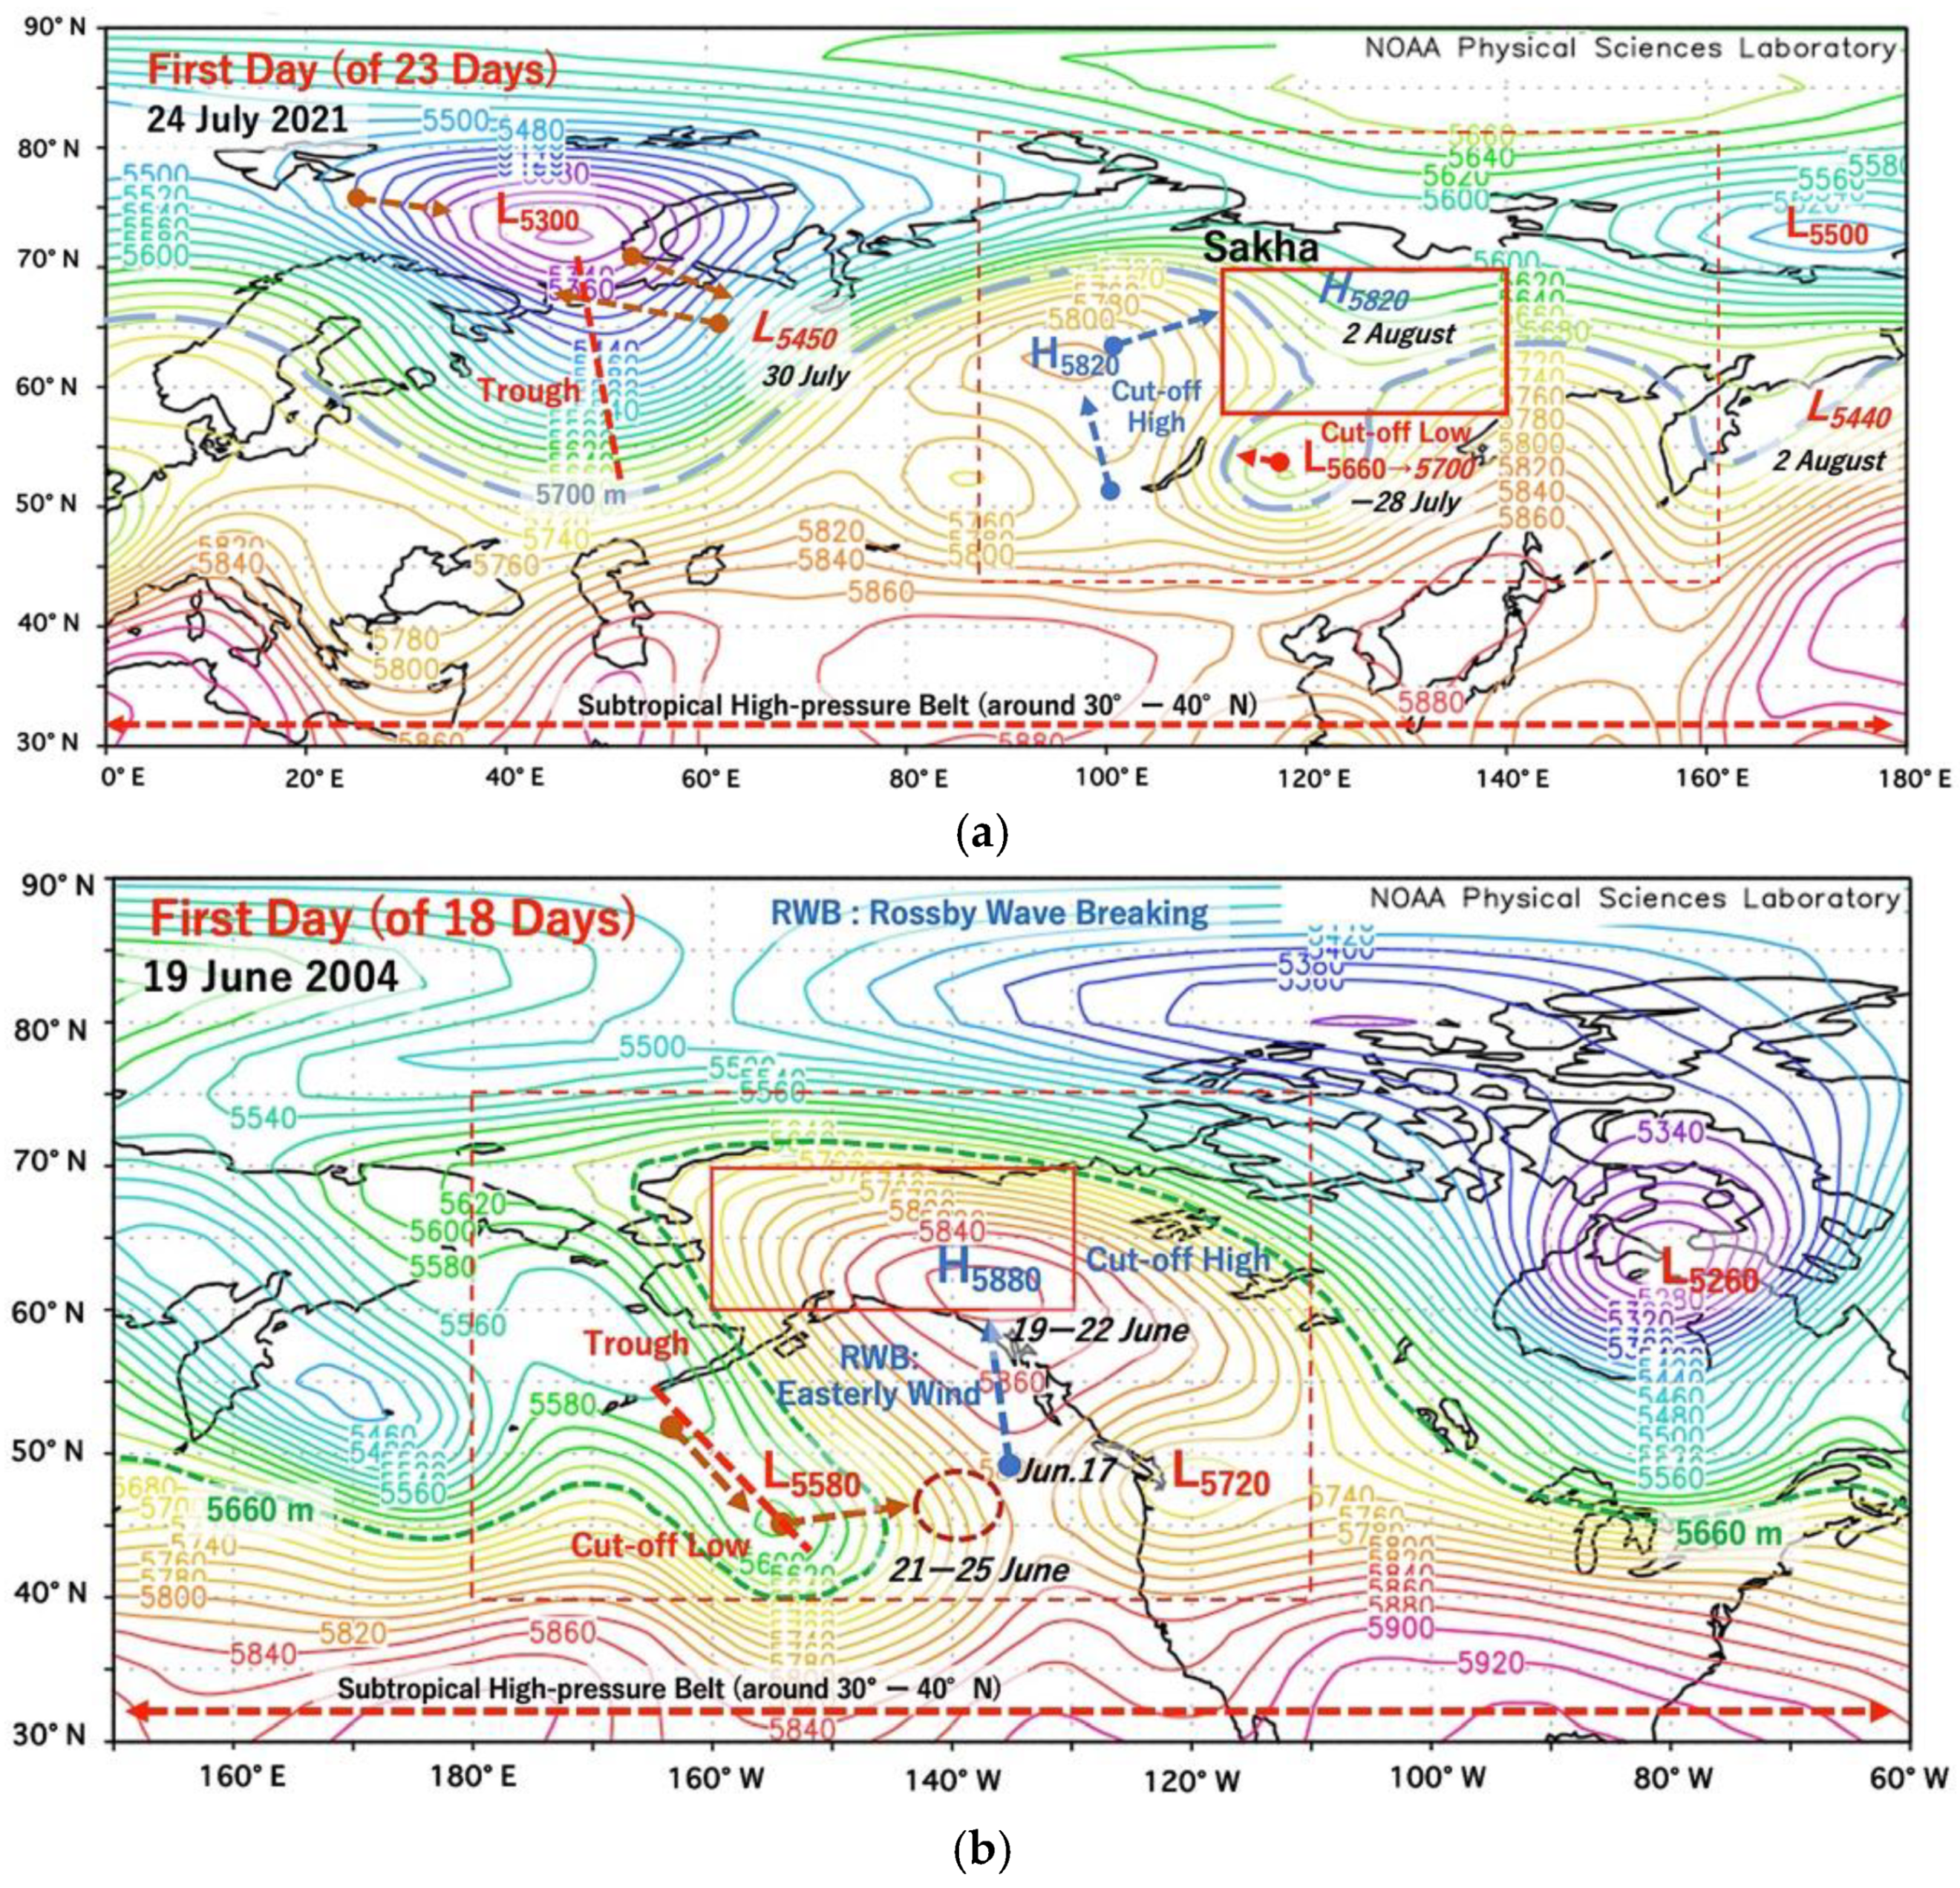
Figure 5.
Large westerly meandering (LWM) and omega block (one COH and two COLs). (a) Sakha on 24 July. The study region is shown by the rectangle with the red line. The rectangle with the red dotted line shows the area to discuss fire weather. (b) Alaska+ on 19 June. The study region is shown by the rectangle with the red line. The rectangle with the red dotted line shows the area to discuss fire weather. RWB occurred under easterly winds.
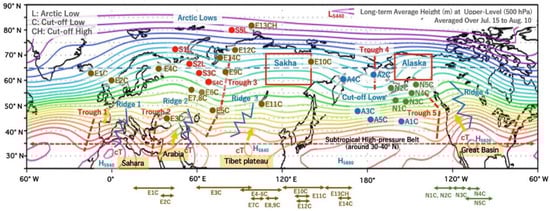
Figure 6.
Map of part of the northern hemisphere (25°–90° N, −60°–360° E). Full names of E1C-E14C and S1L-S5L are in Table 1. Full names of N1C-N5C and A1C-A5C are in Table 2. Two rectangles with red lines are the regions of Sakha and Alaska. Red dotted lines show major troughs. Blue zigzag dotted lines show major ridges. Straight lines with arrows at both ends at the bottom of the figure show longitude locations of the other 19 areas (E1C-E14C and N1C-N5C). Base map is the upper air (500 hPa) weather map (long-term average map for 74 years from 1948).
In Sakha, active fires started on the first day of the top fire period “S1L.2Aug.′21”. Figure 5a shows weather conditions in the upper air over Eurasia on 24 July. LWM was already occurring over Siberia due to the stagnant low-pressure systems (L5300, 73° N 45° E (approximate center)) and a trough (from around 73° N 45° E to 52° N 52° E). Persistent high-pressure systems (H5820, 63° N 95° E) moving from the south had already reached above 60° N on 24 July (Day 1) and lasted until around 8 August (Day 16). The cut-off low (COL, cold vortex) pressure systems in the south of Sakha (L5660, 53° N 118° E) lasted until 28 July (Day 5). New COL (L5640, 57° N 127° E) detached from the trough from low-pressure systems (L5425, 70° N 182° E) on 30 July (Day 7) and stayed in the south of Sakha (see Figure 7a). “L5300+T” is inserted into the corresponding column and row for “S1L.2Aug.′21” in Table 3. The location of the L5300 is shown in Figure 6, using its abbreviation “S1L”.
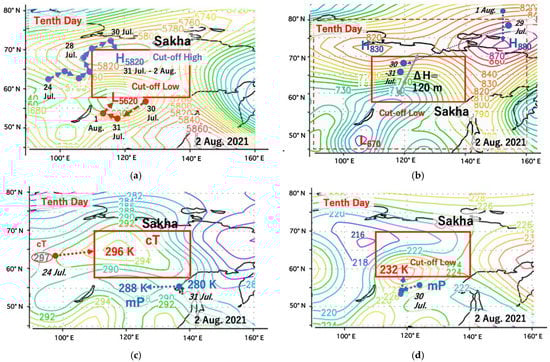
Figure 7.
Fire weather conditions on 2 August (HS peak day) in Sakha. Blue dotted lines with a solid circle and an arrow at both ends indicate their positions and directions of movement of high-pressure systems and cT. Red dotted lines with a solid circle and an arrow at both ends indicate their positions and directions of movement of low-pressure systems and mP. (a) Weather map (500 hPa). (b) Weather map (925 hPa). The grey line with a solid circle and an arrow at both ends shows the height gradient (ΔH = 120 m). (c) Temperature map (925 hPa). (d) Temperature map (200 hPa).
In Alaska, active fires started on the first day of the top fire period “A1C.30Jun.′04”. Figure 5b shows weather conditions in the upper air over North America on 19 June of the top fire period “A1C.30Jun.′04”. Large westerly meandering (LWM) was already occurring over North America due to the low-pressure systems or COL (L5580, 46° N 155° W) and the trough (55–43° N 165–153° W). COL moved to the south of the Gulf of Alaska and persisted from June 21 to 25 (Day 3–7). RWB occurred under easterly winds around June 25 (Day 7). Under RWB conditions, high-pressure systems at lower air moved from the west of Alaska to the Beaufort Sea (see Figure 8b). High-pressure systems (H5880, 62° N 138° W) in Figure 5b moved from the south of the Gulf of Alaska and disappeared on 22 July (Day 4). From around 23 June (Day 5), a ridge developed from the Great Basin with the help of COL (L5600, 45° N 139° W). Large high-pressure systems (H5820, 63° N 125° W) covered northwest Canada on 26 June (Day 8) and gradually moved across Alaska (see Figure 8a). “L5580 + T” is inserted into the corresponding column and row for “A1C.30Jun.’04” in Table 4. The location of the L5580 is shown in Figure 6, using its abbreviation “A1C”.
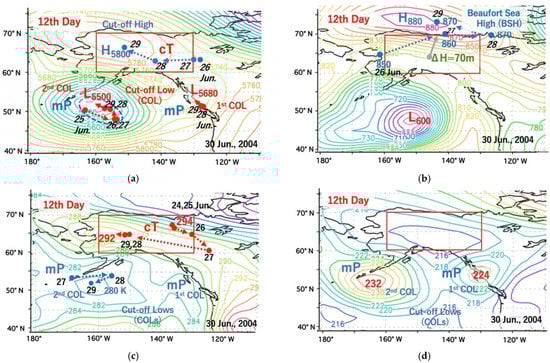
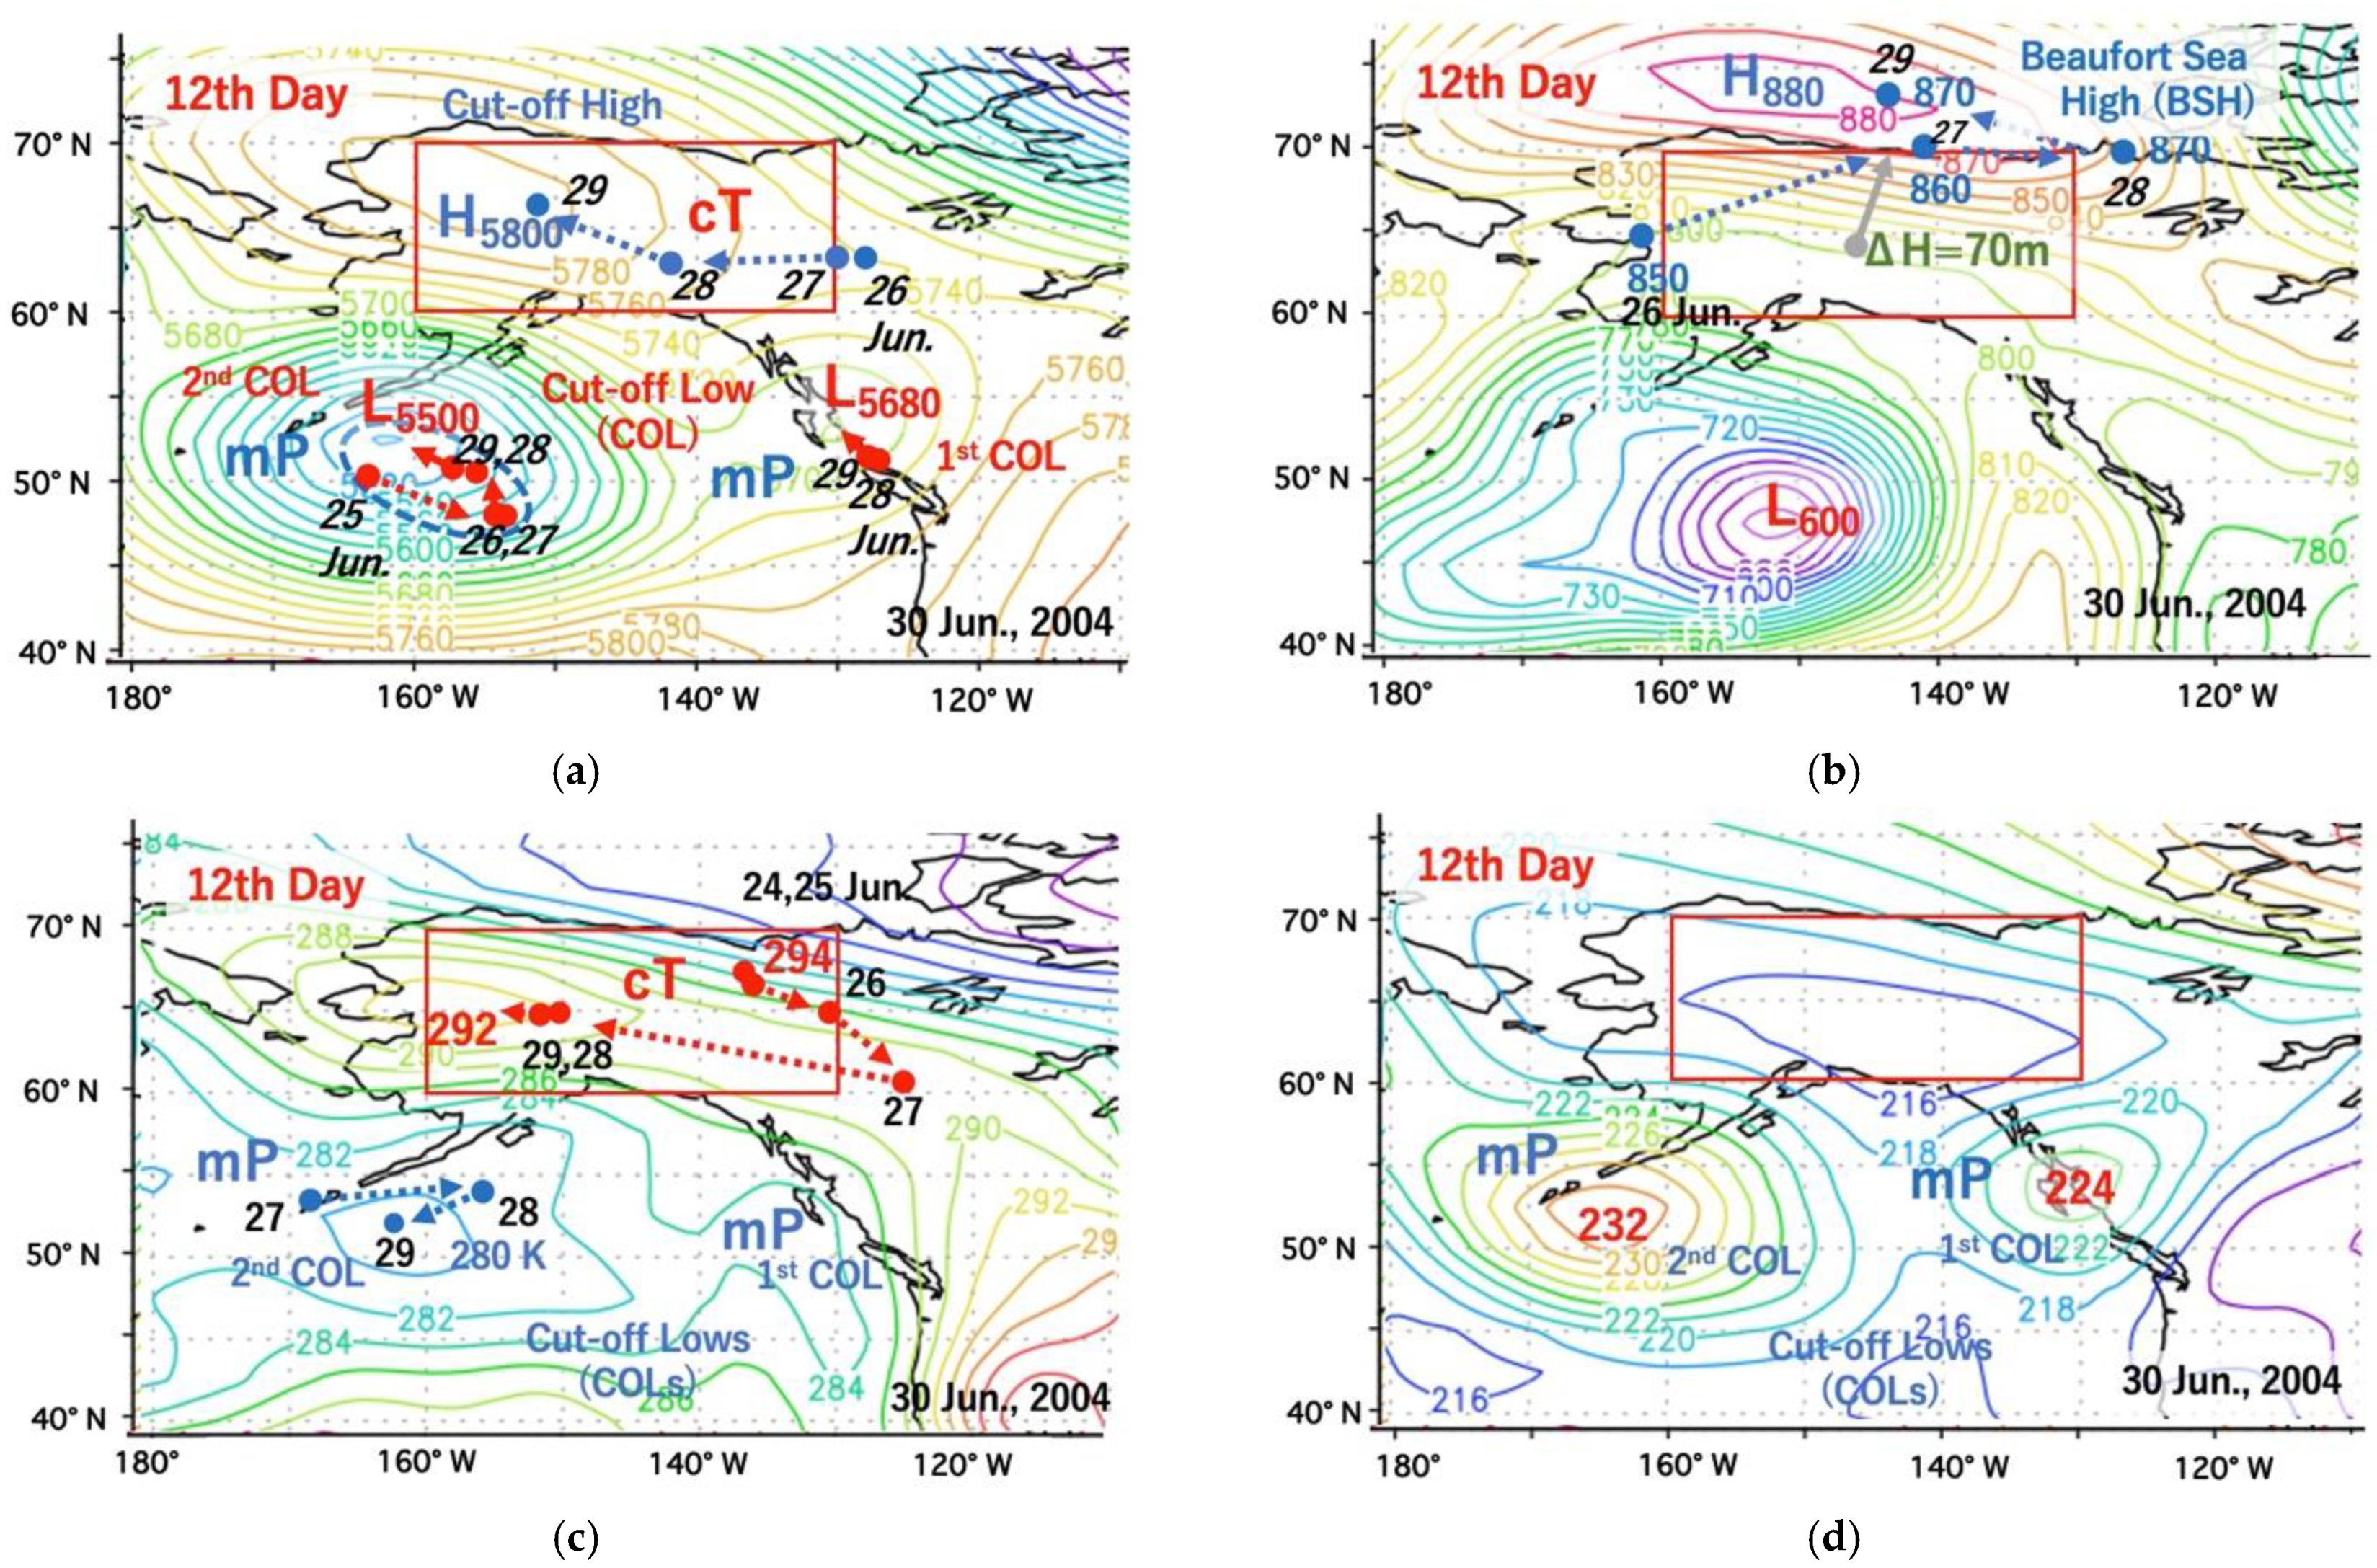
Figure 8.
Fire weather conditions on 30 June (HS peak day) in Alaska. Blue dotted lines with a solid circle and an arrow at both ends indicate their positions and directions of movement of high-pressure systems and cT. Red dotted lines with a solid circle and an arrow at both ends indicate their positions and directions of movement of low-pressure systems and mP. (a) Weather map (500 hPa). (b) Weather map (925 hPa). The grey line with a solid circle and an arrow at both ends shows the height gradient (ΔH = 70 m). (c) Temperature map (925 hPa). (d) Temperature map (200 hPa).
3.3.4. HS Peak Weather Conditions in Sakha and Alaska (Step 3/3)
Weather and temperature maps on HS peak days in Sakha and Alaska are shown in Figure 7 and Figure 8, respectively. High- and low-pressure systems at upper air (500 hPa) and lower air (925 hPa) are shown in Figure 7a,b and Figure 8a,b. Temperature maps at lower air (925 hPa) and upper air (200 hPa) are shown in Figure 7c,d and Figure 8c,d. From these maps, we discussed: (1) high-pressure systems at upper air, (2) strong wind conditions at lower air on HS peak day, (3) existence of warm air masses (cT and mT) at lower air (sign of dry and warm weather), and (4) existence of cool air masses (mA) and effect of cut-off low (COL) systems on weather conditions at lower air and upper air; summarized in Table 3 and Table 4.
Fire Weather Conditions in Sakha
Figure 7a–d show weather and temperature maps on HS peak day of the top fire-period “S1L.2Aug.′21” in Sakha. Figure 7a shows high-pressure systems at upper air (500 hPa) persisting near the study area (Sakha) since 24 July (see blue circles with arrow in Figure 7a). High-pressure systems (H5820, 68° N 120° E) were COH and covered the northern area of Sakha from 31 July to 2 August (HS peak). The new COL (L5620, 57° N 118° E) appeared on 30 July and moved south of Sakha and made Rex block. As the downward flow of high-pressure systems provides dry and warm weather, Figure 7a supports that blocking COH (H8520, 68° N 120° E) was essential fire–weather conditions for the top fire-period “S1L.2Aug.′21”. “H5820,68,120” and “Omega” are inserted into the corresponding column and row for “S1.2Aug.′21” in Table 3.
Figure 7b shows two high-pressure systems, (H880, 73° N 152° E) and (H830, 72° N 110° E), at lower air (925 hPa) on the HS peak day. High-pressure systems (H850, 78° N 155° E) from the Arctic Ocean moved toward northern Sakha from 29 July (Day 6) and disappeared on 31 July (Day 8). New high-pressure systems (H880, 83° N 152° E) moved from the Arctic Ocean again on 1 August (Day 10). The very large height difference (∆H) in Figure 7b on the HS peak day suggests windy conditions, which are often observed at the periphery of the high-pressure systems [34]; actually, the easterly wind velocity at the reference site (63.5° N 127° E) near Yakutsk was 7.2 m s−1 [31]. The development of the high-pressure system at lower air over the Arctic Ocean is presumed to be related to COH at upper air. “H880,73,150”, “130”, and “East” are inserted into Table 3.
Temperature maps at lower air (925 hPa) and upper air (200 hPa) are shown in Figure 7c,d. Under high-pressure systems (H5820, 63° N 95° E) in Figure 5a, warm air masses (cT = 296 K) from the Tibet Plateau reached around 63° N on 24 July (Day 1) and moved to western Sakha on the HS peak day (2 August, Day 10). As we already reported, warm air masses on the HS peak day resulted in a total of 13 active fire periods (six in Sakha, five in Alaska, one in northern Krasnoyarsk, and one in southern Khabarovsk) [27,28,29,30,31]. We may say that warm air masses at lower air is one of the essential fire–weather indicators. “296,66,118” and “cT, Tibet” are inserted into Table 3.
Fire–Weather Conditions in Alaska
Figure 8a–d show weather and temperature maps on the HS peak day of the top fire-period “A1C.30Jun.′04” in Alaska. Figure 8a shows high-pressure systems at upper air (500 hPa) moving from the east to Alaska since 26 June (see blue circles with arrow in Figure 8a). COH covered the western area of Alaska (H5800, 68° N 157° W) on 30 June (HS peak day). Two COLs were located in the south of the Gulf of Alaska. The first COL (L5680, 53° N 130° W) near the west coast was derived from L5580 in Figure 5b. The second COL (L5500, 53° N 163° W) in the southeastern of the Gulf of Alaska appeared on 25 June and persisted, as shown in Figure 8a. As the downward flow of high-pressure systems provide dry and warm weather, Figure 8a supports that blocking COH (H5800) was also essential fire–weather conditions in Alaska. “H5800,68,157” and “Rex” are inserted into the corresponding column and row for “A1C.30Jun.′04” in Table 4.
Figure 8b shows high-pressure systems (H880, 74° N 152° W) at lower air (925 hPa) on the HS peak day. From 26 June (Day 8), high-pressure systems (H850, 63° N 99° E) moved from the southwest to the northeast due to RWB and developed in the Beaufort Sea. The movement of high-pressure systems is one of the major meteorological phenomena associated with RWB [27]. On the HS peak day, the Beaufort Sea high (BSH) made the large height difference (∆H = 70 m) in Figure 8b. This ∆H is smaller than 120 m in Sakha in Figure 7b. Although the dense contour lines area is mainly found between 65–70° N, the ∆H per degree is almost the same (roughly 14 m deg.−1 in Sakha and 12 m deg.−1 in Alaska). “H880,73,150”, “70”, and “East” are inserted into Table 4.
Temperature maps at lower air (925 hPa) and upper air (200 hPa) are shown in Figure 8c,d. Under high-pressure systems H5800 in Figure 8a, warm air masses and cT (=294 K) reached 67° N 137° W on 24 June (Day 6) and moved to the southeast of Alaska. From 27 June, cT headed east and covered western Alaska on 30 June. Fires became active in the presence of cT; “292,65,158” and “cT, G.Basin” are inserted into Table 4.
Figure 8d shows two high temperature areas. They are 232 K at 52° N 164° W and 224 K at 54° N 130° W, and show upper air (200 hPa) conditions of the second COL (L5500) and the first COL (L5680) in Figure 8a. Their high temperatures suggest two COLs were active low-pressure systems and covered the southern area of the Gulf of Alaska (53° N, 130–165° W). As these COLs in the Pacific Ocean in Figure 8a were a little bit far from the study region of Alaska, we may say that COLs did not directly affect active fires on the HS peak day such as in Sakha (see Figure 5a). The first COL (L5680), originally from the Bering Sea, affected the formation of the ridge from the Great Basin and promoted the northward movement of cT.
3.3.5. Summary of Fire–Weather Conditions in Sakha and Alaska
A similar analysis procedure in Section 3.3.3 and Section 3.3.4 used weather and temperature maps applied to other active fire periods in Sakha and Alaska. Those weather conditions are summarized in Table 3 and Table 4. The first item in Table 3 and Table 4 is one of the initial conditions during the active fire period. The other four items in Table 3 and Table 4 are weather conditions on the HS peak day [27,28,29,30,31]. These fire weather conditions are summarized below.
Initial Weather Conditions
Large westerly meandering (LWM) due to COL commonly occurred several days before the hotspot (HS) peak day. The causes of westerly meandering during the top five active fire periods in Sakha and Alaska are summarized in Table 3 and Table 4, and their locations of low-pressure systems are shown by their abbreviation name such as “S1L” in Figure 6.
In Sakha, LWM occurred due to Arctic low-pressure systems with trough (S1L, S2L, and S5L) and COL detached from Arctic low-pressure systems (S3C and S4C) (see Table 3, Figure 5a and Figure 6). These five locations for S1L–S5L are close to the long-term (74 years) average trough (Trough 3, 37–70° N, 70–80° E) in Figure 6, so low-pressure systems near “Trough 3” will be one of the initial weather conditions of active fire for Sakha. Thus, “Trough 3” will be one of the important weather factors in Sakha′s fire regime.
In Alaska, all LWM occurred due to COLs (A1C–A5C) detached from Arctic low-pressure systems mainly over the Bering Sea (see Table 4, Figure 5b and Figure 6). These five locations of COLs are close to the long-term (74 years) average trough (Trough 4, 55°–67° N, 185° E) in Figure 6, so COLs near “Trough 4” will be one of the initial weather conditions of active fire for Alaska. Thus, “Trough 4” will be one of the important weather factors in Alaska′s fire regime.
HS Peak Weather Conditions
Table 3 and Table 4 summarize the three HS peak weather conditions: upper air, wind, and warm air masses. High-pressure systems are an essential condition for both Sakha and Alaska. Strong wind conditions are classified into the high-pressure type and the low-pressure type. S4 and A5 in Table 3 and Table 4 are low-pressure types and the others are high-pressure types. Strong winds of the high-pressure type are a common meteorological phenomenon at the periphery of high-pressure systems [36]. Table 3 and Table 4 show that the warm air mass cT is an essential condition. The movement of cT can be easily grasped from the temperature maps shown in Figure 7c and Figure 8c. This suggests that fire forecasting and firefighting using a temperature distribution map will be possible and one of the best tools.
3.4. Summary of Fire Weather (Regime) in Eurasia and North America
Fourteen areas in Eurasia and five areas in North American are selected among relatively high-density cells (>about 10 HSs 10−3 km−2 Year−1) in Figure 1. Their active fire areas are extracted from the tables of the annual total number of HSs. Then, their active fire periods were obtained from the tables of the daily number of HSs. The fire weather during those fire periods were analyzed as described in Section 3.3.3 and Section 3.3.4. Analysis results of HS peak date, total number of HSs, and number of dates during the active period were summarized in Table 1 and Table 2. The 14 areas in Table 1 are arranged in order from the west side of Eurasia. The five areas in Table 2 are also arranged in order from the west side of North America. Fire weather during each fire period is analyzed using weather and temperature maps (over 1160 maps in all) as described in Section 3.3.
Analysis results on 14 areas and Sakha showed active fires during 14 fire periods in Table 1 and 5 periods in Sakha in Table 1 and Table 3 started due to LWM caused by mainly COL. Similarly, analysis results on five areas and Alaska also showed active fires during five fire periods in Table 2 and five periods in Alaska in Table 2 and Table 4 started due to LWM caused by mainly COL. From analysis results of trough and COL, the Eurasian continent is divided into four fire regions and the North America continent is divided into two fire regions. We called them: (1) eastern Europe, (2) central and east Siberia (Sakha), (3) far east high-latitude Siberia (northern Sakha), (4) far east low-latitude Siberia (southern Khabarovsk), (5) Alaska (including northern Canada), and (6) western Canada. Since there is no space to describe all the results, the results for the six regions are summarized in the table below.
In eastern Europe, COLs during three fire periods (E1C, E2C, E3C) detached from Arctic low-pressure systems. Those COL positions are indicated by the brown circle in Figure 6. “E3C” is near “Trough 2”, but E1C and E2C are far from “Trough 1”. The HS peak during three fire periods (E1C, E2C, and EC3) occurred under a detached high from “Ridge 1”, a detached high from “Ridge 2”, and a ridge extended from “Ridge 2”, respectively.
In central and east Siberia (Sakha), COLs during a total of fourteen fire periods (six periods from E4C to E9C, three periods (E12C to E14C), and five periods (S1L to S5L, the red circle) in Sakha) detached from Arctic low-pressure systems. Most COLs, except E13CH and E14C, are near “Trough 3”, as shown in Figure 6. The geographic locations of E13CH and E14C are in far east Siberia, but their active fires began due to LWMs near “Trough 3” caused by COLs detached from Arctic low-pressure systems. HS peaks during E5C and E6C occurred under a detached high from “Ridge 2”. HS peaks during S1L, S2L, and E4C occurred under a detached high from “Ridge 3”. HS peaks during S3C, S4C, S5L, E7C, E8C, and E9C occurred under a ridge from “Ridge 3”. HS peaks during E12C, E13CH, and E14C occurred under a ridge extended ffom the south near the eastern edge of the Pacific Ocean.
In far east high-latitude Siberia (northern Sakha), as COL during the fire period of E10C detached from Arctic low-pressure systems near the Bering Sea, E10C is classified differently from the others. Fire weather in E10C may be sensitive to recent weather conditions in the Arctic Ocean. HS peaks during E10C (high-latitude) occurred under COL detached from Arctic low. It was a very rare case and may have occurred related to recent climate change.
In far east low-latitude Siberia (southern Khabarovsk), COL during E11C detached from Arctic low-pressure systems over far east Siberia. LWM during E11C occurred due to Arctic low-pressure systems. As already reported [30], the E11C was an exceptional fire in June for southern Khabarovsk. The HS peak during E11C occurred under a ridge extended form the Sea of Japan.
From the above results on fires in Eurasia, we may say many active fires in Siberia tend to start mainly due to LWM near “Trough 2” and “Trough 3” and are very active under high-pressure systems developed from “Ridge 2” and “Ridge 3”. The reason why Sakha′s fire density is higher than in the surrounding area may be in the position of “Trough 3” where LWM is likely to occur due to COL. “Ridge 3” will be made related to LWM near “Trough 3”. In addition to this, the basin-like terrain surrounded by mountain in Sakha may create high fire density.
In Alaska (including northern Canada), COL (cause of LWM) during five fire periods in Alaska detached from Arctic low-pressure systems. Those COL positions are indicated by the blue circle in Figure 6; all locate near “Trough 4” over the Bering Sea and the Pacific Ocean. The average height and position of those COLs are 5480 m and 53° N 183° E. HS peaks of the top four fire periods (A1C, A2C, A3C, and A4C) occurred under a detached high from “Ridge 4”. HS peaks of the top five fire periods (A5C) occurred under “Ridge 4”.
In western Canada, COLs during five fire periods (N1C-N5C) detached from Arctic low-pressure systems. Those COL positions are indicated by the green circle in Figure 6; all are near “Trough 5” over the Gulf of Alaska. Average height and position of those COLs are 5532 m and 55° N 156° E. HS peaks of five fire periods (N1C-N5C) occurred near or at the edge of “Ridge 4”. There is about a 150m average height difference between Alaska (5480 m) and Canada (5532 m). This difference suggests Alaska needs stronger COL than Canada to make an eastward flow and COH over Alaska. This is one of the reasons why Alaska has a higher fire density than Canada. In addition to this, the basin-like terrain surrounded by mountains in Alaska may make a higher fire density than Canada.
4. Discussion
There were few papers that analyzed the weather of forest fires using various weather maps. In particular, few studies, like ours, have taken a closer look at meteorological conditions during an active fire period. The reason for this is that it is difficult to identify the fire period and the maximum fire (HS) date [27,28,29,30,31].
We extracted some descriptions about fire weather from the “National Wildfire Coordinating Group” [37]:
- General non-convective Red Flag Warning criteria (their warning criteria values are found in Figure 6, Figure 8 and Figure 9) are: temperature ≥ 23.9 °C (297 K, (see Figure 6)), RH ≤ 25%, wind ≥ 6.7 m/s (24.1 km/h, sustained (see Figure 8 and Figure 9));
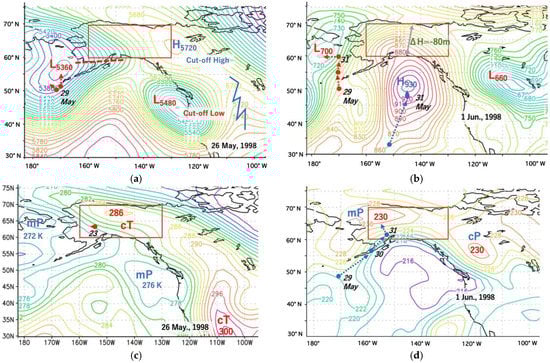 Figure 9. Fire weather during the 1998 Carla Lake Fire in Alaska. Blue dotted lines with a solid circle and an arrow at both ends indicate their positions and directions of movement of high-pressure systems and cT. Red dotted lines with a solid circle and an arrow at both ends indicate their positions and directions of movement of low-pressure systems and mP. (a) Weather map (500 hPa) on 26 May. COH (cut-off high) at high latitude. The red dotted line show a major trough. The blue zigzag dotted line showa the major ridge. (b) Weather map (925 hPa) on 1 June, strong wind day. The grey line with a solid circle and an arrow at both ends shows the height gradient (ΔH = −80 m). (c) Temperature map (925 hPa) on 26 May. cT in Alaska. (d) Temperature map (200 hPa) on 1 June. mP and cP at high latitude.
 - The four critical weather elements that produce extreme fire behavior are low relative humidity, strong surface wind, unstable air, and drought;
- Most periods of critical fire weather occur in transition zones between high- and low-pressure systems, both at the surface and in the upper air;
- In Alaska, the primary pattern is the breakdown of the upper ridge with a southeastern flow. This can bring gusty winds and dry lightning to the interior of Alaska after a period of hot dry weather.
Unfortunately, they do not seem to take into account the recent research results such as ours [27,28,29,30,31] for active fires in the boreal region, including Alaska.
We found one book for fire managers: Synthesis of Knowledge of Extreme Fire Behavior: Volume I for Fire Managers [38]. This book briefly describes the June 1998 Carla Lake Fire that occurred near Fairbanks in Alaska to explain critical fire weather patterns. This book describes this fire as “The primary pattern is the breakdown of the upper ridge with a southeast flow. It can bring gusty winds and dry lightning to the interior of Alaska after a period of hot, dry weather”, with one simple conceptual figure for the Carla Lake Fire. According to the web news [39], the Carla Lake Fire burned 175 km2 under wind gusts of 56 km h−1 and relative humidity of less than 25%.
To clarify critical fire weather conditions for the Carla Lake Fire, We tentatively analyzed temporally various weather maps from 23 May to 5 June as there are no detail records on the Carla Lake Fire. Four weather maps from among them are selected and shown in Figure 9a–d. The upper air weather map and the lower air temperature map on 26 May in Figure 9a,c will support the above description “after a period of hot, dry weather”. The lower air weather map on 1 June in Figure 9b supports “gusty winds (wind gusts of 56 km h−1)”. The upper air temperature map in Figure 9d suggests “gusty wind” occurred due to COL.
As our analysis procedure is very simple for just analyzing two weather and temperature maps, we hope that fire managers and researchers in the boreal region will experience great benefit by applying our fire–weather analysis to their forecast approach.
5. Conclusions
Fire activity in 288 areas (2.5° N × 10° E) in the Arctic region (50°–70° N, 0°–360° E) was analyzed using satellite hotspot data (number of HSs = about 4.4 million) from 2002 to 2021. A total of 21 high fire density areas were selected and their fire–weather conditions during each active fire period were analyzed using weather and temperature maps at upper and lower air (over 1820 maps in all). Analysis results of fire–weather conditions for high fire density areas in the Arctic region (North Eurasia and North America) are summarized in the below.
Active fires in central and eastern Siberia started by LWM (large westerly meandering) caused by COL detached from Arctic low-pressure systems over the continent (west and central Siberia). Very active fires on HS peak days in central and eastern Siberia occurred under COH detached from a ridge extending from the Tibet plateau and Arabia. In North America, active fires also started by LWM caused by COL detached from Arctic low-pressure systems over the Bering Sea and the Gulf of Alaska. However, fires were not so active until high-pressure systems (COH and ridge) extended from the Great Basin. Analysis results may suggest there are six major fire regimes in the Arctic region: (1) eastern Europe, (2) central and east Siberia (Sakha), (3) far east high-latitude Siberia (northern Sakha), (4) far east low-latitude Siberia (southern Khabarovsk), (5) Alaska, and (6) western Canada.
Lastly, we should prepare for the next large-scale fires due to climate change by applying the fire–weather analysis approach described in this paper. Since we can predict occurrence of active fires, we could prevent active fires by making fire breaks, prescribed fires, and so on. Our fight against wildland fires is one of the executable ways to mitigate global warming.
Funding
This research received no external funding.
Institutional Review Board Statement
Not applicable.
Informed Consent Statement
Not applicable.
Data Availability Statement
This study used MODIS hotspot data obtained from the NASA Fire Information for Resource Management System. (FIRMS; MODIS Collection 6, https://firms.modaps.eosdis.nasa.gov/download/,(accessed on 10 September 2021). I used reanalysis data provided by the NOAA/OAR/ESRL PSL, Boulder, CO, USA, from their website at https://psl.noaa.gov/ (accessed on 6 October 2021).
Acknowledgments
I would like to thank “The NCEP/NCAR 40-Year Reanalysis Project”.
Conflicts of Interest
The author declares no conflict of interest.
References
- Previdi, M.; Smith, K.L.; Polvani, L.M. Arctic amplification of climate change: A review of underlying mechanisms. Environ. Res. Lett. 2021, 16, 093003. [Google Scholar] [CrossRef]
- Delmotte, M.V.; Zhai, P.; Pirani, A.; Connorsv, S.L.; Péanv, C.; Berger, S.; Caud, N.; Chen, Y.; Goldfarbv, L.; Gomis, M.I.; et al. (Eds.) IPCC, 2021: Summary for Policymakers. In Climate Change 2021: The Physical Science Basis, contribution of Working Group I to the Sixth Assessment Report of the Intergovernmental Panel on Climate Change; Cambridge University Press: Cambridge, UK, 2021; in press. [Google Scholar]
- Flannigan, M.D.; Amiro, B.D.; Logan, K.A.; Stocks, B.J.; Wotton, B.M. Forest fires and climate change in the 21st century. In Mitigation and Adaptation Strategies for Global Change; Springer: Berlin/Heidelberg, Germany, 2006; Volume 11, pp. 847–859. [Google Scholar]
- Pechony, O.; Shindell, D.T. Driving forces of global wildfires over the past millennium and the forthcoming century. Proc. Natl. Acad. Sci. USA 2010, 107, 19167–19170. [Google Scholar] [CrossRef] [PubMed] [Green Version]
- McCarty, J.L.; Aalto, J.; Paunu, V.-V.; Arnold, S.R.; Eckhardt, S.; Klimont, Z.; Fain, J.J.; Evangeliou, N.; Venäläinen, A.; Tchebakova, N.M.; et al. Reviews and syntheses: Arctic fire regimes and emissions in the 21st century. Biogeosciences 2021, 18, 5053–5083. [Google Scholar] [CrossRef]
- Huang, Y.; Wu, S.; Kaplan, J.O. Sensitivity of global wildfire occurrences to various factors in the context of global change. Atmos. Environ. 2014, 121, 86–92. [Google Scholar] [CrossRef] [Green Version]
- Gillett, N.P.; Weaver, A.J.; Zwiers, F.W.; Flannigan, M.D. Detecting the effect of climate change on Canadian forest fires. Geophys. Res. Lett. 2004, 31, 18211. [Google Scholar] [CrossRef] [Green Version]
- Duffy, P.A.; Walsh, J.E.; Graham, J.M.; Mann, D.H.; Rupp, T.S. Impacts of large scale atmospheric Ocean variability on Alaskan fire season severity. Ecol. Appl. 2005, 15, 1317–1330. [Google Scholar] [CrossRef] [Green Version]
- Flannigan, M.D.; Logan, K.A.; Amiro, B.D.; Skinner, W.R.; Stocks, B.J. Future area burned in Canada. Clim. Change 2005, 72, 1–16. [Google Scholar] [CrossRef]
- IPCC. Climate change 2014: Impacts, adaptation, and vulnerability. Summaries, frequently asked questions, and cross-chapter boxes. In A Contribution of Working Group II to the Fifth Assessment Report of the Intergovernmental Panel on Climate Change; Field, C.B., Barros, V.R., Eds.; World Meteorological Organization: Geneva, Switzerland, 2014; p. 190. [Google Scholar]
- Ponomarev, E.I.; Kharuk, V.I.; Ranson, K.J. Wildfires Dynamics in Siberian Larch Forests. Forests 2016, 7, 125. [Google Scholar] [CrossRef] [Green Version]
- Conard, S.G.; Sukhinin, A.I.; Stocks, B.J.; Cahoon, D.R.; Davidenko, E.P.; Ivanova, G.A. Determining effects of area burned and fire severity on carbon cycling and emissions in Siberia. Clim. Chang. 2002, 55, 197–211. [Google Scholar] [CrossRef]
- Shvidenko, A.Z.; Schepaschenko, D.G. Climate Change and Wildfires in Russia. Contemp. Probl. Ecol. 2013, 6, 683–692. [Google Scholar] [CrossRef]
- Federal State Statistics Service. Available online: http://www.gks.ru (accessed on 29 February 2016).
- Forkel, M.; Thonicke, K.; Beer, C.; Cramer, W.; Bartalev, S.; Schmullius, C. Extreme fire events are related to previous-year surface moisture conditions in permafrost-underlain larch forests of Siberia. Environ. Res. Lett. 2012, 7, 044021. [Google Scholar] [CrossRef]
- Kharuk, V.I.; Ranson, K.J.; Dvinskaya, M.L.; Im, S.T. Wildfires in northern Siberian larch dominated communities. Environ. Res. Lett. 2011, 6, 045208. [Google Scholar] [CrossRef]
- Krylov, A.; McCarty, J.L.; Potapov, P.; Loboda, T.; Tyukavina, A.; Turubanova, S.; Hansen, M.C. Remote sensing estimates of stand-replacement fires in Russia, 2002–2011. Environ. Res. Lett. 2014, 9, 105007. [Google Scholar] [CrossRef]
- Abatzoglou, J.T.; Crystal, A.K. Relative importance of weather and climate on wildfire growth in interior Alaska. Int. J. Wildland Fire 2011, 20, 479–486. [Google Scholar] [CrossRef]
- Bell, G. Special Climate Summary, April–July 2004, Hot in Alaska, Cool over Central North America, Wet in South-Central U.S. Available online: http://www.cpc.ncep.noaa.gov/products/expert_assessment/alaska.pdf (accessed on 27 October 2015).
- Wendler, G.; Conner, J.; Moore, B.; Shulski, M.; Stuefer, M. Climatology of Alaskan wildfires with special emphasis on the extreme year of 2004. Theor. Appl. Clim. 2010, 104, 459–472. [Google Scholar] [CrossRef]
- Fauria, M.; Johnson, E.A. Large-scale climatic patterns control large lightning fire occurrence in Canada and Alaska forest regions. J. Geophys. Res. Biogeosci. 2006, 111, G04008. [Google Scholar] [CrossRef] [Green Version]
- Fauria, M.; Johnson, E.A. Climate and wildfires in the North American boreal forest. Philos. Trans. R. Soc. B Biol. Sci. 2007, 363, 2315–2327. [Google Scholar] [CrossRef]
- Skinner, W.R.; Stocks, B.J.; Martell, D.L.; Bonsal, B.; Shabbar, A. The association between circulation anomalies in the mid-troposphere and area burned by wildland fire in Canada. Theor. Appl. Clim. 1999, 63, 89–105. [Google Scholar] [CrossRef]
- Skinner, W.R.; Flannigan, M.D.; Stocks, B.J.; Martell, D.L.; Wotton, B.M.; Todd, J.B.; Mason, J.A.; Logan, K.A.; Bosch, E.M. A 500 hPa synoptic wildland climatology for large Canadian forest fires 1959–1996. Theor. Appl. Clim. 2002, 71, 157–169. [Google Scholar] [CrossRef]
- Hayasaka, H.; Fukuda, M.; Kushida, K. Recent Large-scale Forest Fires in Boreal Forests and Climate Change Discussion Based on Forest Fire and Weather Data in Alaska and Sakha. J. JAFSE 2007, 57, 45–51. (In Japanese) [Google Scholar]
- Hayasaka, H. Recent Vegetation Fire Incidence in Russia. Glob. Environ. Res. 2011, 15, 5–13. [Google Scholar]
- Hayasaka, H.; Tanaka, H.L.; Bieniek, P.A. Synoptic-scale fire weather conditions in Alaska. Polar Sci. 2016, 10, 217–226. [Google Scholar] [CrossRef]
- Hayasaka, H.; Yamazaki, K.; Naito, D. Weather conditions and warm air masses in southern Sakha during active wildfire periods. J. Disaster Res. 2019, 14, 641–648. [Google Scholar] [CrossRef]
- Hayasaka, H.; Yamazaki, K.; Naito, D. Weather Conditions and Warm Air Masses during Active Fire-periods in Boreal Forests. Polar Sci. 2019, 22, 100472. [Google Scholar] [CrossRef]
- Hayasaka, H.; Sokolova, G.V.; Ostroukhov, A.; Naito, D. Classification of Active Fires and Weather Conditions in the Lower Amur River Basin. Remote Sens. 2020, 12, 3204. [Google Scholar] [CrossRef]
- Hayasaka, H. Rare and Extreme Wildland Fire in Sakha in 2021. Atmosphere 2021, 12, 1572. [Google Scholar] [CrossRef]
- Shahgedanova, M. Climate at present and in the historical past. In The Physical Geography of Northern Eurasia; Oxford University Press: Oxford, UK, 2003; pp. 70–102. Available online: http://www.rusnature.info/geo/03_2.htm (accessed on 25 November 2021).
- FIRMS. MODIS Collection 6. Available online: https://firms.modaps.eosdis.nasa.gov/download/ (accessed on 10 September 2021).
- Worldview. Available online: https://worldview.earthdata.nasa.gov (accessed on 6 October 2021).
- NCEP/NCAR Reanalysis 1: Summary. Available online: https://psl.noaa.gov/data/gridded/data.ncep.reanalysis.pressure.html (accessed on 4 April 2022).
- Reigate Grammar School Weather Station, HIGH Pressure: Windy Round the Edges, a Bit on Super-Geostrophic Winds. Available online: https://rgsweather.com/2015/02/09/high-pressure-windy-round-the-edges-a-bit-on-super-geostrophic-winds/ (accessed on 8 October 2021).
- National Wildfire Coordinating Group. Available online: https://www.nwcg.gov/publications/pms437/weather/critical-fire-weather (accessed on 8 April 2022).
- Synthesis of Knowledge of Extreme Fire Behavior: Volume I for Fire Managers. Available online: https://www.fs.usda.gov/treesearch/pubs/39553 (accessed on 8 April 2022).
- Carla Lak Fire. Available online: https://www.deseret.com/1998/6/5/19384046/hundreds-fight-43-000-acre-alaska-wildfire (accessed on 8 April 2022).


Publisher’s Note: MDPI stays neutral with regard to jurisdictional claims in published maps and institutional affiliations. |
© 2022 by the author. Licensee MDPI, Basel, Switzerland. This article is an open access article distributed under the terms and conditions of the Creative Commons Attribution (CC BY) license (https://creativecommons.org/licenses/by/4.0/).