Article

Oscillatory Signatures in the Raindrop Motion Relative to the Air Medium with Terminal Velocity

by
Dmitrii N. Gabyshev
1,
Miklós Szakáll
2,
Dmitrii V. Shcherbakov
1,
Alexander A. Fedorets
1,* and
Sergey M. Dyachkov
1,3,4
1
X-BIO Institute, University of Tyumen, ul. Volodarskogo 6, 625003 Tyumen, Russia
2
Institute for Atmospheric Physics, Johannes Gutenberg University Mainz, Becherweg 21, 55128 Mainz, Germany
3
Tyumen Petroleum Research Center, ul. Osipenko 79/1, 625002 Tyumen, Russia
4
Tyumen Cardiology Research Center, Tomsk National Research Medical Center, Russian Academy of Sciences, per. Cooperative 5, 634009 Tomsk, Russia
*
Author to whom correspondence should be addressed.
Atmosphere 2022, 13(7), 1137; https://doi.org/10.3390/atmos13071137
Submission received: 22 June 2022 / Revised: 12 July 2022 / Accepted: 15 July 2022 / Published: 18 July 2022
(This article belongs to the Special Issue Feature Papers in Atmosphere Science)

Abstract

:
This paper aims to study the path oscillations of single, spherical water droplets levitated in a wind tunnel to better comprehend the mechanical motion of small raindrops. The observations were carried out in the Mainz vertical wind tunnel. The discrete, fast Fourier transform was used to determine the oscillatory frequencies of the droplet paths, and the Hilbert transform was applied to analyze their instantaneous frequency stability. Both transversal and streamwise components of the path oscillations are described with typical frequencies of several tens of Hertz. The studied oscillations elongate the paths, reduce the terminal velocity of the smallest droplets, and make the rain droplet fall in a non-uniform motion even after reaching terminal velocity. The terminal velocity can be considered as physically having been reached if our proposed practical criterion is satisfied. From a fluid mechanics perspective, the paper fills an experimental gap in the studies of the paths oscillations of single, liquid spheres of microscopic sizes at low Bond numbers <1 and relatively low Reynolds numbers ~102.

1. Introduction

There is a legend that in the 16th century Galileo Galilei climbed to the top of the Leaning Tower of Pisa and dropped balls of different masses from there. Thus, he refuted Aristotle’s statement that heavier objects fall faster than lighter ones. Choosing objects denser than air, Galilei intuitively recognized the necessity to minimize the air drag. However, if he had dropped small water drops, he might have hardly refuted Aristotle’s statement, because their motion is not so simple.
Later, Isaac Newton identified the oscillations of freely falling globes [1]. He procured a wooden vessel filled with rainwater and let fall small globes made up of wax with lead therein, 100–200 grain each (i.e., 5–10 g). He totally immersed the globes under water and lowered down their heaviest side to diminish rotational oscillations. The globes performed certain oscillations that had been damped on their own as they fell down after several oscillations. Although that process was non-steady, and the globes did not reach terminal velocity, Newton was the first who mentioned sphere oscillations in fluid.
Small rain droplets in the atmosphere are similar to Newtonian globes. The difference is that air serves as fluid, so they are easily carried away by wind. Even in still air, their motion can look objectless and pretty disorderly, which makes them difficult to observe. For the last decades, some researchers have been investigating the motion of spheres in fluid, attempting to neglect their seemingly random fluttering. Therefore, the experiments or calculations were performed either with fixed spheres flown around [2,3] or with dense spheres of a relatively large radius moved in stationary fluid [4]. However, little attention has been paid to the vibrational path motion of spheres superimposed on their averagely straight movement through fluid. Although there are a number of studies about vibrating cylinders [5,6,7], they have not described the case of spherical symmetry.
The oscillatory-like motion ultimately enables micro-sized drops to float in air for a longer time, just as roughness hinders a bar from sliding down an inclined plane. This is applicable particularly to human-produced drops [8]. Coughing produces about 3000 droplet nuclei, which is equivalent to the same number as talking for five minutes. Sneezing produces up to 40,000 droplets with diameters in the range between 0.5 and 12 μm. Therefore, airborne viruses always pose an increased threat to human health [9].
Large raindrops falling on soils breakup and eject fine secondary droplets upward. These droplets are in the range between units and hundreds of microns and can contain bacteria from the soil, assisting their spread over a wide area [10]. When breaking, the raindrop also splashes elements of the soil within microdroplets causing the rain’s odor [11]. Certainly, the prolonged duration of the aforementioned phenomena is due to the suspension and hover of microdroplets in the air. Hence, the spread of some agricultural diseases and pathogens is also possible via airborne transmission [12]. Some other important processes can be mentioned, such as the transfer of inclusions by droplets ejected from the hydrophobic surfaces of plant leaves during condensation [13,14] and coalescence [15,16], and bioprecipitation [17].
Anthropogenic aerosol particles greatly released into the atmospheric boundary layer over cities serve as cloud condensation nuclei, and the solar insolation is thereby decreased in polluted cities [18,19]. The cloud droplets formed on these nuclei tend to remain suspended for a long time because of their smallness requiring longer time to coalesce up to the size efficient for precipitation [20]. It is remarkable that during the great lockdown of 2020 it took several weeks for the air to be cleansed in a natural way [21].
As for rain, we should especially mention the natural fog and drizzle produced by low stratiform and stratocumulus clouds, normally between 100 μm and 500 μm in diameter with terminal velocity up to a few m/s. This type of precipitation is the most common over the world’s oceans. Its intensity is low (less 1 mm per hour), but it lasts many hours and, it is also accompanied by deteriorating horizon visibility. Another phenomenon which is worth noting is the so-called “virga”, which means broken tracks of droplets from clouds that evaporate before reaching the ground. Virgas impart a distinctive look to nimbostratus clouds. They are often seen in hot and dry climates (e.g., they are predominant in the atmosphere of Venus, where sulfuric acid rains evaporate at an altitude of about 25 km [22]). Apparently, the virga droplets overstay a little more in air due to the mechanical vibration, which causes their pathways to elongate, and they undergo an additional mass exchange in comparison with the case of averagely straightened paths [23,24,25,26]. Thus, the evaporation of raindrops in virgas may occur not only by differences in temperature and humidity between the clouds and air beneath them but additionally by the air blowing onto microdroplets that move along swirled trajectories.
All the last mentioned several phenomena of droplet overstay in air are caused by not only by air drag but also by vibrations developed according to vortex- and flow-induced physical mechanisms. Despite the wide relevance, vortex- and flow-induced vibrations have interested researchers only within artificial technical systems and engineering situations [27,28] To date, special attention has not been paid to the mechanical path oscillations of levitated microdroplets in the atmosphere at small Bond and relatively small Reynolds numbers [29,30]. Compared to Rayleigh shape oscillations [31,32,33]), we consider the droplets as rigid spheres. The reasons for atmospheric microdroplets to sway incessantly are debatable. On the one hand, there are small vortexes (eddies) with over-Kolmogorov sizes in the ambient air originating from natural atmospheric convection. On the other hand, there can be (self-excited) vortexes caused by the non-point-like droplet itself because it perturbs the oncoming flow, which can be laminar without the droplet’s presence [2,3,34]. Additionally, the mechanism of flow-induced vibration seems to contribute to the swaying motion of droplets [35].
This paper aims to identify the oscillatory signatures in the mechanical motion of single rain droplets. We modeled the case of the fluid moving relative to the almost motionless levitated droplet in a compact laboratory setup. We call the droplets “almost motionless” in the moving reference frame because they are motionless in this frame only on average, i.e., additional fluctuations and vibrations certainly output each droplet from the origin point. This additional motion includes not only a stochastic component but also periodical regularities. The study included high-speed video filming of droplets of microscopic size in the Mainz vertical wind tunnel [36,37], image processing, collecting space-time data on the droplets’ positions, and Fourier analysis of these data. This research is the first attempt to study the path oscillations of droplets with small Bond numbers (Bo < 1) and relatively small Reynolds numbers (Re ~ 102) under conditions close to the natural ones in the atmosphere. The results will enable us to comprehend the function of this phenomenon in nature.
The paper is structured as follows. Section 2 provides a brief review of both theoretical and experimental studies on the vibration of objects in a moving fluid medium. Section 3 describes the experimental setup used to record observations of raindrops. In Section 4, we explain the principles of recognition of the droplets on recorded frames and preparation of the data sets for subsequent numerical analysis. Section 5 explains the pre-processing of the experimental data. In Section 6, we proceed to the Fourier and Hilbert analyses of the data to extract significant frequencies and clarify their stability. Finally, we discuss the obtained findings (Section 7) and formulate conclusions (Section 8).

2. Current State of Research

Many laboratory setups enable reproducing real atmospheric conditions and meteorological processes [38]. Among them, there are setups of a wind-tube-type that have appeared since the 1900s [39]. In these setups, solid particles or liquid droplets (hydrometeors) levitate in a vertically upward-oriented airstream counteracting gravity. Similar conditions evolve when a precipitation drop falls from a cloud down to the ground. In other words, this drop acts like levitated one in an experimental setup but in a reference frame moving with terminal velocity. The meteorological setups are used to investigate the growth of droplets, concentrations of chemical components in them, phase transitions, deformation, disintegration, and backscattering. Conditions for the levitation of light particles and droplets are also created in levitators of different physical principles [40]. In all the cases, there is an inherent mechanical mobility of the particles with spontaneous random displacements. However, this mobility has usually been considered as a side effect and has not attracted researchers’ attention yet; only the smoothed trajectories of hydrometeors have been studied for many years [23,24,25,26]. Recently, a periodic trembling motion of levitated particles has been observed in experiments with acoustic and optical levitation [41,42]; however, it was predicted much earlier [43]. These particles participate in an oscillatory-like mechanical motion in a potential well, which determines the frequency of their oscillations. It is worth noting that some researchers have been interested in the stochastic motion in potential wells from a mathematical point of view for many decades [44,45].
Rain droplets falling in the atmosphere or levitating in a laboratory wind-tube setup are surrounded by a local potential well formed with the flow medium pathlines [46] by the Coandă effect. It is important for the Bernoulli effect, when a light ball floats stably in a vertically upward-oriented airstream [47], which is the basis of the Bernoulli blower toy. It is interesting that the recently invented droplet cluster technology provides similar conditions where horizontal arrays of water microdroplets levitate in a moist airflow ascending upward and form a planar regular structure [48]. Droplet clusters are characterized by some permanent wobble motion, just as the aforementioned particles in the levitators. In our previous studies, we introduced the issue of mechanical oscillations for both vertical [49,50] and planar horizontal components [51,52] of the droplet cluster motion. The close observation of tracer particles revealed vortexes beneath the droplet clusters [53].
The oscillations, or vibrations, with the vortex- and flow-induced nature are of special interest for many researchers. For example, to date the dynamics of tethered sphere were investigated numerically in [54]. The study of transverse oscillations of an elastically mounted sphere was also performed numerically [55] including for a sphere piercing the gas–liquid interface [56]. The study [57] focused on eddy simulations downstream of a sphere in the half-space near the free surface. A technique to control the vibrations using a base bleed actuation was presented in [58] with the possibility to suppress them. The use of rotation for control was first suggested in [59,60] Designing the roughness geometry of the sphere surface was also investigated in [61]. Some researchers have focused on the link between the transient velocity and terminal velocity at the flow past a sphere [62,63,64]. We believe that there is no reason for scientists to stop conducting research in this area.

3. Experimental Setup

Our experiment was performed in the Mainz vertical wind tunnel (Figure 1), in which water drops can be freely suspended at their respective terminal velocities [65] Outside air is sucked by two vacuum pumps through the wind tunnel. The air speed varies from 10 cm/s to 14 m/s with an accuracy of 1 cm/s in the observation section employed for these measurements. Air speed adaptation time is very short, approximately 250 ms, due to the deployed ultrasonic valve, which can be opened and closed quickly electronically by the operator. To avoid turbulence in the airflow in the observation section, a laminarization section is designed just below the contraction section of the wind tunnel. This laminarization section consists of a set of sieves and ensures that the airflow in the observation section of the wind tunnel is laminar with a residual turbulence intensity less than 0.5% [66]. During the experiment, the wind speed, the air temperature, and the dew point were continuously recorded. The air temperature was measured by a pt100 sensor, while the dew point was measured with a dew point hygrometer (DP3-D-SH-III, MBW Electronic).
Several similar-sized droplets with about 700 micron diameters were injected into the wind tunnel air stream using a hypodermic syringe. Before that, the air speed was set to the approximate terminal speed of the droplets, i.e., to ~3 m/s. The operator chose an appropriate droplet to be floated by visual inspection and kept the droplet at about the same position in the wind tunnel by manually changing the wind tunnel speed continuously. This adjustment was needed because the floated droplet was evaporating, and thus its size, and consequently, its terminal speed, continuously decreased. This enabled measuring different size droplets by recording them after different residence times in the wind tunnel. The recording was performed by a high-speed digital video camera (Motion ProX, Redlake, Inc., San Diego, CA, USA) at a frame rate of 1000 fps and a spatial resolution of 12 microns per pixel. For the imaging, background illumination was applied using a 400-W dc cold light lamp and an opal diffusing glass. Nevertheless, due to the 1:1 magnification used in the optical setup for the camera to achieve a high spatial resolution, the field of view of the camera was limited to about 1 cm × 1 cm × 1 cm. Consequently, the droplets were floating for only several hundred milliseconds in front of the camera. This time was, however, sufficient to perform the frequency analysis. The size of the floated droplets was calculated from the air speed needed to freely float them in the wind tunnel using the formula given in [67].
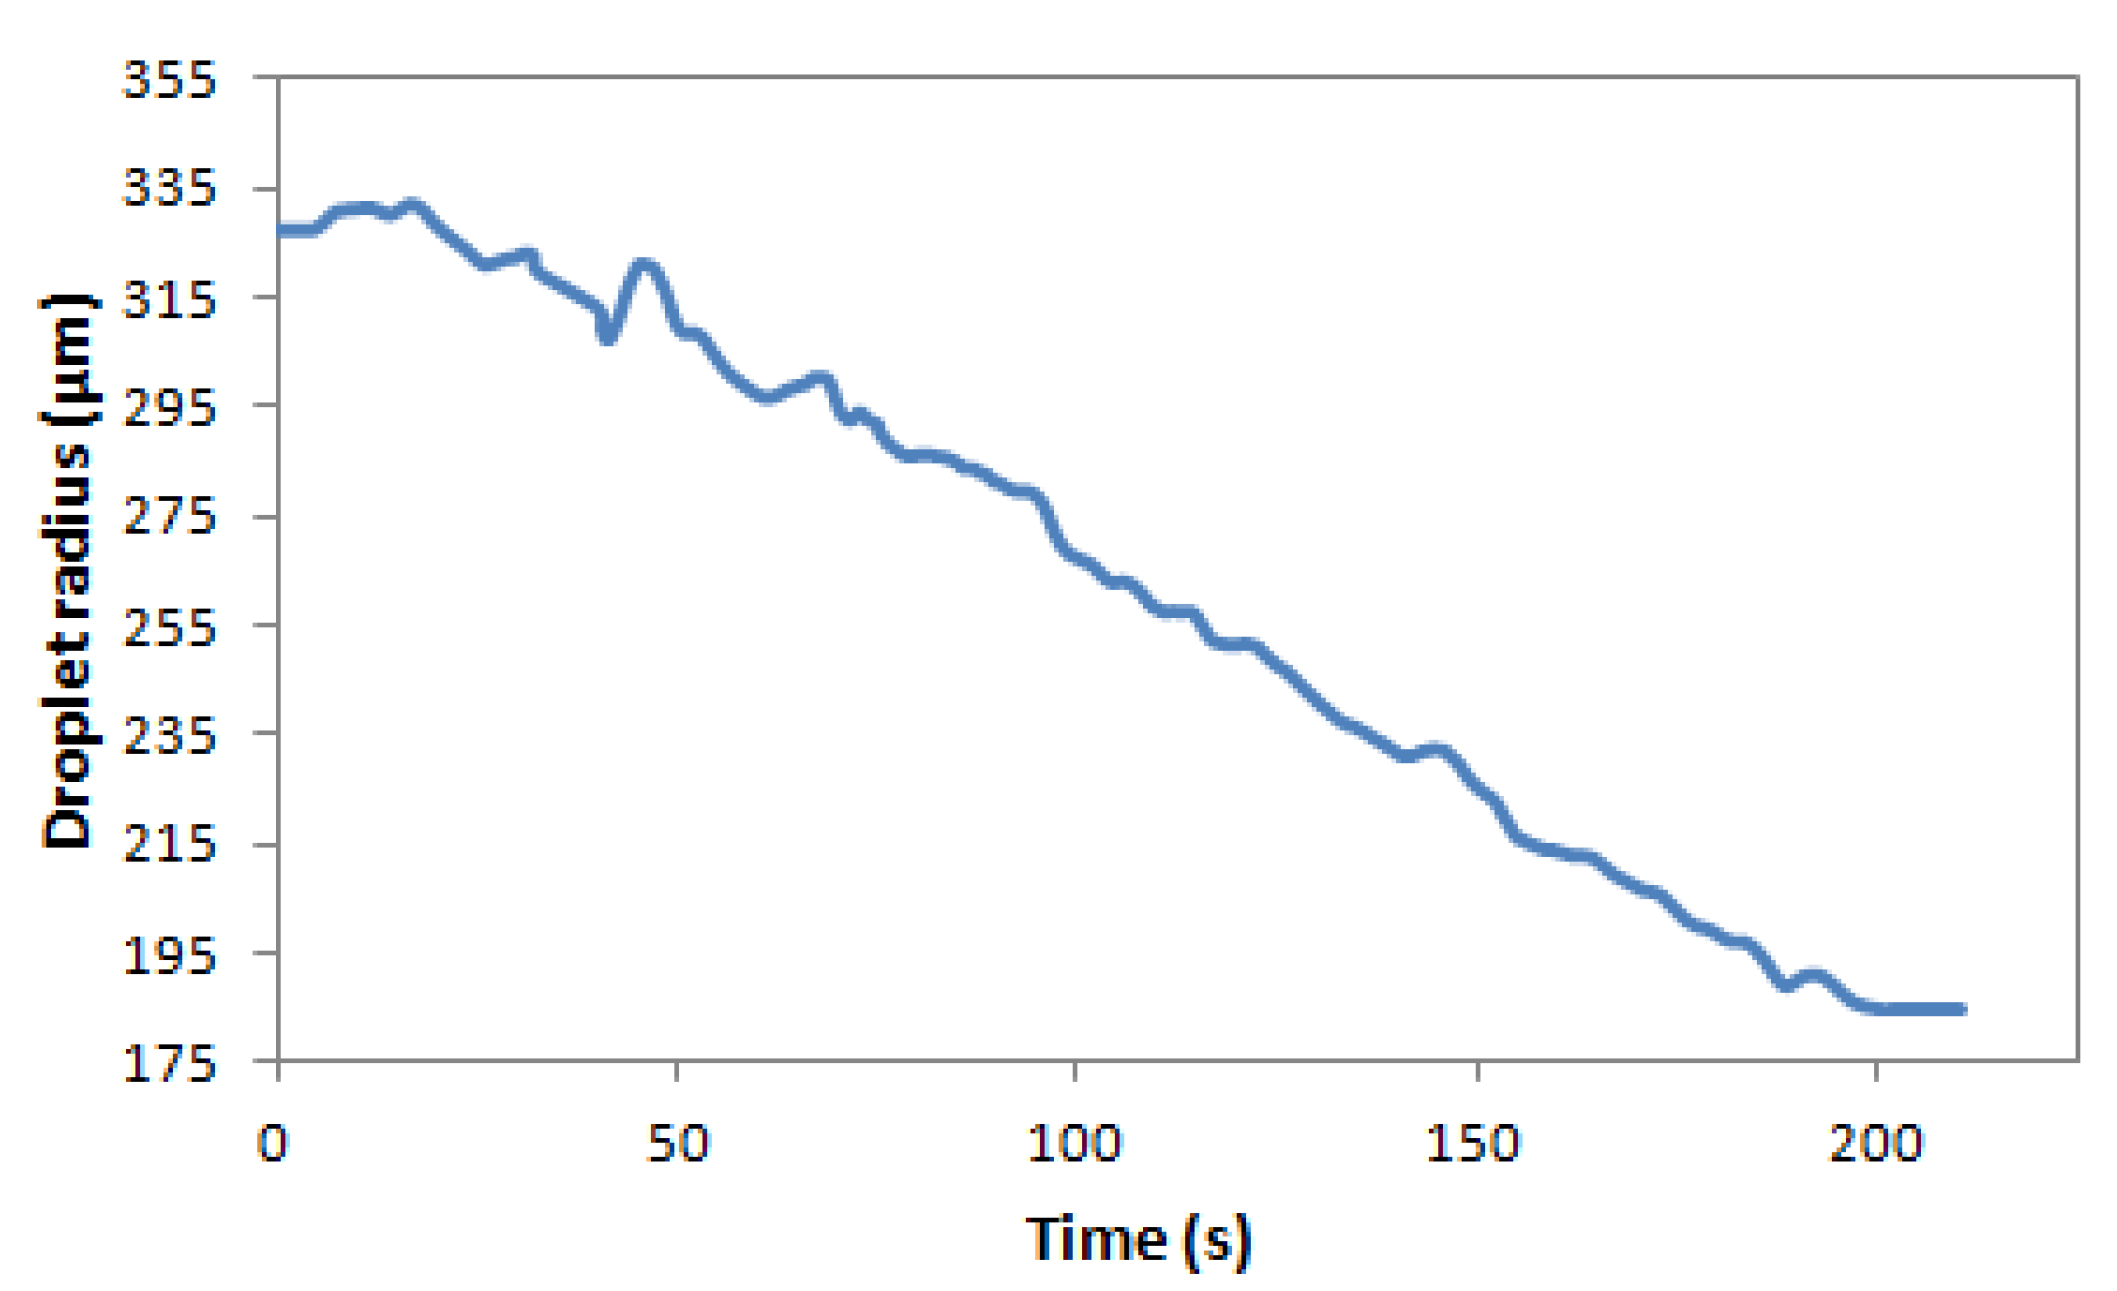
Figure 2 depicts the size change of the water droplets. The air temperature in the depicted measurements was ~21 °C, whereas the dew point was ~0 °C. This low humidity drove the evaporation of the water droplets. The evaporation rate of 0.8 micron per second can be calculated from Figure 2. Hence, during the whole recording period of a levitated droplet (~0.5 s) the radius decrease was 0.35 micron or 0.14% at the most.
Note that the fluctuation in the droplet size shown in Figure 2 originated from the freely floating nature of the experiments [68]. Each droplet was floating in the center of the wind tunnel at a pre-defined position of observation (see Figure 1). In some cases, the droplet tended to go to the wind tunnel wall, and it left its central position. The operator reduced the wind speed by approx. 0.1 m/s so that the droplet came into a flow field region at the boundary between the laminarization section and the observation section, where a small velocity dip exists in the center of the wind tunnel. The droplet position was more centered, and the velocity was increased again to the actual terminal velocity, and the droplet was floating again at the position of the observation. However, this was insignificant for short observations <1 s.

4. Automatic Detection of Droplets in Images

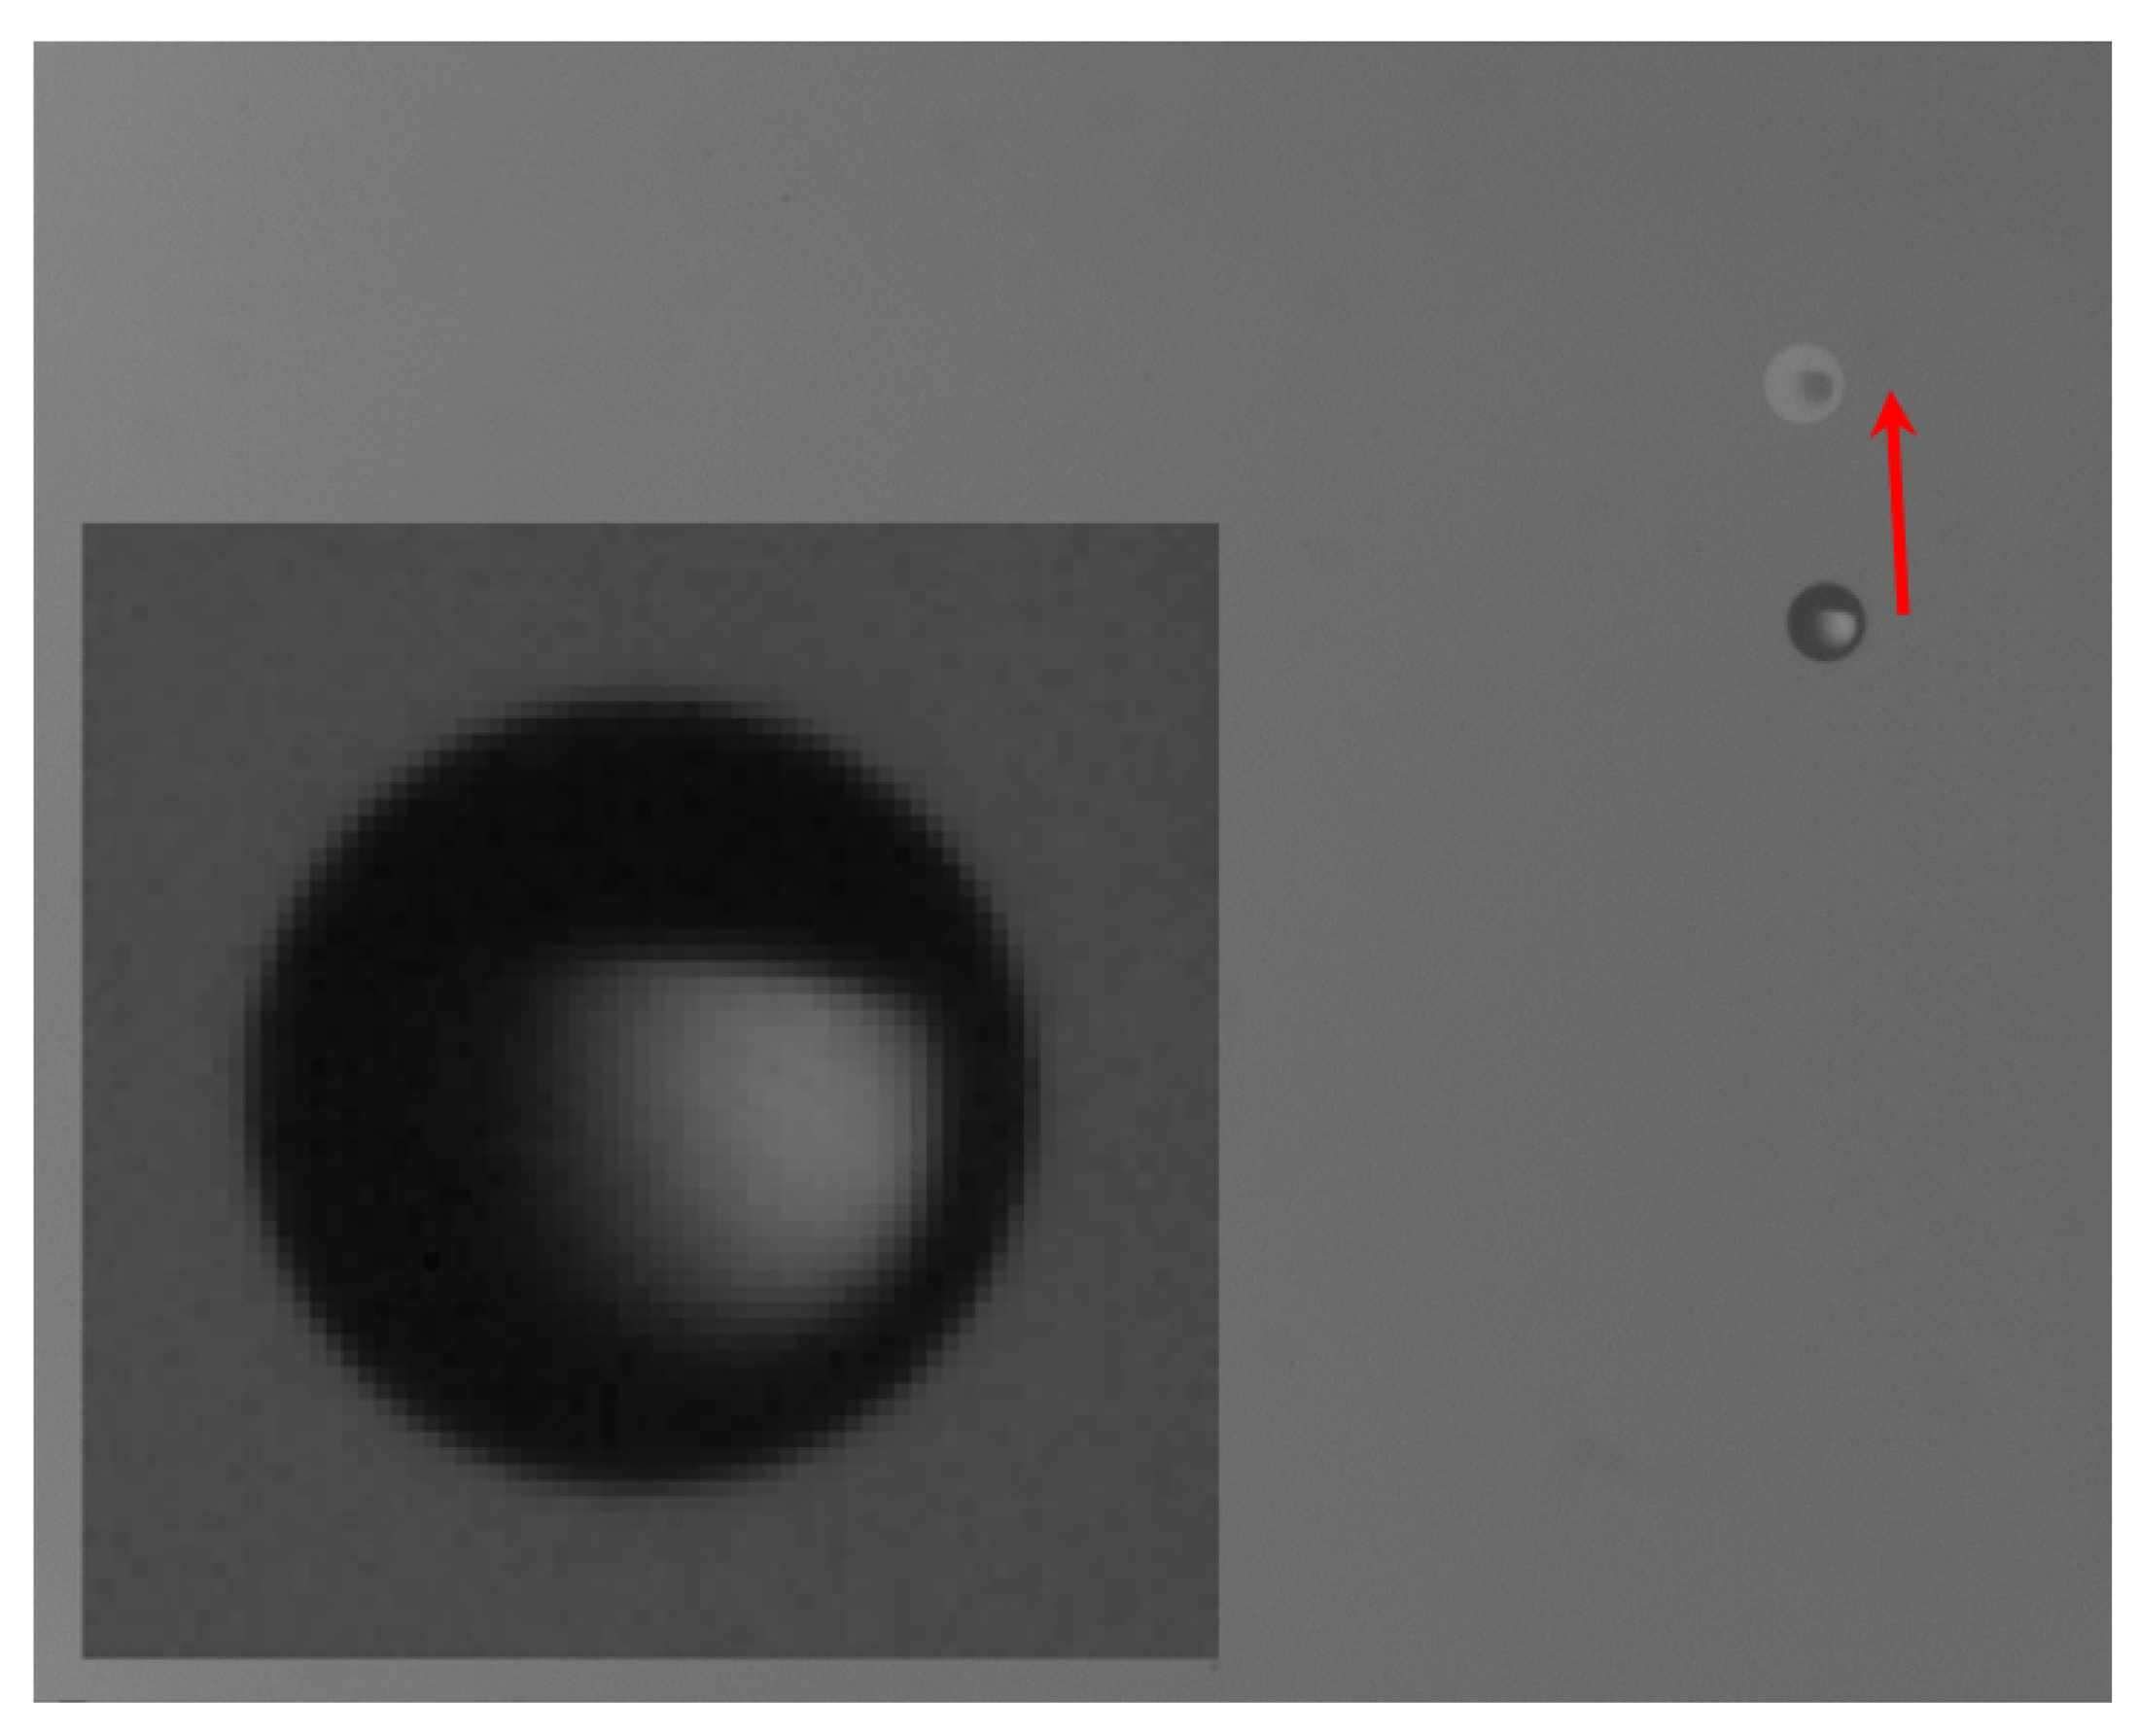
A series of photographs obtained in automatic mode from the laboratory setup are used as initial data (Figure 3). The photographs must be sharp enough to indicate the droplet boundary. Since the distance between the droplet and the camera is large, the droplet projects onto the photograph by parallel rays, and the diameter of the droplet image is equal to the droplet diameter. The open source OpenCV library is used to recognize the droplet. This library enables us to find various objects in images with determination of their parameters (position, size, tilt). In our particular case, we can get a list of droplets from the photograph (if there are several of them on it), the coordinates of their centers, and their average diameters.
Before searching for objects, the source file is prepared by processing according to the Gaussian algorithm (a slight blur in order to average the boundaries of objects). Then it is binarized (i.e., reduced to a monochrome palette) with certain parameters, which determine how accurately the boundary of the object will be recognized (to be precise, which shades will be recognized as the object and as the background).
The OpenCV library contains algorithms for searching for geometric objects, such as triangles, squares, and ellipses similar to circles. The droplet shade is often a rotated ellipse, and noise in the image (appearing for various reasons, e.g., low illumination, or object sizes that are too small, or image distortions in the camera’s optical pathway) makes the border of the object far from a smooth curve. Therefore, closed contours are searched for, such as contours of a certain length or inner contours located inside other contours (this effect is caused by lighting). The borders of the photograph are chosen as the coordinate axes: the horizontal x and vertical y. The result is a list of ellipses with the center coordinates, the size of the semi-axes, and the slope regarding the coordinate axes. The size of the ellipses is averaged, resulting in effective circles with coordinates and sizes in pixels, from which one can get the real sizes of the objects, knowing the shooting parameters or a predetermined image scale (12 microns per pixel in our case). The output data are summarized in a table used further for numerical analysis.

5. Data Processing

The recognition of each droplet enables us to determine its position with the coordinates xi and yi summarized in the table at the certain time moment ti = i/f (where 0 i k ). The position data contain drifts that are worth subtracting. The most common drifts are linear and quadratic, which can be written as follows:
A 0 + A 1 t + A 2 t 2 ,
where A0,1,2 are the coefficients obtained by quadratic approximation of the primary data set xi or yi. In Fourier analysis, drifts clog the spectrum near low frequencies. As a result, the sought frequency peaks may be masked. If the drifts are subtracted, a new dataset is obtained, which may be not completely devoid of drifts due to the random recognition error of the primary dataset. In this case, the procedure can be repeated until the data set is finally cleared. This process, usually called detrending, reduces noise at low frequencies and makes significant peaks more visible over the noise. In general, subtraction of trends is a quite common procedure. For example, it is used in mapping the cosmic microwave background with the anisotropic trend subtraction.
At the same time, we consider it inappropriate to subtract the cubic A3t3 and higher order drifts because starting with the cubic, such a drift may contain an oscillation with the largest possible period equal to T. For example, if the path law of the droplet x is close to the following curve
x = const · t · (tT) · (tT/2),
the spectrum obviously has a high peak at the frequency ν = 1/T.

6. Fourier Analysis

6.1. Applying of the Discrete Fast Fourier Transform

The following discrete Fourier transform enables us to analyze the frequency response for some quantity L:
L j = n = 0 N 1 l k exp ( 2 π i N k n ) ,           k = 0 ,   ,   N 1 ,
where N = 2m is the number of observation frames and m is an integer, and L corresponds to the droplet position on the coordinates x or y.
The recording frequency is f = 1000 frames per second. Whereas the interval intended for analysis must contain a number of frames equal to a power of two, N = 28 frames often fit in our observations. The duration of this interval is T = (N − 1)/f = 0.255 s, and therefore, with complete certainty we can select the following frequencies:
ν 1 / T ,
which is over 3.92 Hz. Frequency measurement error Δν is half of this value, i.e., ±1.96 Hz. All video recordings shorter than T = 0.255 s were discarded in order not to roughen the results. For longer video recordings containing several 0.255 s segments, averaging was applied over the segments’ spectra. This procedure is described in [65].
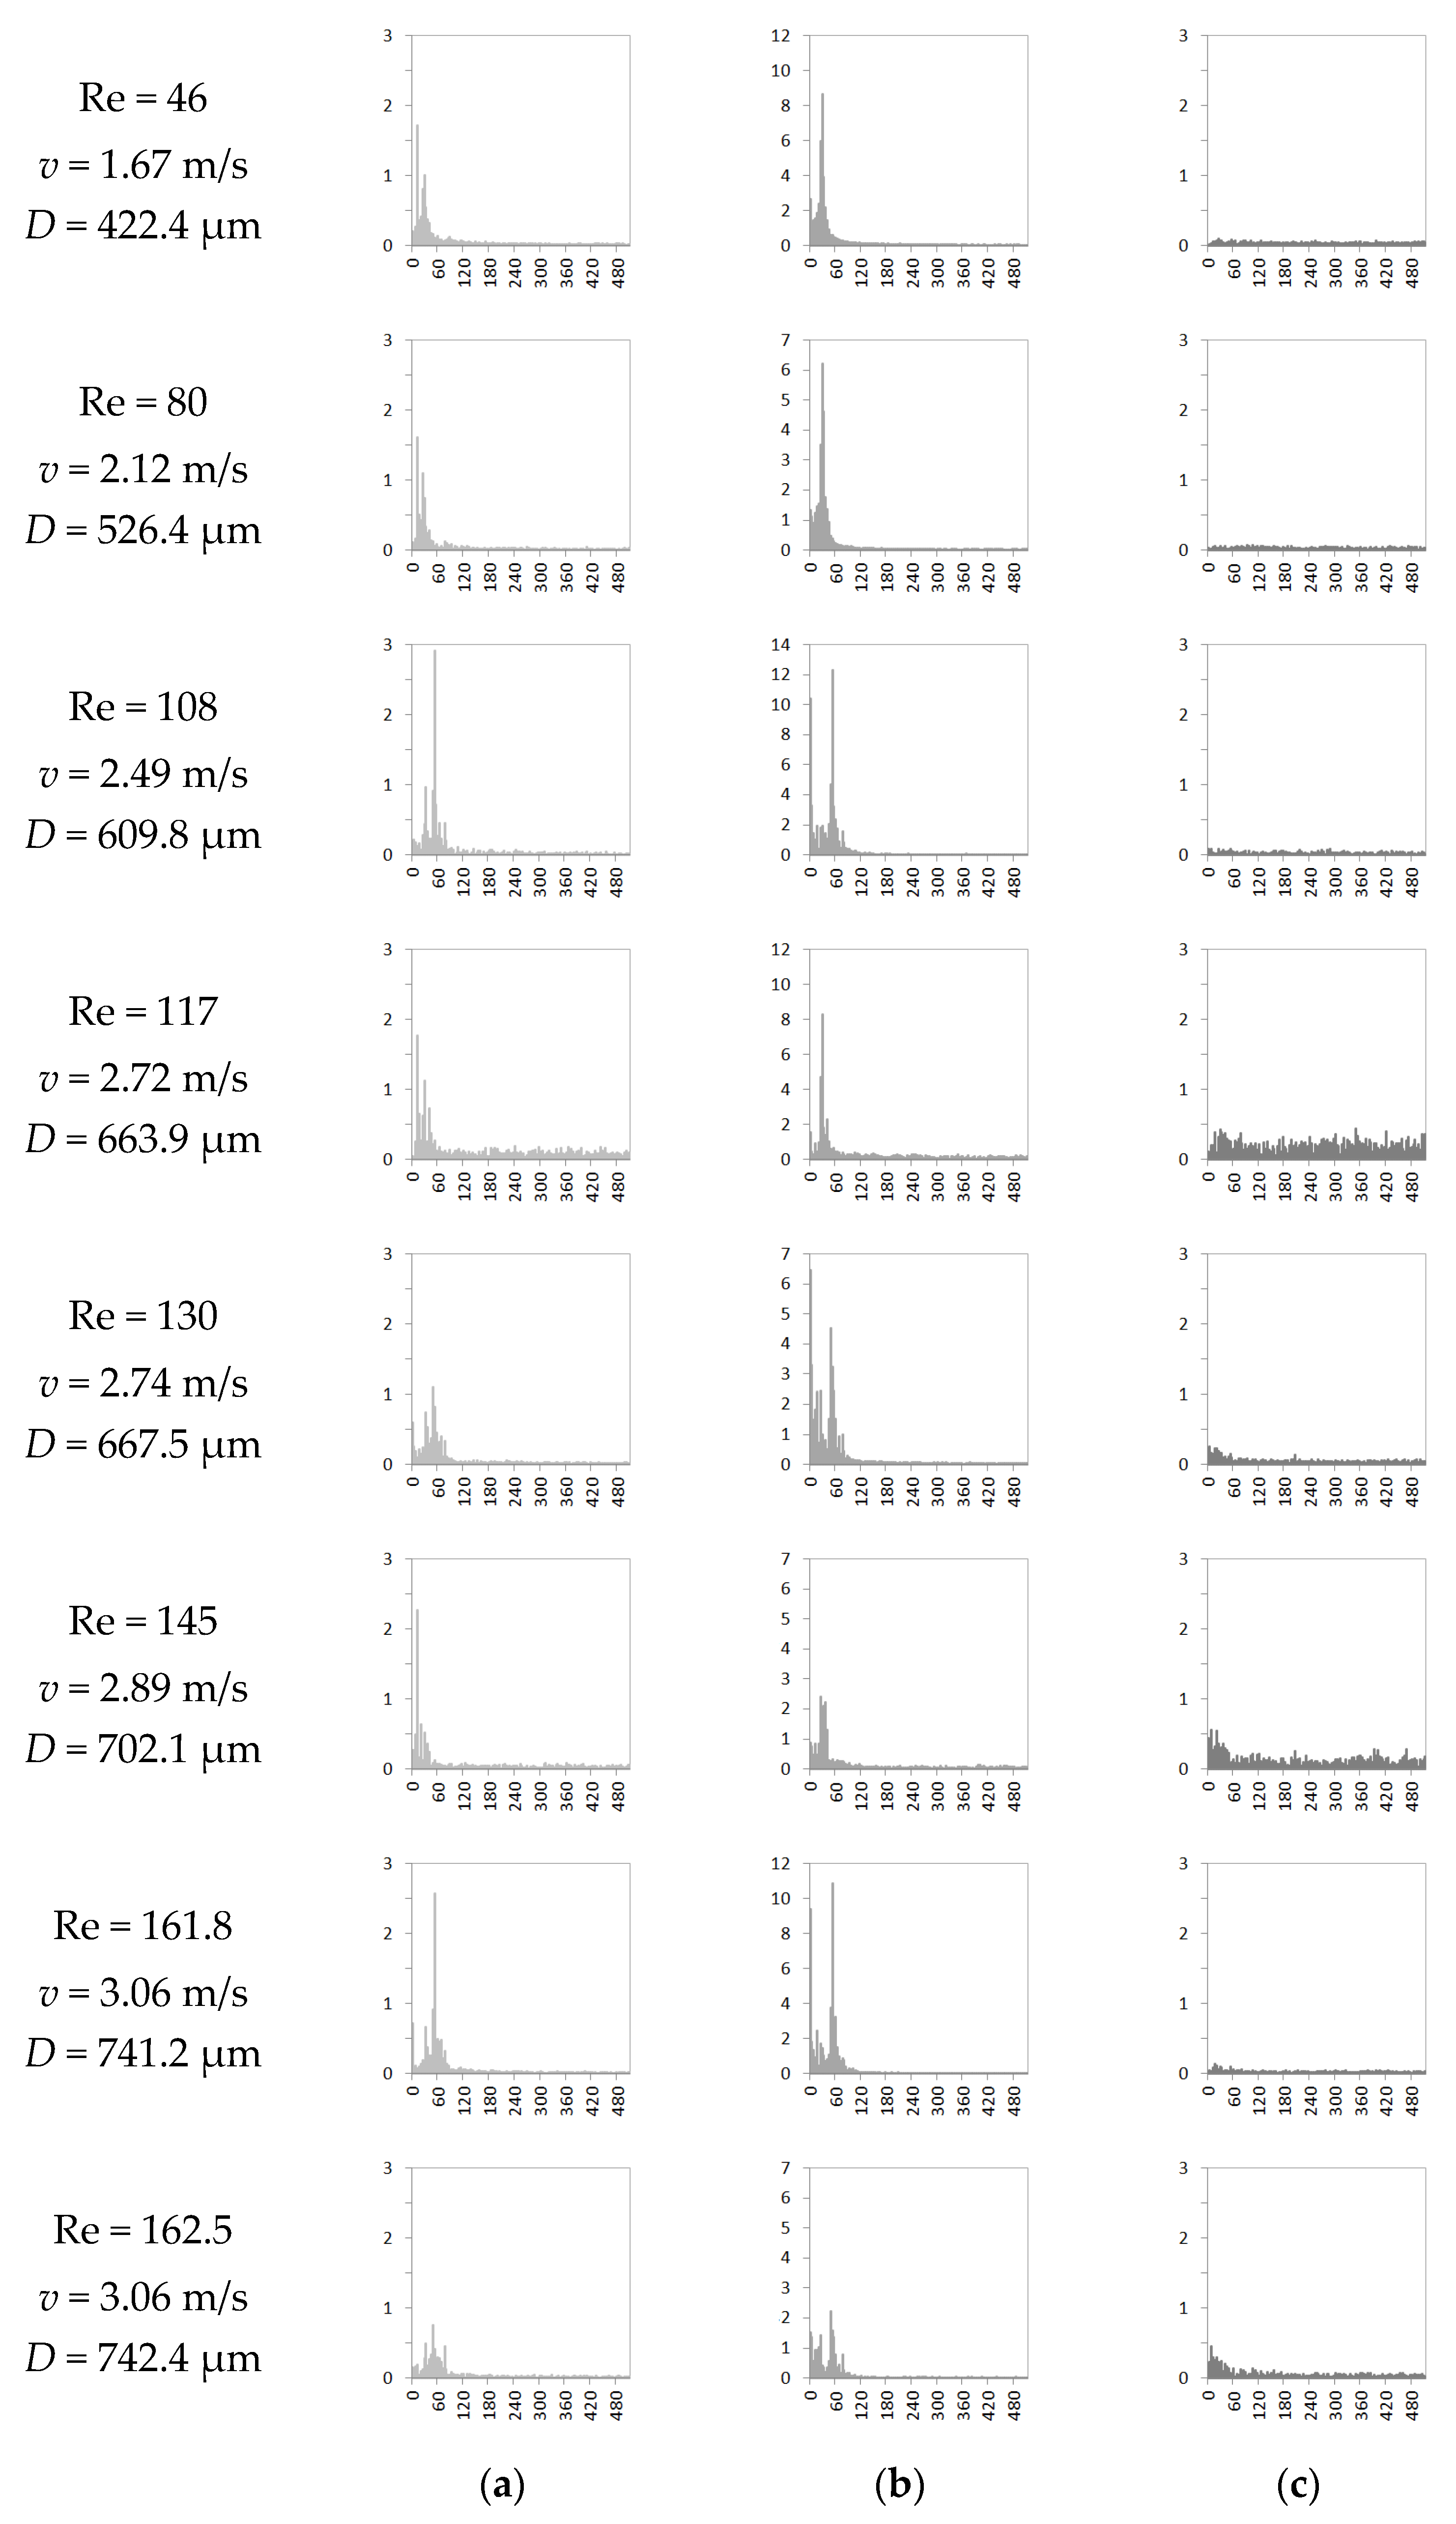
Figure 4 shows the result of applying the computational scheme for the Fourier analysis to our data obtained from the observations of the droplets in the wind tunnel. Since the primary unit of measuring the x and y coordinates is a pixel, the amplitude of the harmonics in the spectra is also measurable in pixels. Only those spectral peaks where amplitude exceeds one pixel can be considered significant because image pixilation limits clarity (Figure 3). Generally, since the spectral columns are quite wide (3.92 Hz), one should keep in mind that a certain oscillation may not be reflected in the spectrum if its energy is too small. A peak must not only be higher than one pixel in order to be significant, but it must also stand out well visually against the background noise. All these conditions are met successfully.

6.2. Applying of the Hilbert Transform for Instantaneous Frequency Analysis

To analyze frequency variance over time, instantaneous frequency concept was used. The most common algorithm to compute it is based on the Hilbert transform. For arbitrary signal x ( t ) , the Hilbert transform is defined as follows [69]:
H [ x ( t ) ] = def 1 π + x ( τ ) t τ d τ = h ( t ) .
Analytic or complex signal A ( t ) of x ( t ) has the following structure:
A ( t ) = x ( t ) + i h ( t ) .
It can be rewritten in the following way:
A ( t ) = F 1 { F [ x ( t ) ] 2 U } = E n v ( t ) exp [ i Φ ( t ) ] ,
where F is the Fourier transform, U is the unit step function, and E n v ( t ) is the amplitude envelope:
E n v ( t ) = | A ( t ) | = x ( t ) 2 + h ( t ) 2 .
The phase function defined in these terms is the following:
Φ ( t ) = arg A ( t ) = arctan [ h ( t ) x ( t ) ] .
Further, the instantaneous frequency can be computed as follows:
f ( t ) = 1 2 π d Φ ( t ) d t .
The common systems for mathematical calculations and program libraries for scientific computing do implement this transform. The SciPy implementation was used (Python (version: 3.9; developer: Python Software Foundation; License: Python Software Foundation License; Location of headquarter: Delaware, US; URL: https://www.python.org/psf-landing/, accessed on 22 May 2022). SciPy (version: 1.7.3; developer: Community library project; License: BSD; Location: Worldwide; URL: https://scipy.org/, accessed on 22 May 2022)) [70]. Tukey’s rule was used to remove outliers in the instantaneous frequency. To analyze the trend over time, the instantaneous frequency values were smoothed by the moving average (window size = 33). A distinctive feature of this analysis is that the number of frames can be arbitrary, whereas the fast Fourier transform requires a number necessarily equal to 2m. Therefore, now we are able to take recordings of full length.
The components x and y in each recording were analyzed separately, and then values of their instantaneous frequencies were compared with each other (see the example in Figure 5). The Student’s t test was used, and normality of distribution within each recording was assessed by the Shapiro–Wilk test. All the indicators are normally distributed in Figure 6 (the data are presented as “median value ± standard deviation”). The Kruskal–Wallis test was used because of the smallness of the statistical population of the observations, and the data are presented by colored rectangles as median values (a horizontal bar) between the limits of the first and third quartiles. The SciPy criteria implementation was used.

7. Discussion

The spectra for the diameter data do not have peaks (Figure 4). It means there is no any regular illumination flickering or a periodic instrumental error in the recognition of the droplet diameters. Hence, the peaks observed in the spectra for x and y associate neither with flicker of light and electric voltage in the illuminator network, nor a recognition error, either. In addition, the absence of considerable peaks in the spectra for the diameters means that the droplet walking from and toward the camera lens is small compared to the operational depth of the camera field. The camera is more tolerable of the object displacements out of focus at a large distance rather than at short distances when the diameter oscillations do contribute to the spectra [65].
In the averaged spectra for transverse x and streamwise y motion, only one significant peak higher than one pixel was mainly observed. The height of the peaks did not show a pronounced tendency to depend on the Reynolds number; it could locally increase and decrease with increasing Reynolds number. The peaks in the spectra for x and y cannot be attributed to the resonant frequency of the mechanical system of the camera because their heights were not constant from time to time with an always constant magnification. Surprisingly, the amplitude of the droplet oscillations along the flow (typically, several and dozen pixels) revealed to be larger than across the flow (one to two, or a few pixels). However, the difference between the amplitudes seems to be less given that the vibrations in the right/left and back/forth directions are equiprobably possible. Accordingly, the true amplitude must be close to the observed one multiplied by 2 . Thus, the oscillations in the vertical direction have approximately twice the amplitude of those in the horizontal direction. The energy is proportional to the squared amplitude. The droplet moves non-uniformly along y even nigh the terminal velocity, i.e., by jerks. Similar oscillations were revealed in the studies [71,72,73] where the transition process from the transient velocity to the settling (terminal) velocity was modeled for a sphere in viscoelastic fluid. In their model, they found that the sphere’s velocity tends to reach the settling velocity value with an overshoot to higher values and subsequent oscillations about the ultimate settling velocity. These oscillations follow after the overshoot and slowly decay. However, their model is not applicable to our case because the oscillations observed in our research are always present undamped and do not require an initial overshoot of the droplet velocity for their development.
In many cases, the peak frequencies were coupled between both directions. If a peak was in one direction, e.g., x, then it was also in the other direction, i.e., y. According to the discrete fast Fourier analysis, the peaks were in the range between 11.76 Hz and 50.98 Hz, with an error of ±1.96 Hz, and they did not have a pronounced tendency to depend on the Reynolds number.
The analysis of the instantaneous frequency showed the presence of some instability of the droplet oscillations with a frequency variation near a certain main value. Figure 7 illustrates this with the example of several successive observation sections, where different neighboring modes could compete with each other in the amplitude height. It was possible to distinguish clearly some average, most probable value (Figure 4). The diagrams in Figure 6 show some increase in frequency with increasing Reynolds number for the vibrations in the x direction. However, for the vibrations along y, rather, constancy is observed regardless of the Reynolds number due to the smallness of the set of observations.
The reasons for the types of frequencies in each observation are entirely unclear. Possibly, the Re range from 46 to 162 is rather narrow, and a few vortexes are developed around the droplet. The random addition or removal of one stable vortex may become a significant event throughout the timeline of the droplet and immediately change its frequency responses (Figure 7). At least in some size-limited dissipative systems, the number of vortexes matters [74].
Formulas for the pressure field in which a spherical body localizes within a fluid flow are available in fluid dynamics monographs [46,75]. As the Reynolds number increases, a bluff body approaches vortex shedding, galloping, and turbulence [5]. Usually the two-dimensional set of motion equations governs the transverse x and streamwise y motion of the bluff body [7]. The small scale of the oscillations enables us to hypothesize that they are caused not by external turbulence but by the droplet itself, which perturbs the oncoming flow. At Re ~ 100, although the vortex street accompanies the droplet, it must be laminar not turbulent [76].
From the following simple problem formulation, one can see that the vibrations of the droplet slow down its fall. Suppose that the center of mass of a small spherical droplet, participating in two antiphase horizontal oscillations with the same frequency ω, draws a circular helix with a radius r in space (imagine r > R for ease of understanding). As the droplet falls, its potential energy is converted into kinetic energy, rotational energy (as much as the great inertia moment is, according to Steiner’s theorem), and energy dissipation (cf. [77]. pl Ch. 2–10). The medium resists both the downward translational acceleration of the droplet and the circular rotation acceleration, thus stabilizing both values. As a result, all potential energy tends to be completely converted into the work of the medium drag. In the classical calculation of terminal velocity, the difference between the body weight and the drag force is equated to zero, but for our droplet with oscillations, the vectors of these forces no longer lie on the same straight line. Thus, to calculate the terminal velocity, it is easier to use the potential energy consumption at each turn of the helical trajectory. The terminal velocity of the droplet is less than the classical value, namely:
U = U t 2 + ( U t 2 ) 2 r 2 ω 2   ,
where Ut is the terminal velocity found in the classical way. In the case of small rω, we have the approximate equality:
U U t r 2 ω 2 U t   ,
hence
Δ U U t = r 2 ω 2 U t 2   .
Certainly, the derivation does not take into account those vertical streamwise vibrations, which also should be taken into account. For the droplets from our observations, the correction seems to be small (~10–7%) because the terminal velocity ranged from 2 to 3 m/s, with typical frequencies up to 50 Hz and the oscillation amplitude around 10–30 µm. However, in the experiments with single, levitated microdroplets with a diameter of about 50 μm, using the technology described in [51], bands of many oscillations were observed, and the correction to the terminal velocity could be at the level of ~10–4% (this percentage increases with decreasing a droplet size).
This is a little disappointing as we were initially motivated by the expectation that the effect could contribute to many observable and practical outcomes, such as easier coagulation of a nearby hydrometeor pair [78], enhancement of scavenging of dust aerosol particles from air due to the larger swept space volume [79], increase in collection efficiency [80] because of an increase in the collision probability of droplets with aerosol particles [81,82] during the gravitational sedimentation process [83], etc. These numerous processes apparently are driven and enhanced by the wake field of lower pressure behind the droplet, because this field draws matter in and particles from the outside, like a vacuum cleaner, and the effect is stronger with eddy shedding [84]. We admit that this effect is much more significant compared to the additional space sweeping by a droplet with mechanical vibrations.
Although the additional space sweeping is small, it is not equal to zero. Its contribution increases as the droplet decreases (as shown above, by three orders of magnitude from 10–7% to 10–4% with a tenfold decrease in the droplet size). We presume that it is important in the so-called Greenfield gap, where the collection efficiency was considered to be the minimum [85,86]. This gap is a particle range between 50 nm and 2 μm sizes behaving as tracer-like particles. These particles are sensitive to both inertia and Brownian motion.
Therefore, we believe that flow-induced motion should be taken into account additionally to the gravitational sedimentation movement for the proper calculation of particle dynamics in the atmosphere, along with the Cunningham correction factor [87], which is important to particles less than 15 μm in diameter at air in ambient conditions. The effective drag coefficient, apparently, can be slightly corrected for precipitation droplets of the smallest radius because an increase in the swept area should increase the effective droplet collision cross-section. Moreover, solid aerosol particles must have an additional periodic motion too, which is necessary to better understand patterns of dust sedimentation [88].
Finally, we would like to emphasize that a droplet approaches its terminal velocity Ut asymptotically with time t → ∞, which is not applicable from the physical point of view. Therefore, the characteristic time of reaching the terminal velocity could be the time, which corresponds to the moment, when the lack of current velocity v to the terminal value Ut relates to the same terminal velocity as e:
U t v U t < 1 e .
hence, we derive
v > v t e r ( 1 1 e ) = 0.63 v t e r .
However, it looks strange because a droplet in its timeline seems to expect almost half of the velocity gain. Thus, we suggest another criterion, when the droplet could be considered as physically having reached its terminal velocity:
v U t < r 2 ω 2 U t   .
Here r can be not only the radius of a circular helix trajectory as above but also the amplitude of the oscillations, in general. The last inequality means that as soon as it has performed, the increase in velocity value cannot be noticed.

8. Conclusions

The behavior of falling raindrops in the atmosphere is far from simple uniform movement along smooth and straight pathways. Apparently, the presence of a non-point-like droplet in an initially laminar airflow creates perturbations that quickly acquire a regular character. We have attempted to identify the signatures of mechanical droplet vibrations based on an original experimental technique. We observed the levitation of micro-sized water droplets in the Mainz vertical wind tunnel. Fourier and Hilbert transforms were applied to find regularities in the data on the position of droplets in the field of view of the high-speed video camera.
We ascertained that the path oscillations of droplets do exist. The amplitude of streamwise oscillations was revealed to be larger than that of transverse oscillations. Interestingly, the presence of streamwise oscillations means that the fall of the droplet is a non-uniform motion even when terminal velocity is reached. At the same time, the vibration slightly reduces the real terminal velocity in comparison to the classical one, which is usually calculated assuming the straightness and verticality of the path. In general, the discrete fast Fourier analysis did not show a pronounced tendency for the height and position of the spectral peaks to depend on the Reynolds number, droplet mass, and terminal velocity. The possible reason for this is the relatively narrow operating range of the Reynolds number available in our research and that the series were statistically not numerous. However, the analysis of the instantaneous frequency showed that the oscillation frequencies along x seem to grow with increasing Reynolds number. As a suggestion for further research, we recommend plotting the thick cloud of points in the “frequency” vs. “Reynolds number” or “droplet mass” axes.
It remains unclear why this or that frequency is revealed out of all the possible ones. Based on the previous studies [51,52,65], we are inclined to believe that droplet oscillations are of a self-excited nature since they were previously identified in the observations with droplet clusters within an absolutely laminar ascending flow. Nevertheless, it is also possible that the oscillations are partially related to external conditions, such as residual turbulence intensity < 0.5%. The properties of the droplet (diameter, mass) necessarily leave their decisive imprint, and the resulting spectra must be determined partly by the external conditions but mainly by the droplet’s own properties. The droplet is localized in the potential well formed by the radial pressure field. Pulsating distortions in the oncoming flow can generate vortexes that regularly strike the droplet. This laboratory observation of microdroplet path oscillations at low Bond and relatively low Reynolds numbers is expected to be unique.
The studied phenomenon seems to be significant in the Greenfield gap, which includes particles ranging in size from 50 nm to 2 μm. Therefore, the flow-induced oscillations of aerosol particles at micro-scale are seemingly as important as corrections for non-continuity, such as the Cunningham correction factor. This should somehow be taken into account in the correct calculation of particle dynamics in the atmosphere.

Author Contributions

Conceptualization, D.N.G.; methodology, M.S. and D.N.G.; software, D.V.S.; validation, D.N.G.; formal analysis, D.N.G. and S.M.D.; investigation, M.S. and D.N.G.; resources, M.S. and A.A.F.; data curation, M.S.; writing—original draft preparation, D.N.G.; writing—review and editing, M.S. and A.A.F.; visualization, D.N.G., M.S., D.V.S., and S.M.D.; supervision, D.N.G.; project administration, D.N.G. All authors have read and agreed to the published version of the manuscript.

Funding

This research received no external funding.

Conflicts of Interest

The authors declare no conflict of interest.

References

  1. Newton, I. The Mathematical Principles of Natural Philosophy; Motte, A., Translator; Daniel Adee: New-York, NY, USA, 1846. [Google Scholar]
  2. Sakamoto, H.; Haniu, H. A Study on Vortex Shedding from Spheres in a Uniform Flow. J. Fluids Eng. 1990, 112, 386. [Google Scholar] [CrossRef]
  3. Prządka, A.; Miedzik, J.; Gumowski, K.; Goujon-Durand, S.; Wesfreid, J.E. The wake behind the sphere; analysis of vortices during transition from steadiness to unsteadiness. Arch. Mech. 2008, 60, 467. [Google Scholar]
  4. Wang, P.K.; Chueh, C.-C. A numerical study on the ventilation coefficients of falling lobed hailstones. Atmos. Res. 2020, 234, 104737. [Google Scholar] [CrossRef]
  5. Bearman, P.W. Vortex Shedding from Oscillating Bluff Bodies. Ann. Rev. Fluid Mech. 1984, 16, 195. [Google Scholar] [CrossRef]
  6. Franzini, G.R.; Fujarra, A.L.C.; Meneghini, J.R.; Korkischko, I.; Franciss, R. Experimental investigation of Vortex-Induced Vibration on rigid, smooth and inclined cylinders. J. Fluid. Struct. 2009, 25, 742. [Google Scholar] [CrossRef]
  7. Ali, U.; Islam, M.; Janajreh, I.; Fatt, Y.; Alam, M. Flow-Induced Vibrations of Single and Multiple Heated Circular Cylinders: A Review. Energies 2021, 14, 8496. [Google Scholar] [CrossRef]
  8. Atkinson, J.; Chartier, Y.; Pessoa-Silva, C.L.; Jensen, P.; Li, Y.; Seto, W.-H. Natural Ventilation for Infection Control in Health-Care Settings; World Health Organisation: Geneva, Switzerland, 2009. Available online: https://www.ncbi.nlm.nih.gov/books/NBK143284/ (accessed on 20 May 2022).
  9. Dombrovsky, L.A.; Fedorets, A.A.; Bormashenko, E.; Nosonovsky, M. Modeling evaporation of water droplets carrying virus particles. Atmosphere 2020, 11, 965. [Google Scholar] [CrossRef]
  10. Joung, Y.S.; Ge, Z.; Buie, C.R. Bioaerosol generation by raindrops on soil. Nat. Commun. 2017, 8, 14668. [Google Scholar] [CrossRef]
  11. Joung, Y.S.; Buie, C.R. Aerosol generation by raindrop impact on soil. Nat. Commun. 2015, 6, 6083. [Google Scholar] [CrossRef] [Green Version]
  12. Kim, S.; Park, H.; Gruszewski, H.A.; Schmale, D.G.; Jung, S. Vortex-induced dispersal of a plant pathogen by raindrop impact. Proc. Natl. Acad. Sci. USA 2019, 116, 4917. [Google Scholar] [CrossRef] [Green Version]
  13. Nath, S.; Ahmadi, S.F.; Gruszewski, H.A.; Budhiraja, S.; Bisbano, C.E.; Jung, S.; Schmale, D.G.; Boreyko, J.B. ‘Sneezing’ plants: Pathogen transport via jumping-droplet condensation. J. R. Soc. Interface 2019, 16, 20190243. [Google Scholar] [CrossRef] [PubMed]
  14. Mukherjee, R.; Gruszewski, H.A.; Bilyeu, L.T.; David, G.; Schmale III, D.G.; Boreyko, J.B. Synergistic dispersal of plant pathogen spores by jumping-droplet condensation and wind. Proc. Natl. Acad. Sci. USA 2021, 118, e2106938118. [Google Scholar] [CrossRef] [PubMed]
  15. Wasserfall, J.; Figueiredo, P.; Kneer, R.; Rohlfs, W.; Pischke, P. Coalescence-induced droplet jumping on superhydrophobic surfaces: Effects of droplet mismatch. Phys. Rev. Fluids 2017, 2, 123601. [Google Scholar] [CrossRef]
  16. Liu, C.; Zhao, M.; Zheng, Y.; Cheng, L.; Zhang, J.; Tee, C.A.T.H. Coalescence-Induced Droplet Jumping. Langmuir 2021, 37, 983. [Google Scholar] [CrossRef]
  17. Benzerara, K. Bioprecipitation. In Encyclopedia of Astrobiology; Springer: Berlin/Heidelberg, Germany, 2011; p. 200. [Google Scholar] [CrossRef]
  18. Baker, M.B.; Peter, T. Small-scale cloud processes and climate. Nature 2008, 451, 299. [Google Scholar] [CrossRef]
  19. Twomey, S. The Influence of Pollution on the Shortwave Albedo of Clouds. J. Atmos. Sci. 1977, 34, 1149. [Google Scholar] [CrossRef] [Green Version]
  20. Albrecht, B.A. Aerosols, Cloud Microphysics, and Fractional Cloudiness. Science 1989, 245, 1227. [Google Scholar] [CrossRef]
  21. Venter, Z.S.; Aunan, K.; Chowdhury, S.; Lelieveld, J. COVID-19 lockdowns cause global air pollution declines. Proc. Natl. Acad. Sci. USA 2020, 117, 18984. [Google Scholar] [CrossRef]
  22. Titov, D.V.; Ignatiev, N.I.; McGoulgrick, K.; Wilquet, V.; Wilson, C.F. Clouds and Hazes of Venus. Space Sci. Rev. 2018, 214, 126. [Google Scholar] [CrossRef] [Green Version]
  23. Walton, L.R.; Walker, J.N. The Trajectory of an Evaporating Water Droplet Falling in an Airstream. Trans. ASAE 1970, 13, 0158. [Google Scholar] [CrossRef]
  24. Marchant, J.A. Calculation of spray droplet trajectory in a moving airstream. J. Agric. Eng. Res. 1977, 22, 93. [Google Scholar] [CrossRef]
  25. Oleskiw, M.M.; Grandia, K.L.; Rudolph, R.C. Airflow and droplet trajectory model to determine sensor placement on cloud physics research aircraft. J. Weather Mod. 1985, 17, 45. [Google Scholar]
  26. Finstad, K.J.; Lozowski, E.P.; Gates, E.M. A Computational Investigation of Water Droplet Trajectories. J. Atmos. Ocean. Technol. 1988, 5, 160. [Google Scholar] [CrossRef]
  27. Blevins, R.D. Flow-Induced Vibration; Krieger Publishing Company: Malabar, FL, USA, 2001. [Google Scholar]
  28. Sarpkaya, T. A critical review of the intrinsic nature of vortex-induced vibrations. J. Fluid. Struct. 2004, 19, 389. [Google Scholar] [CrossRef]
  29. Ern, P.; Risso, F.; Fabre, D.; Magnaudet, J. Wake-Induced Oscillatory Paths of Bodies Freely Rising or Falling in Fluids. Annu. Rev. Fluid Mech. 2012, 44, 97. [Google Scholar] [CrossRef] [Green Version]
  30. Tiwari, S.S.; Pal, E.; Bale, S.; Minocha, N.; Patwardhan, A.W.; Nandakumar, K.; Joshi, J.B. Flow past a single stationary sphere, 2. Regime mapping and effect of external disturbances. Powder Technol. 2020, 365, 215. [Google Scholar] [CrossRef]
  31. Beard, K.V.; Ochs, H.T.; Kubesh, R.J. Natural oscillations of small raindrops. Nature 1989, 342, 408. [Google Scholar] [CrossRef]
  32. Szakáll, M.; Mitra, S.K.; Diehl, K.; Borrmann, S. Shapes and oscillations of falling raindrops—A review. Atmos. Res. 2010, 97, 416. [Google Scholar] [CrossRef]
  33. Zhang, B.; Ling, Y.; Tsai, P.-H.; Wang, A.-B.; Popinet, S.; Zaleski, S. Short-term oscillation and falling dynamics for a water drop dripping in quiescent air. Phys. Rev. Fluids 2019, 4, 123604. [Google Scholar] [CrossRef] [Green Version]
  34. Miedzik, J.; Gumowski, K.; Goujon-Durand, S.; Wesfreid, J.E.; Bouchet, G. Wake behind a sphere in early transitional regimes. In Fifth Conference on Bluff Body Wakes and Vortex-Induced Vibrations; Costa de Sauípe: Bahia, Brazil, 2007. [Google Scholar]
  35. Horowitz, M.; Williamson, C.H.K. The effect of Reynolds number on the dynamics and wakes of freely rising and falling spheres. J. Fluid Mech. 2010, 651, 251. [Google Scholar] [CrossRef]
  36. Szakáll, M.; Diehl, K.; Mitra, S.K.; Borrmann, S. A Wind Tunnel Study on the Shape, Oscillation, and Internal Circulation of Large Raindrops with Sizes between 2.5 and 7.5 mm. J. Atmos. Sci. 2009, 66, 755. [Google Scholar] [CrossRef]
  37. Szakáll, M.; Urbich, I. Wind tunnel study on the size distribution of droplets after collision induced breakup of levitating water drops. Atmos. Res. 2018, 213, 51. [Google Scholar] [CrossRef]
  38. Chang, K.; Bench, J.; Brege, M.; Cantrell, W.; Chandrakar, K.; Ciochetto, D.; Mazzoleni, C.; Mazzoleni, L.R.; Niedermeier, D.; Shaw, R.A. A Laboratory Facility to Study Gas–Aerosol–Cloud Interactions in a Turbulent Environment: The Π Chamber. Bull. Am. Meteorol. Soc. 2016, 97, 2343. [Google Scholar] [CrossRef]
  39. Lenard, P. Rain. Q. J. R. Meteorol. Soc. 1905, 31, 62. [Google Scholar] [CrossRef]
  40. Davis, E.J. A History of Single Aerosol Particle Levitation. Aerosol Sci. Technol. 1997, 26, 212–254. [Google Scholar] [CrossRef] [Green Version]
  41. Andrade, M.A.B.; Pérez, N.; Adamowski, J.C. Experimental study of the oscillation of spheres in an acoustic levitator. J. Acoust. Soc. Am. 2014, 136, 1518–1529. [Google Scholar] [CrossRef]
  42. Moore, J.; Martin, L.L.; Maayani, S.; Kim, K.H.; Chandrahalim, H.; Eichenfield, M.; Martin, I.R.; Carmon, T. Regular oscillations and random motion of glass microspheres levitated by a single optical beam in air. Opt. Express 2016, 24, 2850–2857. [Google Scholar] [CrossRef] [PubMed]
  43. Miller, J.B.; Clark, B.C. Feasibility Study for Gas-Grain Simulation Facility: NASA Contractor Report 177468; Ames Research Center, Martin Marietta Astronautics Group: Moffett Field, CA, USA, 1987. [Google Scholar]
  44. Gitterman, M. The Noisy Oscillator: The First Hundred Years from Einstein until Now; World Scientific: Singapore, 2005. [Google Scholar] [CrossRef]
  45. Coffey, W.T.; Kalmykov, Y.P. The Langevin Equation: With Applications to Stochastic Problems in Physics, Chemistry and Electrical Engineering. World Scientific: Singapore, 2017. [Google Scholar] [CrossRef]
  46. Milne-Thomson, L.M. Theoretical Hydrodynamics; The Macmillan And Company: London, UK, 1962; p. 464. Available online: https://archive.org/details/theoreticalhydro033283mbp/page/n493 (accessed on 22 May 2022).
  47. McDonald, K.T. Levitating beachballs. Am. J. Phys. 2000, 68, 388. [Google Scholar] [CrossRef]
  48. Fedorets, A.A. Droplet cluster. J. Exp. Theor. Phys. Lett. 2004, 79, 372. [Google Scholar] [CrossRef]
  49. Gabyshev, D.N. Damping Oscillations of Microdroplets of a Droplet Cluster in an External Electric Field. Phys. Wave Phenom. 2018, 26, 221. [Google Scholar] [CrossRef]
  50. Andreev, S.N.; Gabyshev, D.N. Oscillatory Motion of Microdroplets of a Droplet Cluster in a Linearly Nonuniform Electric Field. Bull. Lebedev Phys. Inst. 2018, 45, 257. [Google Scholar] [CrossRef]
  51. Fedorets, A.A.; Aktaev, N.E.; Gabyshev, D.N.; Bormashenko, E.; Dombrovsky, L.A.; Nosonovsky, M. Oscillatory Motion of a Droplet Cluster. J. Phys. Chem. C 2019, 123, 23572. [Google Scholar] [CrossRef]
  52. Fedorets, A.A.; Gabyshev, D.N.; Shcherbakov, D.; Bormashenko, E.; Dombrovsky, L.A.; Nosonovsky, M. Vertical oscillations of droplets in small droplet clusters. Colloids Surf. A 2021, 628, 127271. [Google Scholar] [CrossRef]
  53. Fedorets, A.A.; Frenkel, M.; Legchenkova, I.; Shcherbakov, D.V.; Dombrovsky, L.A.; Nosonovsky, M.; Bormashenko, E. Self-Arranged Levitating Droplet Clusters: A Reversible Transition from Hexagonal to Chain Structure. Langmuir 2019, 35, 15330. [Google Scholar] [CrossRef]
  54. Govardhan, R.N.; Williamson, C.H.K. Vortex-induced vibrations of a sphere. J. Fluid Mech. 2005, 531, 11. [Google Scholar] [CrossRef]
  55. Rajamuni, M.M.; Thompson, M.C.; Hourigan, K. Transverse flow-induced vibrations of a sphere. J. Fluid Mech. 2018, 837, 931. [Google Scholar] [CrossRef]
  56. Chizfahm, A.; Joshi, V.; Jaiman, R. Transverse flow-induced vibrations of a sphere in the proximity of a free surface: A numerical study. J. Fluids Struct. 2021, 101, 103224. [Google Scholar] [CrossRef]
  57. Hassanzadeh, R.; Sahin, B.; Ozgoren, M. Large eddy simulation of free-surface effects on the wake structures downstream of a spherical body. Ocean. Eng. 2012, 54, 213. [Google Scholar] [CrossRef]
  58. Chizfahm, A.; Jaiman, R. Data-driven stability analysis and near-wake jet control for the vortex-induced vibration of a sphere. Phys. Fluids 2021, 33, 044104. [Google Scholar] [CrossRef]
  59. Li, Z.; Gao, N. Experimental Study of Flow Around a Rotating Sphere at a Moderate Reynolds Number. In Proceedings of the ASME 2018 5th Joint US-European Fluids Engineering Division Summer Meeting, Montreal, QC, Canada, 15–20 July 2018. [Google Scholar] [CrossRef]
  60. McQueen, T.; Zhao, J.; Sheridan, J.; Thompson, M.C. Feedback control of flow-induced vibration of a sphere. J. Fluid Mech. 2020, 889, A30. [Google Scholar] [CrossRef]
  61. David, T.; Eshbal, L.; Rinsky, V.; van Hout, R. Flow measurements in the near wake of a smooth sphere and one mimicking a pine cone. Phys. Rev. Fluids 2020, 5, 074301. [Google Scholar] [CrossRef]
  62. Goyal, N.; Derksen, J.J. Direct simulations of spherical particles sedimenting in viscoelastic fluids. J. Non-Newton. Fluid Mech. 2012, 183–184, 1–13. [Google Scholar] [CrossRef]
  63. Amaratunga, M.; Rabenjafimanantsoa, H.A.; Time, R.W. Influence of low-frequency oscillatory motion on particle settling in Newtonian and shear-thinning non-Newtonian fluids. J. Pet. Sci. Eng. 2020, 196, 107786. [Google Scholar] [CrossRef]
  64. Raaghav, S.K.R.; Poelma, C.; Breugem, W.-P. Path instabilities of a freely rising or falling sphere. Int. J. Multiph. Flow 2022, 153, 104111. [Google Scholar] [CrossRef]
  65. Gabyshev, D.N.; Fedorets, A.A.; Shcherbakov, D. Vertical Oscillations of Water Droplets in the Supporting Vapour–Air Flow. Phys. Wave Phenom. 2021, 29, 352. [Google Scholar] [CrossRef]
  66. Vohl, O.; Mitra, S.K.; Wurzler, S.C.; Pruppacher, H.R. A Wind Tunnel Study of the Effects of Turbulence on the Growth of Cloud Drops by Collision and Coalescence. J. Atmos. Sci. 1999, 56, 4088. [Google Scholar] [CrossRef]
  67. Beard, K.V. Terminal Velocity and Shape of Cloud and Precipitation Drops Aloft. J. Atmos. Sci. 1976, 33, 851. [Google Scholar] [CrossRef] [Green Version]
  68. Szakáll, M.; Kessler, S.; Diehl, K.; Mitra, S.K.; Borrmann, S. A wind tunnel study of the effects of collision processes on the shape and oscillation for moderate-size raindrops. Atmos. Res. 2014, 142, 67–78. [Google Scholar] [CrossRef]
  69. Yedlin, M.J.; Margrave, G.F.; Horin, Y.B. Instantaneous frequency computation: Theory and practice. CREWES Res. Rep. 2013, 25, 85. [Google Scholar]
  70. Virtanen, P.; Gommers, R.; Oliphant, T.E.; Haberland, M.; Reddy, T.; Cournapeau, D.; Burovski, E.; Peterson, P.; Weckesser, W.; Bright, J.; et al. SciPy 1.0: Fundamental algorithms for scientific computing in Python. Nat. Methods 2020, 17, 261. [Google Scholar] [CrossRef] [Green Version]
  71. Fielder, R.; Thomas, R.H. The unsteady motion of a lamina in an elastico-viscous liquid. Rheol. Acta 1967, 6, 306. [Google Scholar] [CrossRef]
  72. King, M.J.; Waters, N.D. The unsteady motion of a sphere in an elastico-viscous liquid. J. Phys. D Appl. Phys. 1972, 5, 141. [Google Scholar] [CrossRef]
  73. Becker, L.E.; McKinley, G.H.; Rasmussen, H.K.; Hassager, O. The unsteady motion of a sphere in a viscoelastic fluid. J. Rheol. 1994, 38, 377–403. [Google Scholar] [CrossRef] [Green Version]
  74. Bouillant, A.; Mouterde, T.; Bourrianne, P.; Lagarde, A.; Clanet, C.; Quéré, D. Leidenfrost wheels. Nat. Phys. 2018, 14, 1188. [Google Scholar] [CrossRef]
  75. Loitsyanskii, L.G. Mechanics of Liquids and Gases; Pergamon: Oxford, UK, 1966. [Google Scholar]
  76. Lienhard, J.H. Synopsis of Lift, Drag, and Vortexes Frequency Data for Rigid Circular Cylinders; Washington State University, Technical Extension Service: Pullman, WA, USA, 1966. [Google Scholar]
  77. Happel, J.; Brenner, H. Low Reynolds Number Hydrodynamics; Martinus Nijhoff Publishers: The Hague, The Netherlands, 1983. [Google Scholar]
  78. Yoon, D.-H.; Yang, K.-S. Flow-induced forces on two nearby spheres. Phys. Fluids 2007, 19, 098103. [Google Scholar] [CrossRef] [Green Version]
  79. Pranesha, T.S.; Kamra, A.K. Scavenging of aerosol particles by large water drops: 1. Neutral case. J. Geophys. Res. 1996, 101, 23373. [Google Scholar] [CrossRef]
  80. Wang, P.K.; Pruppacher, H.R. An Experimental Determination of the Efficiency with Which Aerosol Particles are Collected by Water Drops in Subsaturated Air. J. Atmos. Sci. 1977, 34, 1664. [Google Scholar] [CrossRef] [Green Version]
  81. Yuan, F.; Gan, F. Evolution of Aerosol Particles in the Rainfall Process via Method of Moments. Abstr. Appl. Anal. 2013, 2013, 709497. [Google Scholar] [CrossRef]
  82. Gonçalves, F.L.T.; Beheng, K.D.; Massambani, O.; Vautz, W.; Klockow, D. Scavenging processes of atmospheric particulate matter: A numerical modeling of case studies. Rev. Bras. de Meteorol. 2010, 25, 437. [Google Scholar] [CrossRef] [Green Version]
  83. Davies, C.N. Definitive equations for the fluid resistance of spheres. Proc. Phys. Soc. 1945, 57, 259. [Google Scholar] [CrossRef]
  84. Achenbach, E. Vortex shedding from spheres. J. Fluid Mech. 1974, 62, 209. [Google Scholar] [CrossRef]
  85. Greenfield, S.M. Rain Scavenging of Radioactive Particulate Matter from the Atmosphere. J. Meteorol. 1957, 14, 115. [Google Scholar] [CrossRef] [Green Version]
  86. Cherrier, G.; Belut, E.; Gerardin, F.; Tanière, A.; Rimbert, N. Aerosol particles scavenging by a droplet: Microphysical modeling in the Greenfield gap. Atmos. Environ. 2017, 166, 519. [Google Scholar] [CrossRef]
  87. Cunningham, E. On the Velocity of Steady Fall of Spherical Particles through Fluid Medium. Proc. R. Soc. A Math. Phys. Eng. Sci. 1910, 83, 357. [Google Scholar] [CrossRef] [Green Version]
  88. Löffler, F. Staubabscheiden; Thieme: Stuttgart, Germany, 1988. [Google Scholar]
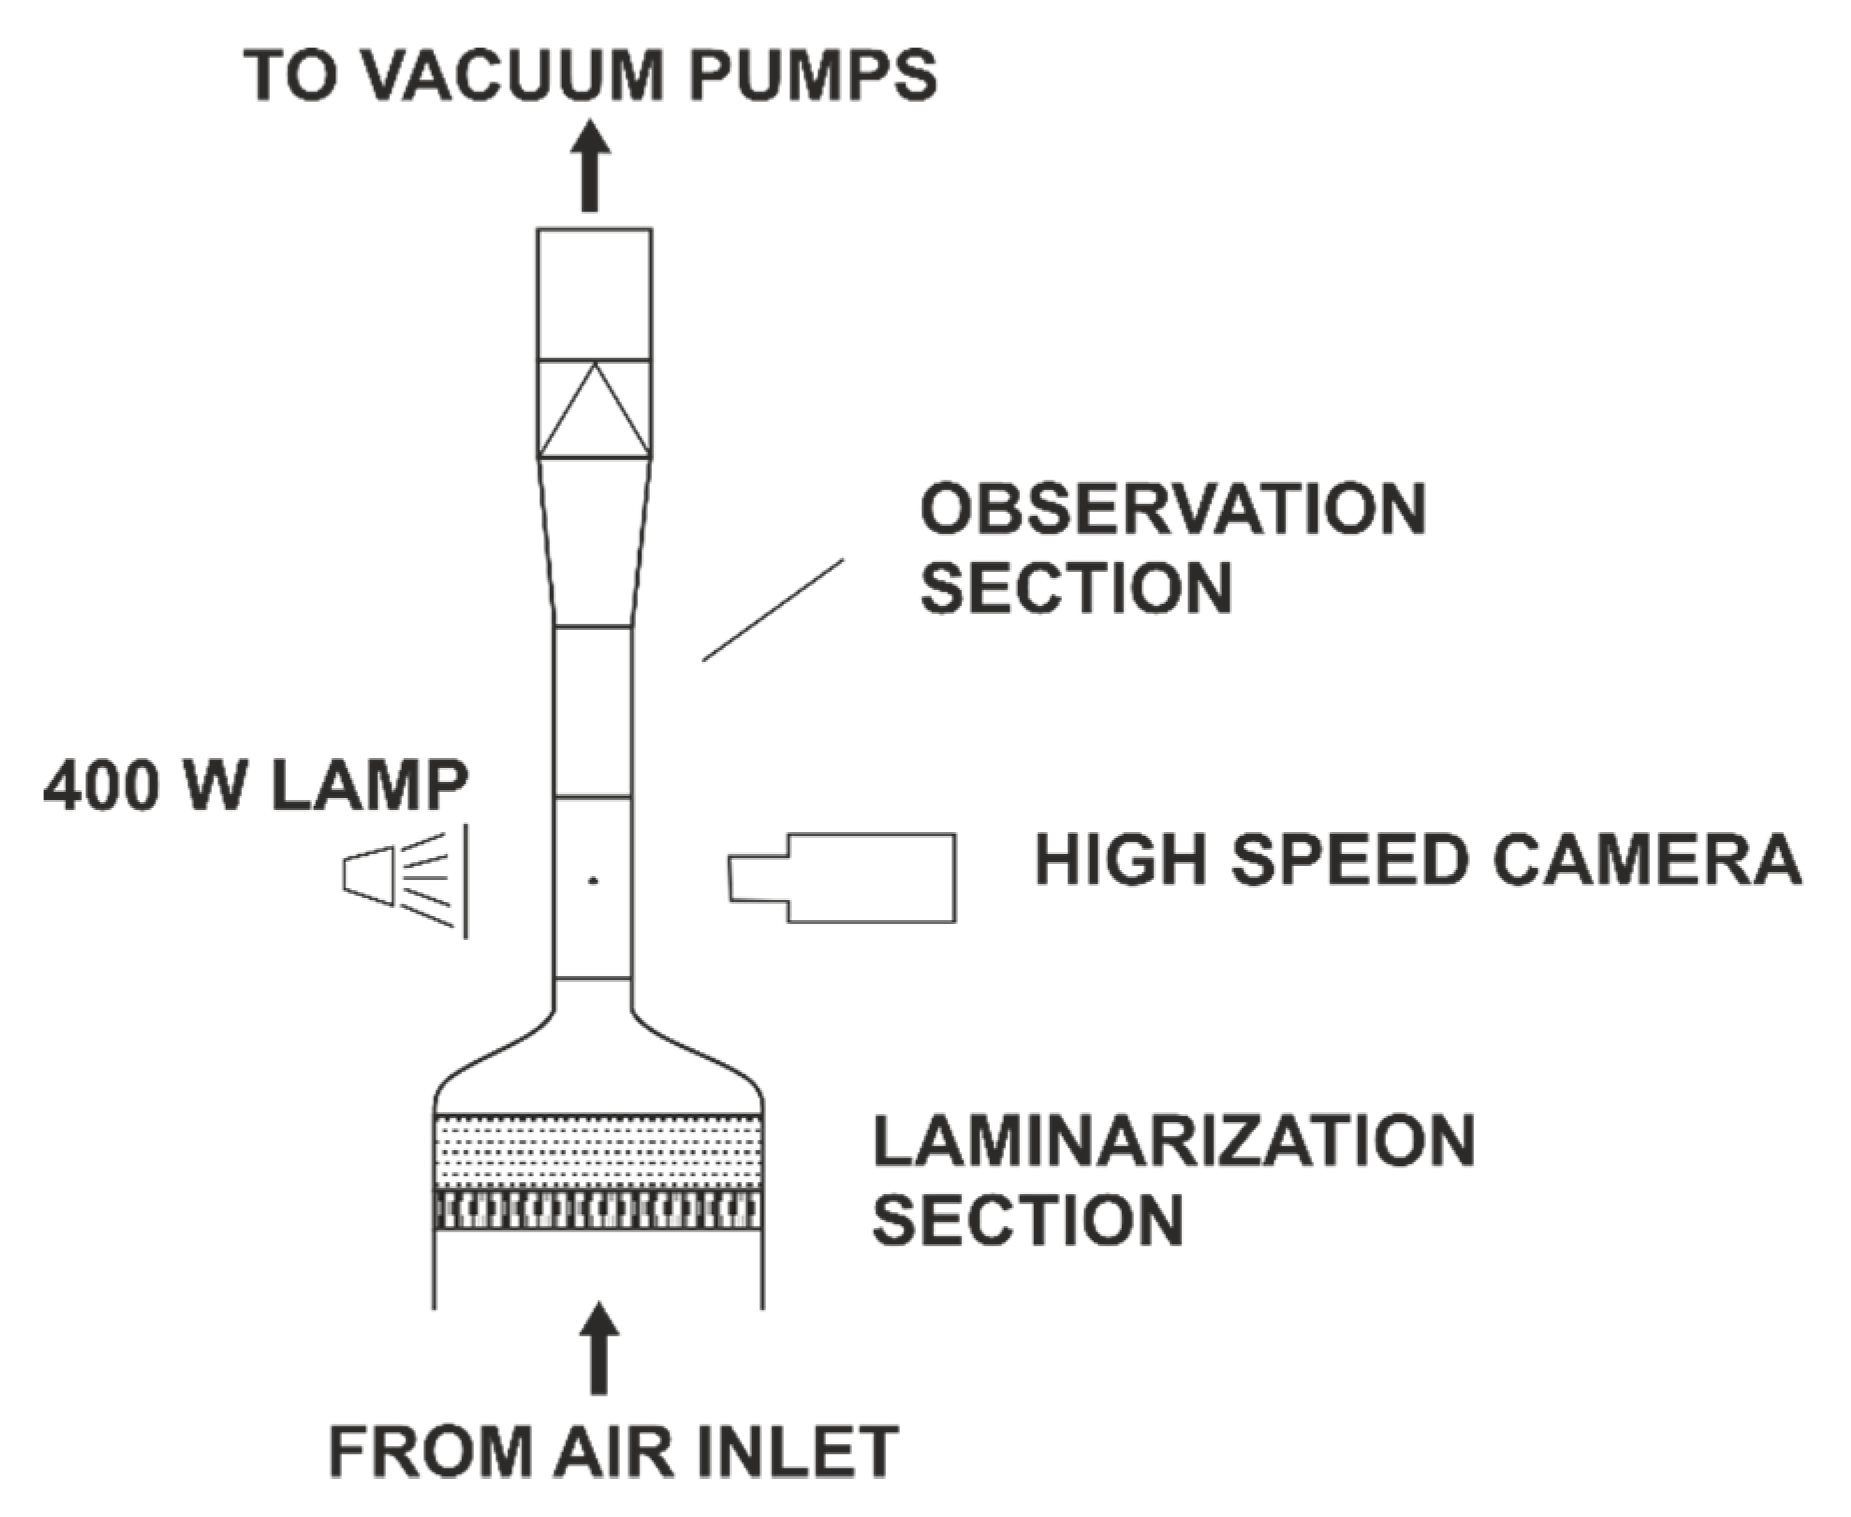
Figure 1. Schematic of the experimental setup.
Atmosphere 13 01137 g001
Figure 2. The temporal evolution of the drop size as a function of time for a droplet levitated in the airflow of the Mainz vertical wind tunnel.
Atmosphere 13 01137 g002
Figure 3. A typical 609 μm diameter droplet with pixilation (enlarged picture) and change its position in 0.1 s (indicated by an arrow; the negative frame is superimposed on the positive one).
Atmosphere 13 01137 g003
Figure 4. Averaged spectra (frequency mode height, px vs. frequency, Hz): (a) column for x coordinate, (b) column for y, (c) column for diameter D. Reynolds number Re, droplet diameter D, and wind speed v increase sequentially from top down to bottom.
Atmosphere 13 01137 g004
Figure 5. Instantaneous frequency example in time for the x coordinate at Re = 130 (peak frequency, Hz vs. time, s). Moving average over 33 points is used.
Atmosphere 13 01137 g005
Figure 6. Instantaneous frequency comparison between x (upper) and y (lower). Dashed-red-line examples cross possibly maximal amount (6 or 7) of standard deviation ranges.
Atmosphere 13 01137 g006
Figure 7. The physical meaning demonstration for the instability of the instantaneous frequency via Fourier transform at Re = 130 over different observational areas lasting 0.255 s each (frequency mode height, px vs. frequency, Hz).
Atmosphere 13 01137 g007
Publisher’s Note: MDPI stays neutral with regard to jurisdictional claims in published maps and institutional affiliations.