Abstract
Using Pinus bungeana, Platycladus orientalis, Koelreuteria paniculata and Ginkgo biloba as research objects, three open-top chambers with different ozone-concentration gradients were set up (NF, NF40 and NF80) based on trunk sap-flow technology to study the difference in ozone absorption by trees under different ozone concentrations. The results showed that the monthly and diurnal variations of sap-flow density of different tree species decreased with the increase in ozone concentration, and the increase in ozone concentration reduced the water consumption, ozone uptake rate (FO3), net photosynthetic rate (Pn) and water-use efficiency (WUE) of different tree species. The sap-flow density, water consumption, FO3 and WUE of Koelreuteria paniculata and Ginkgo biloba were higher than those of Pinus bungeana and Platycladus orientalis under different ozone concentrations. The sap-flow density, water consumption, FO3 and WUE of Koelreuteria paniculata and Ginkgo biloba decreased significantly at the ozone concentrations of NF40 and NF80; compared with the ozone concentration of NF, the sap flow density of Koelreuteria paniculata and Ginkgo biloba decreased by 1.04 and 1.03 times as much as that of Pinus bungeana and Platycladus orientalis, respectively; the water consumption of Koelreuteria paniculata and Ginkgo biloba decreased by 1.82 and 1.56 times that of Pinus bungeana and Platycladus orientalis, respectively; the decline rate of FO3 in Koelreuteria paniculata and Ginkgo biloba was 1.30 and 1.04 times that of Pinus bungeana and Platycladus orientalis, respectively; and the decline rate of WUE of Koelreuteria paniculata and Ginkgo biloba was 1.52 and 1.64 times that of Pinus bungeana and Platycladus orientalis, respectively. Pinus bungeana and Platycladus orientalis have stronger tolerance to ozone, while Koelreuteria paniculata and Ginkgo biloba were weak. A variety of conifers can be planted in areas with serious ozone pollution.
1. Introduction
Surface ozone is a secondary atmospheric pollutant with high toxicity to plants. It is mainly generated by complex photochemical reactions of precursors such as volatile organic compounds (VOCs), nitrogen oxides (NOx) and methane (CH4). If the concentration exceeds 26.21 μg·m−3, it can cause damage to some sensitive plants [1]. The increase in ozone concentration in the near-surface layer seriously threatens the ecological security of vegetation systems on the surface [2]. Since the 1960s, the ozone stress effect of plants has been studied. The generation of ozone precursors is mainly caused by the large amounts of emissions of fossil fuels such as coal, oil and natural gas [3]. At present, the concentration of ozone in the global atmospheric environment has exceeded twice that of before the industrial revolution [4]; since 1750, the global average ozone concentration has increased from 16.38 μg·m−3 to 22.28 μg·m−3, an increase of 36%. With the acceleration of urbanization, the demand for energy is gradually increasing, and a large number of pollutants are discharged into the atmosphere, resulting in an increase in near-ground ozone concentration, which is increasing at the rate of 0.5–2.5% every year [5]. Nearly a quarter of countries in the world have ozone concentrations higher than 60 nl·L−1 in summer, and this will continue to rise in the coming decades, especially in areas with highly developed and intensive human activities [6]. According to the data of China’s national environmental monitoring network from 2013 to 2017, the surface ozone concentration in China has increased by 0.003 μg·m−3 per year in the past five years [7]. In 2020, the number of days with ozone as the primary pollutant exceeding the standard in 337 prefecture level and above cities accounted for 37.1% of the total number of days exceeding the standard [8]; Relevant scholars also pointed out that ozone is the primary air pollutant at present [9]. In March 2012, China added the 8 h average concentration limit of ozone in the newly revised ambient air-quality standard (GB 3095-2012), which indicates that China has officially incorporated the ozone pollution index into the air-quality-assessment system. Ozone entering plants will greatly destroy photosynthetic organs and antioxidant systems, leading to a decline in photosynthetic rate and eventually a decline in yield. Therefore, in recent years, the impact of elevated ozone concentration on plants has attracted great attention from researchers at home and abroad.
Under ozone stress, leaf senescence and abscission, the number of stomata decreases [10], the photosynthetic carbon sequestration capacity of plants decreases, and there is a reduction in carbon assimilates in refluxed roots, etc. [11,12]. When the ozone concentration is high, it reaches the threshold borne by plants and the stomata are forced to close. At this time, the ozone entering the vegetation will be reduced accordingly, but at the same time, it prevents CO2 from entering the plant cells, resulting in a reduction in the net photosynthetic rate of plants [13,14], resulting in reduced plant biomass [15]. After the stomatal defense mechanism fails, O3 entering the cells will induce the antioxidant system in the leaves to start the nonstomatal defense response of detoxification and repair [16]. Li et al. [17] found that the stomatal density, stomatal size and stomatal opening of different tree species decreased significantly after the increase in ozone concentration. After O3 enters the cell space from stomata, it can also reduce the photosynthetic capacity of plants by affecting the mesophyll conductance of plants [18]. In addition, the study also found that the difference of response of different woody plants to O3 mainly comes from the specific leaf mass of plant functional leaves [19]. Feng et al. [20] found that the net photosynthetic rate of Metasequoia glyptostroboides seedlings decreased by 41% when the ozone concentration increased by 0.10 μg·m−3; In addition, the increase in ozone concentration will also affect the chlorophyll content of plants. Ozone-reactive oxygen species molecules enter chloroplasts through membrane channels or infiltration [21]. The main reason for the decrease in chlorophyll is also the weakening of plant photosynthesis. Due to the absorption of ozone through stomata, the light energy required by vegetation is reduced. Chen et al. [22] found that the relative conductivity, enzyme activity and phenolic substances of leaves in plants will change greatly under ozone stress, which will affect plant growth. Poplar is at 12.20 μmol·mol−1 under ozone stress; the total biomass decreased by 5% [23].
In order to estimate ozone risk, the polycyclic-response relationship of forest trees was determined by using field concentration measurements (the accumulated ozone in summer exceeded the threshold of 0.04 μg·m−3, AOTF40) [24]. However, ozone intake through stomata alone is toxic to plants [25]. Ozone and water-vapor fluxes are proportional to each other in the stomata. Ozone uptake can be estimated by multiplying the conversion coefficient of 0.668 [26]. Based on this multiplication method, Emberson et al. [27] proposed a Do3SE model (ozone deposition for stomatal exchange) for estimating ozone uptake from temperature, water-vapor pressure deficit (VPD) and light and soil moisture. The analogy between leaf transpiration and ozone uptake allows the use of sap-flow measurements to verify ozone uptake, because they provide effective canopy conductance. Studies have found that there is a significant difference in ozone uptake rates between plants with different tree species [28]. Some scholars have conducted ozone uptake rates in canopy projected areas under different tree types [29,30].
In conclusion, the research on the effects of ozone stress on plants focuses on plant growth and physiological traits; there are few studies on the transpiration water consumption, absorption rate and difference mechanism of different tree species under ozone stress. Therefore, this study selects four common landscaping tree species as the object; sets three ozone concentrations; measures the transpiration water consumption, canopy ozone absorption rate of trees and photosynthetic characteristics under different ozone concentrations; explains the changes of plant transpiration and ozone uptake rate caused by the increase in ozone concentration, so as to provide a theoretical basis for the improvement of urban environmental quality and ozone control; and also provides a reference for the selection of tree species with strong ozone resistance.
2. Research Methods
2.1. Study Area
Beijing Botanical Garden at the foot of Xishan (Xi Mtn.) was used as the study area. The total area of the garden is 4 km2. It is a display and conservation piece of plant resources, for scientific research, popular science, tourism and development as one integrated botanical garden. About 18 km from downtown, it is located at 39°48′ N, 116°28 ′ E, and the altitude is 76 m, belonging to a temperate continental climate. Annual average temperature here is 11.6 °C and the mean temperature is −3.7 °C in January and 26.7 °C in July. Extreme average annual high temperature is 41.3 °C, while extreme low temperature is −17.5 °C. Average annual rainfall and relative humidity are 634.2 mm and 43–79%, respectively. There are more than 6000 kinds of plants in the garden, including 2000 species of trees and shrubs, 1620 species of tropical and subtropical plants, 500 kinds of flowers and 1900 other species, including fruit trees, aquatic plants, Chinese herbal medicine and others. The main tree species include Pinus tabulaeformis, Pinus bungeana, Platycladus orientalis, Pinus koraiensis, Cedrus deodara, Eucommia ulmoide, Salix babylonica, Ginkgo biloba and Sophora japonica. Significant shrubs include Ligustrum lucidum, Berberis thunbergii, Buxus sinica, Sabina vulgaris, Forsythia suspensa and Jasminum nudiflorum.
2.2. Control of Different Ozone Concentrations
Using gas-simulation method, nine different ozone-concentration open-top chambers (OTC) were set up to carry out artificial control and repeated 3 times for each ozone concentration, which were NF (normal-environment atmospheric ozone concentration), NF40 (normal atmospheric ozone concentration +40 nmol·mol−1) and NF80 (normal atmospheric ozone concentration +80 nmol·mol−1); the reason and basis for setting different ozone-gradient concentrations is that related studies found that the threshold of ozone damage caused by coniferous trees such as pines is between 150 nmol·mol−1 to 2 times of environmental concentration, while the threshold value of ozone-induced plant injury of broad-leaved trees was between 60 nmol·mol−1 to 1.4 and 1.7 times [31], while the O3 concentration in Beijing is 60 nmol·mol−1 [32]. Referring to the experimental settings of Xin et al. [33], this study set up 3 ozone concentrations under the ambience in Beijing, 40 nmol·mol−1 (NF40) was added to the ambient concentration of ozone (NF), which was close to the threshold of plant injury caused by ozone, but still did not exceed the threshold; then, it was doubled on the basis of doubling (NF80), which at this concentration exceeds the threshold of plant damage caused by ozone, but less. The three ozone concentration gradients gradually increase, and within the controllable range of ozone damage to plants, they also have a significant impact on the growth and physiological characteristics of different tree species, so they are set in this way. From August 2016 to October 2017, ozone fumigation was carried out in the two OTC chambers of NF40 and NF80 by ozone generator from 9:00 to 16:00 every day, once every two days. The ozone concentration in the OTC chamber was controlled by adjusting the amount of ozone in the ozone generator. Real-time ozone concentration, temperature and humidity data in the air chamber were recorded; normal water management was carried out during the whole experiment period. Normal-environment atmospheric ozone concentration (NF) data were obtained from the environmental air-quality-monitoring station in Beijing Botanical Garden set up in Beijing Environmental Protection Monitoring Center, which is 300 m away from the test site.
Three potted seedlings of Pinus bungeana, Platycladus orientalis, Koelreuteria paniculata and Ginkgo biloba were placed in each OTC chamber. The seedlings were all three years old, because the three-year-old trees were in the early stage of growth and development, which made the results more significant [34]. Pinus bungeana, Platycladus orientalis, Koelreuteria paniculata and Ginkgo biloba are common landscaping trees in Beijing. The area of Platycladus orientalis ranks second among all tree species in Beijing; Pinus bungeana as pine species has strong ability to absorb pollutants and is not sensitive to ozone; Koelreuteria paniculata and Ginkgo biloba are sensitive to ozone, so selecting these tree species can better highlight the results of plant transpiration water consumption characteristics under different ozone concentrations. Seedling pot diameter is 40 cm, height is 50 cm; seedling size, crown width, basal diameter and plant height of Pinus bungeana, Platycladus orientalis, Koelreuteria paniculata and Ginkgo biloba in different OTC chambers are basically the same. The plant height of Pinus bungeana is about 1.3 m, that of Platycladus orientalis about 1.35 m, that of Koelreuteria paniculata is about 1.4 m, and that of Ginkgo biloba is about 1.2 m.
2.3. Determination of Photosynthesis under Ozone Stress
Net photosynthetic rate (Pn) and transpiration rate (Et) were measured with the using CI340 photosynthetic apparatus. We selected the relatively complete leaves from each seedling from May to October and measured the leaves from 9:00 to 16:00 every month on sunny days. The photosynthetic rate of the conifer was measured by the hollow leaf chamber. For the three repetitions under each treatment, the leaves of two different parts were selected and measured twice; at the same time, water-use efficiency (WUE) was calculated.
where WUE is water-use efficiency (μmol·mmol−1); Pn is the net photosynthetic rate (μmol·m−2·s−1); Et is the transpiration rate (mnol·m−2·s−1).
2.4. Measurement of Sap Flow under Ozone Stress
The trunk sap flow of potted seedlings under artificial control was measured by wrapped sap-flow meter. A trunk sap-flow collection box was set up outside the OTC. The wrapped sap-flow probe was wrapped in each stem position of potted seedlings in the air chamber, and the sap-flow extension line was drawn from the air chamber to the outside of the gas chamber, and the sap-flow collection box outside was set up. It was connected, then heated with electricity, and the acquisition time was set to read every 30 s, with an average every 10 min, and data were stored.
2.5. Calculation of Air Water-Vapor Pressure Deficit
Water-vapor pressure deficit (VPD) was used to reflect the synergistic effect of temperature and air relative humidity on tree transpiration. Air-vapor pressure deficit (VPD) was an important factor to measure the level of plant transpiration [10,32]. Within a lower range of VPD, stomatal conductance increased with the increase of VPD, resulting in the increase of transpiration per unit leaf area (E) to the maximum; if VPD continues to rise, stomatal conductance decreases exponentially and transpiration decreases) [10]; if VPD increases significantly, stomata will be partially closed. The following formulas were calculated:
In the formula, the constants a, b and c are 0.611 kPa, 17.502 and 240.97 °C, respectively. Ta is the air temperature (°C) and RH is the air humidity (%) [29].
2.6. Fluid Flow Density Calculation
Sap-flow density (Js) is the evidence of forest transpiration water consumption. In this study, Granier [35] empirical formula was used to calculate sap-flow density [10]:
In the formula, Js is the sap-flow density (g·cm−2·s−1), dTm is the maximum temperature difference (C) between the upper and lower probes within 24 h of the analysis day (°C) and dT is the instantaneous temperature difference (C) at a certain time, that is, the temperature difference measured at that time.
2.7. Canopy Transpiration Rate Calculation
The canopy transpiration rate was calculated by the following formula [10]:
In the formula, Ec is the canopy transpiration rate of per tree (g·m−2·s−1), Js is sap-flow density (g·cm−2·s−1), As is sapwood area (cm2) and AG is ground projection area of tree canopy (m2).
2.8. Canopy Conductivity Calculation
Canopy conductance (Gc) is the conductance of carbon dioxide, water vapor or heat between plant canopy and atmosphere [29]. In this study, the following formula was used to calculate [10]:
In the formula, Gc is the canopy conductance (mmol·m−2·s−1), Ec is the canopy transpiration rate (g m−2 s−1), ρ is the water density (998 kg·m−3), Gv is the general gas constant of water vapor (0.462 m3 kPa K−1kg−1), Ta is the temperature (°C) and D is the atmospheric water-vapor pressure deficit (kpa) [29].
2.9. Calculation of Ozone Uptake Rate
In this study, the ozone uptake rate was calculated by using the method of ozone canopy conductance. The formulas are as follows [10]:
In the formula, GO3 is the canopy ozone conductance (mmol·m−2·s−1), FO3 is the canopy ozone uptake rate (nmol·m−2·s−1), [O3] is the ozone concentration in the external atmosphere (μg·m−3), Gc is the canopy conductance (mmol·m−2·s−1) and 0.613 is the conversion coefficient, representing the ozone and water-vapor diffusion coefficient ratio in the air [10].
3. Results and Analysis
3.1. Variation Characteristics of Sap-Flow Density under Ozone Stress
The monthly and diurnal variations of sap-flow densities of different tree species under ozone stress are shown in Figure 1. The sap-flow density of trees at different ozone concentrations ranged from 11:00 to 14:00, which was the highest in a day; it began to rise slowly around 6:00 and began to decline after 16:00; at 18:00 to 23:00 and to the lowest level, the night was dormant. The monthly and diurnal variations of sap-flow density of different tree species decreased with the increase in ozone concentration. Under the ozone concentrations of NF, NF40 and NF80, the daily mean sap-flow densities of Pinus bungeana were 0.000031 g·cm−2·s−1, 0.000011 g·cm−2·s−1 and 0.0000075 g·cm−2·s−1, respectively; those of Platycladus orientalis were 0.000024 g·cm−2·s−1, 0.000012 g·cm−2·s−1 and 0.0000096 g·cm−2·s−1, respectively; those of Koelreuteria paniculata were 0.000045 g·cm−2·s−1, 0.000021 g·cm−2·s−1 and 0.000012 g·cm−2·s−1, respectively; those of Ginkgo biloba were 0.000036 g·cm−2·s−1, 0.000013 g·cm−2·s−1 and 0.000011 g·cm−2·s−1. Under the ozone concentration of NF40 and NF80, compared with the ozone concentration of NF, the rates of decrease in sap-flow density of Pinus bungeana were 63.53% and 75.97%, those of Platycladus orientalis were 50.59% and 60.02%, those of Koelreuteria paniculata were 54.01% and 73.38%, and those of Ginkgo biloba were 63.61% and 67.95%, respectively.
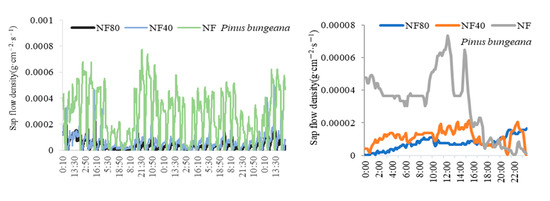
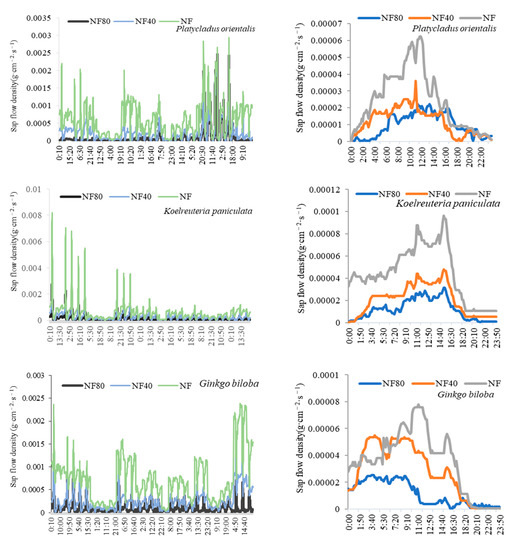
Figure 1.
Monthly and daily variation of trees’ sap-flow density under different ozone concentrations.
Under different ozone concentrations (NF, NF40 and NF80), the sap-flow density of Ginkgo biloba and Koelreuteria paniculata was higher than that of Pinus bungeana and Platycladus orientalis, and the sap-flow density of Koelreuteria paniculata (0.000045 g·cm−2·s−1) > Ginkgo biloba (0.000036 g·cm−2·s−1) > Pinus bungeana (0.000031 g·cm−2·s−1) > Platycladus orientalis (0.000024 g·cm−2·s−1) under NF ozone concentration; the sap-flow density of Ginkgo biloba (0.000028 g·cm−2·s−1) > Koelreuteria paniculata (0.000021 g·cm−2·s−1) > Platycladus orientalis (0.0000119 g·cm−2·s−1) > Pinus bungeana under (0.0000114 g·cm−2·s−1) NF40 ozone concentration; and the sap-flow density of Koelreuteria paniculata (0.000012 g·cm−2·s−1) > Ginkgo biloba (0.0000114 g·cm−2·s−1) > Platycladus orientalis (0.0000096 g·cm−2·s−1) > Pinus bungeana (0.0000075 g·cm−2·s−1) under NF80 ozone concentration. The increase in ozone concentration significantly reduced the sap-flow density of plants, which was more evident on Koelreuteria paniculata and Ginkgo biloba. At ozone concentrations of NF40 and NF80, compared with the ozone concentration of NF, the sap-flow density of Pinus bungeana and Platycladus orientalis decreased by 57.06% and 68.00%, respectively; while that of Koelreuteria paniculata and Ginkgo biloba decreased by 58.81% and 70.66%, respectively. It can be seen that under the ozone concentration of NF40 and NF80, the sap-flow density of Koelreuteria paniculata and Ginkgo biloba decreased by 1.04 and 1.03 times as much as that of Pinus bungeana and Platycladus orientalis, respectively.
3.2. Characteristics of Water Consumption of Trees under Ozone Stress
The effect of elevated ozone concentration on the water consumption of different trees is shown in Figure 2. The water consumption of different trees decreases with elevated ozone concentration. Under the ozone concentration of NF40 and NF80, compared with the ozone concentration of NF, the whole-tree water consumption of Pinus bungeana decreased by 0.09 kg·d−1 and 0.12 kg·d−1, respectively, and the decline rates were 29.03% and 38.71%, respectively; the whole-tree water consumption of Platycladus orientalis decreased by 0.12 kg·d−1 and 0.17 kg·d−1, respectively, with a rate of decrease of 32.43% and 45.95%; the water consumption of Koelreuteria paniculata decreased by 0.16 kg·d−1 and 0.21 kg·d−1, respectively, with rates of decrease of 43.15% and 53.97%; the water consumption of Ginkgo biloba decreased by 0.38 kg·d−1 and 0.43 kg·d−1, with rates of decrease of 68.77% and 78.38%, respectively.
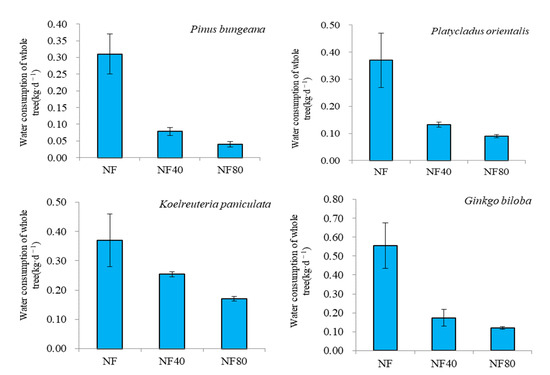
Figure 2.
Variation of water consumption of whole trees under different ozone concentrations.
The water consumption of Ginkgo biloba and Koelreuteria paniculata was greater than that of Pinus bungeana and Platycladus orientalis under different ozone concentrations (NF, NF40 and NF80). The water consumption of Pinus bungeana was 0.19 kg·d−1–0.31 kg·d−1, Platycladus orientalis was 0.20 kg·d−1–0.37 kg·d−1, Koelreuteria paniculata and Ginkgo biloba 0.17 kg·d−1–0.37 kg·d−1 and 0.12 kg·d−1–0.55 kg·d−1. The water consumption of the whole tree under the NF ozone concentration was as follows: Ginkgo biloba (0.55 ± 0.12 kg·d−1) > Koelreuteria paniculata (0.37 ± 0.09 kg·d−1) > Platycladus orientalis (0.37 ± 0.10 kg·d−1) > Pinus bungeana (0.31 ± 0.06 kg·d−1). The water consumption of the whole tree under the concentration of NF80 ozone was as follows: Platycladus orientalis (0.20 ± 0.006 kg·d−1) > Pinus bungeana (0.19 ± 0.008 kg·d−1) > Koelreuteria paniculata (0.17 ± 0.009 kg·d−1) > Ginkgo biloba (0.12 ± 0.008 kg·d−1). The increase in ozone concentration significantly reduced the water consumption of the whole tree, which was more obvious on Koelreuteria paniculata and Ginkgo biloba. Under ozone concentration NF40 and NF80, the average water consumption of Pinus bungeana and Platycladus orientalis decreased by 30.73% and 42.33%, respectively, compared with the ozone concentration of NF, while that of Koelreuteria paniculata and Ginkgo biloba decreased by 55.96% and 66.18%, respectively. It can be seen that under the ozone concentration of NF40 and NF80, the water consumption of Koelreuteria paniculata and Ginkgo biloba decreased by 1.82 and 1.56 times as much as that of Pinus bungeana and Platycladus orientalis, respectively.
3.3. Characteristics of Ozone Uptake in Tree Canopy under Ozone Stress
Figure 3 shows the change in ozone uptake rate (FO3) in the tree canopy under ozone stress, and the FO3 of different tree species decreases with the increase in ozone concentration. Under the ozone concentration of NF40 and NF80, compared with the ozone concentration of NF, the FO3 of Pinus bungeana decreased by 16.70 nmol·m−2·s−1 and 31.86 nmol·m−2·s−1, respectively; with rates of decline of 17.96% and 34.27%, respectively. Under the ozone concentration of NF40 and NF80, compared with the ozone concentration of NF, the FO3 of Platycladus orientalis decreased by 10.99 nmol·m−2·s−1 and 39.24 nmol·m−2·s−1, with rates of decrease of 6.23% and 22.26%, respectively. Compared with the ozone concentration of NF40 and NF80, compared with the ozone concentration of NF, the FO3 of Koelreuteria paniculata decreased by 39.26 nmol·m−2·s−1 and 68.05 nmol·m−2·s−1, with rates of decrease of 16.04% and 27.80%, respectively. Under the ozone concentration of NF40 and NF80, compared with the ozone concentration of NF, the FO3 of Ginkgo biloba decreased by 36.01 nmol·m−2·s−1 and 72.21 nmol·m−2·s−1, respectively, with decrease rates of 15.48% and 31.04%.
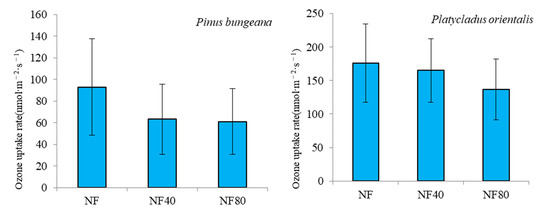
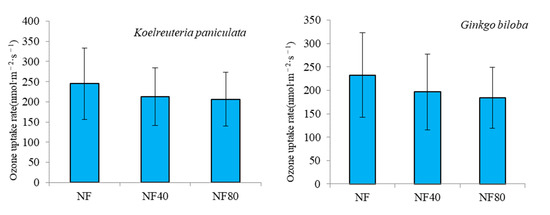
Figure 3.
Variation of ozone uptake rate in forest canopy under different ozone concentrations.
It can be seen from the above that the FO3 of Koelreuteria paniculata and Ginkgo biloba at different ozone concentrations (NF, NF40 and NF80) was larger than that of Pinus bungeana and Platycladus orientalis. The FO3 of Pinus bungeana was between 61.12 nmol·m−2·s−1 and 92.98 nmol·m−2·s−1, that of Platycladus orientalis between 136.99 nmol·m−2·s−1 and 176.23 nmol·m−2·s−1, and that of Koelreuteria paniculata and Ginkgo biloba was 176.76 nmol·m−2·s−1–244.81 nmol·m−2·s−1 and 160.44 nmol·m−2·s−1–232.65 nmol·m−2·s−1. Under the ozone concentration of NF, FO3 was shown Koelreuteria paniculata (244.81 ± 88.96 nmol·m−2·s−1) > Ginkgo biloba (232.65 ± 90.54 nmol·m−2·s−1) > Platycladus orientalis (176.23 ± 58.65 nmol·m−2·s−1) > Pinus bungeana (92.98 ± 44.54 nmol·m−2·s−1); under NF80 ozone concentration, FO3 was shown Koelreuteria paniculata (176.76 ± 66.77 nmol·m−2·s−1) > Ginkgo biloba (160.44 ± 65.36 nmol·m−2·s−1) > Platycladus orientalis (136.99 ± 45.26 nmol·m−2·s−1) > Pinus bungeana (61.12 ± 30.54 nmol·m−2·s−1).
The increase in ozone concentration significantly reduced the FO3 of plants, which was more obvious on Koelreuteria paniculata trees and Ginkgo biloba. Under the ozone concentration of NF40 and NF80, compared with the ozone concentration of NF, the FO3 average decline rates of Pinus bungeana and Platycladus orientalis were 12.10% and 28.27%, respectively; the FO3 average decline rates of Koelreuteria paniculata and Ginkgo biloba were 15.48% and 31.04%, respectively. It can be seen that under the ozone concentration of NF40 and NF80, the decline rate of FO3 of Koelreuteria paniculata and Ginkgo biloba was 1.30 and 1.04 times than that of Pinus bungeana and Platycladus orientalis, respectively.
3.4. Variation of Photosynthetic Characteristics of Trees under Ozone Stress
Figure 4 shows that the net photosynthetic rate of Ginkgo biloba and Koelreuteria paniculata is higher than that of Pinus bungeana and Platycladus orientalis, under different ozone concentrations (NF, NF 40 and NF 80), the net photosynthetic rate of Pinus bungeana was 3.30 μmol·m−2·s−1–4.06 μmol·m−2·s−1, the net photosynthetic rate of Platycladus orientalis was between 4.05 μmol·m−2·s−1 and 4.64 μmol·m−2·s−1, the net photosynthetic rates of Koelreuteria paniculata and Ginkgo biloba were 6.05 μmol·m−2·s−1–7.46 μmol·m−2·s−1 and 5.90 μmol·m−2·s−1–7.19 μmol·m−2·s−1, respectively. The increase in ozone concentration significantly reduced the net photosynthetic rate of plants, which was more obvious on Koelreuteria paniculata and Ginkgo biloba. Under the ozone concentration of NF 40 and NF 80, compared with the NF ozone concentration, the net photosynthetic rate of Pinus bungeana and Platycladus orientalis decreased by 9.88% and 15.83%, respectively; the rates of decline in the net photosynthetic rate of Koelreuteria paniculata and Ginkgo biloba were 10.33% and 18.46%, respectively. It can be seen that under the ozone concentration of NF40 and NF80, the rates of decline in the net photosynthetic rate of Koelreuteria paniculata and Ginkgo biloba were 1.05 and 1.17 times those of Pinus bungeana and Platycladus orientalis, respectively.
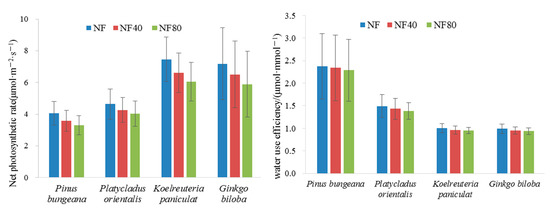
Figure 4.
Variation of net photosynthetic rate and water-use efficiency of trees under different ozone concentrations.
The WUE of Pinus bungeana and Platycladus orientalis is greater than that of Ginkgo biloba and Koelreuteria paniculata. Under different ozone concentrations (NF, NF 40 and NF 80), the WUE of Pinus bungeana was 2.29 μmol·mmol−1–2.37 μmol·mmol−1, the WUE of Platycladus orientalis was 1.39 μmol·mmol−1–1.49 μmol·mmol−1; the WUE of Koelreuteria paniculata and Ginkgo biloba were 0.95 μmol·mmol−1–1.00 μmol·mmol−1 and 0.93 μmol·mmol−1–0.99 μmol·mmol−1, respectively (Figure 4); The increase in ozone concentration significantly reduced the WUE of plants, which was more obvious on Koelreuteria paniculata and Ginkgo biloba. Under the ozone concentration of NF 40 and NF 80, the average decline rates of WUE of Pinus bungeana and Platycladus orientalis were 1.53% and 3.31%, respectively; compared with the ozone concentration of NF; the average rates of decline in WUE of Koelreuteria paniculata and Ginkgo biloba were 2.32% and 5.43%, respectively. It can be seen that under the ozone concentration of NF40 and NF80, the rates of decline in the WUE of Koelreuteria paniculata and Ginkgo biloba were 1.52 and 1.64 times those of Pinus bungeana and Platycladus orientalis, respectively.
4. Discussion
The effects of ozone on stomata and growth of plants also affect the changes in transpiration rate and water consumption of plants. It was found that the increase in ozone concentration reduced the transpiration of branches during the day, while the increase in ozone concentration at night led to the increase in stomatal opening and transpiration, delayed closure of stomatal opening at night, increased stomatal conductance and transpiration and decreased water-use efficiency [36]. However, this study found that stomatal closure occurred in leaves with higher ozone concentration, reduced the photosynthetic rate and water-use efficiency of plants and reduced the transpiration of trees. Under the ozone concentration of NF40 and NF80, compared to the ozone concentration of NF, the sap-flow density of Pinus bungeana decreased by 63.53% and 75.97%, Platycladus orientalis decreased by 50.59% and 60.02%, Koelreuteria paniculata sap-flow density decreased by 54.01% and 73.38%, and Ginkgo biloba decreased by 63.61% and 67.95%, respectively. In addition, the water consumption of different tree species decreased with the increase in ozone concentration. Under the ozone concentration of NF40 and NF80, compared to the ozone concentration of NF, the water consumption of Pinus bungeana decreased by 0.09 kg·d−1 and 0.12 kg·d−1, respectively, and that of Koelreuteria paniculata decreased by 0.16 kg·d−1 and 0.21 kg·d−1, respectively. This indicates that the increase in ozone concentration inhibits water consumption and slows down tree transpiration, which is consistent with the results of Tingey and Hogsett [37]. However, generally speaking, with the increase in ozone concentration, it will inhibit the growth of plants, reduce the water required by plants themselves, reduce the water supply of plants and cause plants to wither due to water shortage over a long period of time. Mclaughlin et al. [38] argued that the most uncertain impact of ozone on the ecosystem is the direction of the impact of ozone on water use in forests. The uncertainties of the rate and the increase in ozone concentration in the air will aggravate the hazards of drought and change the characteristics of regional water cycles.
FO3 of different trees decreased with the increase in ozone concentration, Under ozone concentrations of NF40 and NF80, compared to the ozone concentration of NF, FO3 of Pinus bungeana decreased by 16.70 nmol·m−2·s−1 and 31.86 nmol·m−2·s−1; Platycladus orientalis decreased by 10.99 nmol·m−2·s−1 and 39.24 nmol·m−2·s−1, respectively; while that of Koelreuteria paniculata decreased by 39.26 nmol·m−2·s−1 and 68.05 nmol·m−2·s−1; and Ginkgo biloba decreased by 36.01 nmol·m−2·s−1 and 72.21 nmol·m−2·s−1, respectively. Koelreuteria paniculata and Ginkgo biloba decreased more than Pinus bungeana and Platycladus orientalis, indicating that Koelreuteria paniculata and Ginkgo biloba are more sensitive to ozone, have higher FO3, and thus are more seriously damaged by ozone. The reason is that the increase in ozone will first cause the closure of stomata in plant leaves, and the absorption of CO2 by plant photosynthesis will be reduced, so as to reduce the photosynthetic rate of plants. The decrease in photosynthetic rate will also reduce the water-use efficiency [10]. In this study, the water-use efficiency of Pinus bungeana and Platycladus orientalis was higher than that of Koelreuteria paniculata and Ginkgo biloba under ozone stress (Figure 4); at the same time, it is also related to the changes of tree stomatal characteristics and structure, the more stomatal opening and size of plants, the more ozone absorbed by plants. However, with ozone stress, when the external ozone concentration is larger than the tolerance range of plants, the stomatal opening of plants decreases, the transpiration of plants slows down [39] and the amount of ozone entering the stomata decreases. Therefore, FO3 decreases accordingly. The sap-flow density, water consumption and FO3 of different trees at different ozone concentrations were higher than those of Pinus bungeana and Platycladus orientalis, which indicated that the transpiration of Pinus bungeana and Platycladus orientalis was lower than that of Koelreuteria paniculata and Ginkgo biloba. The reason was that Koelreuteria paniculata and Ginkgo biloba used for larger crown and sapwood area, mostly grew faster and needed more water. The stomatal openings and stomatal sizes were larger than those of Pinus bungeana and Platycladus orientalis, but the stomatal density was smaller than that of Pinus bungeana and Platycladus orientalis. The stomatal size and stomatal openings determined the amount of ozone entering the plant [22], so the FO3 of Koelreuteria paniculata and Ginkgo biloba was higher.
5. Conclusions
The monthly and diurnal variations of sap-flow density of different tree species decreased with the increase in ozone concentration, and the increase in ozone concentration reduced the water consumption, FO3, net photosynthetic rate and WUE of different tree species. The sap-flow density, water consumption, FO3, net photosynthetic rate and WUE of Koelreuteria paniculata and Ginkgo biloba were higher than those of Pinus bungeana and Platycladus orientalis under different ozone concentrations (NF, NF40 and NF80). The increase in ozone concentration significantly reduces the sap-flow density of plants, water consumption of the whole tree, FO3 net photosynthetic rate and WUE, which was more obvious on Koelreuteria paniculata and Ginkgo biloba; at the ozone concentrations of NF40 and NF80, compared with the ozone concentration of NF, conifers have strong tolerance to ozone, less ozone absorption and less transpiration water consumption; broadleaved trees are the opposite. A variety of conifers can be planted in areas with serious ozone pollution.
Author Contributions
Conceptualization, B.C. and Q.P.; methodology, B.C. and Q.P.; software, B.C. and Q.S.; validation, B.C. and Q.S.; writing—original draft preparation, B.C. and Q.S; writing review and editing, B.C. and Q.P.; supervision, B.C. and Q.S.; funding acquisition, B.C. All authors have read and agreed to the published version of the manuscript.
Funding
This work was supported by Youth fund of Beijing Academy of Agricultural and Forestry Sciences (QNJJ202017), President fund of Institute of Forestry and Pomology (201903), and National Natural Science Foundation of China (31500352).
Conflicts of Interest
The authors declare no conflict of interest.
References
- Feng, Z.Z.; Peng, J.L. Effects of ground-level ozone on grain yield and quality of cereal crops in China:Status and perspectives. J. Agro-Environ. Sci. 2020, 39, 797–804. [Google Scholar]
- Niu, J.F. Effects of Elevated Ozone and Nitrogen Deposition on the Growth and Physiology of Cinnamomum camphora Seedlings; Chinese Academy of Sciences: Beijing, China, 2016. [Google Scholar]
- Mauzerall, D.L.; Wang, X.P. Protecting agricultural crops from the effects of tropospheric ozone exposure: Reconciling science and standard setting in the United States, Europe, and Asia. Annu. Rev. Energy Environ. 2001, 26, 237–268. [Google Scholar] [CrossRef] [Green Version]
- Momks, P.S.; Archibald, A.T.; Colette, A.; Cooper, O.; Coyle, M.; Derwent, R.; Fowler, D.; Granier, C.; Law, L.S.; Mills, G.E.; et al. Tropospheric ozone and its precursors from the urban to the global scale from air quality to short lived climate forcer. Atmos. Chem. Phys. 2015, 15, 8889–8973. [Google Scholar] [CrossRef] [Green Version]
- Sahu, S.K.; Liu, S.C.; Ding, D.; Xing, Y. Ozone pollution in China: Background and transboundary contributions to ozone concentration & related health effects across the country. Sci. Total Environ. 2021, 761, 144131. [Google Scholar] [CrossRef] [PubMed]
- IPCC. Climate Change 2013: The Physical Science Basis. In Contribution of Working Group I to the Fifth Assessment Report of the Intergovernmental Panel on Climate Change; Intergovernmental Panel on Climate Change: New York, NY, USA, 2016. [Google Scholar]
- Wang, N.; Liu, X.P.; Deng, X.J.; Huang, X.; Jiang, F.; Ding, A.J. Aggravating O3 pollution due to NOx emission control in eastern China. Sci. Total Environ. 2019, 677, 732–744. [Google Scholar] [CrossRef]
- Ministry of ecological environment of the people’s Republic of China. Bulletin on China’s Ecological Environment in 2020. Available online: https://english.mee.gov.cn/Resources/Reports/soe/SOEE2019/202204/P020220407417638702591.pdf (accessed on 14 July 2022).
- Li, K.; Jacon, D.J.; Liao, H.; Shen, L.; Zhang, Q.; Kelvin, H.B. Anthropogenic drivers of 2013-2017 trends in summer surface ozone in China. Proc. Natl. Acad. Sci. USA 2019, 116, 422–427. [Google Scholar] [CrossRef] [Green Version]
- Chen, B.; Xu, J.J.; Liu, D.H.; Yang, X.B. Response of Ginkgo biloba growth and physiological traits to ozone stress. Glob. Ecol. Conserv. 2022, 34, e02020. [Google Scholar] [CrossRef]
- Agathoklfous, E.; Saitanis, C.J.; Wang, X.N.; Watanabe, M.; Koike, T. A review study on past 40 years of research on effects of tropospheric O3 on belowground structure, functioning, and processes of trees: A linkage with potential ecological implications. Water Air Soil Pollut. 2016, 227, 33. [Google Scholar] [CrossRef]
- Agathoklfous, E.; Saitanis, C.J.; Koike, T. Tropospheric O3, the nightmare of wild plants: A review study. J. Agric. Meteorol. 2015, 71, 142–152. [Google Scholar] [CrossRef] [Green Version]
- Wang, X.; Agathokleous, E.; Qu, L.; Watanabe, M.; Koike, T. Effects of CO2 and O3 on the interaction between root of woody plants and ectomycorrhizae. J. Agric. Meteorol. 2016, 72, 95–105. [Google Scholar] [CrossRef] [Green Version]
- Wang, X.; Fujita, S.; Nakaji, T.; Watanabe, M.; Satoh, F.; Koike, T. Fine root turnover of Japanese white birch (Betula platyphylla var. japonica) grown under elevated CO2 in northern Japan. Trees-Struct. Funct. 2016, 30, 363–374. [Google Scholar] [CrossRef]
- Hu, E.; Gao, F.; Xin, Y.; Jia, H.; Li, K.; Hu, J.; Feng, Z. Concentration-and flux-based ozone dose-response relationships for five poplar clones grown in North China. Environ. Pollut. 2015, 207, 21–30. [Google Scholar] [CrossRef]
- Feng, Z.Z.; Li, P.; Yuan, X.Y.; Gao, F.; Jian, L.J.; Dai, L.L. Progress in ecological and environmental effects of ground-level O3 in China. Acta Ecol. Sin. 2018, 38, 1530–1541. [Google Scholar]
- Li, P.; Feng, Z.Z.; Shang, B.; Yuan, X.Y.; Dai, L.L.; Xu, Y.S. Stomatal characteristics and ozone does-response relationships for six greening tree species. Acta Ecol. Sin. 2018, 38, 2710–2721. [Google Scholar]
- Xu, Y.S.; Feng, Z.Z.; Tarvainen, L.; Dai, L.L.; Uddling, J.; Tarvainen, L. Mesophyll conductance limitation of photosynthesis in poplar under elevated ozone. Sci. Total Environ. 2019, 657, 136–145. [Google Scholar] [CrossRef] [PubMed]
- Feng, Z.Z.; Yuan, X.Y.; Li, P.; Shang, B.; Ping, Q.; Hu, T.J. Progress in the effects of elevated ground-level ozone on terrestrial ecosystems. Chin. J. Plant Ecol. 2020, 44, 526–542. [Google Scholar] [CrossRef]
- Feng, Z.Z.; Zeng, H.Q.; Wang, X.K.; Zheng, Q.W.; Feng, Z.W. Sensitivity of Metasequoia glyptostroboides to ozone stress. Photosynthetica 2008, 46, 463–465. [Google Scholar] [CrossRef]
- Grulke, N.E.; Heath, R.L. Ozone effects on plants in natural ecosystems. Plant Biol. 2020, 22 (Suppl. 1), 12–37. [Google Scholar] [CrossRef]
- Chen, B. Effects of Ozone Stress on the Growth and Physiological Characteristics of Four Tree Species; Beijing Forestry University: Beijing, China, 2018. [Google Scholar]
- Li, P.; Zhou, H.; Xu, Y.; Shang, B.; Feng, Z.Z. The effects of elevated ozone on the accumulation and allocation of poplar biomass depend strongly on water and nitrogen availability. Sci. Total Environ. 2019, 665, 929–936. [Google Scholar] [CrossRef]
- Fuhrer, J.; Achermann, B. Critical Levels for Ozone-Level II; Environmental documentation No. 115; SAEFL: Bern, Switzerland, 1999. [Google Scholar]
- Matyseek, R.; Sandermann, H.; Wieser, G.; Booker, F.; Cieslik, S.; Musselman, R.; Ernst, D. The challenge of making ozone risk assessment for forest trees more mechanistic. Environ. Pollut. 2008, 156, 567–582. [Google Scholar] [CrossRef]
- Laisk, A.; Kull, O.; Moldau, H. Ozone concentration in leaf intercellular air spaces is close to zero. Physiol. Plant. 1898, 90, 1163–1167. [Google Scholar] [CrossRef] [PubMed] [Green Version]
- Emberson, L.D.; Wieser, G.; Ashmore, M.R. Modeling of stomatal conductance and ozone flux of Norway spruce: Comparison with field data. Environ. Pollut. 2000, 109, 393–402. [Google Scholar] [CrossRef]
- Manes, F.; Incerti, G.; Savatori, E.; Vitale, M.; Ricotta, C.; Costanza, R. Urban ecosystem services: Tree diversity and stability of tropospheric ozone removal. Ecol. Appl. 2011, 22, 349–360. [Google Scholar] [CrossRef] [PubMed]
- Chen, B.; Lu, S.W.; Li, S.N. Ozone uptake characteristics in different dominance hierarchies of Poplar plantation. J. Beijing For. Univ. 2015, 37, 29–36. [Google Scholar]
- Wieser, G.; Hsler, R.; Gte, B.; Havranek, W.M.; Hasler, R. Role of climate, crown position, tree age and altitude in calculated ozone flux into needles of Picea abies and Pinus cembra: A synthesis. Environ. Pollut. 2000, 109, 415–422. [Google Scholar] [CrossRef]
- Zhang, W.W. Effects of Elevated O3 Level on the Native Tree Species in Subtropical China; Ecological Environment Research Center of Chinese Academy of Sciences: Beijing, China, 2011. [Google Scholar]
- Wang, H. Water Utilization Landscape Tree Species in Urban Environment; Ecological environment research center of Chinese Academy of Sciences: Beijing, China, 2011. [Google Scholar]
- Xin, Y. Effcets of Ozone on the Photosynthetic Chpysiology and Growth of Populus cathayana under Nitrogen Desposition or Drought Stress; University of Chinese Academy of Sciences: Beijing, China, 2016. [Google Scholar]
- Xu, W.D.; Qi, S.Y.; He, X.Y.; Chen, W.; Zhao, G.L.; Zhou, Y. Effects of elevated CO2 and O3 concentrations on quantitative characteristics of mature leaf stomata in Ginkgo biloba. Chin. J. Ecol. 2008, 27, 1059–1063. [Google Scholar]
- Granier, A. Use nouvelle method pour lamesure duflux desève brute danslatronc desarbres. Ann. Des Sci. For. 1985, 42, 193–200. [Google Scholar] [CrossRef]
- Li, L. The Effects of Elevated Ozone on Growth and Physiology of Acer Truncatum under Drought Stress in a Suburb of Beijing, China; University of Chinese Academy of Sciences: Beijing, China, 2016. [Google Scholar]
- Tingey, D.T.; Hogsett, W.E. Water stress reduces ozone injury via a stomatal mechanism. Plant Physiol. 1985, 77, 944–947. [Google Scholar] [CrossRef] [Green Version]
- Mclaugghlin, S.B.; Wullschleger, S.D.; Sun, G.; Nosal, M. Interactive effects of ozone and climate on water use, soil moisture content and stream flow in a southern Appalachian forest in the USA. New Phytol. 2007, 174, 125–136. [Google Scholar] [CrossRef]
- Zhao, P.; Rao, X.Q.; Ma, L.; Cai, X.A.; Zeng, X.P. The variations of sap flux density and whole-tree transpiration across individuals of Acacia mangium. Acta Ecol. Sin. 2006, 26, 4050–4058. [Google Scholar]
Publisher’s Note: MDPI stays neutral with regard to jurisdictional claims in published maps and institutional affiliations. |
© 2022 by the authors. Licensee MDPI, Basel, Switzerland. This article is an open access article distributed under the terms and conditions of the Creative Commons Attribution (CC BY) license (https://creativecommons.org/licenses/by/4.0/).