Article

A Framework on Analyzing Long-Term Drought Changes and Its Influential Factors Based on the PDSI

1
Guangdong Research Institute of Water Resources and Hydropower, Guangzhou 510635, China
2
School of Civil Engineering and Transportation, State Key Laboratory of Subtropical Building Science, South China University of Technology, Guangzhou 510641, China
3
Pazhou Lab, Guangzhou 510330, China
*
Author to whom correspondence should be addressed.
Atmosphere 2022, 13(7), 1151; https://doi.org/10.3390/atmos13071151
Submission received: 2 June 2022 / Revised: 10 July 2022 / Accepted: 18 July 2022 / Published: 20 July 2022
(This article belongs to the Special Issue Drought in Arid and Semi-arid Regions)

Abstract

:
Drought is one of the most frequent and most widespread natural disasters worldwide, significantly impacting agricultural production and the ecological environment. An investigation of long-term drought changes and its influencing factors provides not only an understanding of historical droughts but also a scientific basis for the protection of future water resources. This study investigated the temporal characteristics of drought in a study site located in the center of Southwest China (SWC) over a 700-year period (AD 1300–2005) using the Palmer Drought Severity Index (PDSI). The linkage between drought and its influencing factors is discussed. An algorithm based on the random forest (RF) method was proposed to analyze the dynamic influence of the factors on drought. We also examined the linkages between the demise of two dynasties and historical drought events. The results showed that the study site was a drought-prone area in the study period and experienced a non-significant drying trend in all centuries, except for the 17th century; a total of 232 droughts were detected in the study site from AD 1300–2005. The wavelet spectrum of the PDSI series showed the existence of 4-, 8-, 16-, 32-, and 128-year-periods. A strong correlation existed between the sunspot numbers and the PDSI. The correlation of the period between the PDSI and El Niño-Southern Oscillation (ENSO) series in the same frequency domain was weak, while the ENSO exhibited a strong interaction with the PDSI in some time periods. The Pacific Decadal Oscillation (PDO) and PDSI had no resonance period in the low-frequency region, but there was a period of 80–130 years in the high-frequency region. The relative rates of influence of the ENSO, sunspot numbers, and PDO during AD 1700–1996 were 38.40%, 31.81%, and 29.8%, respectively. However, the mechanism of the interaction between droughts and the influential factors is complex, and the dominant factor changed over time. The analysis of long-term drought changes based on the PDSI series may provide clues to understand the development of historical events.

1. Introduction

Drought, which is defined as a negative deviation of the water balance from the climatological normal in a given area, is one of the most frequent and hazardous disasters worldwide [1]. Droughts commonly affect large areas and last a long time, resulting in adverse effects on agricultural systems and causing considerable economic losses to agricultural production [2,3]. Studies have demonstrated that drought frequency and intensity have increased due to climate change in recent decades [4,5,6,7]. In addition, droughts are expected to increase in the future due to global warming [8]. Therefore, droughts represent a threat to human survival and global development [9,10] and require constant monitoring and ongoing research.
Most meteorological stations were built in the last 200 years, and we only have a short time series of meteorological data. For example, in China, no more than 70 years of meteorological data are available because stations were gradually built after the 1950s. We have to use special clues such as tree rings, stalagmites, and ice core data to expend the series if we intend to acquire longer time series [11,12,13,14,15]. There is no doubt that the drought characteristics in a given region can be assessed using long-term data. This type of analysis provides an understanding of long-term climate change, the interaction between several factors, as well as the climatic environment in historical periods [1]. The analysis of long time series is also important in historical research. For example, we can determine if drought events had positive or negative impacts on historical events, such as depopulation, locust invasions, wars, peasant uprisings, and dynasty changes. Therefore, an analysis of long-term drought changes provides not only some clues on historic climate characteristics but also a further understanding of social changes and development.
Numerous studies have investigated past droughts using long-time series data. For example, Cook [16] discovered that the western United States had experienced a severe drought from AD 900 to 1300 using the Palmer Drought Severity Index (PDSI) reconstructions based on tree-ring data. The authors also developed the Monsoon Asia Drought Atlas that shows spatiotemporal details of known historic monsoons, as well as the occurrence, severity, and location of previously unknown monsoon megadroughts and their linkages to large-scale patterns of tropical Indo-Pacific sea surface temperatures in the last millennium [17]. Gou [18] reconstructed the drought history of the western Qilian mountains using an 850-year tree-ring-based reconstruction. Brázdil [1] analyzed droughts in the Czech Lands in the AD 1090–2012 period based on documents and instrumental records. Li [13] reconstructed a 516-year streamflow in the source region of the Yangtze River and detected drought events during the AD 1485–2000 period. The reconstruction by Xu [19] revealed the impact of drought and pluvial patterns on the decline of the Zhungar Empire and on historical agricultural and socio-economical activities, including increased migration into eastern central Asia during the AD 1770–1800 pluvial period. Many ancient drought events have been detected by long-term time-series data, primarily tree-ring data, providing substantial evidence for the occurrence of historical events [20].
It is widely acknowledged that the formation and evolution of recent droughts are complicated and were driven by many factors, including climate change and intense human activity [5,21,22]. Regarding climate change, teleconnections with sunspots, the Pacific Decadal Oscillation (PDO), and the El Niño-Southern Oscillation (ENSO) were explored using short-term time series. These indices are considered crucial factors that influence droughts [6]. However, the intensity of human activity, the geographic condition, and the climate environment were significantly different historically from today. It remains poorly understood whether historical droughts that are assessed using short time series are regular events or are unique in a hundred-year period and whether the influencing factors have large impacts on droughts from a long-term perspective. Additionally, the dominant factors affecting droughts may be different in different periods, and, therefore, the influence of the influential factors may change over time. One factor may be dominant in a given period, and it may be replaced by another factor in a subsequent period. Therefore, an assessment of the dynamic influence of the different factors may provide a better understanding of the influential variables that affect droughts during a long-term period.
In summary, the analysis on the long-term drought changes helps to reveal the characteristics and evolvement law of the historical climate, which could provide clues for the research of historical events, modern climate analysis, and even future climate prediction. However, a systematic framework on analyzing long-term drought changes and its influential factors has not yet been constructed. Therefore, taking a grid set (study site) from Southwest China as the study case, the objectives of this study were to construct the framework by the following steps: (1) detect the drought trends and periodicity using the PDSI index for a 700-year long-term time series, (2) estimate the relationship between drought and the influencing factors and ascertain the dynamic influence of each factor on drought, and (3) discuss the linkage between the demise of the Yuan and Ming Dynasties and historical drought events. This study is expected to provide references on analyzing long-term drought changes and its influential factors based on PDSI and to deepen our understanding of historical drought events in the study site.

2. Study Site and Data
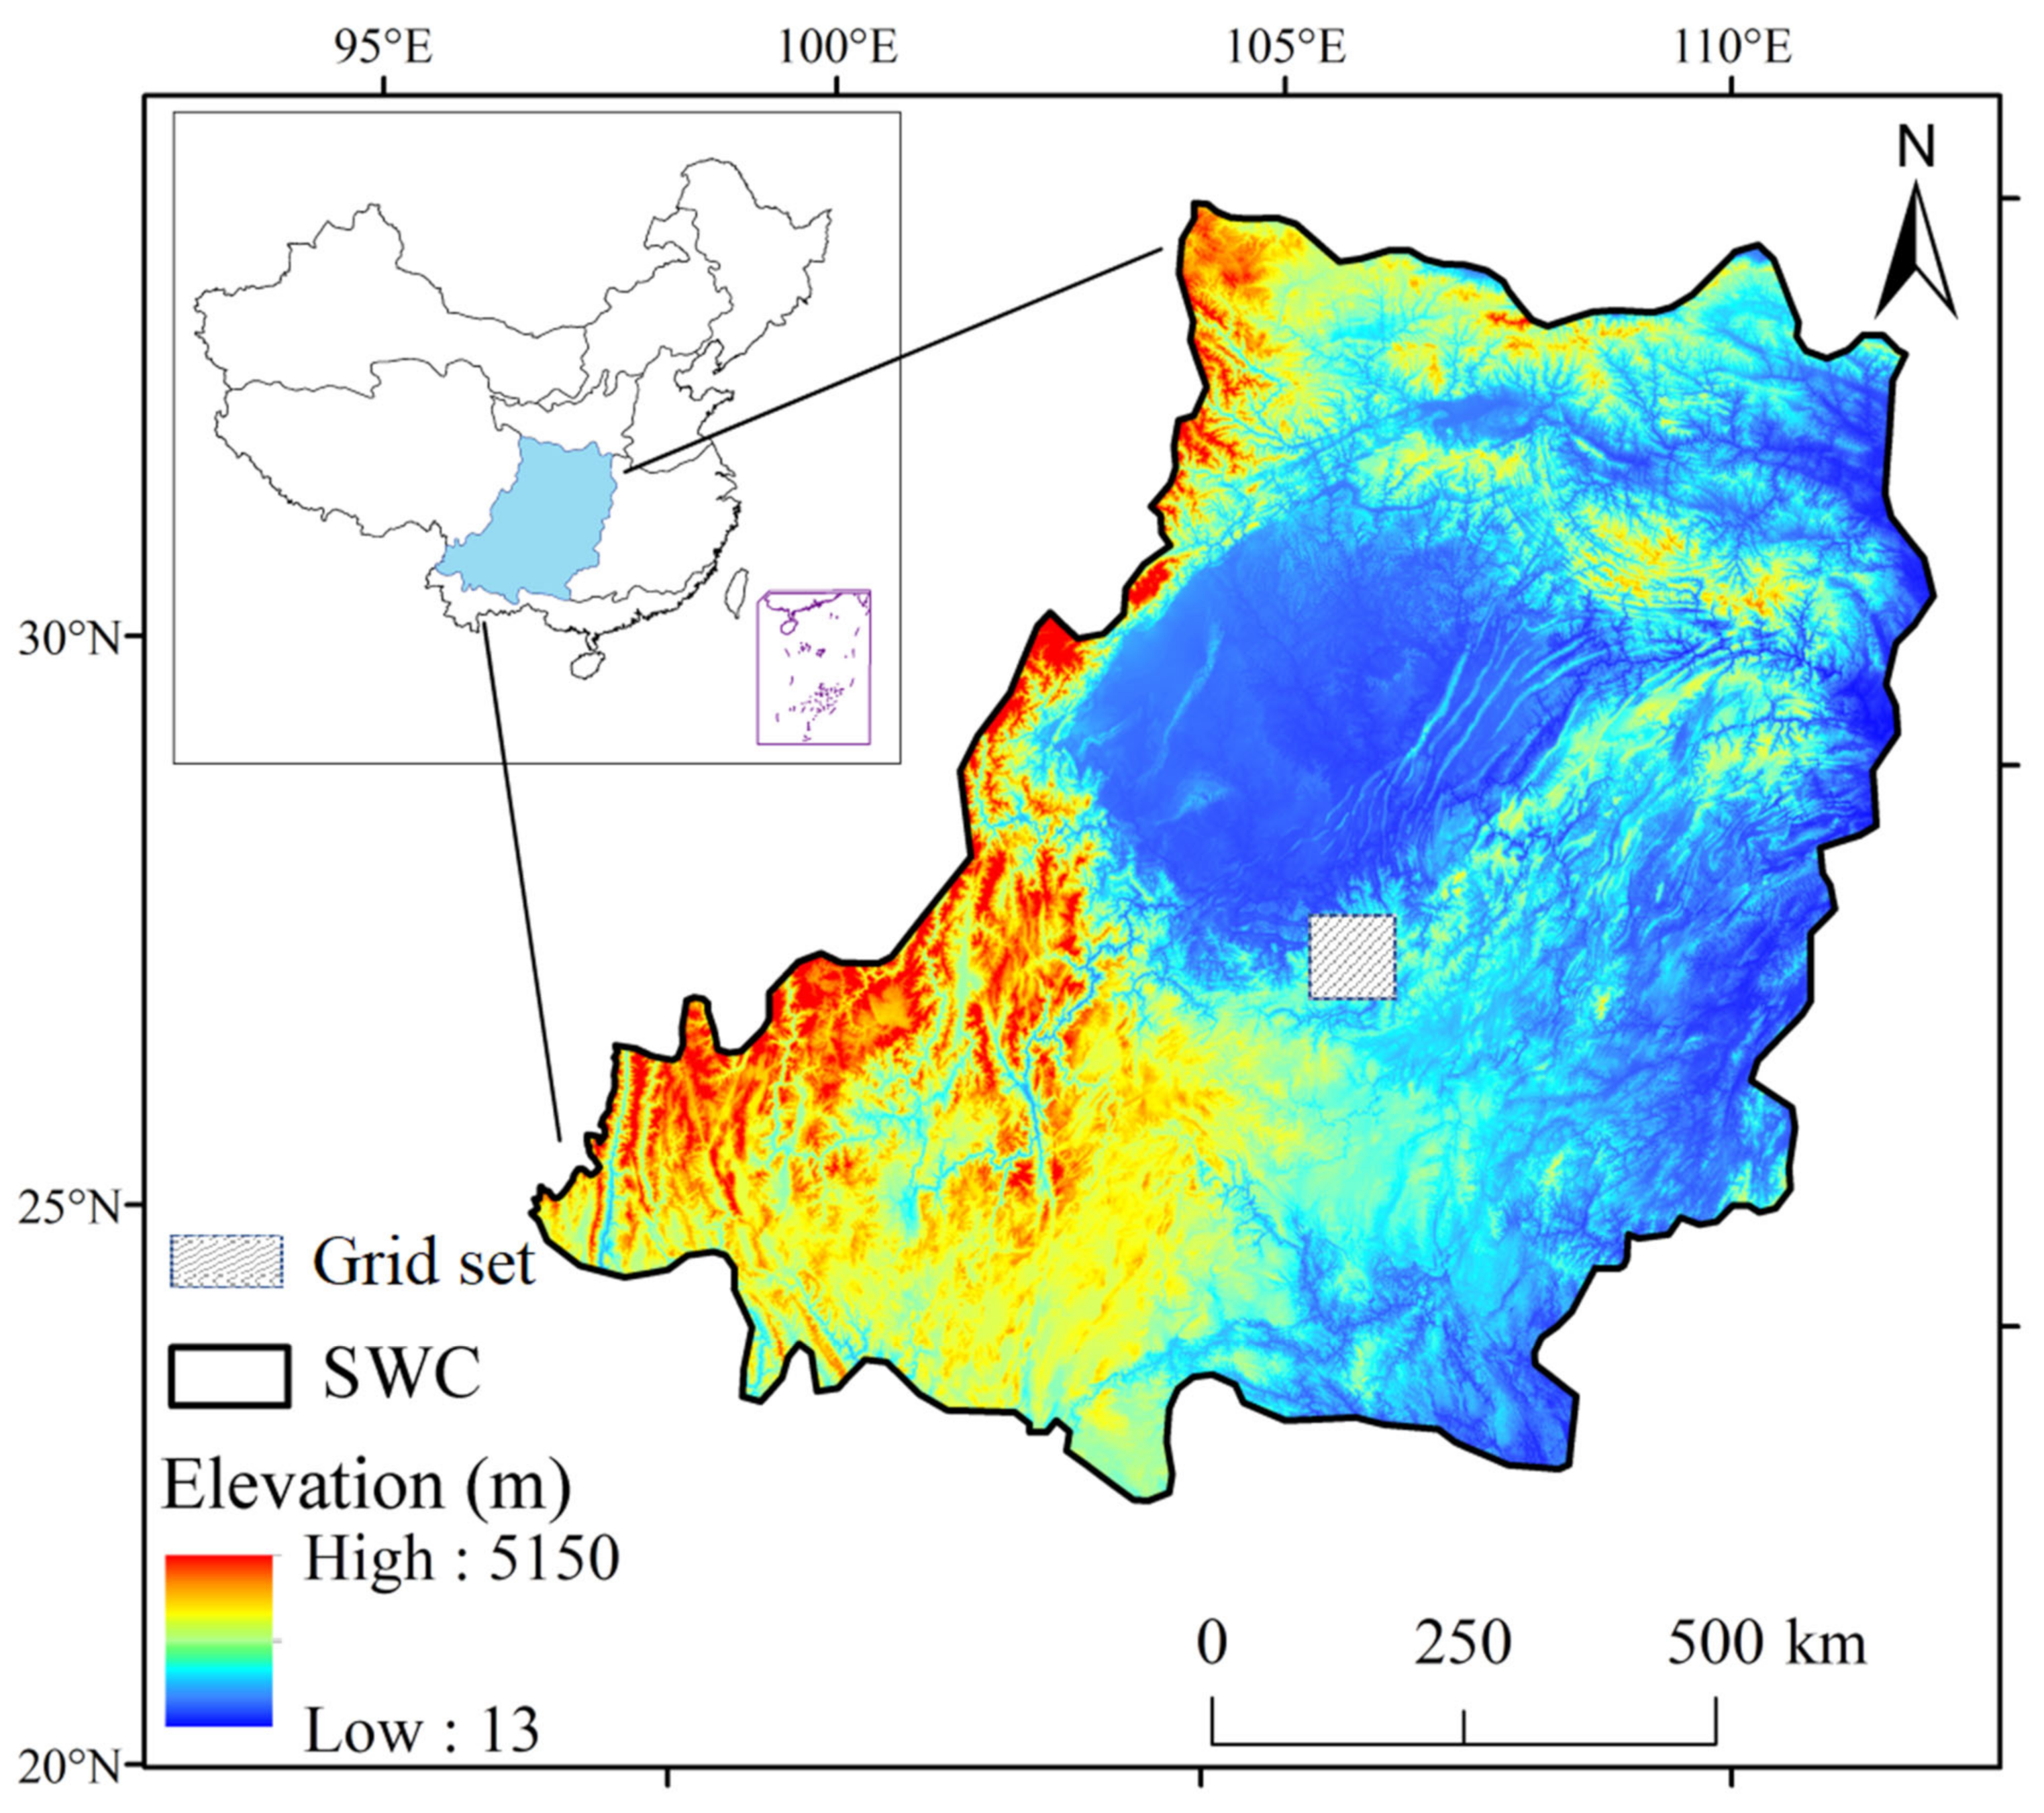
2.1. Study Site

Based on the study of Cook [17], we took a grid point located in the center of Southwest China (SWC) as the study case (See Figure 1). The area is affected by several monsoon systems, including the Southwest monsoon, East Asian monsoon, and the Westerlies [6]. The annual precipitation of SWC is about 1000 mm, and approximately 70–85% of the annual total precipitation falls from April to September, exhibiting seasonal and spatial variations in the distribution of precipitation. The average temperature in the east SWC is about 24 °C, while it is 0 °C in the west. There are four geomorphic units in SWC, including the Tibet Plateau, Sichuan Basin, Hengduan Mountains, and Yunnan–Guizhou Plateau. Additionally, SWC is susceptible to droughts; for example, a severe drought combined with high temperatures during the summer of 2006 caused water scarcity that affected at least 18 million residents, crop failures on 311,300 ha of land, and economic losses of approximately USD 2 billion. During the long-lasting drought from autumn of 2009 to the spring of 2010, around 21 million people were short of drinking water, and economic losses reached nearly USD 30 billion [23]. The analysis on the study site would indirectly provide a better understanding of drought events and long-term periodicity in SWC and also offer references for the prediction of future drought events.

2.2. Data

We used the PDSI to determine drought events. After performing a preliminary correlation analysis and reviewing related studies [5,6,16,21,22], we selected three influential factors, i.e., sunspots, ENSO, and PDO, for the analysis of the teleconnection and influence on droughts. The span of the long-term series was as follows: PDSI–AD 1300–2005, sunspots–AD 1700–2018, ENSO–AD 1301–2005, and PDO–AD 993–1996. The details of the PDSI and the three factors are described below.
PDSI: This index is the most prominent index of meteorological drought. It is an index of the cumulative water supply and demand on the land surface, reflecting the impact of climate change on drought [5]. The PDSI uses a two-layer bucket-type model for soil moisture computations and makes certain assumptions related to field water-holding capacity and the transfer of moisture to and from the layers based on limited data. Therefore, it could incorporate antecedent precipitation, moisture supply, and moisture demand into a hydrological accounting system [24]. The values of the PDSI can be divided into different categories (Table 1). The PDSI series during the AD 1300–2005 period originated from the PDSI grid data set of the Asian monsoon region that was reconstructed by Cook [17] based on tree ring data from nearly 300 regions in Asia. Then, we chose one grid in SWC as an example to analyze the drought changes and its influential factors during the AD 1300–2005 period, aiming to construct a systematic framework on analyzing long-term drought changes and its influential factors.
Sunspots: Sunspots are believed to be linked to climate change because the earth is affected by solar activity, and the sun provides the energy that drives the global atmosphere [25]. When the solar cycle is at its maximum, high-frequency radiation is released at high levels, increasing the amount of ozone in the upper atmosphere [26]. As a result, the upper atmosphere warms up, which affects the downward movement of the stratospheric airflow. Thus, the climate exhibits changes on a global scale, although this is not sufficient to cause significant global temperature changes [26]. Sunspot data from the Royal Observatory of Belgium, Brussels were used (http://www.sidc.be/silso/, accessed on 1 January 2019), and the yearly mean sunspot number was used to measure the sunspot factor.
PDO: The PDO describes the long-lived El Niño-like pattern of Pacific climate variability. Although the PDO and the ENSO have similar spatial climate characteristics, they have very different temporal behavior [21]. The PDO is often quantified by the use of an index, which is referred to as the PDO Index. We downloaded the data from https://www.nesdis.noaa.gov/.
ENSO: The ENSO is a periodic interannual variation in wind and sea surface temperatures and an indicator of climate change. ENSO has a significant impact on regional climate change and often causes strong climate anomalies [27]. ENSO also has been recognized as the prime climate modulator of precipitation [28]. The ENSO data were downloaded from ftp://ftp.ncdc.noaa.gov/pub/data/paleo/treering/reconstructions/enso-li2013.txt.

3. Methodology

3.1. Wavelet Transform

The wavelet transform is a common method for analyzing droughts because it is well suited for the study of hydrological time series with multi-scale change characteristics and non-stationary characteristics [29]. This method provides good performance in the time domain and frequency domain and can extract extremely weak periodic signals from noisy data.

3.1.1. Continuous Wavelet Transform

The continuous wavelet transform (CWT) can detect and describe the variation in a continuous time series [30]. The CWT has been widely used for detecting periodicity and other frequency spectrum characteristics of various hydro-climatic variables.
In our study, the CWT was used to detect changes of yearly series and to determine periodic oscillations, as well as partial characteristics of the change. The Morlet wavelet was used for the CWT [30]:
ψ ( t ) = π 1 4 e i ω 0 t e t 2 2
where t is the independent variable and ω 0 is the nondimensional frequency. Assuming a discrete time series x n n = 1 , , N with equal time intervals δ t , the CWT of a discrete sequence x n is defined as:
W n X s = δ t s n = 0 N 1 x n Ψ n n δ t s
where W n s is the wavelet coefficient, (*) is the complex conjugate, s is the wavelet scale, n is the localized time index, n is the translated time index, N is the number of points in the time series, and Ψ is the normalized wavelet; δ t / s is a factor used for the normalization of the wavelet.

3.1.2. Cross-Wavelet Transform

The cross-wavelet transform (XWT) is a time-frequency analysis method combining the CWT and cross-spectrum analysis; this method has been used to study the correlation between two different time series [28]. W X and W Y are defined as the CWT spectra of the two time series X and Y, and the XWT spectra are:
W X Y = W X W Y
The frequency spectrum of the XWT detects the strong frequency region that is common to the two time series. An analysis of the frequency spectrum was used to determine the relationship between the frequency spectrum of the XWT and the red noise background spectrum. Suppose that two signals X and Y with red background noise spectra are p X and p Y ; the relationship between the XWT spectrum and the red noise spectrum is used as the evaluation criterion:
D W n X s W n Y s σ X σ Y < p = Z ν p ν P k X P k Y  
All the wavelet transform processes in this study were performed with MATLAB R2016a software.

3.2. Mann-Kendall Test

The Mann-Kendall test (MK test) is a nonparametric test recommended by the World Meteorological Organization (WMO). It is often used to analyze time-series trends of precipitation, runoff, water quality, and temperature. This method does not need to follow a certain distribution of samples, nor is it interfered by a few abnormal values. Therefore, it is suitable for data with non-normal distribution, such as hydrological and meteorological data, and the calculation is straightforward [6]. In this study, we used the MK test to detect the drought trend in the time-series data.

3.3. Assessment of the Relative Rate of Influence

3.3.1. Random Forest and the Relative Rate of Influence

The random forest (RF) method, which is an ensemble of classification and regression trees (CART) trained on bootstrap samples and randomly selected features, does not result in overfitting and is not sensitive to noise in the bootstrap training samples [31,32,33]. RF also does not require specific assumptions of the distribution of the dataset [32,34]. Each tree provides results using bootstrap samples chosen randomly from a predictor dataset at each node; thus, the RF model makes decisions according to the average aggregation results of the decision trees [13,35,36]. RF ranks the input variables in descending order of importance regarding the output and uses the mean decrease in the Gini impurity index (MDG) based on an out-of-bag (OOB) term [37]. The Gini index is a measure of the probability that a variable is wrongly classified. It is also a general indicator of feature relevance, visualizing the outcome of implicit feature selection [38]. Based on the Gini index, a tree node is split according to the balance between the variables of the node and those of the two descendent nodes [39]. The heterogeneity and importance of the variables can be assessed with CART and RF. The Gini index is calculated using the following equation, assuming that the regression tree has D nodes [39]:
G i n i i = 1 j = 1 n ( X i , j j = 1 n X i , j ) 2 , i d
where X i , j are the climatic data of the j t h sample for the i t h factor, and d is the tree node (d = 1, 2… D). Since the factors at node d are divided into two daughter nodes, the value of the Gini index can be minimized and used as the terminal value, which is denoted as v at the tree node d :
G i n i d , v = min G i n i i | i d
When node d splits, the sum of the Gini indices of the two daughter nodes is less than the previous value of node d , and the absolute value of the decrements is calculated with the following equation:
Δ G i n i d = G i n i d n l n · G i n i d l n r n · G i n i d r
where G i n i d l is the Gini value of the left daughter node, G i n i d r is the Gini value of the right daughter node, and n l and n r are the respective sample numbers of the two daughter nodes. The importance of a given feature in a tree is expressed as the summation of the criterion values at each node. The importance of the variable, denoted as MDG, is estimated by computing the average of G i n i d of the total number of trees. The MDG can then be used to select the crucial variables [40].
Based on the MDG, we proposed a formula to quantify the relative rate of influence of the factors on the PDSI change:
η i = M D G i 1 n M D G i × 100 %
where n, M D G i , and η i represent the number of variables, the mean decrease in the Gini purity, and the relative rate of influence of each factor, respectively. In this study, the influencing factors included the sunspots, PDO, and ENSO, and the PDSI was the indicator of drought. The term “relative” was used because we only considered three factors.

3.3.2. Sliding Time Window

The sliding time window (STW), which is a method for detecting patterns in the time-variant database [41], was used to analyze the temporal dynamics of the relative rate of influence of each factor. We used 30-, 50, and 100-year time windows in this study.

4. Results

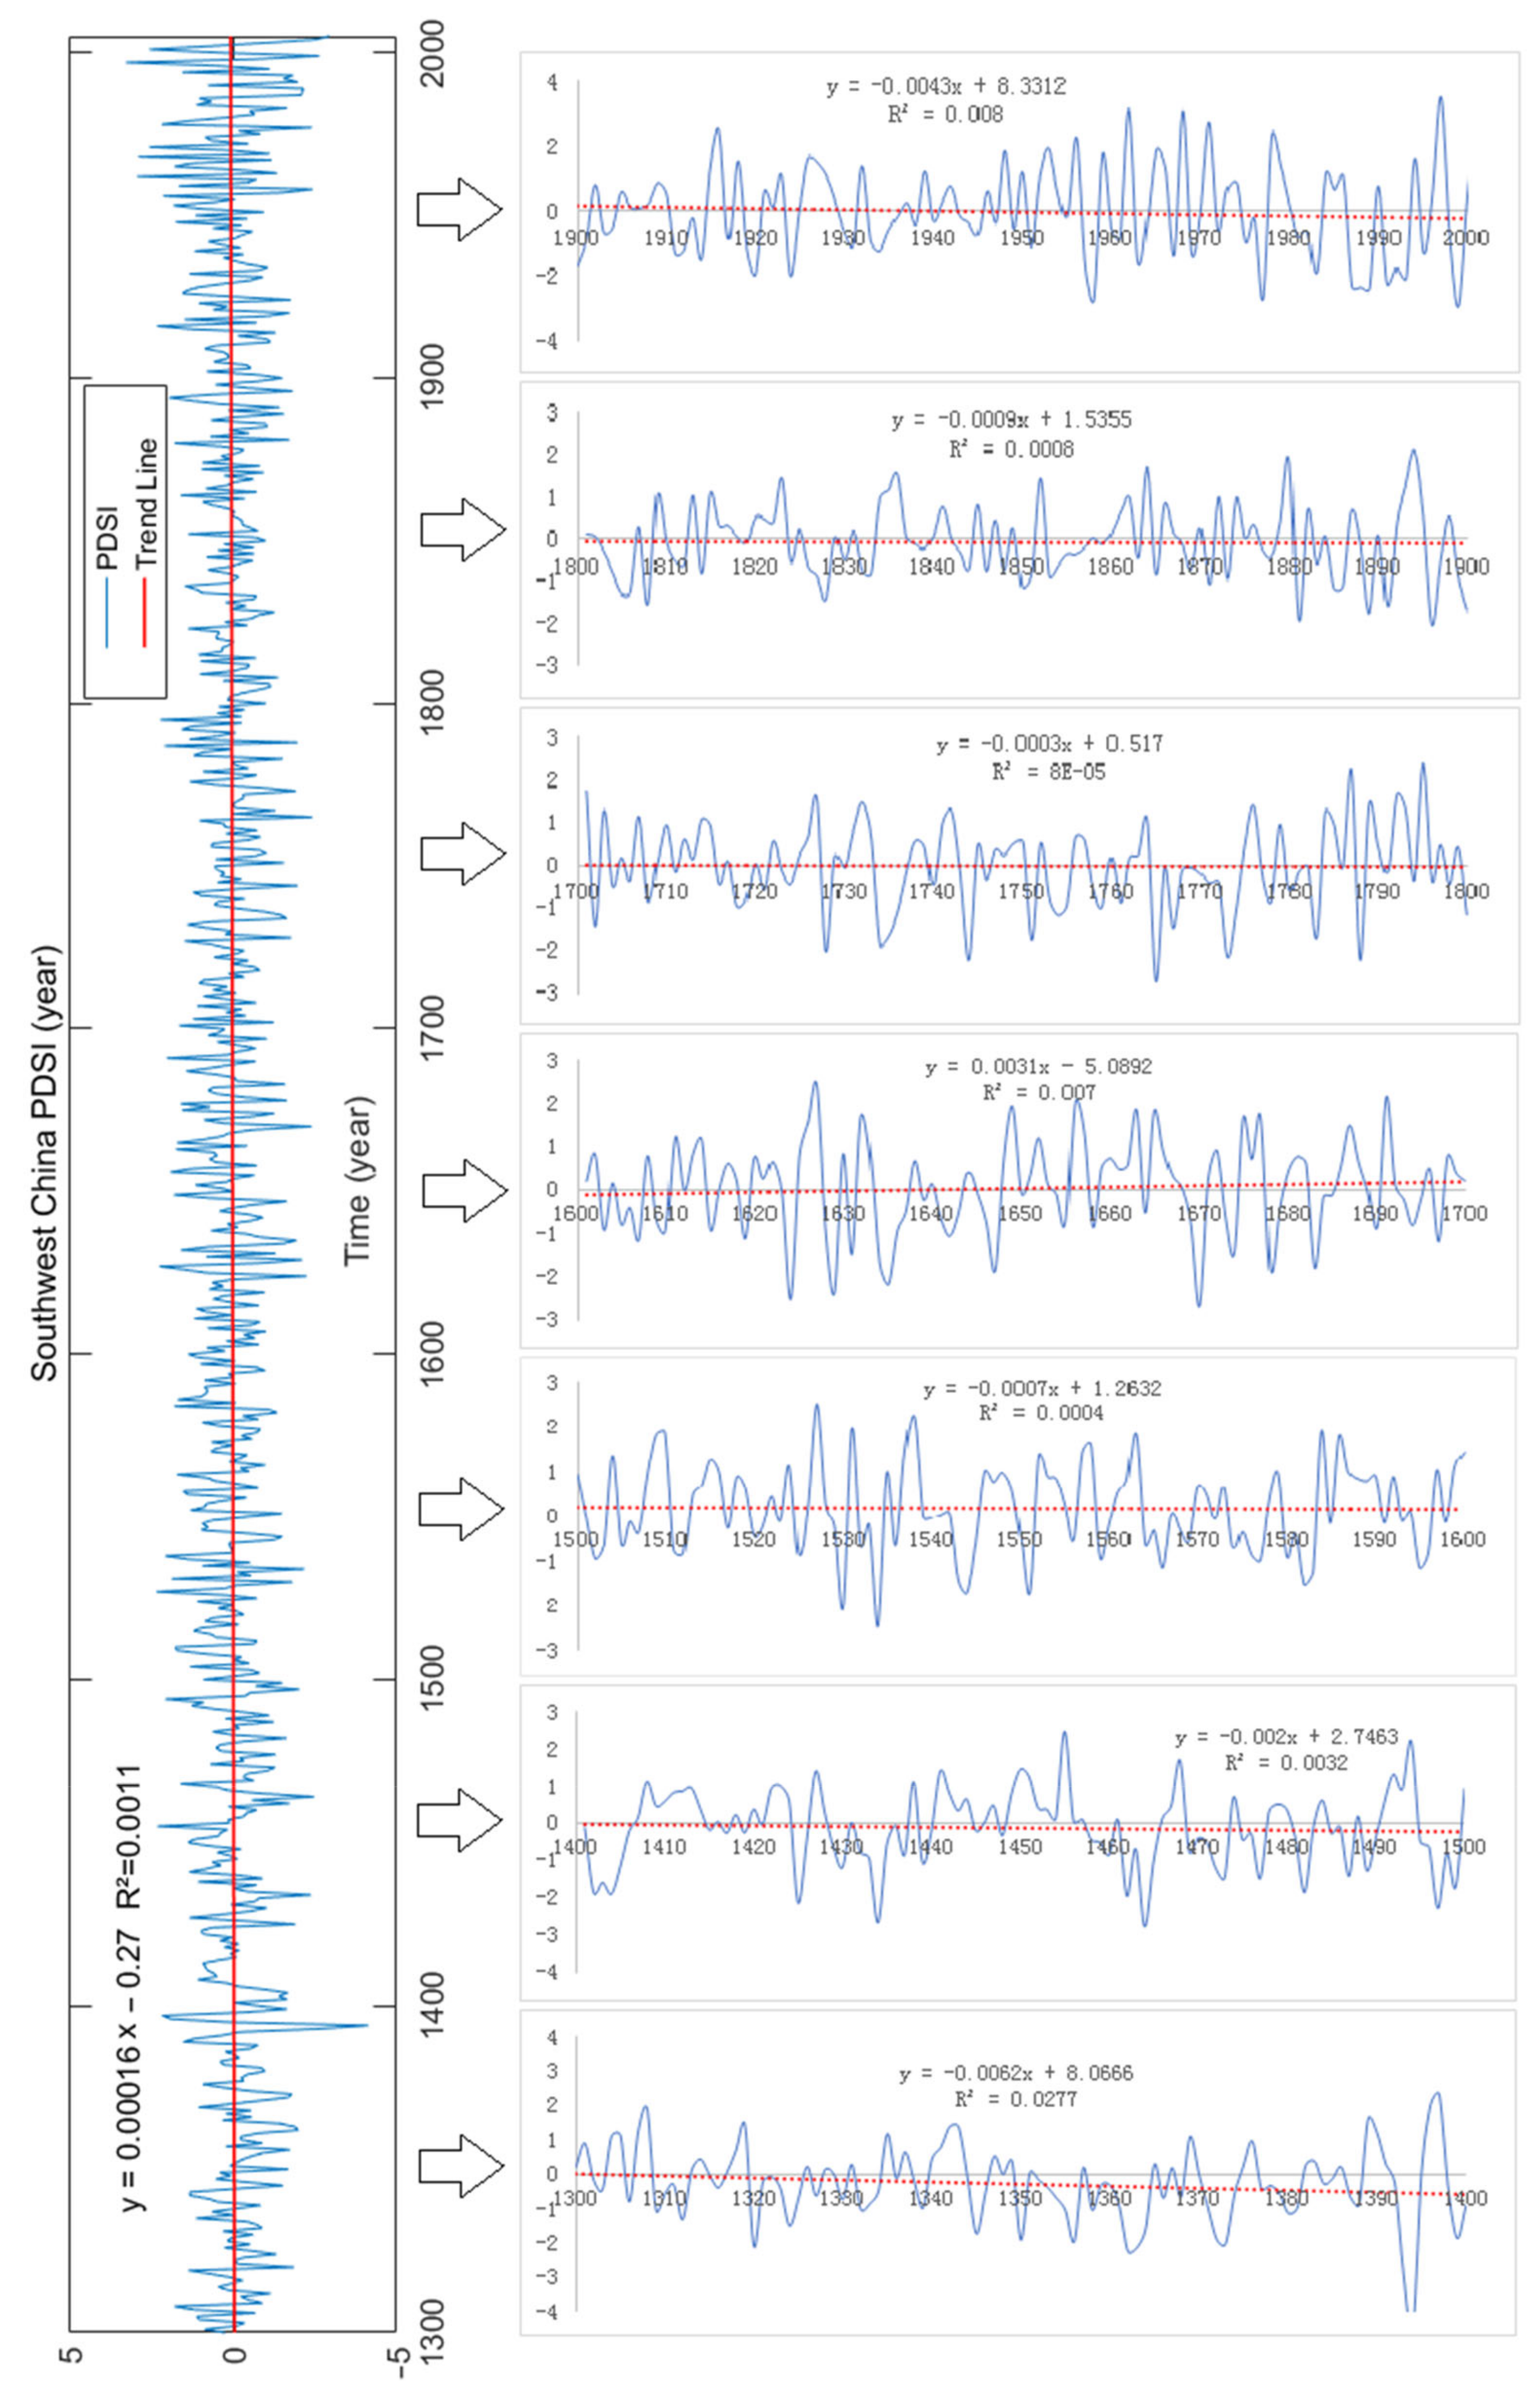
4.1. Trend Analysis of Drought

Table 2 shows that 232 droughts occurred in the study site area during the AD 1300–2005 period, although most were mild and incipient droughts. Only one extreme drought occurred in the Ming Dynasty (AD 1394), and one severe drought occurred in AD 2005 in the People’s Republic of China (AD 2005). The annual average frequency of drought occurrence was 0.36 times per year, 0.47 during 1949–2005, and only 0.29 in the Qing Dynasty. Therefore, the study site was a drought-prone area in historical times, with considerable diversity in the different dynasties.
The results of the MK test of the PDSI series during the AD 1300–2005 period are shown in Figure 2. The MK value of the time series was 0.68, indicating that the study site experienced a non-significant wetting trend during AD 1300–2005. During 1300–1430, the UF curve showed that the values were all less than zero, except for the first few years, indicating a drying trend. After AD 1430, an upward trend was detected, and most points passed the significance test (p < 0.05) during 1600–1780. There was an intersection around 1420, and this abrupt change was a significant point in the series (p < 0.05), indicating the beginning of wet trends.
Unary linear regression was used to analyze the PDSI trend in the study site (Figure 3). An upward trend was detected during AD 1300–2005, validating the wetting trend. During the seven centuries, only the 17th century showed an upward trend, whereas downward trends were observed in the other centuries, suggesting that the wetting trend in the 17th century contributed significantly to the wetting trend of the entire series.

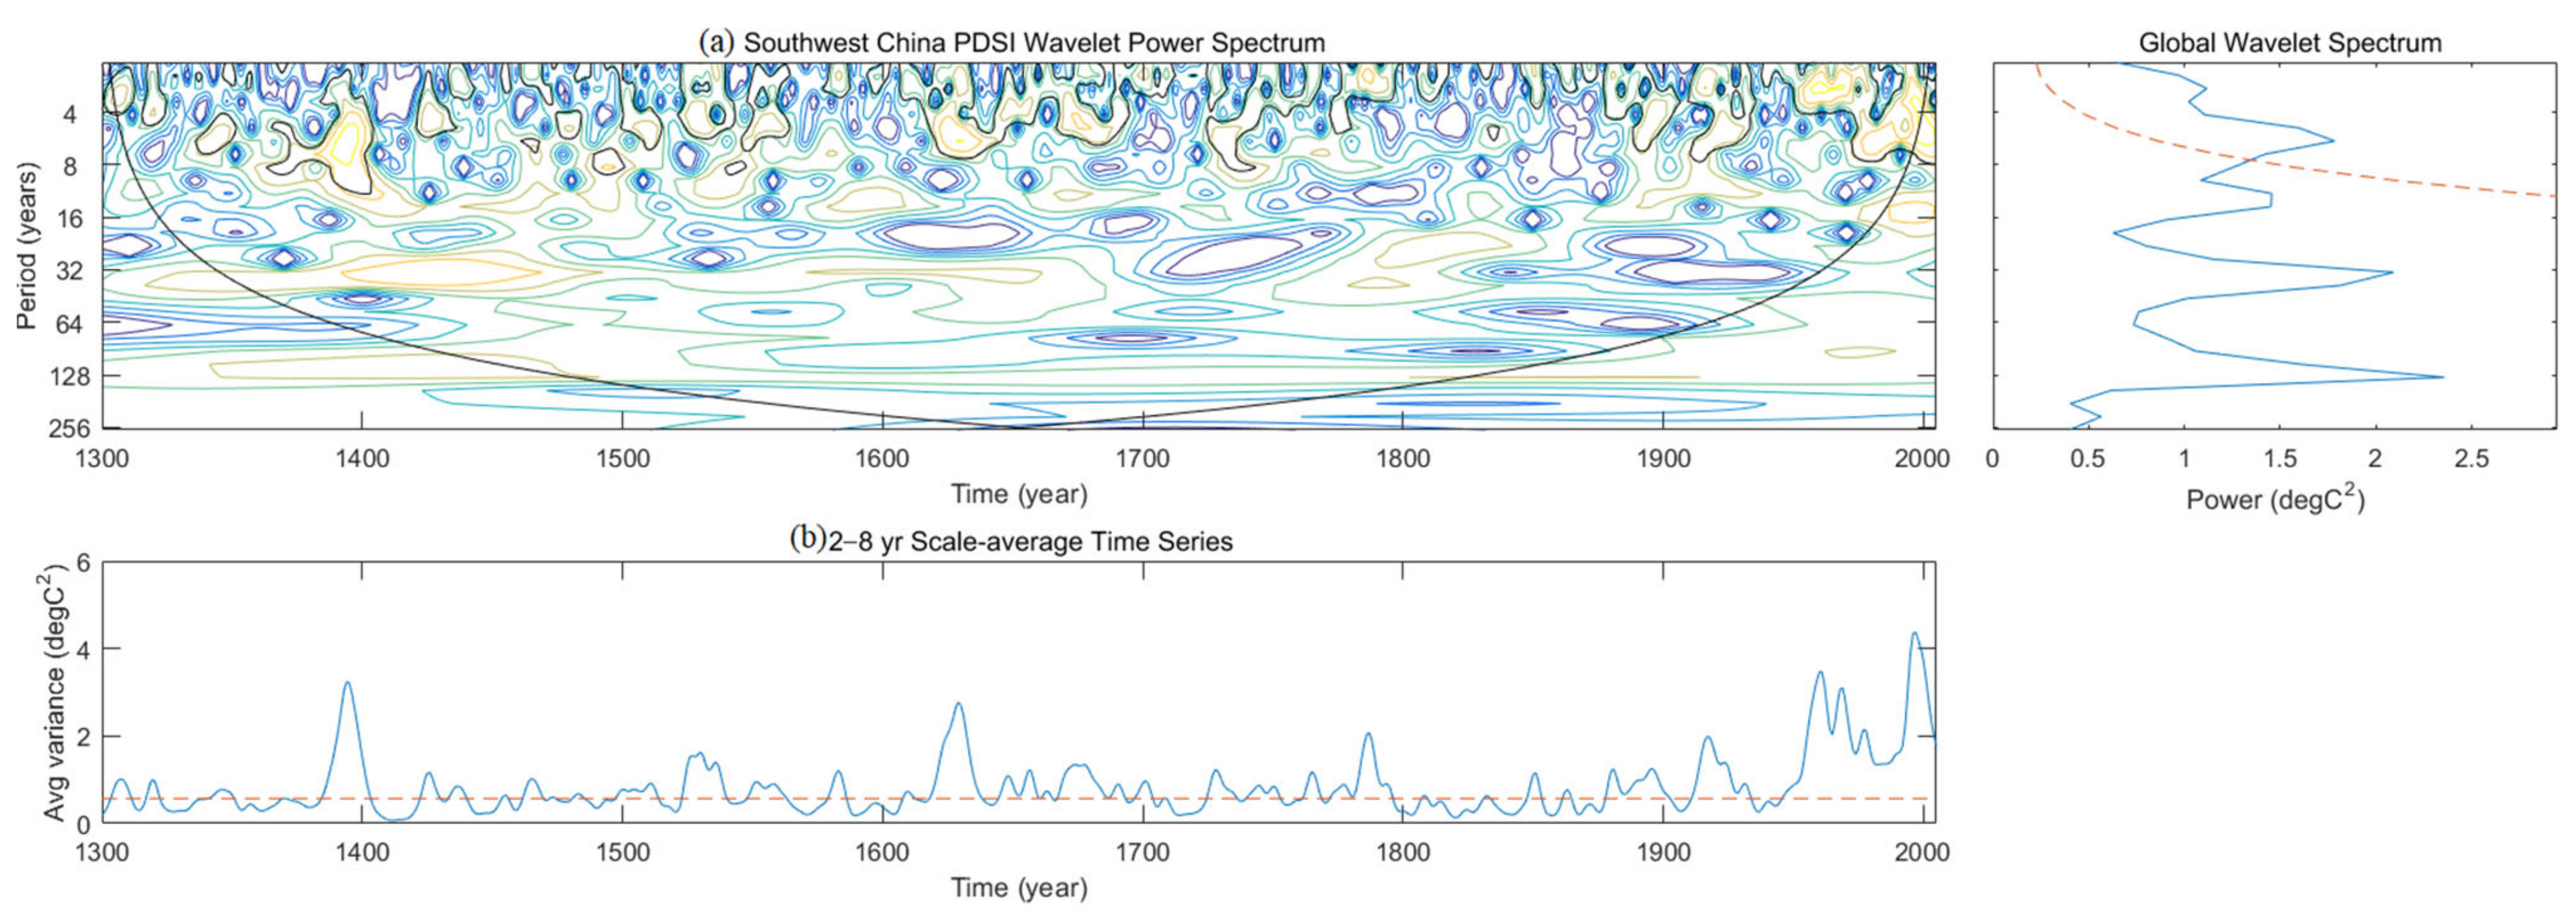
4.2. Periodicity of Drought

The results of the CWT of the PDSI are shown in Figure 4. The wavelet spectrum of the series shows the existence of 4-, 8-, 16-, 32-, and 128-year-periods from AD 1300 to 2005 (Figure 4a); however, only the 4- and 8-year periods were significant at the 95% confidence level. Therefore, these are the two crucial periods. Additionally, Figure 4b shows that the 2–8-year period was identified as the most significant period (p < 95%), explaining 9% of the total variance.

4.3. Teleconnections with the Three Influential Factors

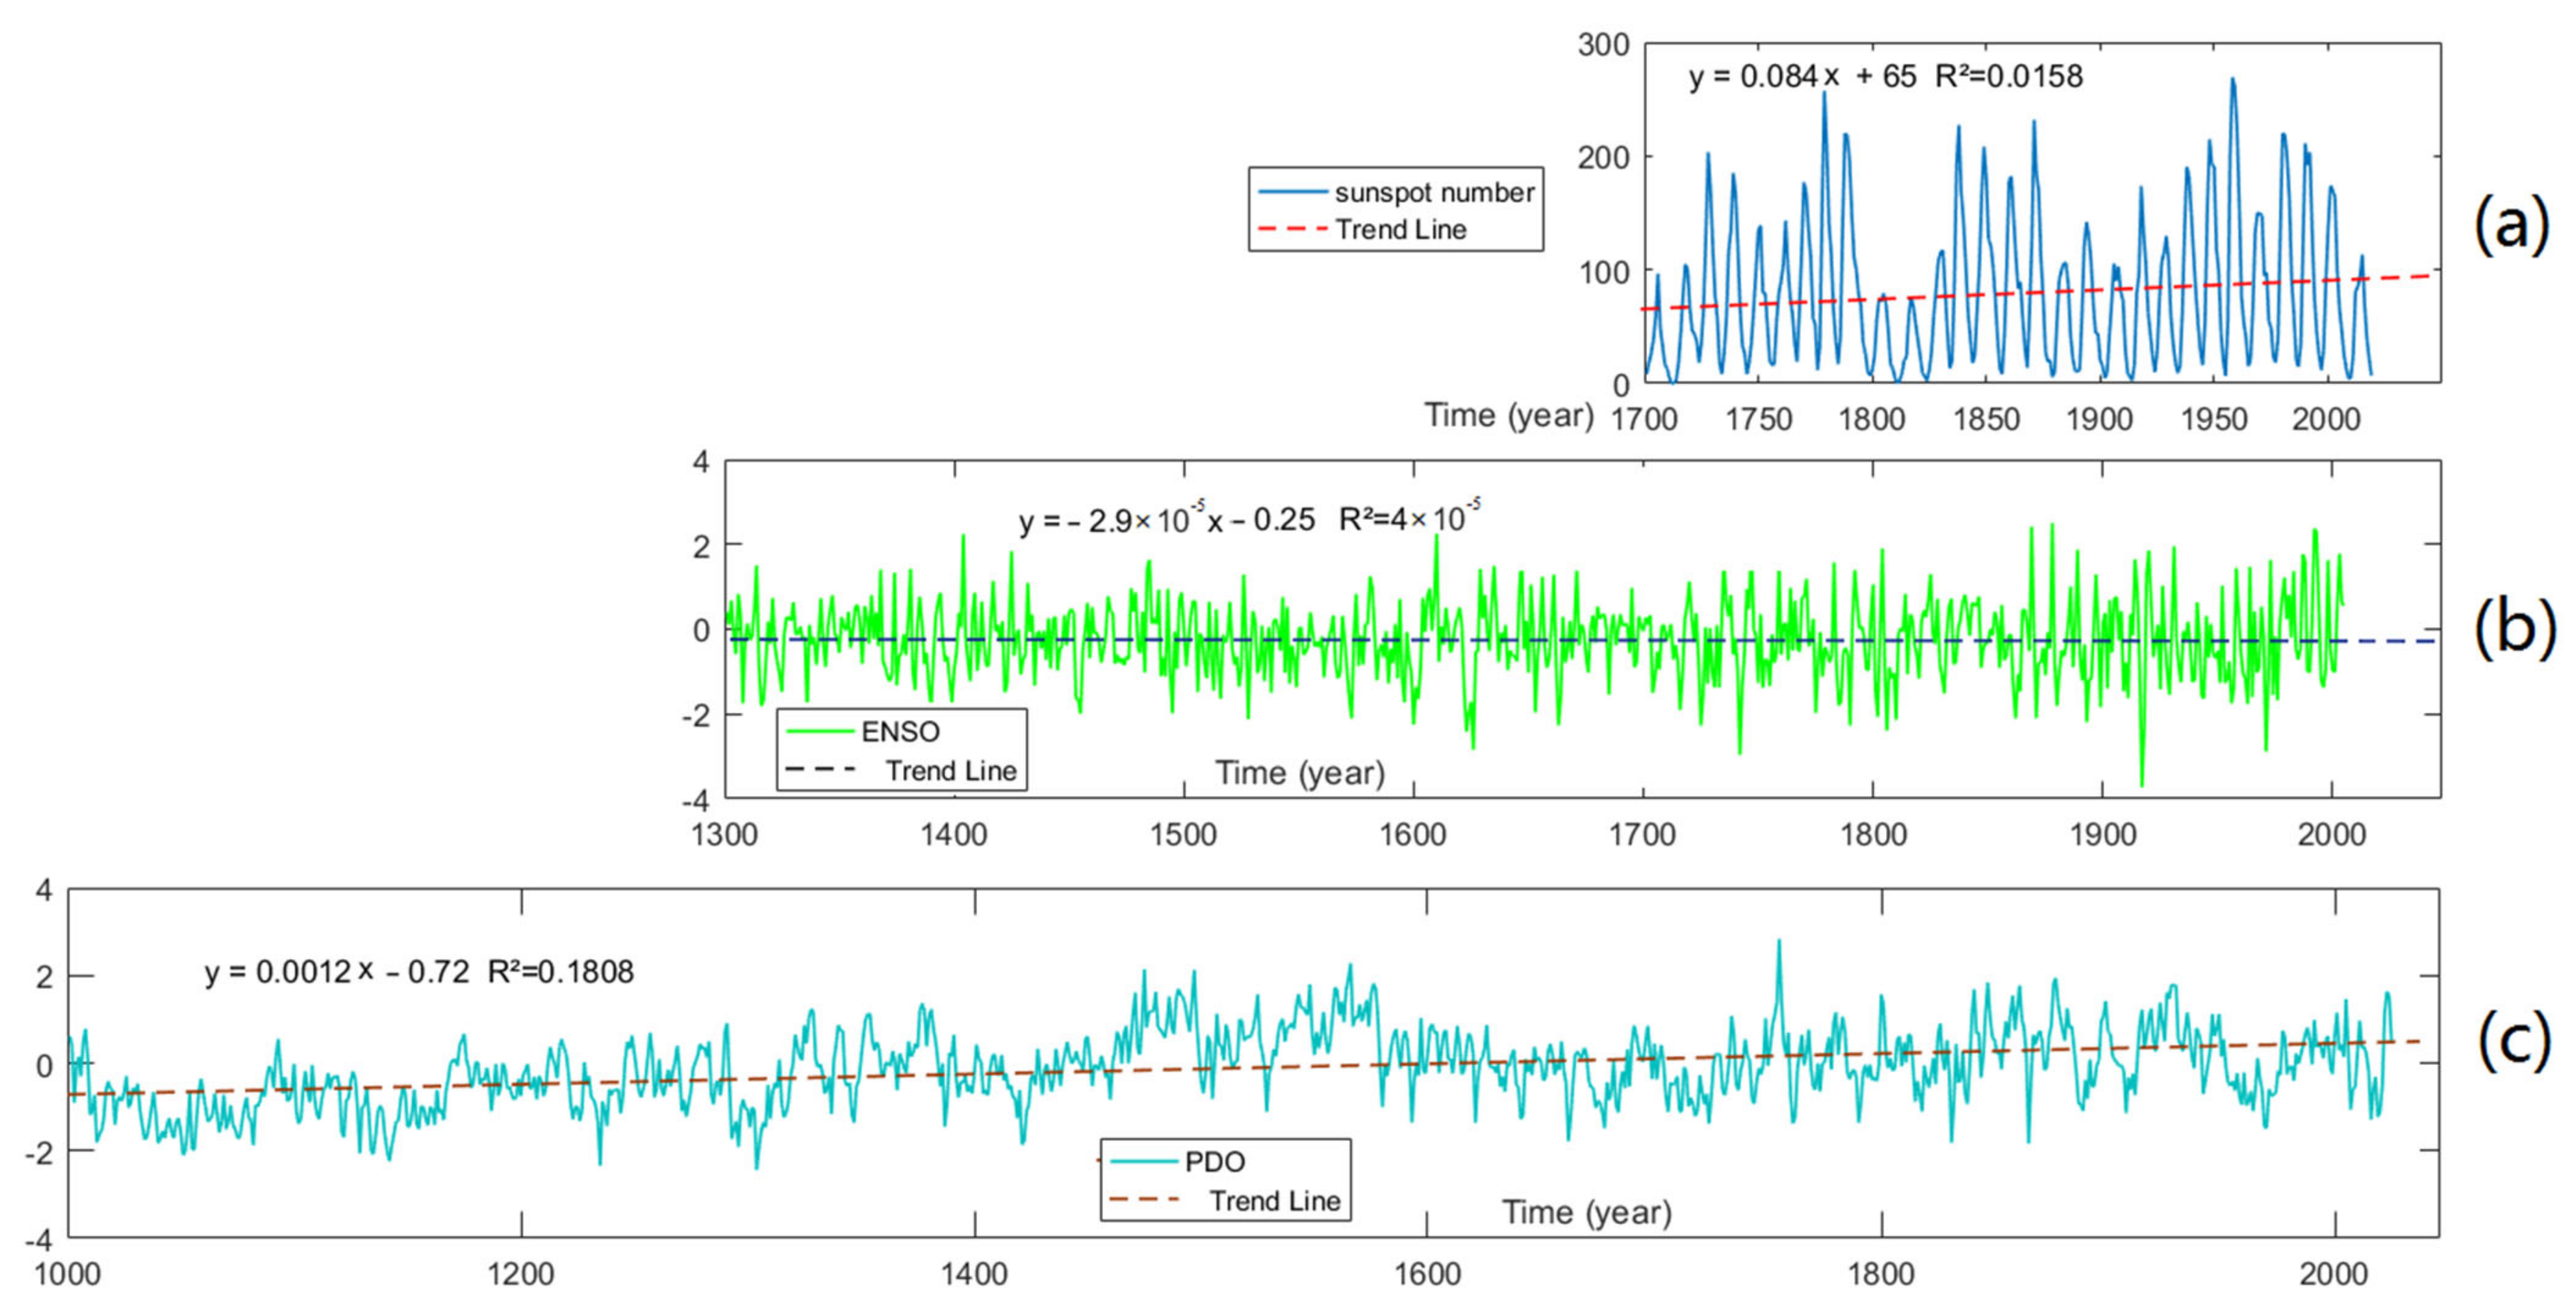
4.3.1. Trend Analysis of the Three Influential Factors

Droughts are generally influenced by various circulation systems and solar activity. Therefore, we focused on the relationship between drought and the influential factors. Figure 5 shows the trends of the three influential factors. The PDO and sunspot numbers showed increasing trends; specifically, the sunspot number was significant at the 0.05 significance level, and the PDO was significant at the 0.001 significance level, suggesting that both factors exhibited significant increases. However, the ENSO exhibited a non-significant downward trend.

4.3.2. Relationship between Drought and the Three Influential Factors
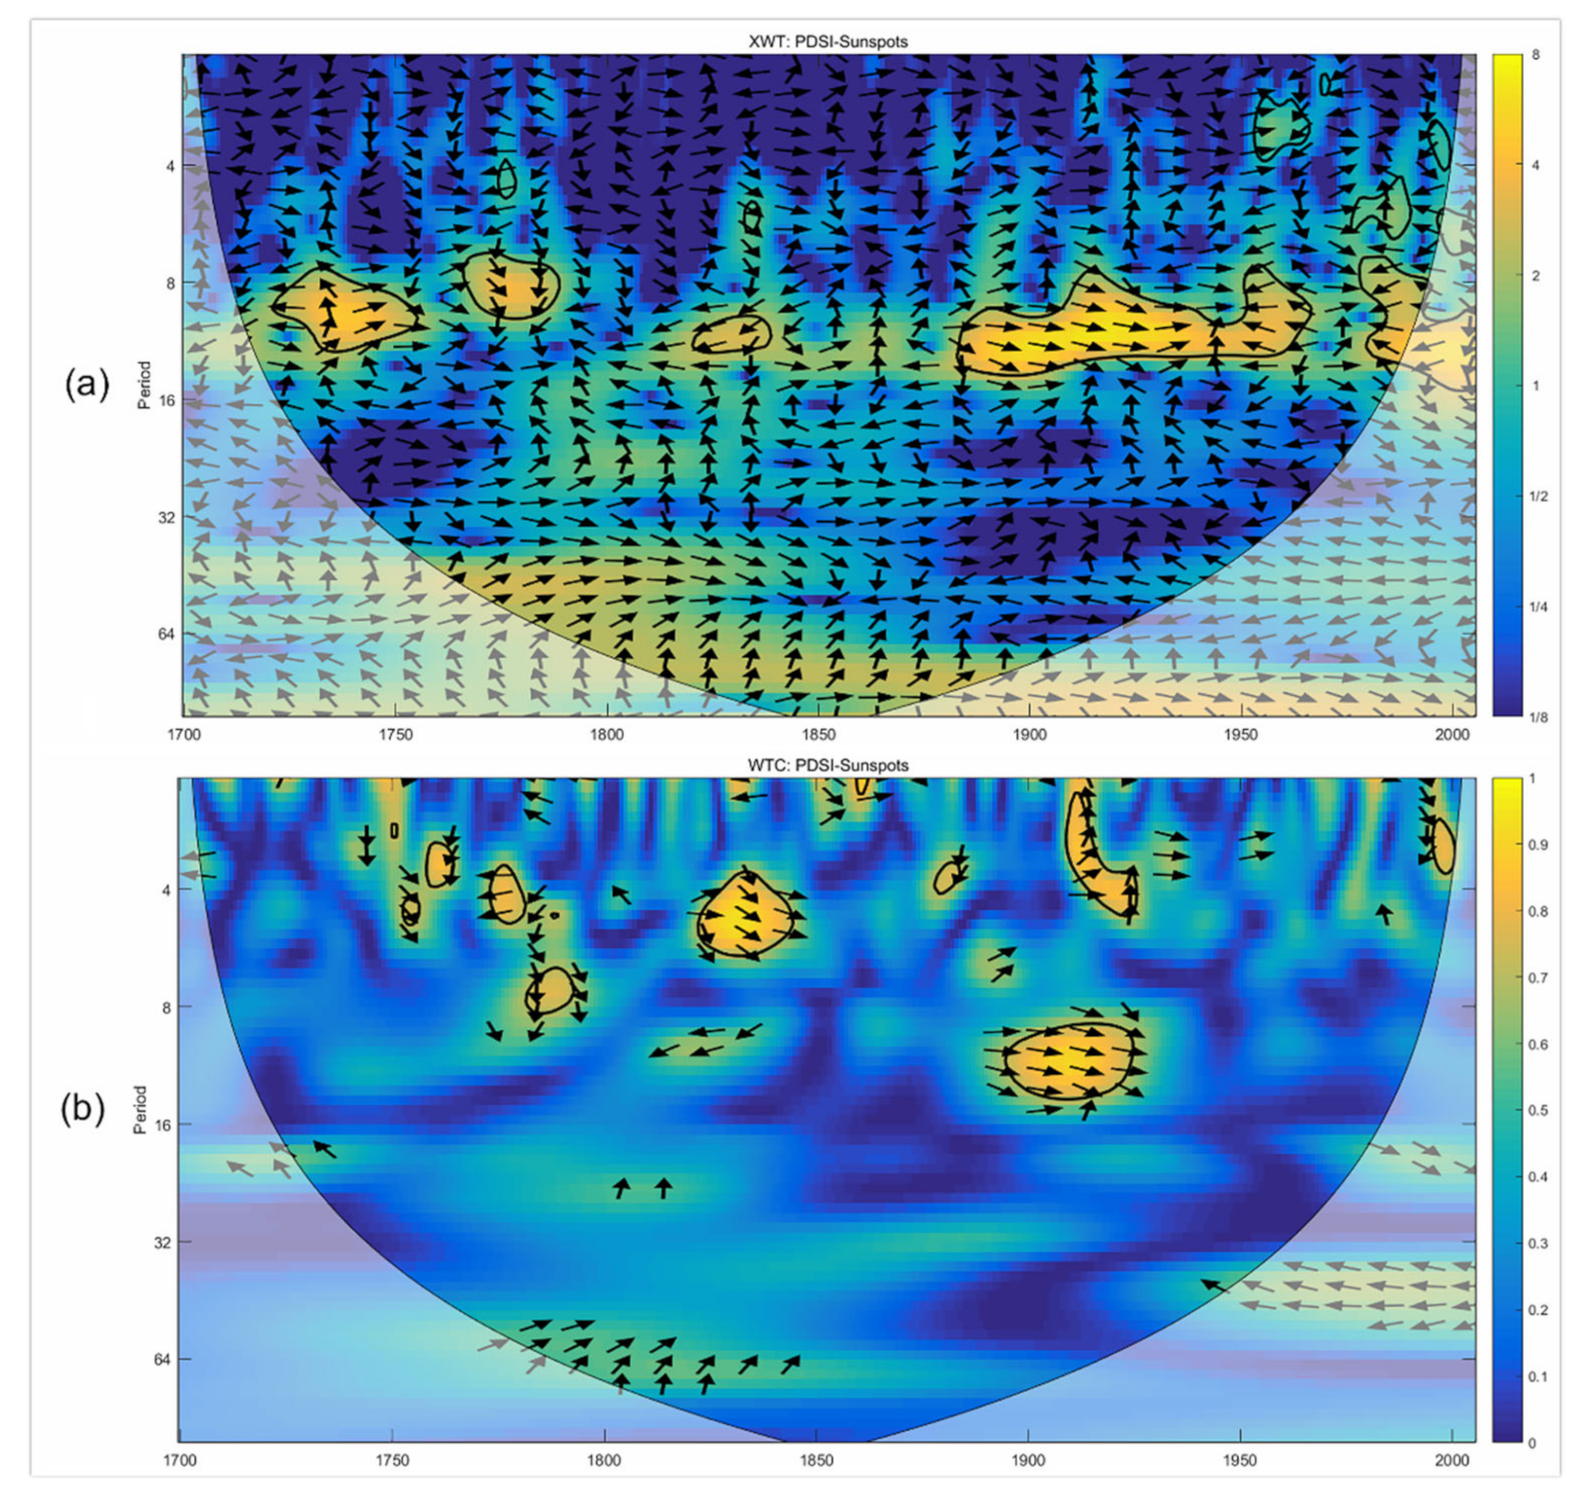
(a)
PDSI-sunspot number
As shown in Figure 6, there were two significant periods in the annual series of the sunspot number (AD 1700–2018), i.e., the nearly 11-year period from 1720 to 1800 and the nearly 11-year period from 1825 to 2000. Figure 7 shows the results of the XWT and the wavelet coherence (WTC) between the PDSI and the sunspot numbers. We found that common periods with cycles of 8–12 years were dominant during 1725–1750, 1760–1780, 1830–1840, and 1880–1960 (Figure 7a). The WTC spectrum (Figure 7b) reflects the dependence of the correlation degree between the two time series on the frequency. Compared with the wavelet frequency spectrum, the correlation degree between the PDSI and the sunspot number decreased with an increase in the oscillation frequency. Most of the resonance periods (the shared period of oscillations) with significant correlations between the two series presented significant performances in the time-frequency variation, especially at the interdecadal scale, such as during 1830–1840 and 1880–1930. However, the correlation in other periods was not high.
(b)
PDSI-ENSO
The wavelet power spectrum (Figure 8a) shows that the periodic correlation between the PDSI and ENSO series in the same frequency domain was weak. There were periods of 5–15 years in 1400–1420, 28–32 years in 1600–1640, 24–30 years in 1800–1850, and 4–10 years in 1900–1930. The resonance period was characterized by a short duration and low frequency. Figure 8b shows five significant resonance periods in the common time domain between the PDSI and ENSO series, i.e., periods of 5–15 years in 1400–1420, 32 years in 1600–1630, 30 years in 1800–1840, 5–9 years in 1900 to 1920, and 5–7 years after 1990. However, the cross-wavelet coherence spectrum indicated a high correlation between ENSO and PDSI (Figure 8c). The resonance period in the wavelet power spectrum featured a one-to-one correspondence with the clustering in the cross-wavelet coherence spectrum. Generally, the ENSO was also presented as strongly correlated with the PDSI in some time domains.
(c)
PDSI-PDO
As shown in Figure 9a, the PDO did not exhibit any periods in the time domain. The PDO and PDSI had no resonance period in the low-frequency region; there was a period of 80–130 years in the high-frequency region, but it was not significant (Figure 9b). As shown in Figure 9c, the PDSI and PDO covaried in the time domain during 1320–1580, indicating a strong correlation, although it was not significant. Generally, the PDO had relatively little influence on the drought in the study site.

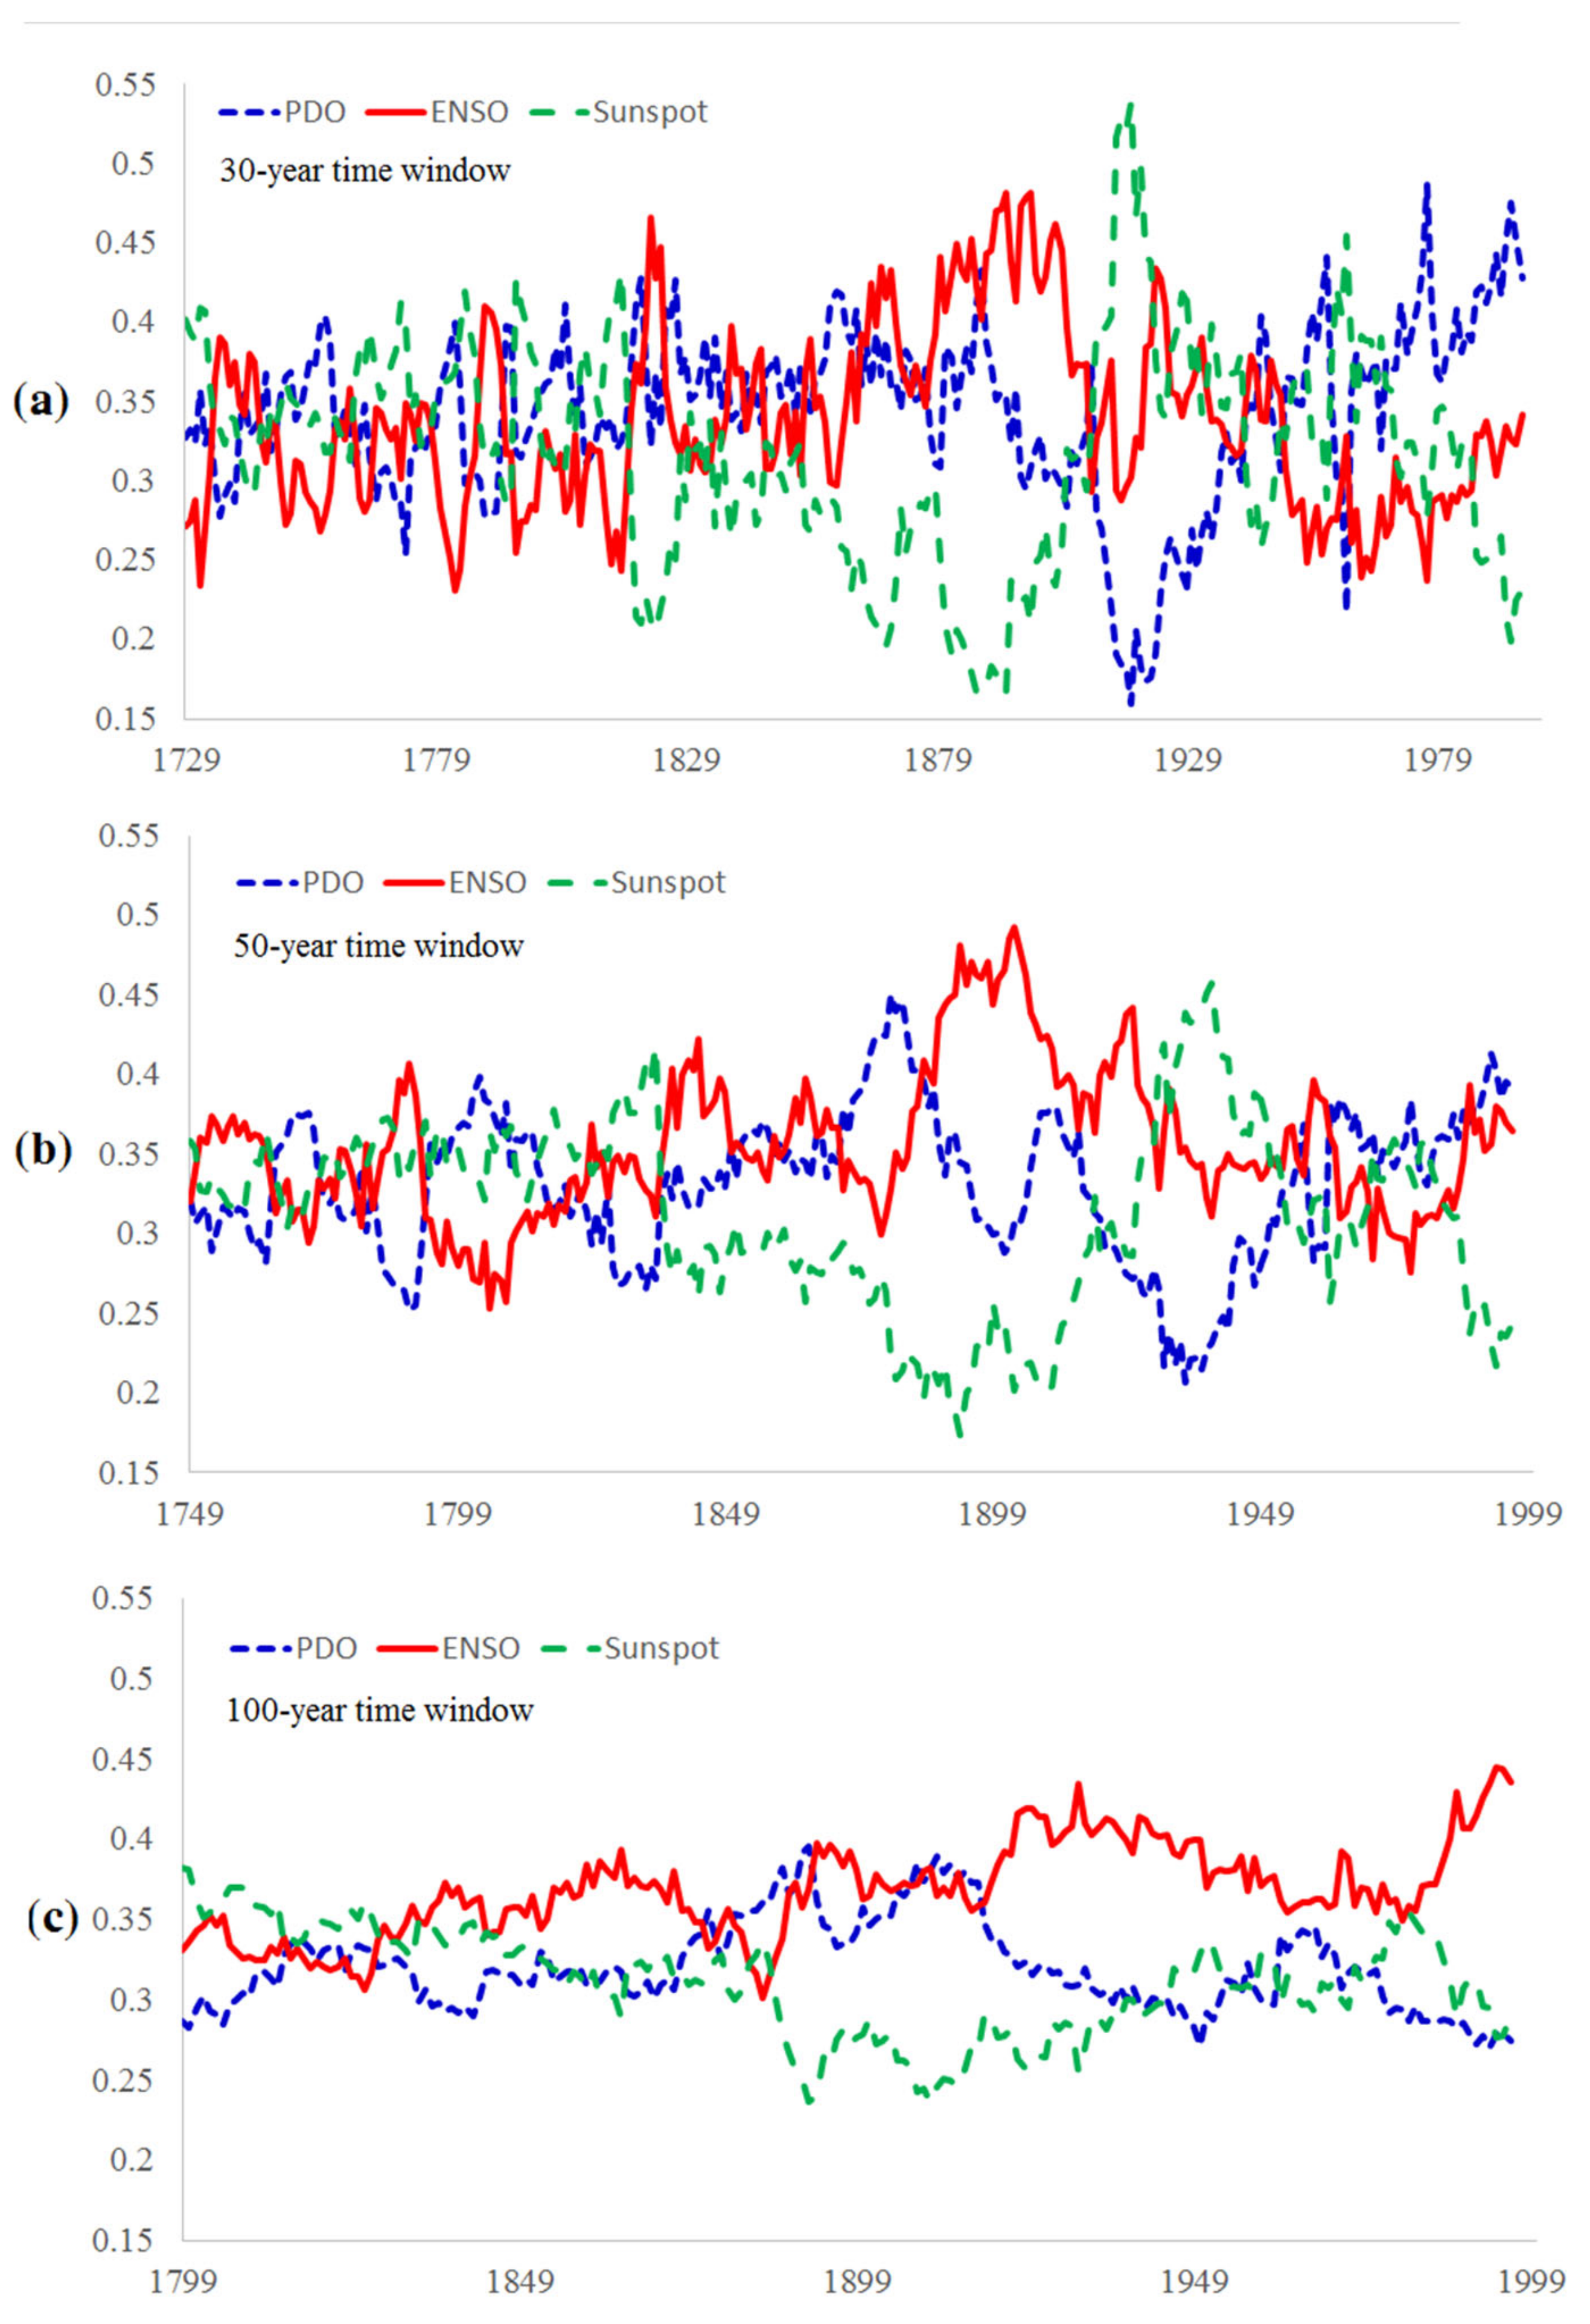
4.3.3. Relative Rates of Influences of the Three Factors

A quantification of the relative rate of influence of the three factors provided an understanding of the evolution of drought, as well as the potential to predict future trends. Since the period of the three factors was quite different, we only used the time series with the same period, i.e., AD 1700–1996. We first calculated the MDG of each factor and obtained the relative rates of influence during AD 1700–1996 using Equation (8). The results showed that the relative rates of influence of the ENSO, the sunspot number, and the PDO were 38.40%, 31.81%, and 29.8%, respectively, suggesting that the ENSO had the most significant impact on drought, followed by the sunspot number and the PDO. The results of the periodicity analysis verified the results of the relative rate of influence.
We used Equation (8) and performed an STW analysis to obtain the dynamic rate of influence of the three factors on drought during AD 1700–1996 (Figure 10). Figure 10a shows that the relative rates of influence of the three factors fluctuated strongly over time for the 30-year time window. Specifically, the relative rate of influence of the sunspot number was in the range of 16%~53% from AD 1729 to 1996. The rate reached the lowest value in 1893 and rebounded and reached the maximum value in 1918. The relative rate of influence of the ENSO exhibited relatively stable fluctuations in the range of 23%~48%. The relative rate of the PDO was relatively stable before AD 1910 and declined sharply to the minimum value in AD 1918, followed by an increase. The results of the 50- and 100-year time windows showed similar characteristics (Figure 10b,c), but the amplitudes were smaller than that of the 30-year time window. Accordingly, the dominant factors affecting drought were different in different periods, and the influence of each factor changed over time.

5. Discussion

5.1. Possible Associated Clues between Natural Disasters and Historical Events

During AD 1300–2005, there were five dynasties in the study site, i.e., the Yuan Dynasty (AD 1300–1368), Ming Dynasty (AD 1368–1644), Qing Dynasty (AD 1644–1911), the Republic of China (1912–1949), and the People’s Republic of China (1949–2005) (Table 2). There is little debate about the reason for the collapse of the Qing Dynasty and the Republic of China because both were ended by human factors. The former one was ended by the Revolution of 1911, and the latter one was replaced by a new regime. However, there is some disagreement on the reason for the collapse of the Yuan and Ming Dynasties. Some researchers believe that the collapse of the two dynasties was attributable to institutional factors, whereas other researchers have suggested that natural disasters induced by climate variability contributed to the collapse in addition to the institutional factors [42,43]. The latter view is questioned due to lack of sufficient evidence, so this study attempted to look for some clues to support this view by the case of SWC.
The Yuan Dynasty eventually collapsed in AD 1338 after an uprising had lasted for more than ten years. As shown in Figure 3, there were no severe droughts or floods in the study site of SWC during AD 1320–1338; however, precipitation was relatively low, and small droughts occurred successively during these years. It is well known that the ecological environment in or around the study site is relatively fragile, especially in the karst regions with thin topsoil. In karst regions, not much water is stored in wet years, and there are large evaporation losses in dry years. Therefore, successive years with small droughts can easily result in crop failure. In the late Ming Dynasty, there were several nationwide droughts during the 1620s–1640s [43,44]. Droughts that initially occurred in North China and spread rapidly to South China lasted more than 4 years (AD 1638–1641) and caused extensive yield losses [45]. In our study, three droughts were detected in the study site in AD 1624, 1629, and 1635, respectively, and these droughts were attached to the nationwide droughts during the 1620s–1640s and also resulted in massive crop failures [42,43].
Our results show that the intensity of the droughts in the study site was not very high in the late Yuan and late Ming Dynasties. However, these droughts may result in significant agricultural losses due to the fragile environment and low productivity. In the late Yuan and late Ming Dynasties, social unrest caused by inequity and institutional factors occurred, and natural disasters such as droughts and floods may have been triggers or accelerators of the dynasty collapse [46]. For example, the peasants were still required to pay high taxes if they experienced reductions in the grain yield or crop failure, resulting in peasant uprise. Therefore, we speculated that the droughts in the late Yuan and Ming Dynasties were not the leading causes of the collapse of the dynasties but were at least triggers or accelerators. The inequitable feudal system may be the ultimate reason, and the social conflict that had accumulated for a long time in this system eventually led to an uprise; these events were exacerbated by natural disasters.
However, in general, this study only revealed the climate variability of the selected grid point or at most the SWC, although it provided some associated clues between natural disasters and historical events. The viewpoint that natural disasters induced by climate variability contributed to the collapse in addition to the institutional factors cannot be fully supported by this study because the evidence is still flimsy. However, the attempt of using these PDSI series may provide a new approach to understand the development of historical events, and the train of thought in this study may be referred to in other regions.

5.2. Relationship between Solar Activity, the Little Ice Age, and Drought

Solar activity is a primary factor driving global climate change [47,48,49]. Solar activity has a recurring cycle of about 11 years [50], and this cycle is related to the degree of drought [21,51]. Our study showed that the PDSI in the study site was strongly correlated with sunspots in some periods, e.g., a strong periodicity with cycles of 8–12 years existed during 1725–1750, 1760–1780, 1830–1840, and 1880–1960. In addition, the time series of the sunspots (Figure 5a) indicated that the number of sunspots in 1800–1825 was significantly less than that in other years. The PDSI in the study site was relatively stable in the range of −1 to 1 during this period. This result shows that solar activity was relatively weak in AD 1800–1825 and had little impact on the earth. In this period, the climate system was relatively stable due to relatively little interference, and no large-scale droughts occurred [25].
Another interesting phenomenon is that the weakening of solar activity led to the Little Ice Age. A decrease in solar activity during this time was reflected in the reduction in the number of sunspots, resulting in a drop in global temperature and the beginning of the Little Ice Age [52]. This period is known as the Sporer Minimum and Maunder Minimum of the sunspots [53,54]. During the Little Ice Age, global temperatures dropped significantly and were about 1 to 2 °C lower than those in modern times. Sunspots were scarcely observed during AD 1645–1715, and this period is referred to as the Maunder Minimum [54]. The global climate during the Maunder Minimum was relatively dry and cold, and the solar activity was at its lowest level during this period [53]. However, small droughts still occurred frequently in the study site during this period. The reason may be that the atmospheric circulation indices (e.g., ENSO and PDO) had a larger influence than the solar activity on the occurrence of droughts, which was also observed in Figure 10.

5.3. Effect of Large-Scale Atmospheric Circulations on Drought

The influence of atmospheric circulations, such as PDO and ENSO, on regional drought is primarily reflected in changes in regional precipitation. The direct impact of PDO and ENSO on climate is reflected in the monsoon. The monsoon circulation from the ocean transports abundant water vapor from the sea surface to the entire continent in the summer [39]. Large-scale atmospheric circulation changes the water vapor cycle, resulting in changes in other hydrological parameters, as well as droughts and floods [6]. For example, as early as the 1870s, it was reported that both the ENSO and PDO had led to widespread drought in central and eastern Asia [45]. The frequent occurrence of ENSO in recent years and the corresponding increase in drought events in the study site on annual and seasonal scales since 2000 also confirmed the possible connection between drought and atmospheric circulation [6].
Our results showed that the ENSO played a dominant role in driving the PDSI change (38.40%). The PDSI and ENSO discontinuously had a common period of 6–32 years in the time domain, and they were strongly correlated. However, the effect of the ENSO was not as strong as that of the sunspot numbers in some periods. Complex topography and the geological environment in or around the study site, such as deep canyons and hills, karst geomorphology, and a low-lying and enclosed basin, significantly affected the regional climate. In this case, the ENSO may have had a relatively weak impact on the study site due to the geographical factors. The PDO also has an influence on summer precipitation in China, usually resulting in the incorrect prediction of ENSO on the precipitation in China [27]. However, the effect of PDO on climate change was not as strong as that of the ENSO, and there was only one resonance period in the time domain. Further, solar activity can also affect large-scale atmospheric circulations, such as the PDO and ENSO; therefore, the monsoon can also be affected by solar activities [55]. Accordingly, the influential factors and mechanisms were very complicated [56]. Although the ENSO was dominant in driving the PDSI change during AD 1700–1996, the PDO and solar activity had greater influences than the ENSO in some periods. In other words, the influences of the influential factor changed over time, which was in agreement with the results in Figure 10.

6. Conclusions

In this study, we determined the trends of drought and periodicity in the study site located in the center of Southwest China (SWC) using a 700-year time series of the PDSI. We estimated the relationship between the PDSI and three influencing factors (ENSO, PDO, and sunspot number) and assessed the dynamic influence of the factors on drought. In addition, we discussed the linkage between the demise of the Yuan and Ming Dynasties and historical drought events.
The study site was a drought-prone area historically, with considerable differences in drought events in the different dynasties. It experienced non-significant drying trends in six centuries during the AD 1300–2005 period, as well as a non-significant wetting trend in the 17th century. We observed 4-, 8-, 16-, 32-, and 128-year periods, but only the 4- and 8-year periods were significant at the 95% confidence level. The 2–8-year period was the most significant period (p < 95%) and explained 9% of the total variance. The analysis of long-term drought changes based on the PDSI series may provide clues to understand the development of historical events. The PDO and sunspot numbers exhibited significant upward trends (p < 0.05), whereas the ENSO showed a non-significant downward trend. Most of the resonance periods with significant correlations between the sunspot numbers and the PDSI presented significant performance in the time-frequency variation, indicating that a strong correlation existed between the two series, and the solar activity had an influence on drought events in the study site. Although the correlation of the period between the PDSI and ENSO series in the same frequency domain was weak, the ENSO exhibited a strong interaction with the PDSI in some time periods. The PDO and PDSI had no resonance period in the low-frequency region, but there was a period of 80–130 years in the high-frequency region. In addition, the PDSI and PDO covaried in the time domain during 1320–1580, indicating a strong correlation during this period. The relative rates of influence of the ENSO, sunspot number, and PDO during AD 1700–1996 were 38.40%, 31.81, and 29.8%, respectively, but the influences of the factors changed over time.
The primary contributions of this study are two-fold. First, we constructed a systematic framework on analyzing long-term drought changes and its influential factors based on the PDSI series reconstructed by tree ring data. Second, we proposed an equation based on RF to analyze the dynamic influence of the factors on drought. Due to the relatively short time overlap between the sunspot number and ENSO data, we were unable to obtain more information on the relationship between droughts and the influencing factors.

Author Contributions

B.Y. and C.L. conceived and designed the research. B.Y. and L.K. performed data analysis and wrote the manuscript. Extensive editing and revisions to the final manuscript and conclusions were contributed by C.L., D.H. and X.C. L.K. was responsible for collecting and preliminarily analyzing the data. All authors have read and agreed to the published version of the manuscript.

Funding

The Natural Science Foundation of Guangdong Province (2022A1515010019), Water Conservancy Science and Technology Innovation Project in Guangdong Provinces (2020-29).

Institutional Review Board Statement

Not applicable.

Informed Consent Statement

Not applicable.

Data Availability Statement

Not applicable.

Conflicts of Interest

The authors declare no conflict of interest.

References

  1. Brázdil, R.; Dobrovolný, P.; Trnka, M.; Kotyza, O.; Reznickova, L.; Valasek, H.; Zahradnicek, P.; Stepanek, P. Droughts in the Czech Lands, 1090–2012 AD. Clim. Past. 2013, 9, 1985–2002. [Google Scholar] [CrossRef] [Green Version]
  2. Wang, Z.; Li, J.; Lai, C.; Wang, R.; Chen, X.; Lian, Y. Drying tendency dominating the global grain production area. Glob. Food Secur. 2018, 16, 138–149. [Google Scholar] [CrossRef]
  3. Lai, C.; Zhong, R.; Wang, Z.; Wu, X.; Chen, X.; Wang, P.; Lian, Y. Monitoring hydrological drought using long-term satellite-based precipitation data. Sci. Total Environ. 2019, 649, 1198–1208. [Google Scholar] [CrossRef] [PubMed]
  4. Sheffield, J.; Wood, E.; Roderick, M. Little change in global drought over the past 60 years. Nature 2012, 491, 435–438. [Google Scholar] [CrossRef]
  5. Wang, Z.; Li, J.; Lai, C.; Zeng, Z.; Zhong, R.; Chen, X.; Zhou, X.; Wang, M. Does drought in China show a significant decreasing trend from 1961 to 2009? Sci. Total Environ. 2017, 579, 314–324. [Google Scholar] [CrossRef]
  6. Wang, Z.; Li, J.; Lai, C.; Huang, Z.; Zhong, R.; Zeng, Z.; Chen, X. Increasing drought has been observed by SPEI_pm in Southwest China during 1962–2012. Theor. Appl. Climatol. 2018, 133, 23–38. [Google Scholar] [CrossRef]
  7. Lai, C.; Chen, X.; Zhong, R.; Wang, Z. Implication of climate variable selections on the uncertainty of reference crop evapotranspiration projections propagated from climate variables projections under climate change. Agric. Water Manag. 2021, 259, 107273. [Google Scholar] [CrossRef]
  8. Cook, B.; Smerdon, J.; Seager, R.; Coats, S. Global warming and 21st century drying. Clim. Dyn. 2014, 43, 2607–2627. [Google Scholar] [CrossRef] [Green Version]
  9. Dai, A.; Wigley, T. Global patterns of Enso-induced precipitation. Geophys. Res. Lett. 2000, 27, 1283–1286. [Google Scholar] [CrossRef] [Green Version]
  10. Trenberth, K.; Dai, A.; Schrier, G. Global warming and changes in drought. Nat. Clim. Chang. 2013, 4, 17–22. [Google Scholar] [CrossRef]
  11. Cruger, T.; von Storch, H. Construction of consistent ice core accumulation time series from large-scale meteorological data: Development and description of a regression model for one North Greenland ice core. Clim. Res. 2002, 20, 141–151. [Google Scholar] [CrossRef]
  12. Watanabe, Y.; Matsuoka, H.; Sakai, S. Comparison of stable isotope time series of stalagmite and meteorological data from West Java, Indonesia. Paleogeogr. Paleoclimatol. Paleoecol. 2010, 293, 90–97. [Google Scholar] [CrossRef]
  13. Li, J.; Wang, Z.; Lai, C.; Zhang, Z. Tree-ring-width based streamflow reconstruction based on the random forest algorithm for the source region of the Yangtze River, China. Catena 2019, 183, 104216. [Google Scholar] [CrossRef]
  14. Yang, B.; Chen, X.; He, Y.; Wang, J.; Lai, C. Reconstruction of annual runoff since CE 1557 using tree-ring chronologies in the upper Lancang-Mekong River basin. J. Hydrol. 2019, 569, 771–781. [Google Scholar] [CrossRef]
  15. Yang, B.; Lai, C.; Chen, X.; Singh, V.; Wang, J. Multi–Proxy Reconstruction of Drought Variability in China during the Past Two Millennia. Water 2022, 14, 858. [Google Scholar] [CrossRef]
  16. Cook, E.; Woodhouse, C.; Eakin, C.; Meko, D.; Stahle, D. Long-Term aridity changes in the western United States. Science 2004, 306, 1015–1018. [Google Scholar] [CrossRef] [PubMed] [Green Version]
  17. Cook, E.; Anchukaitis, K.; Buckley, B.; D’Arrigo, R.; Jacoby, G.; Wright, W. Asian monsoon failure and megadrought during the last millennium. Science 2010, 328, 486–489. [Google Scholar] [CrossRef] [Green Version]
  18. Gou, X.; Gao, L.; Deng, Y.; Chen, F.; Yang, M.; Christopher, S. An 850-year tree-ring-based reconstruction of drought history in the western Qilian Mountains of northwestern China. Int. J. Climatol. 2015, 35, 3308–3319. [Google Scholar] [CrossRef]
  19. Xu, G.; Liu, X.; Trouet, V.; Treydte, K.; Wu, G.; Chen, T.; Sun, W.; An, W.; Wang, W.; Zeng, X.; et al. Regional drought shifts (1710-2010) in East Central Asia and linkages with atmospheric circulation recorded in tree-ring O-18. Clim. Dyn. 2019, 52, 713–727. [Google Scholar] [CrossRef] [Green Version]
  20. Bi, Y.; Xu, J.; Gebrekirstos, A.; Guo, L.; Zhao, M.; Liang, E.; Yang, X. Assessing drought variability since 1650 AD from tree-rings on the Jade Dragon Snow Mountain, southwest China. Int. J. Climatol. 2015, 35, 4057–4065. [Google Scholar] [CrossRef]
  21. Xiao, M.; Zhang, Q.; Singh, V. Influences of ENSO, NAO, IOD and PDO on seasonal precipitation regimes in the Yangtze River basin, China. Int. J. Climatol. 2014, 35, 3556–3567. [Google Scholar] [CrossRef]
  22. Li, J.; Wang, Z.; Lai, C. Severe drought events inducing large decrease of net primary productivity in mainland China during 1982–2015. Sci. Total Environ. 2020, 703, 135541. [Google Scholar] [CrossRef] [PubMed]
  23. Jiang, Z.; Lian, Y.; Qin, X. Rocky desertification in Southwest China: Impacts, causes, and restoration. Earth Sci. Rev. 2014, 132, 1–12. [Google Scholar] [CrossRef]
  24. Dai, A.; Trenberth, K.E.; Qian, T. A global data set of palmer drought severity index for 1870–2002: Relationship with soil moisture and effects of surface warming. J. Hydrometeorol. 2009, 5, 1117–1130. [Google Scholar] [CrossRef]
  25. Roy, I.; Asikainen, T.; Maliniemi, V.; Mursula, K. Comparing the influence of sunspot activity and geomagnetic activity on winter surface climate. J. Atmos. Sol. Terr. Phys. 2016, 149, 167–179. [Google Scholar] [CrossRef]
  26. Mauas, P.; Buccino, A.; Flamenco, E. Long-term solar activity influences on South American rivers. J. Atmos. Sol. Terr. Phys. 2010, 73, 377–382. [Google Scholar] [CrossRef] [Green Version]
  27. Ouyang, R.; Liu, W.; Fu, G.; Liu, C.; Hu, L.; Wang, H. Linkages between ENSO/PDO signals and precipitation, streamflow in China during the last 100 years. Hydrol. Earth Syst. Sci. 2014, 18, 3651–3661. [Google Scholar] [CrossRef] [Green Version]
  28. Zhang, Q.; Xu, C.; Jiang, T.; Wu, Y. Possible influence of ENSO on annual maximum streamflow of the Yangtze River, China. J. Hydrol. 2007, 333, 265–274. [Google Scholar] [CrossRef]
  29. Gao, P.; Violette, G.; Temme, A.; Ritsema, C.; Mu, X.; Wang, F. A wavelet analysis of the relationship between Loess Plateau erosion and sunspots. Geoderma 2014, 213, 453–459. [Google Scholar] [CrossRef]
  30. Torrence, C.; Compo, G. A Practical Guide to Wavelet Analysis. Bull. Amer. Meteorol. Soc. 1998, 79, 61–78. [Google Scholar] [CrossRef] [Green Version]
  31. Fan, H.; He, D. Temperature and Precipitation Variability and Its Effects on Streamflow in the Upstream Regions of the Lancang–Mekong and Nu–Salween Rivers. J. Hydrometeorol. 2015, 16, 2248–2263. [Google Scholar] [CrossRef]
  32. Wang, Z.; Lai, C.; Chen, X.; Yang, B.; Zhao, S.; Bai, X. Flood hazard risk assessment model based on random forest. J. Hydrol. 2015, 527, 1130–1141. [Google Scholar] [CrossRef]
  33. Liu, Y.; Zhao, H. Variable importance-weighted random forests. Quant. Biol. 2017, 5, 338–351. [Google Scholar] [CrossRef] [PubMed] [Green Version]
  34. Breiman, L. Random Forests. Mach. Learn. 2001, 45, 5–32. [Google Scholar] [CrossRef] [Green Version]
  35. Rodriguez-Galiano, V.; Chica-Olmo, M.; Chica-Rivas, M. Predictive modelling of gold potential with the integration of multisource information based on random forest: A case study on the Rodalquilar area, Southern Spain. Int. J. Geogr. Inf. Sci. 2014, 28, 1336–1354. [Google Scholar] [CrossRef]
  36. Larras, F.; Coulaud, R.; Gautreau, E.; Billoir, E.; Rosebery, J.; Usseglio-Polatera, P. Assessing anthropogenic pressures on streams: A random forest approach based on benthic diatom communities. Sci. Total Environ. 2017, 586, 1101–1112. [Google Scholar] [CrossRef]
  37. Behnamian, A.; Millard, K.; Banks, S.; White, L.; Richardson, M.; Pasher, J. A Systematic Approach for Variable Selection with Random Forests: Achieving Stable Variable Importance Values. IEEE Geosci. Remote Sens. Lett. 2017, 14, 1988–1992. [Google Scholar] [CrossRef] [Green Version]
  38. Menze, B.; Kelm, B.; Masuch, R.; Himmelreich, U.; Bachert, P.; Petrich, W.; Hamprecht, F. A comparison of random forest and its Gini importance with standard chemometric methods for the feature selection and classification of spectral data. BMC Bioinform. 2009, 10, 213. [Google Scholar] [CrossRef] [Green Version]
  39. Chen, H.; Tang, G.; Ai, W.; Xu, L.; Cai, K. Use of random forest in FTIR analysis of LDL cholesterol and tri-glycerides for hyperlipidemia. Biotechnol. Prog. 2015, 31, 1693–1702. [Google Scholar] [CrossRef]
  40. Boulesteix, A.; Bender, A.; Bermejo, J.; Strobl, C. Random forest Gini importance favours SNPs with large minor allele frequency: Impact, sources and recommendations. Brief. Bioinform. 2012, 13, 292–304. [Google Scholar] [CrossRef] [Green Version]
  41. Fang, T.; Lahdelma, R. Optimization of combined heat and power production with heat storage based on sliding time window method. Appl. Energy. 2016, 162, 723–732. [Google Scholar] [CrossRef]
  42. Zheng, J.; Xiao, L.; Fang, X.; Hao, Z.; Ge, Q.; Li, B. How climate change impacted the collapse of the Ming dynasty. Clim. Chang. 2014, 127, 169–182. [Google Scholar] [CrossRef]
  43. Liu, Q.; Li, G.; Kong, D.; Huang, B.; Wang, Y. Climate, disasters, wars and the collapse of the Ming Dynasty. Environ. Earth Sci. 2018, 77, 44. [Google Scholar] [CrossRef]
  44. Cui, J.; Chang, H.; Burr, G.; Zhao, X.; Jiang, B. Climatic change and the rise of the Manchu from Northeast China during AD 1600-1650. Clim. Chang. 2019, 156, 405–423. [Google Scholar] [CrossRef]
  45. Fang, K.; Gou, X.; Chen, F.; Davi, N.; Liu, C. Spatiotemporal drought variability for central and eastern Asia over the past seven centuries derived from tree-ring based reconstructions. Quat. Int. 2013, 283, 107–116. [Google Scholar] [CrossRef]
  46. Wu, L.; Zhou, H.; Zhang, S.; Li, L.; Zhang, M.; Ji, C. Spatial-temporal variations of natural disasters during the Ming & Qing Dynasties (1368-1912AD) in Chaohu Lake Basin, East China. Quat. Int. 2018, 467, 242–250. [Google Scholar]
  47. De Jager, C. Solar Forcing of Climate. 1: Solar Variability. Space Sci. Rev. 2005, 120, 197–241. [Google Scholar] [CrossRef]
  48. Wasko, C.; Sharma, A. Effect of solar variability on atmospheric moisture storage. Geophys. Res. Lett. 2009, 36, L03703. [Google Scholar] [CrossRef]
  49. Stauning, P. Solar activity–climate relations: A different approach. J. Atmos. Sol. Terr. Phys. 2011, 73, 1999–2012. [Google Scholar] [CrossRef]
  50. Gonçalves, I.; Echer, E.; Frigo, E. Sunspot cycle prediction using Warped Gaussian process regression. Adv. Space Res. 2020, 65, 677–683. [Google Scholar] [CrossRef]
  51. Roy, I. Climate Variability and Sunspot Activity-Analysis of the Solar Influence on Climate; Springer International Publishing: New York, NY, USA, 2018; ISBN 978-3-319-77107-6. [Google Scholar]
  52. Gebbie, G.; Huybers, P. The Little Ice Age and 20th-century deep Pacific cooling. Science 2019, 363, 70–74. [Google Scholar] [CrossRef] [Green Version]
  53. Lamb, H. The cold Little Ice Age climate of about 1550 to 1800. Clim. Present Past Futur. 1972, 1972, 107. [Google Scholar]
  54. Eddy, J. The Maunder Minimum. Science 1976, 192, 1189–1202. [Google Scholar] [CrossRef] [PubMed] [Green Version]
  55. Yu, X.; Wang, Y.; Yu, S.; Kang, Z. Synchronous droughts and floods in the Southern Chinese Loess Plateau since 1646 CE in phase with decadal solar activities. Glob. Planet. Chang. 2019, 83, 103033. [Google Scholar] [CrossRef]
  56. Li, J.; Xie, S.; Cook, E.; Morales, M.; Christie, D.; Johnson, N.; Chen, F.; D’Arrigo, R.; Fowler, A.; Gou, X.; et al. El Niño modulations over the past seven centuries. Nat. Clim. Chang. 2013, 3, 822–826. [Google Scholar] [CrossRef] [Green Version]
Figure 1. The location of the study site (grid set).
Atmosphere 13 01151 g001
Figure 2. The result of the MK test of the PDSI series from 1300 to 2005. UF represents the statistics of forward sequence, UB the statistics of backward sequence. ± U (0.05) is the significance level α = 0.05.
Atmosphere 13 01151 g002
Figure 3. Variation trend of the PDSI time series from 1300 to 2005 in the study site.
Atmosphere 13 01151 g003
Figure 4. Periodicity analysis results of the PDSI series. (a) Wavelet power spectrum; the thick black contour in the left part designates the 95% confidence level against red noise, and the cone of the influence (COI) where the edge effects might distort the picture is shown as a lighter shade; the imaginary line in the right part designates the 95% confidence level for a red noise null hypothesis; if the peak value of full line exceeds the imaginary line in the power map, then the corresponding period is significant. (b) Singular spectrum amplitude of PDSI series variations for a period of 2–8 years, identified as the most significant oscillation mode (9% of the total variance associated with this waveform).
Atmosphere 13 01151 g004
Figure 5. Trend analysis of the three influential factors. The variation trends of (a) sunspot number, (b) ENSO, and (c) PDO.
Atmosphere 13 01151 g005
Figure 6. Results of (a) the change of sunspots number, (b) wavelet power spectrum of sunspots number series; value in the black solid line represents the 95% confidence level.
Atmosphere 13 01151 g006
Figure 7. Results of cross wavelet (XWT) and the wavelet coherence (WTC) between the PDSI and sunspot number. (a) XWT analysis for investigating the sunspot number affecting PDSI variability; the thick black contour designates the 95% confidence level against yellow noise; the relative phase relationship is shown as arrows (with in-phase pointing right, anti-phase pointing left). (b) WTC finds regions in time frequency space where PDSI and sunspots covary; phase arrows indicate the relative phase relationship between the series.
Atmosphere 13 01151 g007
Figure 8. Results of (a) wavelet power spectrum, (b) cross wavelet (XWT), and (c) wavelet coherence (WTC) between the PDSI and ENSO series. Graphic illustration can refer to Figure 6 and Figure 7.
Atmosphere 13 01151 g008
Figure 9. Results of (a) wavelet power spectrum, (b) cross wavelet (XWT), and (c) wavelet coherence (WTC) between the PDSI and PDO series. Graphic illustration can refer to Figure 6 and Figure 7.
Atmosphere 13 01151 g009
Figure 10. Temporal dynamic of the relative influential rate of each factor to drought change, (a) for 30-year time window, (b) for 50-year and (c) for 100-year.
Atmosphere 13 01151 g010
Table 1. Classification of the PDSI values.
PDSI ValueCategoryPDSICategory
Above 4.00Extreme wetBelow −4.00Extreme drought
3.00 to 3.99Severe wet−3.00 to −3.99Severe drought
2.00 to 2.99Moderate wet−2.00 to −2.99Moderate drought
1.00 to 1.99Mild wet−1.00 to −1.99Mild drought
0.50 to 0.99Incipient wet−0.50 to −0.99Incipient drought
0.49 to −0.49Normal
Table 2. Drought statistics of different dynasties in the study area during the AD 1300–2005 period.
DynastyPeriod (AD)/yearsExtreme DroughtSevere DroughtModerate DroughtMid DroughtIncipient DroughtTotalAnnual Average Frequency
Yuan1300–1368/
69
0031012250.36
Ming1368–1644/
277
10113146890.32
Qing1644–1911/
268
0072844790.29
The Republic of China1912–1949/
38
00075120.32
The People’s Republic of China1949–2005/
57
01998270.47
All1300–2005/
706
0031012250.36
Note: the PDSI series is between 1300 and 2005. Standard of classification can refer to Table 1. The unit of annual average frequency is (times per year).
Publisher’s Note: MDPI stays neutral with regard to jurisdictional claims in published maps and institutional affiliations.

