1. Introduction
Permafrost formation and degradation are prominent processes of peatland development in the circumboreal region that affect ecosystem patterns and evolution [
1,
2,
3]. The patchy mosaic of permafrost-affected boreal ecosystems is influenced by interactions among climate, topography, hydrology, soils, vegetation, and fire [
4], leading to the concept that boreal permafrost is ecosystem-driven [
5]. Peatlands in the northern lowlands are particularly susceptible to permafrost formation because of the thick organic accumulations that affect soil thermal regimes, while being particularly vulnerable to fire that can have large impacts on surface organics, thermal properties, and permafrost stability [
6,
7,
8]. To better understand the effects of climate warming and fire on permafrost stability, it is essential then to better understand the effects that ecosystem processes have on permafrost aggradation and degradation.
Permafrost-affected peatlands are widespread in the circumpolar region [
2,
3,
9], including Alaska [
10,
11], Canada [
12,
13], Russia [
14], and China [
15], with sporadic occurrences in Scandinavia [
9]. In Alaska, they are abundant in lowlands with poor drainage and silty soils associated with abandoned floodplains, retransported deposits, drained lake basins, and loess-covered flats [
16,
17]. While there is tremendous variety in the pattern and composition of peat-accumulating mires, peatlands can most simply be differentiated into precipitation-driven, ombrotrophic bogs and groundwater-fed, minerotrophic fens [
9,
12].
Biophysical factors that affect the dynamics of ecosystem-driven permafrost interact over time and space to create a highly patchy mosaic of permafrost with differing histories of aggradation and degradation [
18,
19,
20]. Permafrost is sensitive to both long-term climatic trends [
21] and to extreme seasonal events [
22,
23,
24]. The flat topography of lowland landscapes affects soil saturation, the impoundment of surface water, and groundwater movement [
24,
25]. Differences in surficial deposits and soil texture affect hydraulic conductivity and groundwater movement, thermal properties, ground ice development, and nutrient availability that affects plant growth [
16,
26]. Vegetation affects albedo and radiation reaching the ground surface, snow interception, wind speed and convective heat transfer, organic matter accumulation, and fire susceptibility [
27]. Fires, human disturbance, and geomorphic processes can alter the surface boundary conditions and affect soil heat flux [
7,
28]. Thus, interactions among these ecological components greatly affect the resilience and vulnerability of permafrost to climate change and fire [
29].
Fires are frequent and widespread in boreal ecosystems, greatly affecting the vegetation structure, surface boundary conditions, soil thermal regimes, and permafrost stability [
30,
31,
32]. Fires, depending on severity, lead to immediate and long-term shifts in vegetation composition [
33,
34,
35]. Destruction of the tree and shrub canopy and charring of the ground surface immediately affects soil temperatures and energy balance, and under certain conditions, lowering of the permafrost table [
36]. The effects of fire on permafrost are highly variable, however, depending on severity, soil conditions, and season, allowing permafrost to quickly recover after fire under favorable conditions or quickly thaw and collapse under the most vulnerable situations [
8,
37,
38].
Changes in boreal peatlands and permafrost potentially have large effects on global systems [
39]. Globally, peatlands provide significant sequestration of carbon from the atmosphere [
40], and the northern hemisphere holds a significant stock of soil carbon [
41,
42]. Permafrost thaw has large effects on the soil carbon balance and trace gas emissions that potentially provide a strong permafrost carbon feedback to the global climate system [
43,
44,
45,
46,
47]. Permafrost limits water infiltration and facilitates super-permafrost groundwater flow, and the thawing of permafrost reorganizes the surface and subsurface pathways of water flow, as well as increases biogeochemical exports [
48,
49]. Ground collapse after thaw in ice-rich terrain quickly converts forests to thermokarst bogs, fens, and lakes that greatly alter the surface energy balance with regional implications [
50,
51,
52]. Finally, habitat shifts from permafrost thaw affect resident mammal and migrant bird populations as forage and trophic structures are radically altered, creating both winners and losers [
53,
54].
Long-term monitoring of permafrost and ecological conditions in burned and unburned boreal peatlands was undertaken to assess the biophysical factors affecting the patterns and rates of permafrost formation and degradation. The specific objectives of the study were to: (1) identify long-term climate trends and extreme weather seasons; (2) photo-interpret historical rates of ecotype and permafrost change using a time series of airborne and satellite imagery from 1954 to 2019; (3) survey microtopography, thaw depths, and water levels along burned and unburned transects from 2005 to 2021 in order to assess permafrost formation and degradation; (4) sample permafrost soils to describe soil morphology and cryostructures, and to quantify moisture, bulk density, and organic carbon contents; (5) compare soil thermal regimes across ecotypes; (6) monitor vegetation responses to fire and thermokarst; (7) develop a conceptual model of ecological trajectories that contribute to the evolution of peatland landscapes; and (8) evaluate the roles of climate, ecological succession, fire, and the legacy of geomorphic processes on permafrost formation and degradation.
2. Methods
2.1. Sampling Design
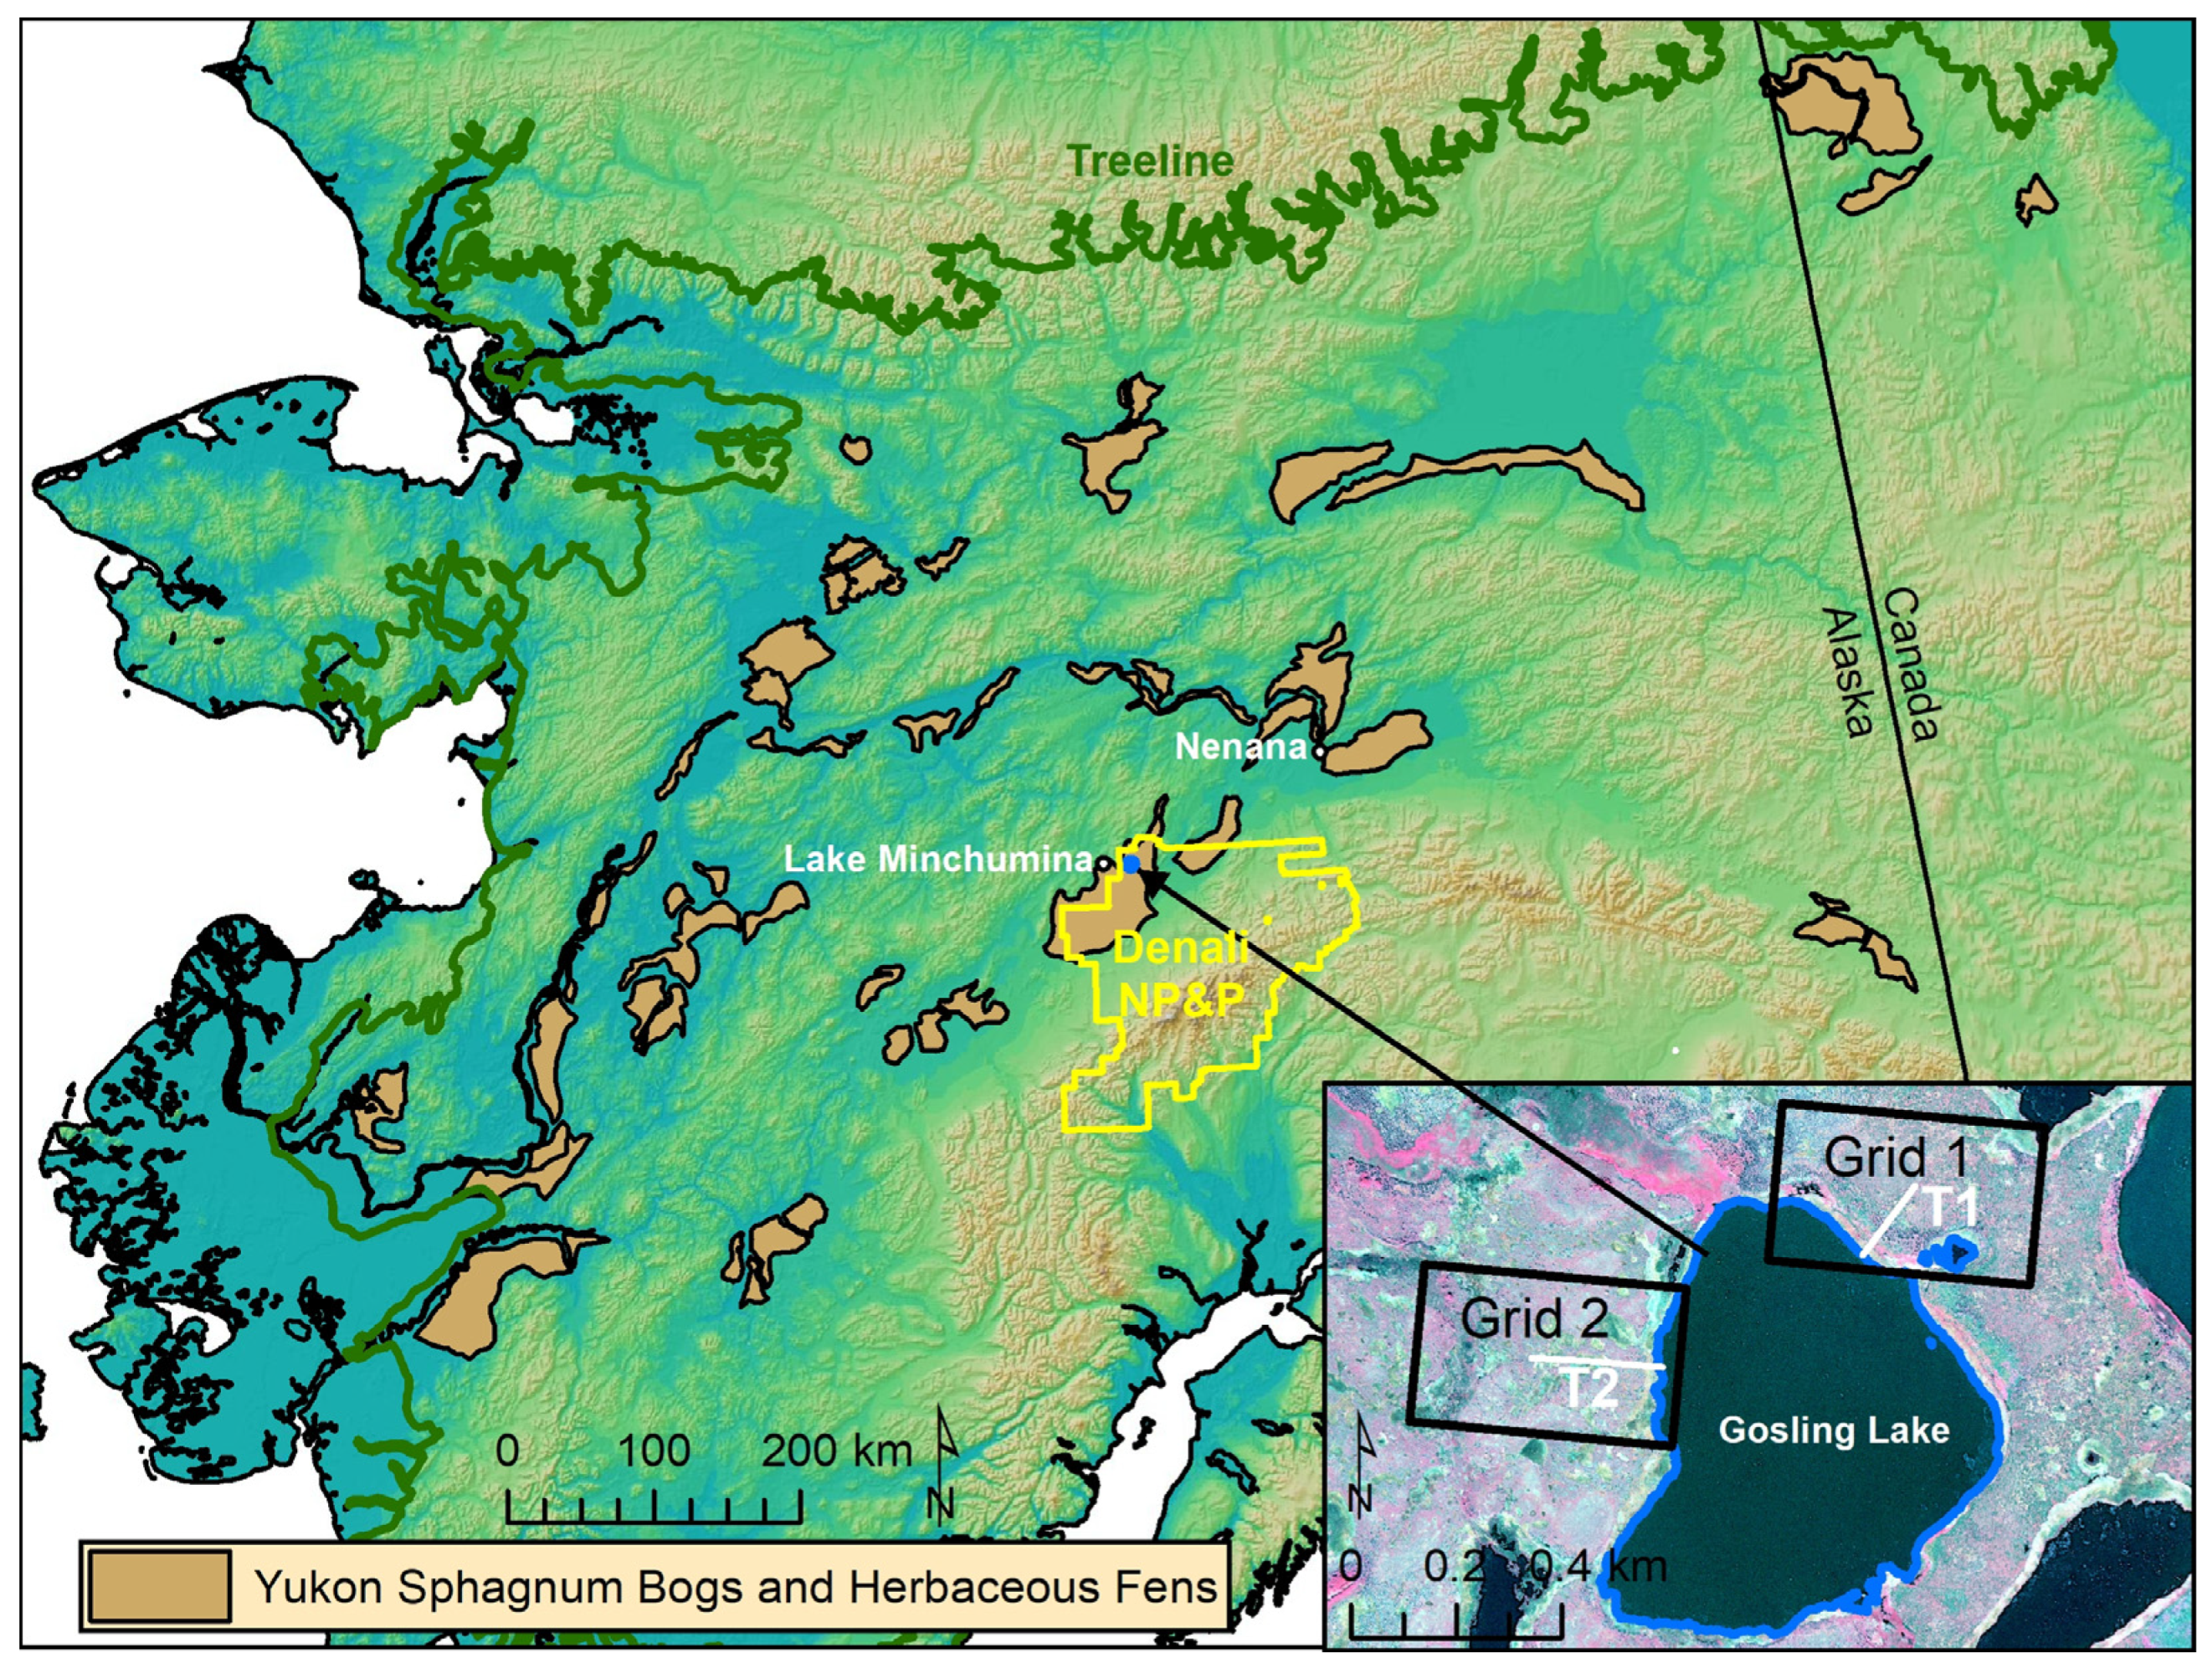
The sampling was designed to quantify the effects of climate, ecological succession, and fire on permafrost formation and degradation within permafrost-affected peatlands in central Alaska. Permafrost-affected peatlands are abundant in large river basin landscapes in the Alaska–Yukon region [
11]. We targeted one of these large peatlands situated in northwestern Denali National Park and Preserve (DNPP) for study (
Figure 1). Within this study area, we established two remote sensing grids and two transects to compare an unburned area (Grid 1) and an area burned in 1990 (Grid 2). After plot establishment, a portion of Grid 1 burned in 2015. The remote sensing grids were used to detect changes in ecotypes across a time series of imagery from 1954 to 2019. The burned and unburned areas, as well as the pre- and post-fire imagery allowed us to do a before–after/control–impact analysis, but without replication. The transects also were paired in burned and unburned areas to allow treatment comparisons in microtopography, hydrology, soils, and vegetation (
Figure S1). Permanent monitoring plots were established in independent patches along each transect to represent the range of early to late successional vegetation.
A statewide ecological land classification [
55] was used for the classification of ecotypes and post-stratification for analysis. We identified five classes with permafrost: lowland black spruce bog woodland (shortened to black spruce bog, BWN), lowland wet spruce–birch woodland (spruce–birch bog, BWM), lowland dwarf birch–tussock bog low scrub (tussock bog, BT), lowland bog post-fire scrub (post-fire scrub bog, BSP), and lowland bog barrens (barren bog, BP). Seven thermokarst ecotypes included: lowland sedge-Sphagnum bog meadow (sedge-Sphagnum bog meadow, BM, young bog), lowland ericaceous bog dwarf scrub (ericaceous bog, BD, intermediate-age bog), lowland dwarf birch-ericaceous bog low scrub (dwarf birch bog, BLO, old bog), lacustrine sedge fen meadow (sedge meadow fen, BMS), lowland sweetgale fen low scrub (fen scrub, FS), lowland buckbean fen meadow (buckbean meadow fen shore, FMB), and lacustrine pond lily shallow lake (lake, LK). All classes were detected during the remote sensing analysis, but only seven during field surveys (see
Figure S2 for examples).
2.2. Climate Trends and Extreme Seasons
Long-term air temperature and precipitation records were compiled from the National Oceanic and Atmospheric Administration (
https://www.ncdc.noaa.gov/cdo-web/datatools/records (accessed on 12 May 2022) for nearby climate stations at Minchumina COOP (1945–2021), Lake Minchumina RAWS (1992–2021), and Nenana (1917–2021). We calculated mean air temperatures, thawing (TDD) and freezing (FDD) degree-day sums (sum of mean daily temperatures, base 0 °C), cumulative precipitation, and mean snow depth by year, hydrologic year (October–September) and by season for winter (NDJFM), spring (A), summer (MJJAS), and fall (O). To fill data gaps and complete the climate record for Minchumina, we correlated seasonal means/sums between Minchumina and Nenana, and estimated missing data for 10 summers and 6 winters for Minchumina based on the regression equations for the relationships (
Figure S3).
To estimate long-term climatic trends, we regressed TDD, FDD, summer cumulative precipitation, and winter mean snow depths against years (
Figure S4). To identify extreme weather seasons, we plotted summer mean air temperature against cumulative precipitation and winter mean air temperature against mean snow depth. To establish a trend between warm–wet summers (favorable to permafrost degradation) and cold–snowless winters (favorable to permafrost formation), we plotted the axis of the trend through the mean and ±1 SD of the climate parameters. We defined extreme events to be the seasons with the highest/lowest 3–4 values at the ends of the axis, thus roughly approximating the 5th and 95th percentile thresholds (
n = 74 years).
2.3. Remote Sensing of Landscape Change and Topography
A time series of high-resolution imagery was compiled to quantify changes from 1954 to 2019. Airphotos were from 16 September 1954 (B&W, 0.3 m pixel resolution), 27 July 1979 (color-infrared, 1.0 m), and 22 August 2010 (color, 0.2 m). Satellite images were from 5 July 2008 (GoogleEarth) and 28 June 2014 (ESRI world image mosaic). On 21 May 2019, low-altitude airphotos (color, 0.06 m) were acquired with a 3 DR Solo unmanned aerial system in conjunction with 14 ground control points established with a differential global positioning system (DGPS). The airphotos were processed using Agisoft software to create orthomosaics and digital elevation models (DEM) for each grid. The earlier imagery was geo-rectified to the 2019 orthomosaic.
Ecotypes were photo-interpreted and classified at 240 points (25 m spacing) within two 300 × 500 m sampling grids (
Figure S5) for four periods (1954, 1979, 2010, and 2019) creating three change intervals between periods. Each point was also attributed with a fire year for intervals within which a fire occurred, and a change driver when ecotypes changed between periods, including lake erosion (LE), thermokarst (TK), fire (F), vegetation paludification late (VPL), permafrost aggrading (PC), and none (N). Because the 1954 airphotos were of poor quality, we biased toward no change unless there were distinctive changes in vegetation structure or water coverage.
To analyze change, we summarized the frequency of ecotypes by period and change drivers by interval and used the frequencies as an estimate of percent cover (n = 240). For permafrost change, we assigned permafrost presence/absence to each ecotype based on field observations and summed frequencies of presence/absence. For thermokarst change, we assigned a thermokarst type (lake and bog fen) to each ecotype and summarized frequencies for each thermokarst type. We then compared changes in ecotype, permafrost, and thermokarst type between Grid 1 (unburned and high plateau) and Grid 2 (1990 burn, low plateau). To analyze differences in topography, we attributed each grid point with elevations from the DEM and tabulated mean elevations by ecotype.
2.4. Field Surveys of Microtopography, Soils, Thermal Regimes, and Vegetation
Field data collection included transect-level data on microtopography, and plot-level data on site environmental conditions, soil stratigraphy, soil physical and chemical properties, soil thermal regimes, and vegetation composition. Microtopography, water levels, and thaw depths were measured every 1 m along two permanent 250 m transects (T1-unburned and T2-burned) that were established in 2005. Ground and water surface elevations were measured with an auto-level relative to permanent benchmarks (T1-100-BM, T1-154-BM, T2-000-BM, T2-168-BM, and 4 ft rebar in permafrost or below frost level in bogs) established with DGPS. Thaw depths below ground surface were measured with a metal probe every 1 m, except where depths exceeded 3 m, then probing was done every 5 m. We also recorded the bottom of thin frost layers that we were able to punch through with the probe and the maximum probing depth in totally unfrozen soils.
Site descriptions included information on observers, location, plot type, topography, geomorphology, soils, hydrology, and vegetation using an ecological land classification approach [
56]. Photographs of vegetation and soil cores were taken at each site. Data were reviewed after fieldwork for consistency and completeness, and data summarizing soil and vegetation characteristics were added to the site-level data.
Soil stratigraphy was described from 10 permafrost sites (4 cores and 2 exposures with cores in 2005, 4 cores in 2014) and 10 unfrozen bogs (5 in 2005 and 5 in 2014). In unfrozen surface soils, we extracted 30 cm diameter shallow (40–60 cm) soil plugs with a shovel, and deeper soils with a 7 cm diam. coring tub. For frozen soils, we used a SIPRE corer (7.5 cm diam.) and cored to 2–3 m depths. At the exposures we cleaned slumped material to expose the frozen surface and cored from the base of the exposures. Soil stratigraphy was described according to Natural Resources Conservation Service field sampling methods. Cryostructures were described according to [
20]. Peat types were differentiated by macrostructure, color, and dominant plant macrofossils identifiable in the field with a hand lens. Soil samples were obtained every ~20 cm with additional samples taken from thin, distinctive horizons, and dimensions were measured to determine sample volume. In the field, determinations were made for wet weights, and soil pH and electrical conductivity were measured in thawed liquids or a saturated paste with a portable meter calibrated daily. In the lab, 115 samples were dried at ~60 °C until at a constant weight and weighed for calculating bulk density, gravimetric, and volumetric moisture. A subset of 87 samples was sent to the Colorado State Soil Laboratory for analysis of total nitrogen and carbon using a Leco TCN analyzer. Organic carbon was assumed to be equal to total carbon because samples were acidic. Nine samples were analyzed for C
14 age by the NSF-Arizona AMS Laboratory and we reported the dates in conventional radiocarbon years before present (ybp).
Soil temperatures were monitored in surface (−5 cm) and deep soils (100 cm) during 2005–2008 and 2014–2021. During the first interval, soil temperatures were measured at a black spruce bog (T1-040) and a post-fire scrub bog (T2-060). During the second interval, dataloggers were added to a black spruce bog (T1-100), a post-fire scrub bog (T2-187), and two ericaceous bogs (T1-059 and T2-100). Air (T1-100) and water (T2-250, lake bottom) temperature sites were also added in 2014. Temperatures were recorded every 2 h using single-channel dataloggers (Onset Corp., Hobo U22) for air/water and two-channel dataloggers (Hobo U23) for soil. For quality control, the temperature records were examined for consistency with phase change temperatures (−0.2 °C) during fall freezeback and a calibration adjustment (typically < 0.2 °C) was added if needed. For analysis, mean daily temperatures were plotted, and temperatures were summarized by year, hydrologic year (October–September, complete winter), and by thawing and freezing degree-days (base 0 °C). Thermal offsets were calculated to represent the differences between the mean annual air and surface temperatures and mean annual surface and deep temperatures [
57].
Vegetation cover was sampled in one-time reconnaissance plots and permanent monitoring plots representing the range of ecotypes along the two transects. For the 21 reconnaissance plots, vegetation cover was visually estimated for each species in either 2005 or 2021. In 2014, 11 plots were permanently staked and sampled using the point sampling method used for long-term vegetation monitoring in DNPP [
58]. For point sampling, we used a vertically oriented pin to determine species occurrence at 73 points per plot and noted “hits” for the first occurrence of a species within 10 height increments (0, 10, 20, 30, 50, 100, 150, 200, 300, and 400 cm), with each hit representing 1.4% cover. For points with no live plant, we recorded litter (dead plant parts) if present, or bare soil if litter was absent. Vascular taxa were identified to species level when possible, while non-vascular plants were identified to species only for dominant taxa. Voucher specimens were collected for problematic species; vascular taxa were identified by the authors, while bryophyte and lichen specimens were identified by specialists. To provide compatibility between methods, we differentiated the first hit of a species at each point (single) when there where multiple hits (multi) of that species. During data management, we assigned final taxonomic determinations for each species, and aggregated problematic (inconsistent identification) and trace species into higher taxonomic or growth form levels. We then summed the cover (1.4%) for each species (single hits only) by plot to establish total percent cover of each species. In a second step, we tabulated mean species cover by ecotype.
2.5. Landscape Evolution
We developed a conceptual model of ecological transitions that affected the landscape evolution of peatlands in our study region based on contemporary vegetation–soil relationships from plot surveys, changes in ecotypes evident in historical imagery, and paleo-ecological indicators evident in the soil profiles. In the model, we simplified and reduced the number of ecotypes by combining scrub and forests (broadleaf, mixed, and needleleaf) in riverine (fluvial affected) and lowland (non-fluvial, organic-rich) landscapes because they were difficult to distinguish in soil profiles. We also grouped bogs (Sphagnum-dominated and precipitation-driven) and fens (herbaceous, groundwater-driven) because they are subject to similar thermokarst processes.
To establish ecological transitions in the soil stratigraphic record we assigned ecotypes to characteristic soil morphologies and diagnostic plant macrofossils. Riverine ecotypes evident in the soil stratigraphy included river barrens (interbedded sands and silts), riverine scrub/forest (laminarly interbedded silts and organics), riverine lake (massive silty clay loam formed over fluvial sands), and riverine marsh (laminar silts and sands with vascular plants, particularly Equisetum fluviatile). Lowland ecotypes differentiated in the profiles included black spruce bog (dark brown woody peat, charcoal, and Sphagnum fuscum), sedge-Sphagnum meadow bog (yellow, wiry stems of Sphagnum riparum, sedge roots and stem bases), and ericaceous scrub bog (orange-brown Sphagnum peat with small shrub stems). We plotted radiocarbon dates associated with these ecotypes. Finally, we used the dates and ecological transitions to summarize the variety of ecological trajectories that occurred over time and provide a generalized concept of the evolution of the peatland landscape.
3. Results
3.1. Climate Trends and Extreme Seasons
Long-term air temperature and precipitation records compiled for nearby Lake Minchumina from 1945 to 2021, with gap filling using data correlated from Nenana, were used to assess climate trends and identify extreme weather seasons that were favorable to permafrost formation and degradation (
Figure 2). Summer (MJJAS) mean air temperatures (MAT) varied only 4.4 °C (9.4–13.8 °C), while cumulative precipitation varied eight-fold (53–403 mm). Extremely warm–wet summers favorable to permafrost degradation occurred in 1997, 2007, and 2016 (wettest summer on record). For decadal trends, summer MATs were frequently below average in the 1940s through the 1960s, and were frequently above average since the 1990s. Winter (NDJFM by hydrologic year) MATs varied by 9.7 °C (−21.4 to −11.7 °C), while mean snow depths varied eight-fold (14–105 cm). Extreme cold–snowless winters favorable to permafrost formation occurred in 1976, 1951, and 1961, and marginally in 2007. Oddly, winters with both high temperatures and deep snow depths did not occur. For decadal trends, winter MATs were frequently below average in 1940s through the 1960s and frequently above average since 2000. Regression lines showed little relationship (R
2 = 0.04) between summer MAT and cumulative precipitation, and only a weak relationship (R
2 = 0.16) between winter MAT and snow depth. We attribute recent permafrost formation (described below) first observed on 2008 imagery to the cold–snowless winter of 2007.
Thawing degree-days (TDD) at nearby Nenana showed a weak (R
2 = 0.08) increasing trend (10.0%) from 1741 TDD in 1918 to 1916 TDD in 2018 (
Figure S4). Lake Minchumina also had a weakly (R
2 = 0.13) increasing trend (13.6%) from 1684 TDD in 1946 to 1913 TDD in 2018. Freezing degree-days at Nenana had a weak (R
2 = 0.12) warming (−15.4%, less being warmer) trend from −3176 FDD in 1918 to −2686 FDD in 2018, whereas, Lake Minchumina had a moderately strong (R
2 = 0.31) warming (−23.7%) trend from −3105 FDD in 1946 to −2369 FDD in 2018. Overall, winter temperatures are increasing faster that summer temperatures.
3.2. Remote Sensing of Landscape Change and Topography
Based on photo-interpretation (240 points/grid) of a time series of imagery from 1950 to 2019, we found large changes in ecotypes in response to fire and small changes related to permafrost formation and degradation at both Grid 1, which was dominated by a relatively high permafrost plateau that was partially burned in 2015, and at Grid 2, which was dominated by a low permafrost plateau burned in 1990 (
Figure 3). On the high plateau at Grid 1, where a fire partially burned through the area in 2015, the extent of black spruce bogs decreased from 66.3% in 2010 to 17.9% in 2019, while post-fire scrub bogs increased from 0% to 52.9% (
Figure 4). Similarly, on the low plateau, where fire burned nearly all the area in 1990, black spruce bogs decreased from 52.9% to 1.3% and tussock bogs decreased from 7.5% to 0%, from 1990 to 2010, respectively, while post-fire scrub bogs increased from 0% to 50.0%.
Thermokarst-related ecotypes were differentiated between bogs (Sphagnum dominated and acidic), fens (herbaceous dominated and circumneutral), and lakes. During 1954–2019, the areal extent of bog meadows increased from 3.3% to 7.9% and ericaceous bogs from 13.8% to 17.1% due to thermokarst expansion, while dwarf birch bog showed no change. Sedge shore fens (young fen along shores) decreased from 11.7% to 9.6% due to shoreline erosion, while scrub shore fens increased from 2.1% to 4.6% due to paludification and succession.
Permafrost extent (based on ecotype/permafrost relationships) during 1954–2019, decreased 3.8% in absolute area (75.0 to 71.3%) at Grid 1 and 8.8% (62.9 to 54.2%) at Grid 2. When comparing thermokarst types, at Grid 1 bogs (all bogs combined) increased 2.9% (7.1 to 10.0%), while no change was evident in fens and lakes. At Grid 2, bogs increased 7.9% (19.6 to 27.5%), while fens increased 0.4% (13.8 to 14.2%) and lakes increased 0.4% (6.3 to 6.7%). Overall, bogs showed a steady increase due to continuing lateral permafrost degradation, while fens and lakes showed very small fluctuations, mostly related to small lateral increase in lateral permafrost degradation in collapse scar fens and small transitions between lake and shore fens from erosion and paludification. We attribute the higher abundance of thermokarst bogs and fens at Grid 2 to the prevalence underlying fluvial sand deposits that have lower ice contents for thawing and facilitate groundwater movement.
Fires, which we considered to be low to moderately severe (dead trees with mostly intact branches, <1 cm soil char) appeared to have little effect on permafrost extent. At Grid 1, the degradation rate (increase in unfrozen area) was 0.4%/decade during 1954–2010 before the 2015 fire and 0.9%/decade during 2010–2019, which included 4 years post-fire. At Grid 2, the degradation rate was 1.3%/decade during 1954–1979 before the 1990 fire and 0.9%/decade during 2010–2019. While there appeared to be a small effect of slightly increased degradation after the 2015 fire at Grid 1, the fire effect is complicated by the climate warming trend with 2016 and 2019 having extremely warm–wet summers.
The DEMs derived from the UAV photo missions in 2019 showed substantial difference in elevations between the high plateau at Grid 1 and the low plateau at Grid 1, and large topographic effects of thermokarst (
Figure 5). Mean elevations were 1.32 m higher for unburned black spruce bogs at Grid 1 (200.76 m) compared to Grid 2 (199.44 m), an ecotype that occurs on the highest portions of the landscape (
Figure 6). Even bog meadows were higher on the high plateau, with an average difference of 0.63 m between Grid 1 (199.49 m) and Grid 2 (198.86 m). The maximum difference in mean elevations among ecotypes was 2.83 m from the lake bottom (197.93 m) to the black spruce bog at Grid 1 (200.76). We attribute this difference to the combined effects of heave from ground ice aggradation, peat accumulation, and underlying variations in the fluvial deposits.
3.3. Microtopography, Thaw Depths, and Hydrology
Surface microtopography, hydrology, and thaw depths were measured along Transect 1 in Grid 1 and Transect 2 in Grid 2 in 2005, 2014, 2019, and 2021 (
Figure 7). Mean elevations of ecotypes along the transects were comparable to those obtained from the DEM, for example, the mean elevation of black spruce bog was 200.84 m from transect surveying and 200.76 m from the DEM, despite substantial difference in how the “surface” was detected. When comparing differences in elevations among years, there was little change among years for most of the transects. Notable changes were measured at a few locations due to lateral thaw collapse along the bog margins and in post-fire scrub adjacent to the lake along both transects due to thaw settlement. For the portion of the Transect 1 that was burned in 2015 and changed from spruce–birch bog to herb meadow, mean elevations decreased 0.27 m from 2014 to 2021, but this portion of the transect near the lake was already settling before the fire. We recorded heave of up to 40 cm from 2005 to 2014 associated with permafrost aggradation along Transect 2 (90 and 122 m distance), and the subsequent collapse in 2021 of some of the new developed mounds (
Figure 7 and
Figure S7).
Thaw depths were highly variable along the transects ranging from 24 cm to 489 cm, with substantial portions of the transects having unfrozen soils within the maximum depth of probing (350–480 cm). When comparing thaw depths among ecotypes assigned along the transect, mean thaw depths in 2005 ranged from 49.9 cm in black spruce bogs to 340.56 in ericaceous bogs (only locations where permafrost was detected). The 1990 fire had a moderate, long-lasting effect on thaw depths, based on the 12–34 cm difference in mean depths between black spruce bogs and post-fire scrub bogs across the three periods. When comparing changes from 2005 to 2021, all ecotypes showed a substantial increase in thaw depths, ranging from an increase of 49.9 to 70.1 cm in black spruce bog to an increase of 340.6 to 457.1 in ericaceous bog. For bog meadow, thaw depths increased beyond the limit of probing.
Based on microtopography and thaw depths, we assigned five stages of permafrost degradation and recovery along Transects 1 and 2 (
Figure 8). Along Transect 1, on the high plateau in 2005, 69% of the transect had undegraded permafrost (UD, includes recovery old that can only be identified through stratigraphic analysis), followed by 17% for degradation complete (DC, no frost at depth indicating deep talik or open talik), 10% for degradation progressive (DP, with shallow talik), and 4% for degradation initial (DI, with increased thaw depths but lacking a talik). In contrast, Transect 2 on the low plateau was dominated by DC (48%), and had an intermediate amount of UD (33%) and lesser abundance of DP (15%) and DI (4%). When comparing changes from 2005 to 2021, at T1 there was a notable increase in DI from 4% to 14% due to the 2015 fire, with an accompanying decrease in UD from 69% to 58%. At T2, UD decreased sharply from 33% to 18%, while DP fluctuated between 9% and 21% in part due to the inconsistent depth of deep probing. The increase in DI along both transects, however, occurred near the lake, indicating the strong lateral thermal effects of the lake. Supporting this, we detected a thawed niche below the permafrost shelf at both transects by deep probing at an angle. Additionally notable was the development of a recent thin permafrost formation (RI) that was first measured in 2014 (9%).
The degradation stages were closely related to ecotypes. Ericaceous bog was associated with DC (53% of transect observations) and DP (49%), while the young sedge-Sphagnum bogs were associated with DP (85%) and DI (15%). Black spruce bog was associated with UD (98%) and DI (2%), while post-fire low scrub had only UD (100%). Spruce–birch bog was associated with UD (57%), DI (40%), and DP (3%), indicating that the ecotype may be dependent on the deeper thaw depths and better drainage. The herb meadow that developed after the 2015 burn on Transect 1 had mostly DI (78%), with lesser amounts of UD (15%) and DP 7%).
Timing of the initial recovery and degradation of the newly developed permafrost mounds (small palsas) were evident from both field observations and remote sensing. Repeat photography along T2 showed that the mounds were absent in 2005, expanded from 2014 to 2019, and one mound disappeared by 2021 (
Figure S7). Satellite imagery and airphotos, with a wider view and slightly different time intervals, revealed that the six mounds near Transect 2 were initiated in 2008, reached their largest extent in 2010 (816 m
2), and then decreased 62% by 2021 (
Figure 9). The transect probing through the mounds in 2014 showed permafrost at depths of 0.4–1.8 m (
Figure 7) and the DEM showed mounds were elevated 40–60 cm above the ericaceous bog surface. Based on these observations, we conclude that the mounds first developed in 2008 in response to the unusually cold and snowless winter in 2007.
3.4. Soils
Soil sampling at 10 permafrost and 10 unfrozen sites formed the basis for comparing differences in soil stratigraphy and physical and chemical properties, among ecotypes and landscapes (high and low plateaus). We compared differences in soil materials, cryostructures, post-thermokarst peat accumulation, and vertical distributions of moisture, dry density, and organic carbon (OC) density. Examples of stratigraphic profiles illustrating vertical distribution of soil materials and cryostructures, as well as volumetric moisture contents and radiocarbon ages, show the consistently thick overlying peat layers, but also high variability in underlying mineral soils and cryostructures (
Figure 10).
Soil textures as described in the field (e.g., very fine sandy loam + mucky peat) were aggregated into eight main groups to simplify comparison in soil materials among ecotypes (
Figure 11). The deepest cores (up to 424 cm) were obtained in black spruce bogs, and all of the cores in permafrost-affected ecotypes (black spruce bog, post-fire scrub, and barren bog) extended into the underlying fluvial interbedded silts and sands. In contrast, coring in the unfrozen sites in ericaceous bog and sedge-Sphagnum bog was shallow and did not extend down to the mineral soils. Overall, the soil profiles and mean thickness of the various soil materials show soil development is highly variable across the landscape with little correspondence even among nearby profiles, indicating each core (patch) has a unique formative history.
Mean cumulative thickness of organics (peat, mucky peat, muck, and diatomaceous) on the permafrost plateaus ranged from 148 cm in post-fire scrub to 194 cm in black spruce bog (
Figure 11). Unfortunately, cores from sedge-Sphagnum and ericaceous bogs were too shallow to capture the total thickness of surficial organics and differences in underlying soil materials.
Soil materials were highly variable among bog ecotypes. Black spruce bogs were notable in having higher amounts of mucky peat and silt (mostly silty clay loam) associated with the high plateau. The most sand was found in post-fire scrub and barren bogs associated with the low plateau. Diatomaceous organics associated with limnic environments were highly variable among ecotypes.
Cryostructures were also highly variable among permafrost-affected black spruce bogs, post-fire scrub bogs, and barren bogs with new permafrost (
Figure 11). Black spruce bogs on the high plateau with deep cores (3 deeper than 3 m) were dominated by organic matrix, braided and layered (belts) cryostructures, with lesser amounts of ataxitic, lenticular, and pore cryostructures. Post-fire scrub bogs (2–3 m cores) on the low plateau were dominated by organic matrix cryostructures in the peats and lenticular and pore cryostructures associated with the underlying silts and sands. The newly formed permafrost in the barren bogs (2 cores, ~2 m deep) was dominated by organic matrix and braided cryostructures. We attribute the higher prevalence of ataxitic, braided, and layered cryostructures in black spruce bogs to the downward refreezing of permafrost into fine-grained limnic diatomaceous silt and lacustrine silt clay loam, resulting in substantial heave in the high permafrost plateau.
Peat formed soon after thermokarst was distinguished by the yellow, stiffed stemmed Sphagnum peat characteristic of
Sphagnum riparum that colonizes collapsing bog margins. Of the 19 cores sampled, 16 had post-thermokarst peat near the surface, 7 had buried post-thermokarst peat, and 2 cores had two or more layers of post-thermokarst peat. The mean cumulative thickness of post-thermokarst peat varied from 34.3 cm in sedge-Sphagnum bogs (young) to 43.2 cm in ericaceous bogs (intermediate age), but was highly variable (
Figure 11). Mean thickness of buried post-thermokarst peat from earlier thermokarst episodes ranged from 8.0 cm in post-fire scrub bog on the low plateau to 27.3 cm in black spruce bog on the high plateau.
Soil moisture, dry density, and organic carbon (OC) density varied by depth and showed large differences between the high and low permafrost plateaus (
Figure 12). On the high plateau, volumetric moisture was mostly <50% in the active layer, and frequently was >80% in frozen materials down to the base of sampling, due to high ice contents in deep peat and underlying ice-rich silt and silty clay loam. On the low plateau, moisture was also mostly < 50% near the surface, highest (70–85%) at 0.5–1.5 m depth, and then trended lower to mostly <60% in the underlying silts and sands. Dry density was mostly <0.3 g/cm
3 near the surface on both plateaus due to thick surface organics, but at depth tended to be mostly 0.5–0.8 g/cm
3 on the high plateau, due to higher ice contents in diatomaceous and silty clay loam soils, and mostly 0.8–1.5 g/cm
3 on the low plateau, due to lower ice contents in the sandy soils. OC density (dry density × carbon content) tended to be higher throughout the profile in the high plateau compared to the low plateau, mostly due to thicker peat layers and the presence of silt clay loam at depth. Mean total OC stores in the top 3 m for the 5 cores that extended to at least that depth were 189 kg/m
2 (range 166 to 204 kg/m
2).
When comparing differences among soil materials grouped by texture and cryostructure combinations, soils had a large effect on volumetric moisture, density, and organic carbon density (
Figure 12). Mean moisture contents varied nearly two-fold from sand with pore ice (47%) to diatomaceous silt with ataxitic cryostructures (86%). Mean dry density varied ten-fold from unfrozen, poorly decomposed peat (0.15 g/cm
3) to sand with pore ice (1.29 g/cm
3). Organic carbon density varied ten-fold from sand with lenticular cryostructures (0.02 g/cm
3) to highly decomposed muck with organic matrix ice (0.23 g/cm
3), and was highly variable within groups due to combined variations in texture, dry density, and OC contents with soil materials. When comparing OC contents among just soil textures (basis for lab determinations), OC was lowest in sand (2.0%), relatively low in silt (8.9%) and silt-rich organics (8.9%), intermediate in organic-rich silt (13.7%) and diatomaceous silt (15.3%), and highest in peat (38.2%), moderately decomposed mucky peat (36.9), and muck (38.6%).
3.5. Soil Thermal Regimes
Surface conditions related to snow, vegetation, and soil had large effects on soil thermal regimes in four ecotypes (
Figure 13). Mean annual air temperatures (MAAT) at Gosling Lake (−1.2 °C) were similar to those at nearby Lake Minchumina (−1.8 °C), allowing us to substitute the climate record at Lake Minchumina for missing data at Gosling Lake. Mean annual surface (−5 cm) temperatures (MAST) were slightly warmer in post-fire scrub (2.4 °C) than in black spruce bogs (1.6 °C), indicating a modest effect from fire. MAST was intermediate in ericaceous bogs (4.8 °C) and highest at the lake bottom (7.1 °C), indicating an effect of water saturation and impoundment. Mean annual deep (−1 m) temperatures (MADT) were lowest in black spruce bogs (−0.5 °C) and post-fire scrub bogs (−0.2 °C) associated with permafrost soils, and highest in unfrozen ericaceous bogs (1.9 °C). Due to the warmer soil temperatures, nearly all bogs were expanding laterally into the surrounding permafrost. Mean daily temperatures by ecotype are provided in
Figure S8.
When comparing summer and winter seasons, mean thawing degree-day sums (base 0 °C) at the soil surface (−5 cm depth) were similarly low for black spruce bogs (1476) and post-fire scrub bogs (1497), intermediate for ericaceous bogs (1995), and much higher for the lake bottom (4130) (
Figure S9). Mean freezing degree-days were coldest for black spruce bogs (777), intermediate for post-fire scrub bogs (573), and warmest for ericaceous bogs (270), while the lake bottom (0) did not freeze. In deep soils (−1 m), mean thawing degree-days were lowest at one post-fire scrub bog (96) where thaw depths exceeded the depth of the sensor, and highest in ericaceous bogs (685). Mean freezing degree-days were similar in black spruce bogs (137) and one post-fire scrub site (69) where thaw depths were less than the sensor depth.
Thermal offsets are useful for examining the effects of surface conditions and subsurface soil properties (
Figure 13). Mean surface thermal offsets (MAST-MAAT) showed surface temperatures were much warmer than air temperatures, with a large range across ecotypes. Mean offsets were lowest for black spruce bogs (2.8 °C), slightly higher for post-fire scrub bogs (3.4 °C), intermediate for ericaceous bogs (5.4 °C), and highest for the lake bottom (7.9 °C). Mean deep thermal offsets (MADT-MAST) showed deep temperatures were much colder than surface temperatures, but with less range. Mean offsets were lowest for black spruce bogs (−2.3 °C), intermediate for post-fire scrub bogs (−2.7 °C), and highest for ericaceous bogs (−2.9 °C). Together, the data reveal that there is a strong effect of vegetation canopy, snow, and soil saturation in controlling surface temperatures, with coolest temperatures associated with a tree canopy (shading and snow interception) and relatively dry mosses (lower thermal conductivity) in black spruce bogs and the warmest temperatures associated with sparse vascular cover (more radiation) and water (lower albedo) near the surface in ericaceous bogs. During winter, saturated organic soils in ericaceous bogs facilitated colder deep temperatures relative to surface temperatures, compared to better drained organic soils in black spruce.
3.6. Vegetation
Vegetation composition varied considerably among ecotypes in response to fire and thermokarst disturbances (
Table 1). Black spruce bogs on the permafrost plateaus were dominated by black spruce (
Picea mariana), ericaceous dwarf shrubs (
Rhododendron tomentosum ssp.
decumbens and
Vaccinium vitis-idaea)
, feathermoss (
Pleurozium schreberi), and Sphagnum mosses (
Sphagnum fuscum and
S. girgensohnii). Post-fire scrub bogs on the permafrost plateaus were dominated by ericaceous shrubs (
Rhododendron tomentosum ssp.
decumbens and
Vaccinium vitis-idaea)
, dwarf birch (
Betula nana)
, Sphagnum mosses (
Sphagnum fuscum and
S. girgensohnii), and lichens (
Cladonia amaurocraea and
Cladonia gracilis) with only scattered
P. mariana saplings. Barren bogs disturbed by the new permafrost mounds were dominated by bare organic materials (dead Sphagnum) with low amounts of persistent low ericaceous shrubs (
Andromeda polifoli and,
Chamaedaphne calyculata)
, sedges (
Eriophorum scheuchzeri), and some newly colonizing
Picea mariana. Sedge-Sphagnum bog meadows that developed along the thermokarst margins were dominated by sedges (
Eriophorum scheuchzeri) and Sphagnum mosses (
Sphagnum balticum, Sphagnum riparium, and
Sphagnum fallax). Ericaceous shrub bogs of intermediate age toward the centers of the thermokarst bogs were dominated by ericaceous shrubs (
Rhododendron tomentosum ssp.
decumbens, Oxycoccus microcarpus, and
Andromeda polifolia)
, and Sphagnum mosses (
Sphagnum balticum, and
Sphagnum fallax). Fen meadows that developed along the lake margin were dominated by herbs (
Menyanthes trifoliata and
Comarum palustre, Equisetum fluviatile)
, sedges (
Carex diandra)
, and a different suite of Sphagnum mosses (
Sphagnum squarrosum and
Sphagnum riparium). Fen scrub along older shorelines were dominated by low shrubs (
Chamaedaphne calyculata and
Betula nana)
, herbs (
Comarum palustre), and sedges (
Carex aquatilis), although both the fen meadow and fen scrub plots had only one sample each with only partial species lists. Other ecotypes observed during the image interpretation include tussock bogs, which were dominated by
Eriophorum vaginatum, and dwarf birch scrub bogs in old bogs, which were dominated by
Betula nana and
ericaceous shrubs.
Fire caused only modest changes in species composition compared to thermokarst. Of the 33 species observed in black spruce bogs, 21 were also observed in the post-fire scrub bogs that burned in 1990. In contrast, thermokarst resulted in a large initial shift in species composition, with only 4 of the 12 species documented in sedge-Sphagnum meadow bogs overlapping with black spruce bogs. With succession over many decades, ericaceous scrub bogs shared 14 of 26 observed species with black spruce bogs. Fen meadows along the shore of the thermokarst lake were the most compositionally distinctive, sharing only 2 of 15 species in common with black spruce bogs.
3.7. Landscape Evolution
A conceptual model of ecological trajectories that affected the landscape evolution of peatlands in our study region was developed based on contemporary vegetation–soil relationships, changes in ecotypes evident on historical imagery, and paleo-ecological indicators evident in the soil profiles (
Figure 14). In the model, we simplified and reduced the number of ecotypes by combining scrub and forests (broadleaf, mixed, and needleleaf) in riverine (fluvial affected) and lowland (non-fluvial and organic-rich) landscapes because they were difficult to distinguish in soil profiles. We also grouped bogs (Sphagnum-dominated and precipitation-driven) and fens (herbaceous and groundwater-driven) because they are subject to similar thermokarst processes. Riverine ecotypes evident in the soil stratigraphy included river barrens (interbedded sands and silts), riverine scrub/forest (laminarly interbedded silts and organics), riverine lake (massive silty clay loam found over fluvial sands), and riverine marsh (laminar silts and sands with vascular roots, particularly
Equisetum fluviatile). All the lowland transitions were evident in the time series of imagery from 1950 to 2019, except for the successional transition from lowland scrub/woodland to lowland tussock bog, which can take centuries to thousands of years. In the riverine transitions, channel dynamics, sedimentation, succession, and paludification were important processes. These processes currently only operate along the margins of the regional peatlands. In the lowland transitions, thermokarst and fire become important. Lowlands can transition to riverine ecosystems through river erosion, but that was not evident in our study area.
We reconstructed the general trends in landscape evolution since the Early to Mid Holocene from the ecological trajectories evident in the soil stratigraphy. The area was occupied by riverine ecotypes around 5000 to 7500 ybp, based on C
14 dates of 5183 ± 54 ybp from woody fragments at the top of fluvial sands (T2–187, 205 cm depth), 5232 ± 47 ybp near the top layer interbedded peat and fluvial silt (T2–075, 134 cm) and 7592 ± 49 ybp from woody fragments in deep fluvial silt and sand (E1, 330 cm) (
Figure 10 and
Figure 15). In several cores, we found limnic diatomaceous silts overlying fluvial sediments with dates of 6031 ± 52 ybp from the base of diatomaceous silt over fluvial sands (E1, 145 cm), 4849 ± 46 ybp from the interface of diatomaceous silt and clean silty clay loam from a riverine lake environment (E2, 170 cm). We interpret these deposits and ecotypes to be associated with a deltaic environment fed by distributaries from the McKinley River at a time of high discharge and sediment transport during the rapid retreat of mountain glaciers. This would be similar to the modern delta forming in Lake Minchumina with active channel deposits, as well as active and inactive overbank deposits. As the floodplain was abandoned, the riverine landscape began to paludify into a peatland landscape over a transition period that lasted a couple thousand years. The oldest date at the base of the thick peat was 6722 ± 47 ybp (T1–100, 262 cm). Because boreal riverine ecotypes rarely have permafrost, we believe permafrost began to form soon thereafter. The onset of bogs, fens, and thermokarst lakes is unclear. Post-thermokarst peat with
Sphagnum riparum and
Eriophorum roots dated as old as 2473 ± 38 ybp (T1–044, 88 cm) indicating thermokarst was already occurring by that time, and at this site permafrost subsequently recovered. Material from the base of the peat highly deformed by thermokarst dated to 576 ± 38 ybp (E2, 65 cm), indicating both thermokarst and subsequent permafrost recovery happened well after that. Based on the thermokarst extent and the slow expansion rates from the remote sensing, we estimate that the ericaceous bogs mostly started several centuries ago, and the large thermokarst lake, which was basically stable during the last 50 years, is likely thousands of years old. While we assume the lakes were formed by thermokarst, some could be remnant riverine lakes with permafrost developing around them, because many lakes in the area are elongated or have complex shorelines not normally associated with round thermokarst lakes, or the complex shorelines are a legacy of the underlying fluvial deposits.
The earlier era of fluvial deposition left a legacy of spatially variable sediments that affected subsequent permafrost and ecosystem development. In the area of T2 on the low plateau, interbedded sands and silt were found at depths from 1.4 to 2.1 m. These sediments had predominantly pore and lenticular cryostructures associated with low ice content. Thus, there was little heave during permafrost aggradation. These ice-poor soils tend to thaw more quickly and allow more groundwater movement when thawed. Consequently, thermokarst bogs and fens were much more abundant on the low plateau. In contrast, the high plateau frequently had silty lacustrine deposits from depths of 0.7 to 2.8 m. Ice-rich soils with ataxtic, braided, and layered cryostructures, which tend to develop in these deposits, form epigenetic permafrost related to downward freezing after lake drainage and surface stabilization as well as quasi-syngenetic permafrost related to upward freezing caused by peat accumulation. Heave during permafrost aggradation contributed to a more elevated high plateau. Furthermore, these fine-grained, ice-rich sediments that have much higher latent heat contents than ice-poor sediments, are slower to thaw; they also restrict groundwater movement after thaw. Consequently, thermokarst features were less extensive on the high plateau near T2. Soil stratigraphy from the 19 cores, however, showed that nearly each site had its own unique set of ecological trajectories, with differing patterns of permafrost persistence, degradation, and recovery. Thus, we prefer the term of repeated, instead of “cyclic”, permafrost formation.
4. Discussion
Remote sensing, field monitoring, and soil stratigraphic analysis documented repeated permafrost formation and degradation in boreal peatlands, which indicates permafrost stability is sensitive to long-term climate trends, extreme seasonal weather, fire, and ecohydrological feedbacks. However, the dynamics are greatly constrained by the legacy of past geomorphic processes that help create a highly patchy mosaic of soil properties associated with diverse ecological trajectories. In
Figure 16, we illustrate the main drivers of permafrost formation and degradation that we documented in our study, and the complex interactions among the many biophysical factors. These are discussed below.
While climatic trends over centuries to millennia provide broad, gradual control over permafrost dynamics, variations in air temperature and precipitation across seasons are much larger than averaged millennial trends, and exert demonstrable effects on permafrost aggradation and degradation. During the Holocene in northwestern North America, millennial temperatures decreased by ~1 °C from the Holocene thermal maximum, around 5000–7000 ybp, to the Holocene minimum, around 1000 ybp, based on the multiproxy analyses [
60]. This persistent cooling provided a climate favorable to boreal permafrost formation. The range in extreme seasonal weather during summer and winter is much larger, however, and drive short-term responses. Extremely cold–dry winters (air temperature > 2 °C below the −17 °C average, snow depths below the ~40 cm average) are particularly strong drivers of rapid permafrost formation, as evidenced by our observations of permafrost plateau formation in our study area and on the Tanana Flats [
24]. Recent evidence also indicates that summer precipitation can be a strong driver of permafrost degradation [
27,
61]. In our study area, both 2016 and 2019 had extremely wet-warm summers that could account for the substantially increased thaw depths and expansion of the initial degradation stage in 2021, but our data were insufficient to establish a direct linkage.
Permafrost in boreal peatlands is highly dynamic due to extreme seasonal weather (discussed above) and strong feedbacks associated with surface water impoundment in flat low-lying terrain, vegetation recovery after fire, organic matter accumulation, groundwater movement, and thermal effects [
13,
25,
27,
62,
63]. Both small undulations in the surfaces of the permafrost plateaus and the deeper thermokarst features without outlets can impound water after snowmelt and high rainfall events, and thereby increase heat gain. We found mean annual surface temperatures to be 3.2 °C higher in ericaceous bogs and 5.5 °C higher in lakes compared to black spruce bogs, which we attribute to the effects of increased radiation reaching the surface, reduced albedo, and higher thermal conductivities. These higher temperatures lead to lateral degradation along the plateau margins, and even to the development of a thaw bulb that extends below the plateau margins, see
Figure 7 and O’Donnell et al. [
64]. In our study, vegetation in the area burned in 1990 had shrub and moss cover similar to the unburned area, leading us to conclude that permafrost thaw can be stabilized or reversed by the reestablishment of pre-fire soil thermal and vegetation conditions within 30 years after fire, similar to the conclusion of Gibson et al. [
8], although climate warming may prevent permafrost recovery. Because the entire active layer is composed of peat, fires (especially low-severity fires) have no effect on reducing organic layer thickness because more peat is simply added to the active layer during increased thaw, maintaining the insulating qualities of the surficial organics. Furthermore, saturation of peat near the surface can be reduced by the lower permafrost table, leading to lower soil thermal conductivities during summer. Finally, water movement through the underlying thawed sands and gravel in thermokarst features associated with abandoned floodplain deposits has a huge effect on the rates of lateral degradation of permafrost plateaus [
24,
25,
50,
62].
Fires can drastically affect vegetation structure and surface conditions, but its effects on permafrost stability in boreal peatlands are strongly controlled by fire severity and soil properties [
8,
32,
65]. In our study area, we detected a moderate increase in thaw depths and soil temperatures between the 1990 burn and the unburned area, and a larger increase in thaw depths 6 years after the 2015 fire, although this latter increase was confounded by proximity to the lake with its subsurface thermal effects. The burned area also had much higher extents of thermokarst bogs and fens, but we attribute this to the shallower sandy soils at depth in the burned area instead of effects from the 1990 fire, because rates of thermokarst development were similar before and after the fire in both the burned and unburned areas. Thus, we conclude the effects of fire on thermokarst development is minor compared to the effects of lateral degradation caused by the thermal effects of the bogs, fens, and lakes. In a similar study, Gibson et al. [
8] found increased soil temperatures and thaw depths, but they also found increased rates in thermokarst expansion in burned areas compared to unburned areas, which they attributed to fire effects. Under more severe fire conditions, Brown et al. [
65] documented the rapid collapse of a permafrost plateau on the Tanana Flats, but surficial peat in that location was much thinner, contributing to a larger fire effect, and the underlying silt was ice-rich. We attribute the relatively minor effects of fire in flat permafrost peatlands to lower fire severity in wet Sphagnum-dominated black spruce woodlands, the thicker saturated peats that maintain similar thermal properties after fire, reduced thaw settlement potential in thawing organics that reduce the positive water impoundment feedback, and the fairly rapid recovery of shrubs and mosses.
Ecosystem shifts in response to permafrost formation, thermokarst, fire, and succession were limited to only 11 ecological states in our simplified conceptual model based on current and paleo-ecological observations, yet there were a large number of trajectories among those states. While current patterns of thermokarst bog, fen, and lake development appear consistent across our peatland landscape, the stratigraphy analysis indicates that ecological trajectories originating from spatially heterogeneous fluvial deposits are highly diverse and site-specific. Our ecological classification, species composition, and ecotype shifts were very similar to those described for boreal Alaska [
24,
55,
62,
66] and Canada [
8,
18,
67], indicating that the ecological trajectories we observed are broadly applicable throughout the permafrost-affected peatland of the Alaska–Yukon floristic province [
11].
Surficial deposits involving a wide range of geomorphic processes have left a legacy of soil materials that greatly affect the patterns of permafrost formation and degradation, and in turn complicate projections on how permafrost will respond to climate change. Abandoned floodplains are particularly complex, because their formation can include fluvial, lacustrine, eolian, and paludification processes that create highly variable soil materials both horizontally among sites and vertically within an individual profile ([
16,
62,
66,
68]. During permafrost formation, the nature, volume, and distribution of ground ice is highly influenced by the different soil materials, and these in turn affect the patterns and rates of degradation [
20,
69]. In our study area, the prevalence of fluvial sand and gravel at 2–3 m depth was the primary reason for the more extensive and rapid thermokarst on the low plateau (Grid 2) and not the 1990 fire, whereas the less extensive degradation and lower thermokarst rates on the high plateau (Grid 1) were primarily the result of thicker peat and higher prevalence of ice-rich lacustrine deposits at depth, which have low permeability for groundwater movement.
The fate of the thick organic soils is of particular interest because of the balance of carbon gain and loss that has large implications for the global climate system. In the circumarctic and boreal regions, soils hold ~1672 Pg of carbon, much of which is in surface peat [
2]. These northern peatlands accumulated carbon throughout the Holocene both in frozen and unfrozen conditions [
10,
44], and are still accumulating rapidly in boreal peatlands in southcentral Alaska [
70]. Yet, there are major concerns regarding the decomposition of this long-sequestered carbon after permafrost thaw that causes major trace gas emissions into the atmosphere [
45,
47]. Of particular concern is the substantial amount of methane emissions from peatlands under anaerobic processes [
71,
72]. However, the balance between primary production contributing to new peat formation and the decomposition of new and old peat remains poorly resolved [
73]. Recent studies show that decomposition and trace gas emissions are highest in young thermokarst bogs, but after a decade the bogs return to a net carbon sink, although it may take centuries to return to pre-thaw levels [
74,
75]. We attribute this higher decomposition and gas emission to the mechanical disruption and fragmentation of the peat at the collapsing margin, early flush on nutrients [
26], and the prevalence of rapidly colonizing sedges that facilitate methane transport from soils [
76]. By the intermediate and old bog stages, vegetation shifted to slower growing ericaceous shrubs, Sphagnum species adapted to nutrient-poor conditions, the subsurface soils become increasingly unfavorable to decomposition because of anaerobic conditions, and the compaction of soils limited gas and nutrient diffusion. Furthermore, in our study, the intermediate to old bogs that favor carbon accumulation are roughly twice as extensive at the landscape level as the young bogs that favor carbon loss. While climate warming will accelerate permafrost thaw, creating more young bogs, the young bogs will also be transitioning to intermediate bogs within a 30–50 year period. Thus, from our perspective, permafrost-affected boreal peatlands will continue to be a net sink of carbon overall, while being a significant source of methane.
Monitoring permafrost degradation and attribution of cause and effect are greatly complicated by the interactions among the many biophysical components affecting permafrost dynamics. Even monitoring thaw depths and assessing trends are difficult because of the development of taliks, uncertainty in determining the thaw boundary in warm permafrost with substantial unfrozen water contents [
77], the frequent occurrence of groundwater that affects the partially frozen transition zone at the permafrost table, the physical difficulty of probing for the permafrost table in clayey or rocky soils, the prevalence of missing thaw depth values from encountering only unfrozen soils within probing depth, and the effects of trampling during monitoring. For many conditions in boreal permafrost, the use of “active-layer” depths is inappropriate due to the frequent occurrence of taliks. Assessing the relative effects of climate, hydrology, soils, vegetation, and fire is even more difficult because the factors are difficult to isolate in an experimental sampling design. We are continually impressed by the high spatial heterogeneity of permafrost-affected ecosystems [
55], which greatly complicates the use of chrono-sequence and comparative ecosystem analysis to determine permafrost history and carbon dynamics [
20,
64,
74,
75]


 ,
, 


