Article

Winter and Wildfire Season Optical Characterization of Black and Brown Carbon in the El Paso-Ciudad Juárez Airshed

1
Environmental Science and Engineering, The University of Texas, El Paso, TX 79968, USA
2
Department of Physics, The University of Texas, El Paso, TX 79968, USA
3
Droplet Measurement Technologies, Longmont, CO 80503, USA
*
Author to whom correspondence should be addressed.
Atmosphere 2022, 13(8), 1201; https://doi.org/10.3390/atmos13081201
Submission received: 6 July 2022 / Revised: 21 July 2022 / Accepted: 24 July 2022 / Published: 29 July 2022
(This article belongs to the Special Issue Advances in Air Pollution Meteorology)

Abstract

:
Black (EBC) and Brown (BrC) Carbon are ubiquitous constituents of atmospheric particulate matter that affect people’s health, disrupt ecosystems, and modulate local and global climate. Tracking the local deposition and sources of these aerosol particles is essential to better understanding their multidimensional environmental impact. The main goal of the current study is to measure the absorption coefficient (Babs) of particles within the Planetary Boundary Layer (PBL) of the El Paso (US)–Ciudad Juárez (Mexico) airshed and assess the contribution of black and brown carbon particles to the optical absorption. Measurements were taken during a summer, wildfire, and winter season to evaluate the optical properties of BC and non-volatile BrC. The winter season presented a variation from the background Babs in the late evening hours (3:00 PM to midnight) due to an increase in biomass burning driven by lower temperatures. The wildfire season presents the greatest variation in the Babs from the background absorption due to EBC- and BrC-rich smoke plumes arriving at this region from the US West seasonal wildfires. It was found that the international bridges’ vehicular traffic, waiting time to cross back and forth between both cities, added to other local anthropogenic activities, such as brick kiln emissions in Ciudad Juarez, have created a background of air pollution in this region. These pollutants include carbon monoxide, sulfur dioxide, nitrogen and nitric oxides, coarse and fine particulate matter dominated by BC and BrC. The absorption coefficients due to EBC and BrC of this background constitute what we have called a baseline EBC and BrC. Aided by two photoacoustic Extinctiometers (PAX), operating at 405 nm and 870 nm wavelengths, connected to a 340 °C thermal denuder to remove volatile organics, the optical properties were documented and evaluated to identify the impact of long-range transported emissions from western wildfires. The Single Scattering Albedo and the Absorption Ångstrom exponent were calculated for the winter and summer season. The Angstrom exponent showed a decrease during the wildfire events due to the aging process. The High-Resolution Rapid Refresh Smoke model, HRRR, and the Hybrid Single-Particle Lagrangian Integrated Trajectory model, HYSPLIT, were used to estimate the sources of the particles. In addition, a Vaisala Ceilometer was employed to study the vertical profile of particulate matter within the planetary boundary layer.

1. Introduction

With its complex topography, the El Paso–Ciudad Juárez region is located between the United States and Mexico with a population of 2.7 million people [1,2,3]. This region is isolated, a 500 km distance from any other major city and it is representative of a desert urban area with complex terrain. This urban area’s air quality is primarily impacted by carbonaceous particulate matter composed of black carbon (BC) and organic carbon (OC). When we discuss black carbon in the context of light absorbing material, we refer to it as BC in accordance with Petzold et al., Grange et al., and Andreae and Gelencser who are consistent with terminology that is generally accepted by the aerosol community [4,5,6]. When we refer to our measurements of BC, we label them as equivalent black carbon, (EBC) to clarify that what we are measuring is an estimate derived optical absorption [4,5]. Soot, a mixture of BC, OC and sometimes mineral dust, is the primary component of particulate matter (PM) in this region [1,7,8]; however, PM in this region can also include coarse mass particles (probably mostly consisting of soil and windblown dust), elemental carbon, organic material, PM formed by atmospheric chemical reactions of anthropogenically and biological emitted organic compounds (anthropogenic secondary organic aerosol (anthropogenic SOA) and biogenic secondary organic aerosol (biogenic SOA), ammonium nitrate and ammonium sulfate [6]. Carbonaceous aerosol particle (hereafter, just “aerosols”) emissions are produced primarily from incomplete combustion, e.g., burning biomass and fossil fuels; however, other sources such as cooking and industrial processes are also present.
The relative abundance of carbonaceous material in emissions is determined by flame temperature [6,9]. Black carbon includes elemental carbon (EC), defined as the refractory component of carbonaceous particulate matter that does not volatilize in the air at temperatures below 400 °C, EC is produced by high-temperature flames and OC, which includes BrC, volatilizes in the air at temperatures below 400 °C. Brown carbon is referred to as “brown” due to its optical properties, i.e., its color when emitted from burning material. It may include several organic compound classes such as alcohols, aromatics, di and tri organic acids, hydroxy acids, ketoacids, or sugars. Carbonaceous particles produced from gas-phase chemical reactions are known as secondary organic aerosols (SOA). The SOAs substantially affect human health, including injury to lung cells [10,11].
Carbonaceous particles are strong solar and terrestrial radiation absorbers, influencing visibility [12] and climate [13] and can lead to localized heating with subsequent increases in ambient temperatures. The absorption of UV radiation by carbonaceous aerosols may decrease the photolysis frequencies of ozone producing trace gases, thus mitigating some of the increases in air pollution associated with global warming. Conversely, reductions in BC emissions designed to mitigate climate change may lead to increases in ozone and secondary particulate concentrations. Carbonaceous particles are heterogeneous sinks for ozone [14] and catalysts for the conversion of nitrogen dioxide (NO2) to nitrous acid (HONO) [15], which may increase ozone formation during the early morning hours.
Past wildfire pollution studies in this region mainly focused on the effect of soot on human health. Vedal and Dutton (2006) studied the acute increases in PM concentrations from wildfire smoke leading to a sharp rise in daily regional mortality [14,16]. Chalbot et al. (2013) investigated the annual trends and spatiotemporal patterns of monthly 8-h maximum ozone concentrations in the El Paso region and their associations with fires from 2001 to 2010 [15,17]. However, no previous research has focused on detecting and quantifying the changes in the optical properties of particles due to BC and BrC in the El Paso–Juárez airshed, particularly during the Southwest’s wildfire season. Furthermore, understanding how the depth of the planetary boundary layer (PBL) impacts the carbonaceous particle mass concentrations is vital for better air quality forecasts [8].
The composition and size distribution of carbonaceous particles are expected to change in an aging smoke plume due to chemical reactions occurring on their surface. Particle size distributions evolve with age as a result of the combined processes of particle coagulation, evaporation and sedimentation, yet the relative magnitude of these processes is uncertain and may be highly variable and very dependent on particle concentrations as well as meteorology [18]. The data presented in this paper do not include measurements of chemical composition and therefore we have relied on HYSPLIT simulations to provide some analysis of the origin and age of the measured particulate matter. We have, however, found evidence that the BC Absorption Angstrom Exponent becomes smaller in the summer season during a wildfire event, in particular for particles with mean diameters larger than 0.12 μm, which is one indication that the BC particles that arrive in the El Paso region are aged [18].
The primary objective of this study is to document the average optical properties of aerosols in the El Paso–Ciudad Juárez region and identify those periods when long-range transported aerosols from western wildfire exceed background levels. The results from this study will help improve local forecasts of air quality with a subsequent benefit to the health of the population.

2. Methodology

2.1. Site Description and Terrain

El Paso (31°47′20″ N, 106°25′20″ W, 1145 m ASL), is located at the westernmost tip of the state of Texas, near a strategic mountain pass. To its south is the Ciudad Juarez, Chihuahua, Mexico. Together they form one of the largest cross-border urban areas between the United States and Mexico [2]. The Rio Grande River, which originates from the Colorado mountains, separates the two cities that are linked by four bridges. The cities are located in the Chihuahua desert sharing a common airshed called the El Paso-Juarez airshed that has an average of 300 sunny days per year. Summers in this region are hot and dry, with mild and dry winters. The terrain is complex with mountain ranges to the northeast (Franklin mountains) and southwest (Juarez mountains) of the central El Paso-Juarez downtown area [2]. A sizable portion of the population resides in the downtown and surrounding areas, which are located in a central valley. The downtown central valley, located at the foothills of the mountains, is lower in elevation and has more uneven surfaces than its surroundings. The majority of concrete urban infrastructures, as well as the University of Texas at El Paso (UTEP) campus, are located in this area of the city. El Paso has deeper planetary boundary layers (from 3.5 to 4 km) in the summer and shallower (around 1–1.5 km) in the winter, a major factor affecting regional pollution events [2,3].

2.2. Instrumentation

2.2.1. Photoacoustic Extinctiometer

For our data collection, we used two Photoacoustic Extinctiometers, 405 nm and 870 nm (PAX, Droplet Measurement Technologies, DMT, Longmont, CO, 80503, USA). The PAX 405 nm was used to measure the black and brown carbon Babs. The PAX 870 nm was used for the black carbon absorption coefficient detection. These PAX combine both a nephelometer and a photoacoustic spectrometer, as seen in Figure 1.
An oscillating laser beam passes through chambers of the nephelometer and photoacoustic spectrometer then exits to illuminate the laser power monitor. As the air enters the instrument it is divided into two airflows, one that enters the nephelometer chamber while the other flows through the photoacoustic chamber. In the nephelometer chamber some fraction of the scattered light is collected and focused onto a photodiode that converts the photons to an electrical signal that is digitized and recorded. In the photoacoustic chamber, particles that absorb light at the 405 or 870 nm wavelengths will increase in temperature as the absorbed energy is transformed to heat. Because the laser is oscillating, the particles heat and cool, producing a pressure wave that is detected by the microphone in this chamber. The intensity of this pressure wave is converted to a Babs through calibration. We connected both PAX instruments to a thermal denuder, a 40 cm stainless steel tube [19] that we kept at 340 °C to remove volatile organic compounds, primarily produced locally.
We followed the PAX 870 nm operation manual (DOC-0301 Revision E, DMT) when calculating the EBC mass concentration. This calculation used the EBC wavelength-corrected mass absorption coefficient of 5 m2/g f and 10 m2/g for the PAX 870 nm and 405 nm units, respectively.

2.2.2. Ceilometer

We employed a Vaisala ceilometer, model CL51, located on the campus of the University of Texas at El Paso (UTEP) to measure the vertical distribution of backscattered light by atmospheric particles and to find the top of the PBL. The ceilometer has been in constant operation since 2020 [2,20]. The CL51 has a vertical range of 15 km and temporal and spatial resolutions of 16 s and 10 m, respectively. The laser used by the ceilometer is a semi-conductor InGaAs diode laser with a 905 ± 5 nm wavelength and three µJ pulse energy frequency of 6.5 kHz. The measured signals were processed using Vaisala’s proprietary boundary layer software to calculate the PBL height (PBLH) using gradient methodology. Hourly averaged values of the PBLH were used for the analysis in this work.

2.3. Instrument Calibration and Data Processing

2.3.1. Calibration Procedure for Pax Scattering and Absorption

The calibration of the PAX is a two-step process by which the scattering coefficient is first derived followed by that of the Babs. As shown in the diagram of the PAX in Figure 1, the PAX projects a laser beam through the sample cavity where the sample air is flowing. This beam falls on a photodetector that is measuring the photon density, which is also a measure of the light extinction by the particles. By definition, the extinction coefficient is proportional to the Napierian logarithm of the decrease in light intensity, i.e., Bext~−ln[I/I0], where I0 in this case is the signal from the photodetector when no particles are present and I is the value when there are particles. The extinction coefficient is the sum of the scattering and absorption coefficients so when particles that only scatter light are introduced into the PAX chamber, extinction is equal to scattering only. The calibration procedure introduces a poly-dispersed spray of ammonium sulfate, over a range of concentrations, into the PAX while recording the voltage from the photodetector. A linear regression between −ln[I/I0] vs. the signal measured by the scattering detector produces the calibration coefficient for deriving the scattering coefficient, since ammonium sulfate is non-absorbing at all wavelengths as discussed by Washenfelder et al., 2013 and references therein [21].
To calculate the Babs, highly light absorbing particles are produced from the combustion of a commercial gas called MAP/Pro, which is primarily composed of propylene and propane. As with the ammonium sulfate, these particles are introduced over a range of concentrations and the outputs of the absorption, scattering and laser monitors are recorded. Since the BC particles also scatter light, the absorption is calculated as the difference between extinction measured by the laser monitor and light scattering from the PAX scattering detector. The calibration coefficient is subsequently derived through linear regression.

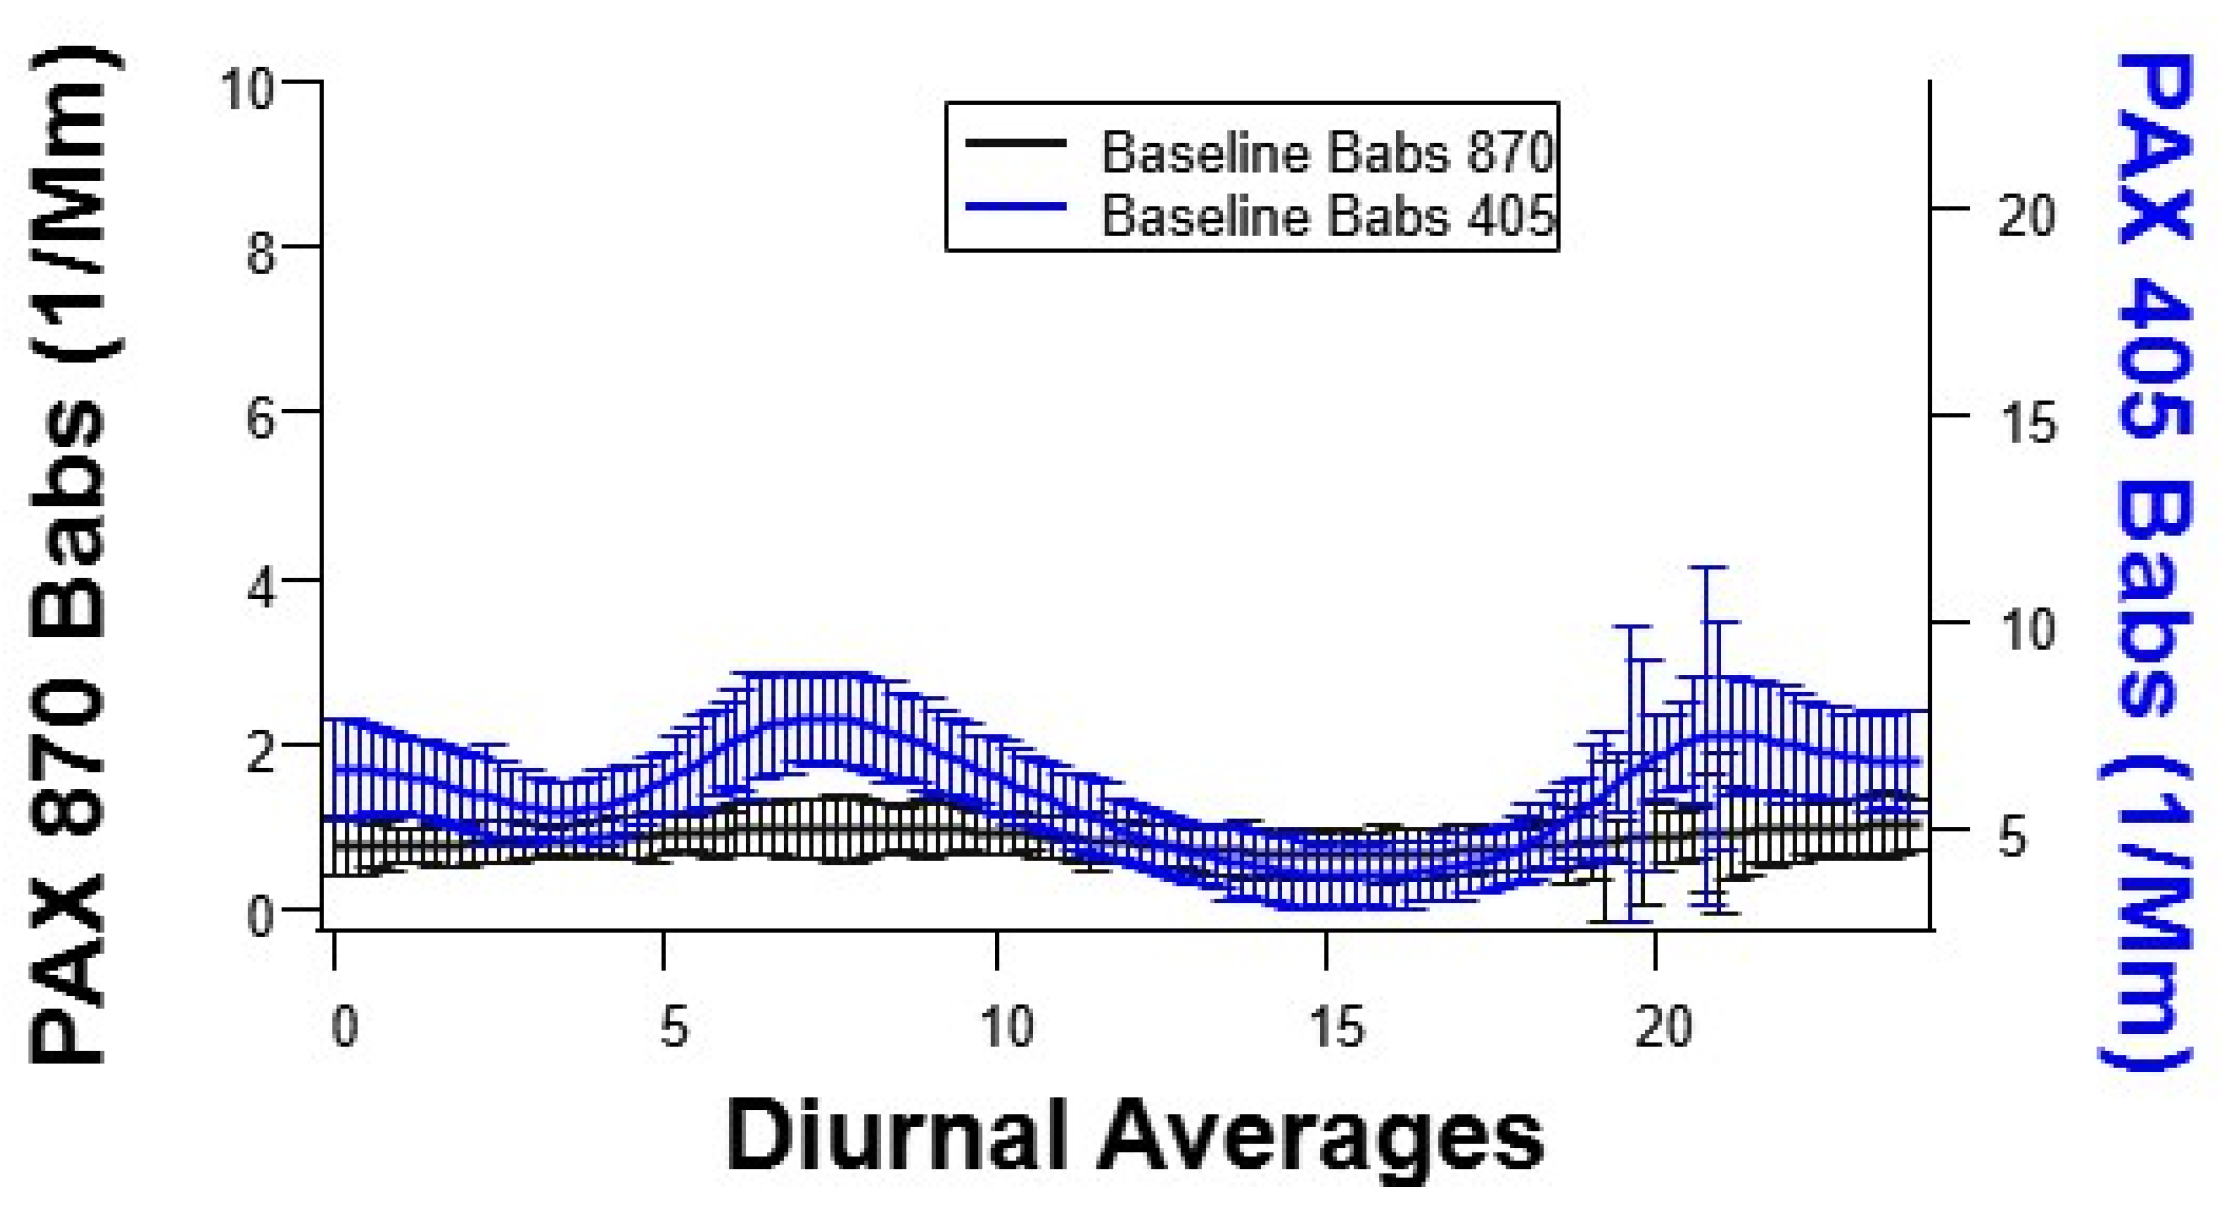
2.3.2. Absorption Coefficient Baseline, Event Days and Carbon Monoxide

We have divided our study into two seasons: the Winter Season, with data collected 1–30 January 2022, and the Wildfire Season, from 1 August through 23 September 2021.
Both seasons include a background average of the absorption coefficient, Babs, which we refer to as our environmental baseline. The two bridges that connect the two cities are a source of anthropogenic emissions due to congestion, idling traffic and long wait times at the US and Mexican border checkpoints. Besides the personal-use vehicles, there is a high density of commercial semi-trucks transporting goods to and from each country. However, no significant difference in the measured EBC or BrC has been observed between weekdays and weekends. The pollution produced by this situation has been studied in detail [22,23,24]. Besides vehicular traffic, there are several brick kilns in Ciudad Juarez. According to [25], a traditional brick kiln outputs ca. 86 kg of particulate matter during a 12-h production period and the heavy vehicular traffic and emissions from brick kilns vary little throughout the year and hence define the baseline for the Babs.
For the Summer Wildfire Season, we have designated Event Days as those days when smoke plumes produced by wildfires in the US West Coast arrived at our region. These events were identified with the help of HRRR and HYSPLIT platforms as described in greater detail, below.

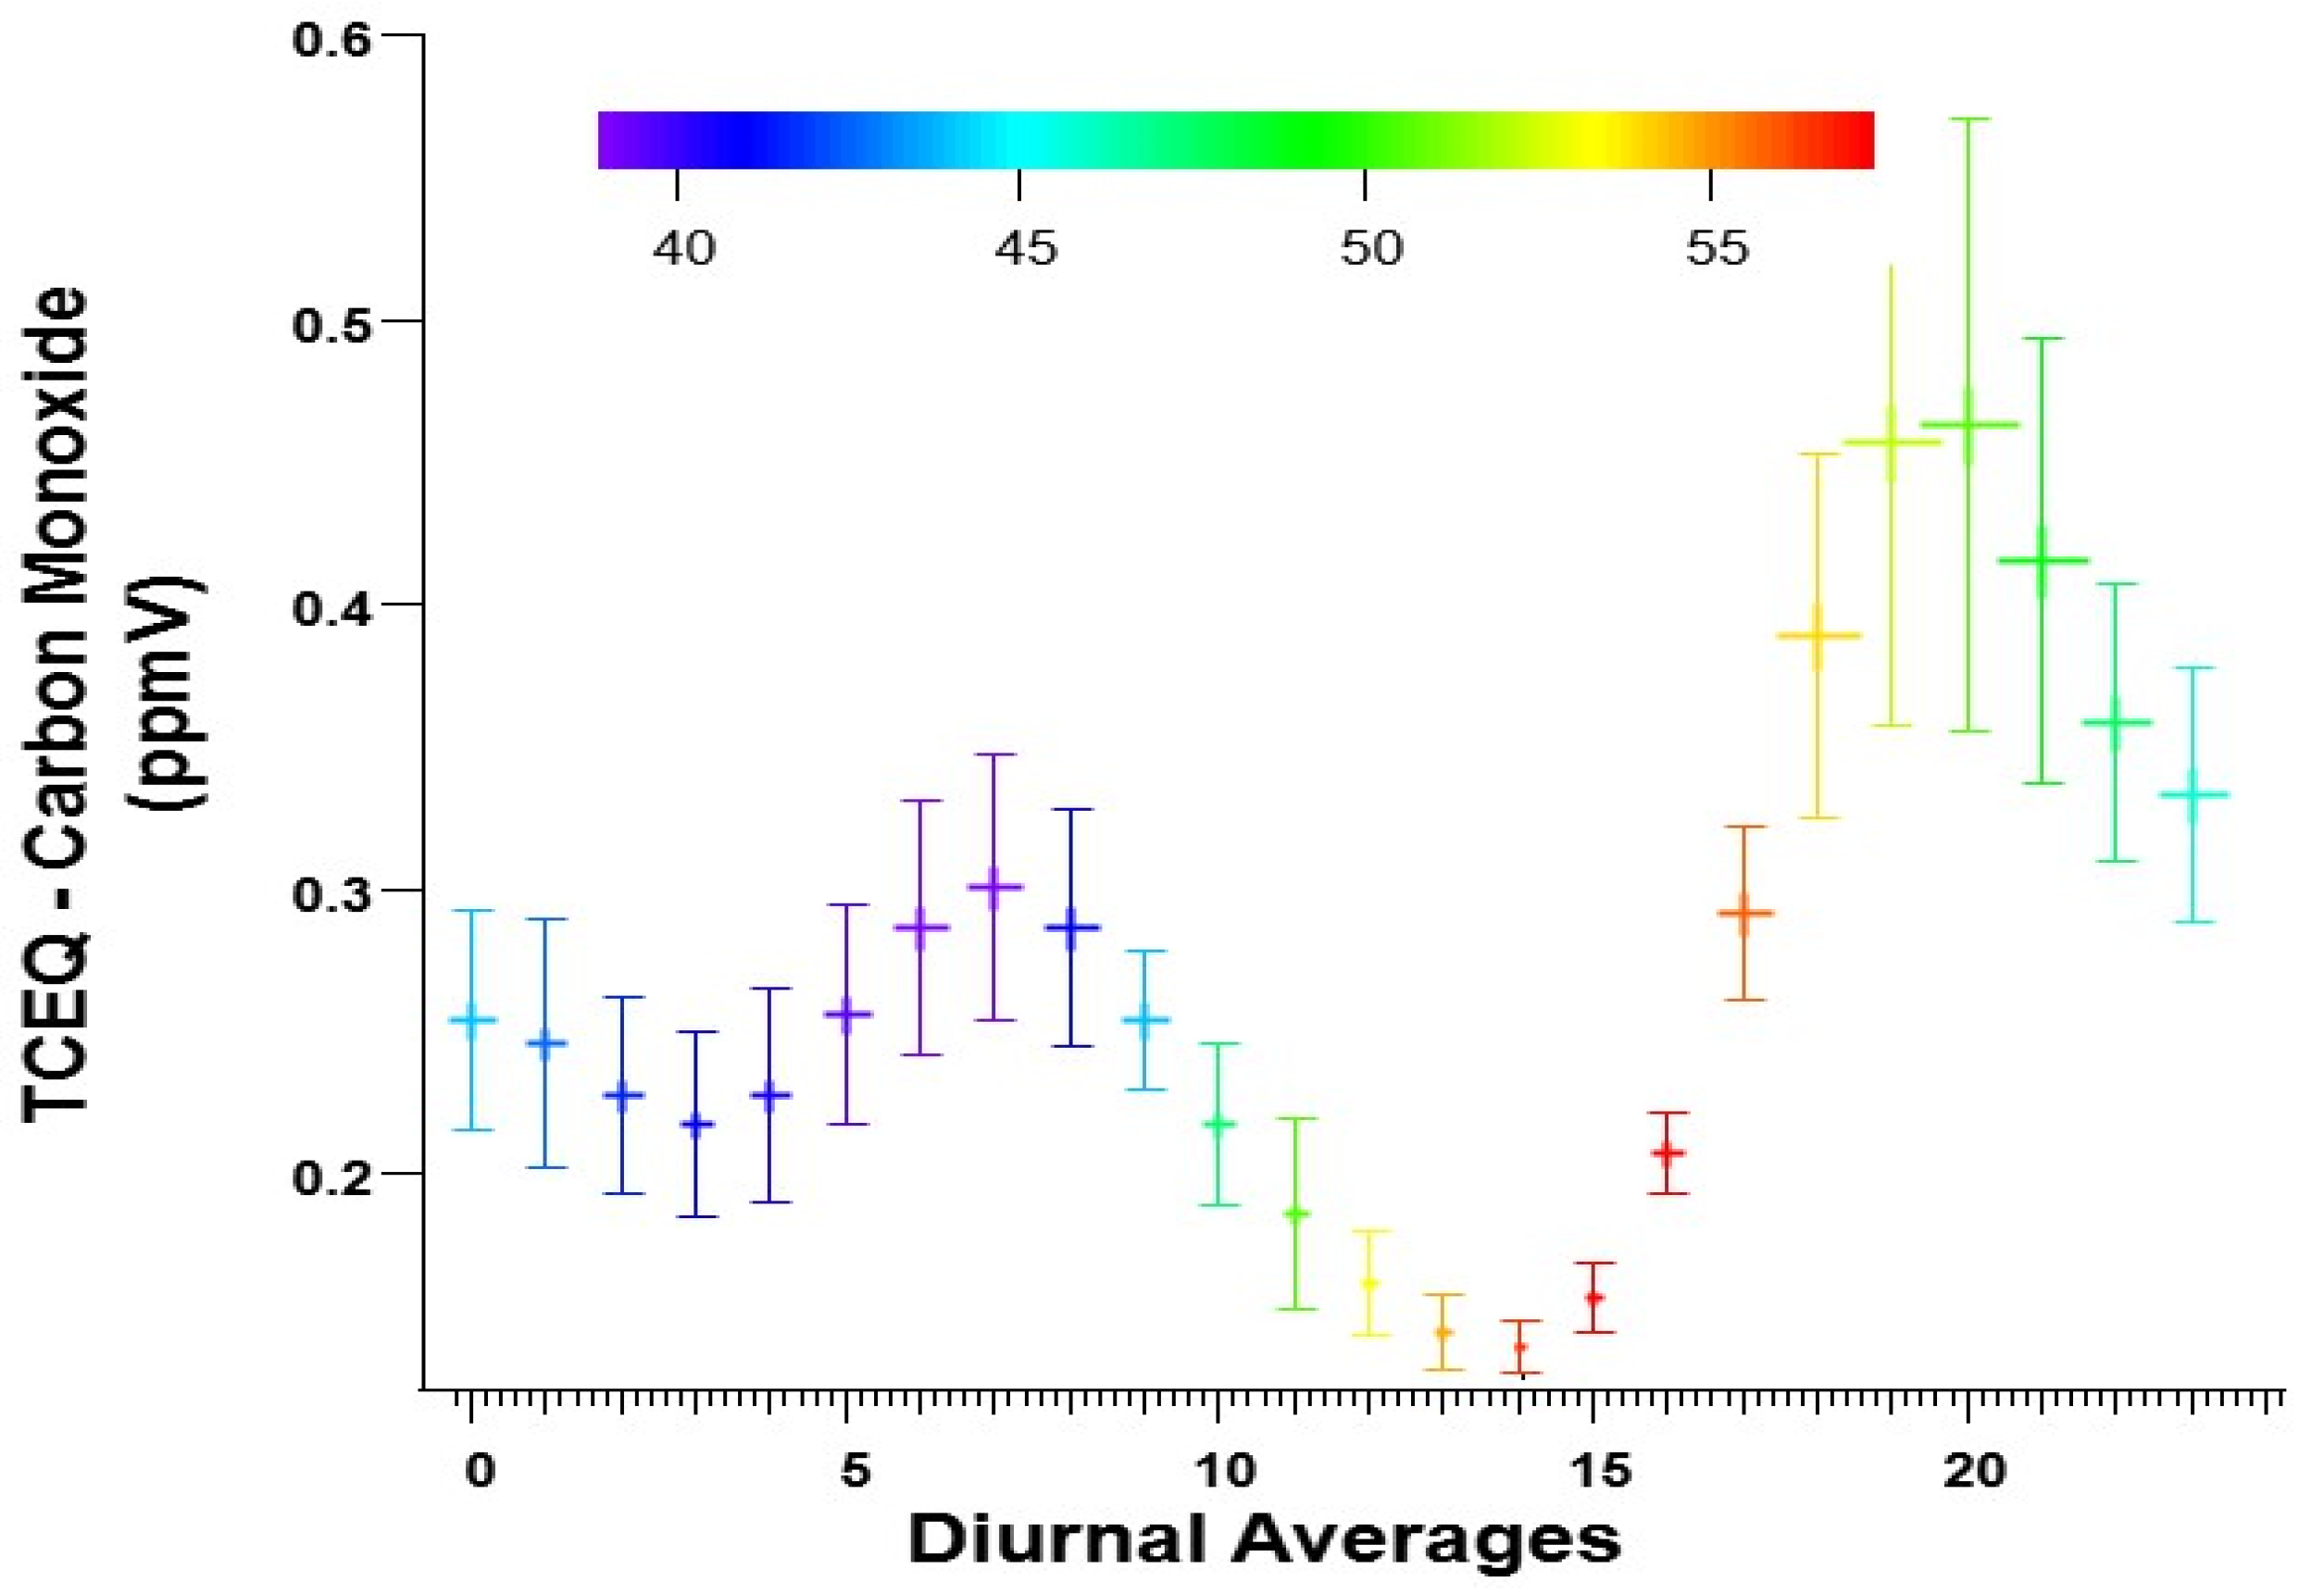
TCEQ Carbon Monoxide

The Texas Commission on Environmental Quality, TCEQ, has several air quality (AQ) monitoring stations across El Paso, including the CAM41, located at the Chamizal National Memorial Park. The CAM41 monitoring station provides valuable information, including the hourly average concentration of carbon monoxide, CO. These data helped us in the analysis of our measurements since CO levels and BC/BrC levels have similar sources and are well correlated [26].

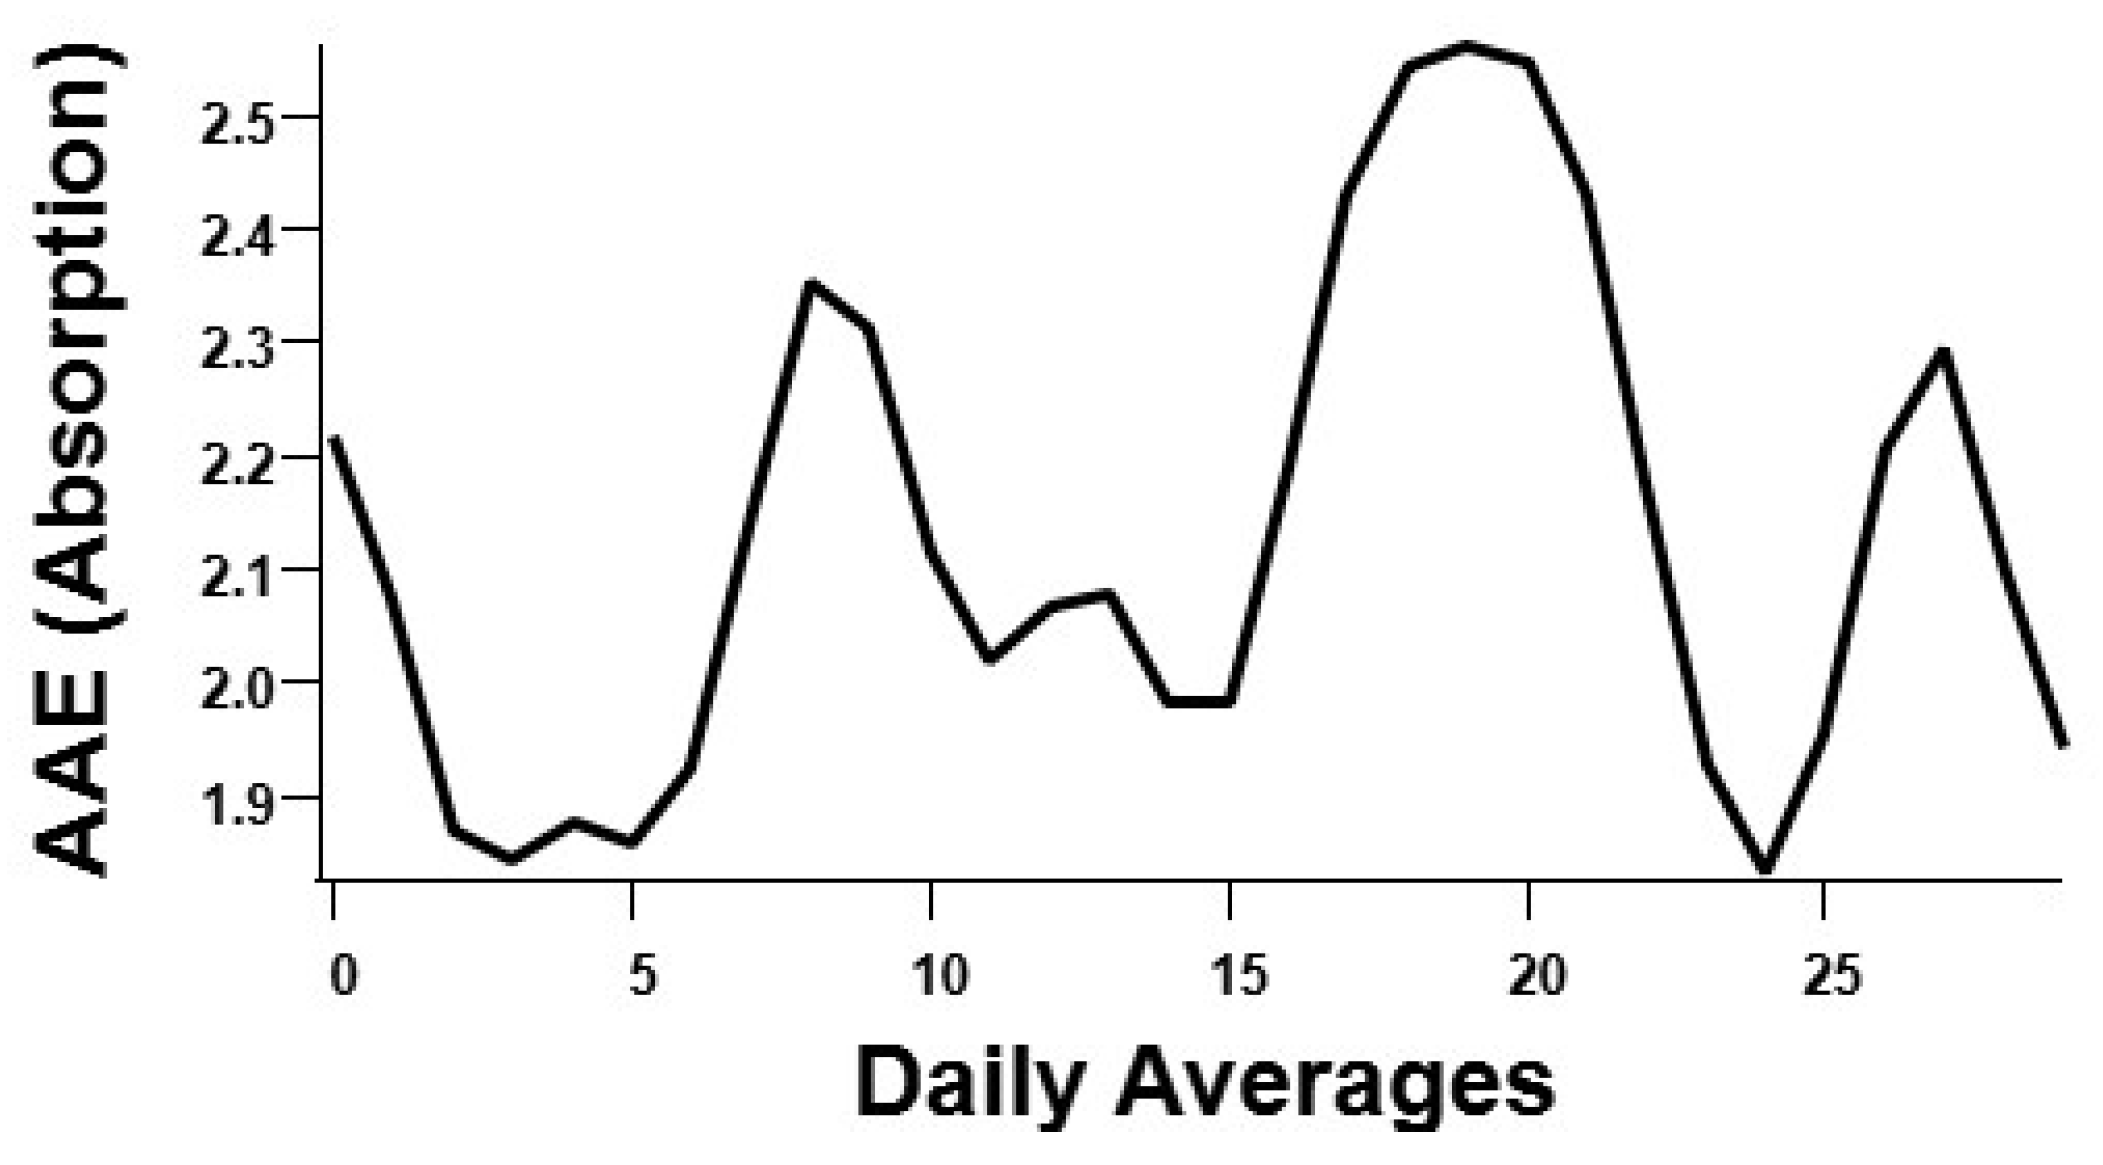
2.3.3. Angstrom Exponent and Brown Carbon Derivation

Ångstrom Exponent

We calculated the Absorption Ångstrom Exponent, Equation (1), using the PAX instruments’ absorption coefficients at 405 nm and 870 nm.

Brown Carbon Derivation

While BC absorbs at all wavelengths, BrC primarily absorbs in the ultraviolet (UV). For the purposes of deriving BrC from the PAX measurements, we assume that BC is the primary absorber at 870 nm and that BC and BrC absorb at 405 nm and follow a well-known methodology to extract the absorption due to BrC only. Previous studies, e.g., Kirchstetter et al. [27] (and references therein) have shown that BrC will absorb some light at wavelengths longer than 405 and have shown a spectral wavelength dependency that can vary between λ−2 and λ−2.5. Hence, the absorption by BrC at 405 nm is 4–7 times larger than at 870 nm. While not negligible, the difference is large enough that applying a correction factor will have negligible impact on the final results and conclusions. Following other studies using this method [13,28,29], we assume that the AAE of BC is unity. As such, the AAE was calculated as,
A A E ( λ 1 λ 2 ) = ln ( b A b s o r p t i o n   ( λ 1 ) b A b s o r p t i o n l   ( λ 2 ) ) ln ( λ 1 λ 2 )  
where b A b s o r p t i o n   will be the absorption coefficient, λ1 = 405 nm and λ2 = 870 nm [27]. Equation (1) is solved for b A b s o r p t i o n ( λ 1 ) ,
b A b s o r p t i o n   ( 405 nm ) = ( b A b s o r p t i o n ( 870   nm ) ) ( 870   nm 405   nm )  
and subtracted from the output signal of the instrument measuring at   λ 1 . Using this method, we determined the BrC absorption coefficient for the two seasons characterized in this paper,
B r C A b s o r p t i o n = B A b s o r p t i o n ( PAX   405   nm ) b A b s o r p t i o n ( 405   nm )
Although this derivation is generally accepted for the derivation of BrC, it is not without uncertainty because the AAE of BC has been observed to fluctuate around the assumed value of 1. Liu et al. [30] specified a range of 0.6 to 1.3 for the AAE of BC, which likely contributes to the variation we see in the BrC-derived Babs, i.e., a standard deviation about the mean of ±3.69 (Mm−1) for the winter characterization and ±1.38 (1 Mm−1) for the summer characterization. After the BrC is determined from Equation (3), what is left is the BC (plus a minor amount of mineral dust) Babs as detected by the PAX at 405 nm.

2.4. Air Mass Trajectory Analysis

The High-Resolution Rapid Refresh (HRRR) is an atmospheric model developed by the National Oceanic and Atmospheric Administration (NOAA), with a real-time spatial and temporal resolution of 3 km and 1 h. The model is initialized with 3 km grids and 3 km radar data assimilation. This study extensively used HRRR-smoke graphics (rapidrefresh.noaa.gov/HRRR/HRRRsmoke/, accessed on 30 July 2021, 31 August 2021 and 30 September 2021) to obtain the near-surface smoke plumes trajectories. The 72-h backward air parcel trajectories were calculated using the Hybrid Single-Particle Lagrangian Integrated Trajectory Model (HYSPLIT) version 4 to trace the trajectories of air masses carrying smoke from the wildfires on the US west coast to El Paso [31]. We employed HYSPLIT to estimate the source of these air masses as a complementary model to the HRRR.

3. Analysis

3.1. EBC and BrC Winter Season Characterization

We have selected January 2022 as a representative sample for the winter season. As mentioned in Section 2.3.2, we derived an absorption coefficient baseline due to BC and BrC in the El Paso and Ciudad Juarez airshed and determined that this baseline increases each Winter as a result of household heating using burning of wood, charcoal, and other biomasses materials. These alternative heating methods are prompted by the lack of centralized heating systems using electricity, gas, or oil among the poorer areas of Ciudad Juarez. Montoya et al. (2006) [26] found a relationship between Winter’s low ambient temperatures and CO emissions in the Ciudad Juarez. They attributed it to malfunctioning gas heaters and biomass burning in the city residences.
We divided the winter data into two time-segments, Midnight to 3:00 PM and 3:00 PM to midnight, local standard time (LST). The first time-segment baseline, as per Section 2.3.2, shows two main peaks, one at around 1:00 AM, attributed to nighttime international bridge traffic, and a second peak between 6:00 AM and noon, which corresponds to the normal traffic congestion due to morning commuters. In the evening segment we saw a significant increase in the Babs (+300%) when compared to the first time-segment. The BC and BrC emitted by household heating is responsible for this increase. Figure 2a,b illustrate this trend. The PAX 405 Babs in Figure 2a refers to the Babs due to BC absorption measured by the PAX 405 nm and extrapolated from the measurement according to Equation (2). The PAX 870 BC Babs in this graph correspond to the Babs calculated by the PAX 870 nm. Figure 2b refers to the brown carbon absorption coefficient as calculated in Equation (3). Each data point on Figure 2a,b represents a 10-min average of the measurements. The error bars express the standard error of each averaged data point. Figure 2c presents a boxplot of three Babs, Babs 405, Babs 870, and Babs BrC, to show the distribution and spread of the data points. The average and maximum values for each peak are displayed in Table 1. The BrC Babs represents an average of 53% (±19.90%) of the total Babs as measured by the PAX 405 nm. In Figure 3, we present the CO detected by the TCEQ instruments (CAM41-Chamizal) which are located slightly more than 8 km from our instruments. The three main peaks correspond to the Babs peaks for the same time interval. The most prominent peak, between 3:00 PM and midnight, is around 160% greater than the mid-morning peak and ~180% greater than the early morning peak. A temperature color-coding has been added for temperature reference. The graph shows that, after 4:00 PM, the temperatures start to decrease, and the CO concentrations start to increase. This agrees with our findings that the Babs, due to BC and BrC, also increase in the late evening hours. The graph has a smoothing filter applied (binomial smoothing by Wave Metrics Igor Pro 8 platform). The error bars represent the standard error for each averaged point. As mentioned above, the measurements of CO for the same period, in parts per million (PPM) by volume, display the same general tendency of the Babs that we measured. The CO graph shows the most prominent peak to be around 160% greater than the early and mid-morning peaks, in agreement with previous literature [32]. The authors claim that the behavior of the two graphs, Figure 2a,b and Figure 3, show a correspondence as the sources of carbon monoxide and black/brown carbon are similar.

Single Scattering Albedo and the Ångstrom Exponent for the Winter Season

The Single Scattering Albedo (SSA), Figure 4, was calculated using the PAX 870 nm (scattering coefficient divided by the extinction coefficient) for January 2022. Values closer to 1 mean that the particles’ extinction was mainly due to scattering. In contrast, a value nearer to 0 denotes that the particles’ extinction was primarily due to absorption. The average value for January was 0.66 ± 0.19, an SSA indicating strong absorption that we believe is due to the ubiquitous black and brown carbon particles present in the atmosphere [33]. Since the PAX was connected to a thermal denuder at a fairly high themperatures, only the SSA of thermally stable particles (or thermally stable particles residues) was obtained. The PAX 870 nm SSA is dominated by BC. The Absorption Ångstrom Exponent (AAE) from Equation (1), λ 1 = 415   nm and λ 2   = 860   nm , displayed in Figure 5, was calculated using the Babs obtained from the PAX 405 nm and 870 nm for the month of January of 2021. The average AE for the month was 2.150 ± 0.681.

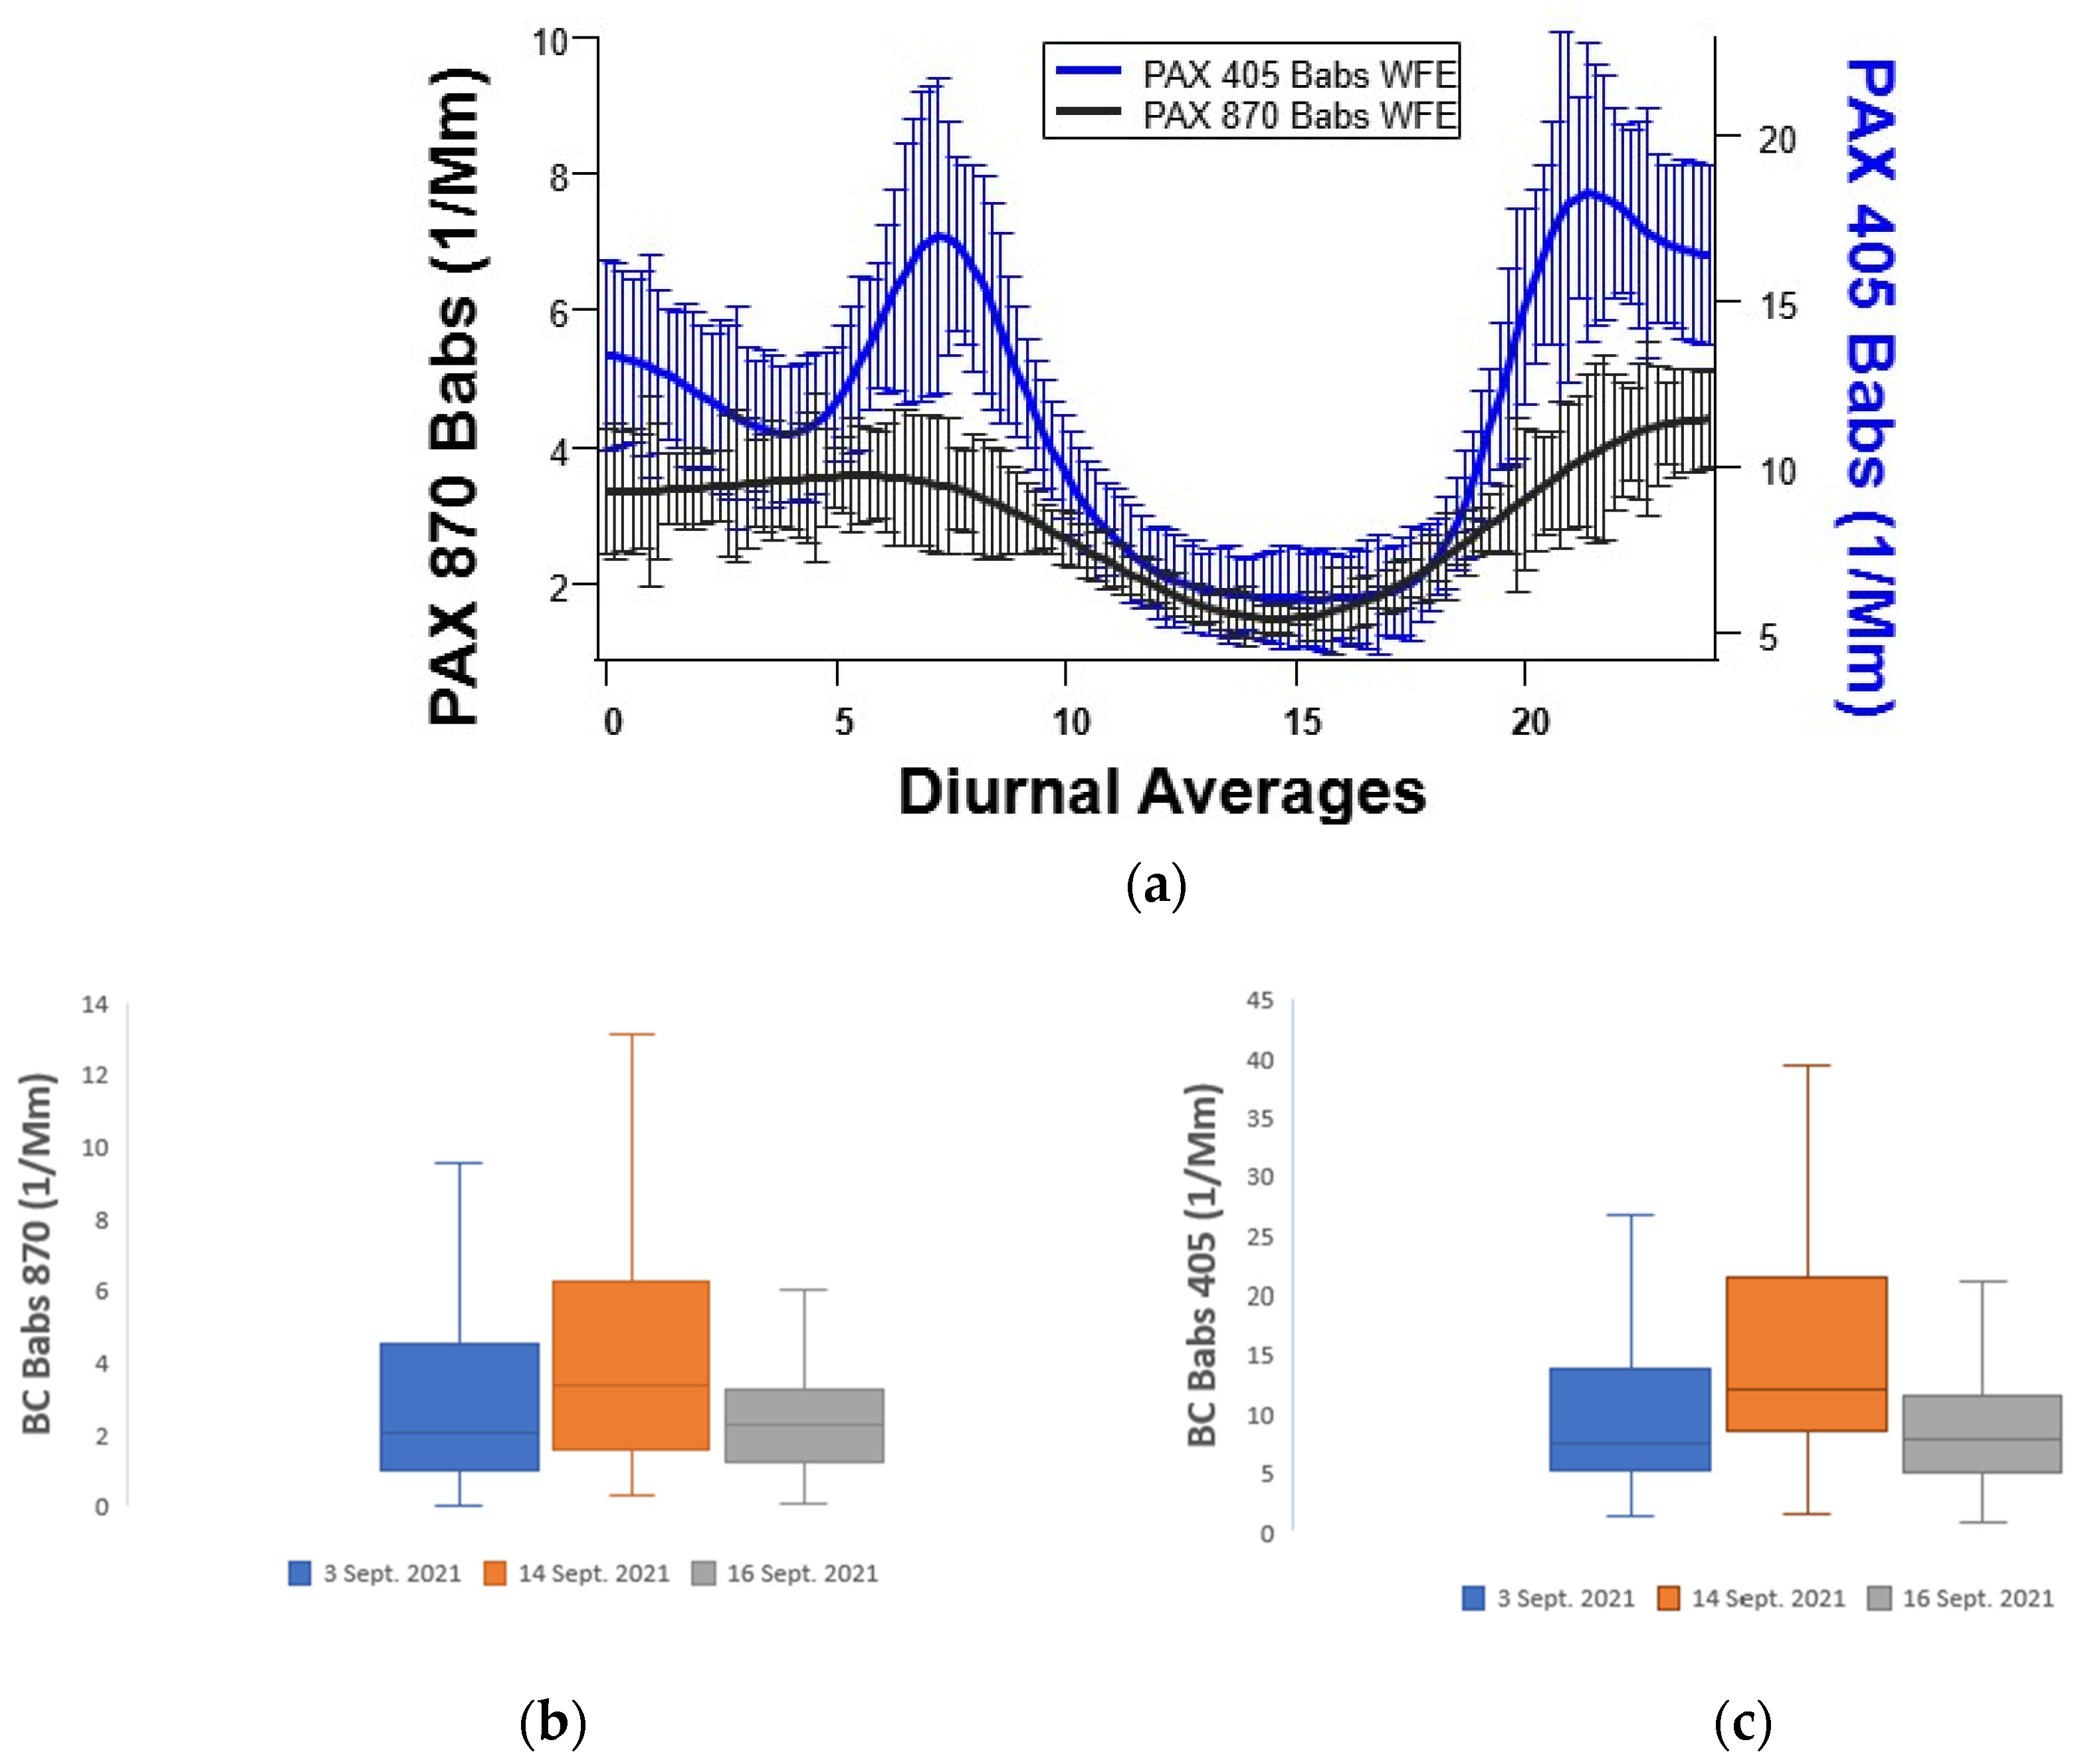
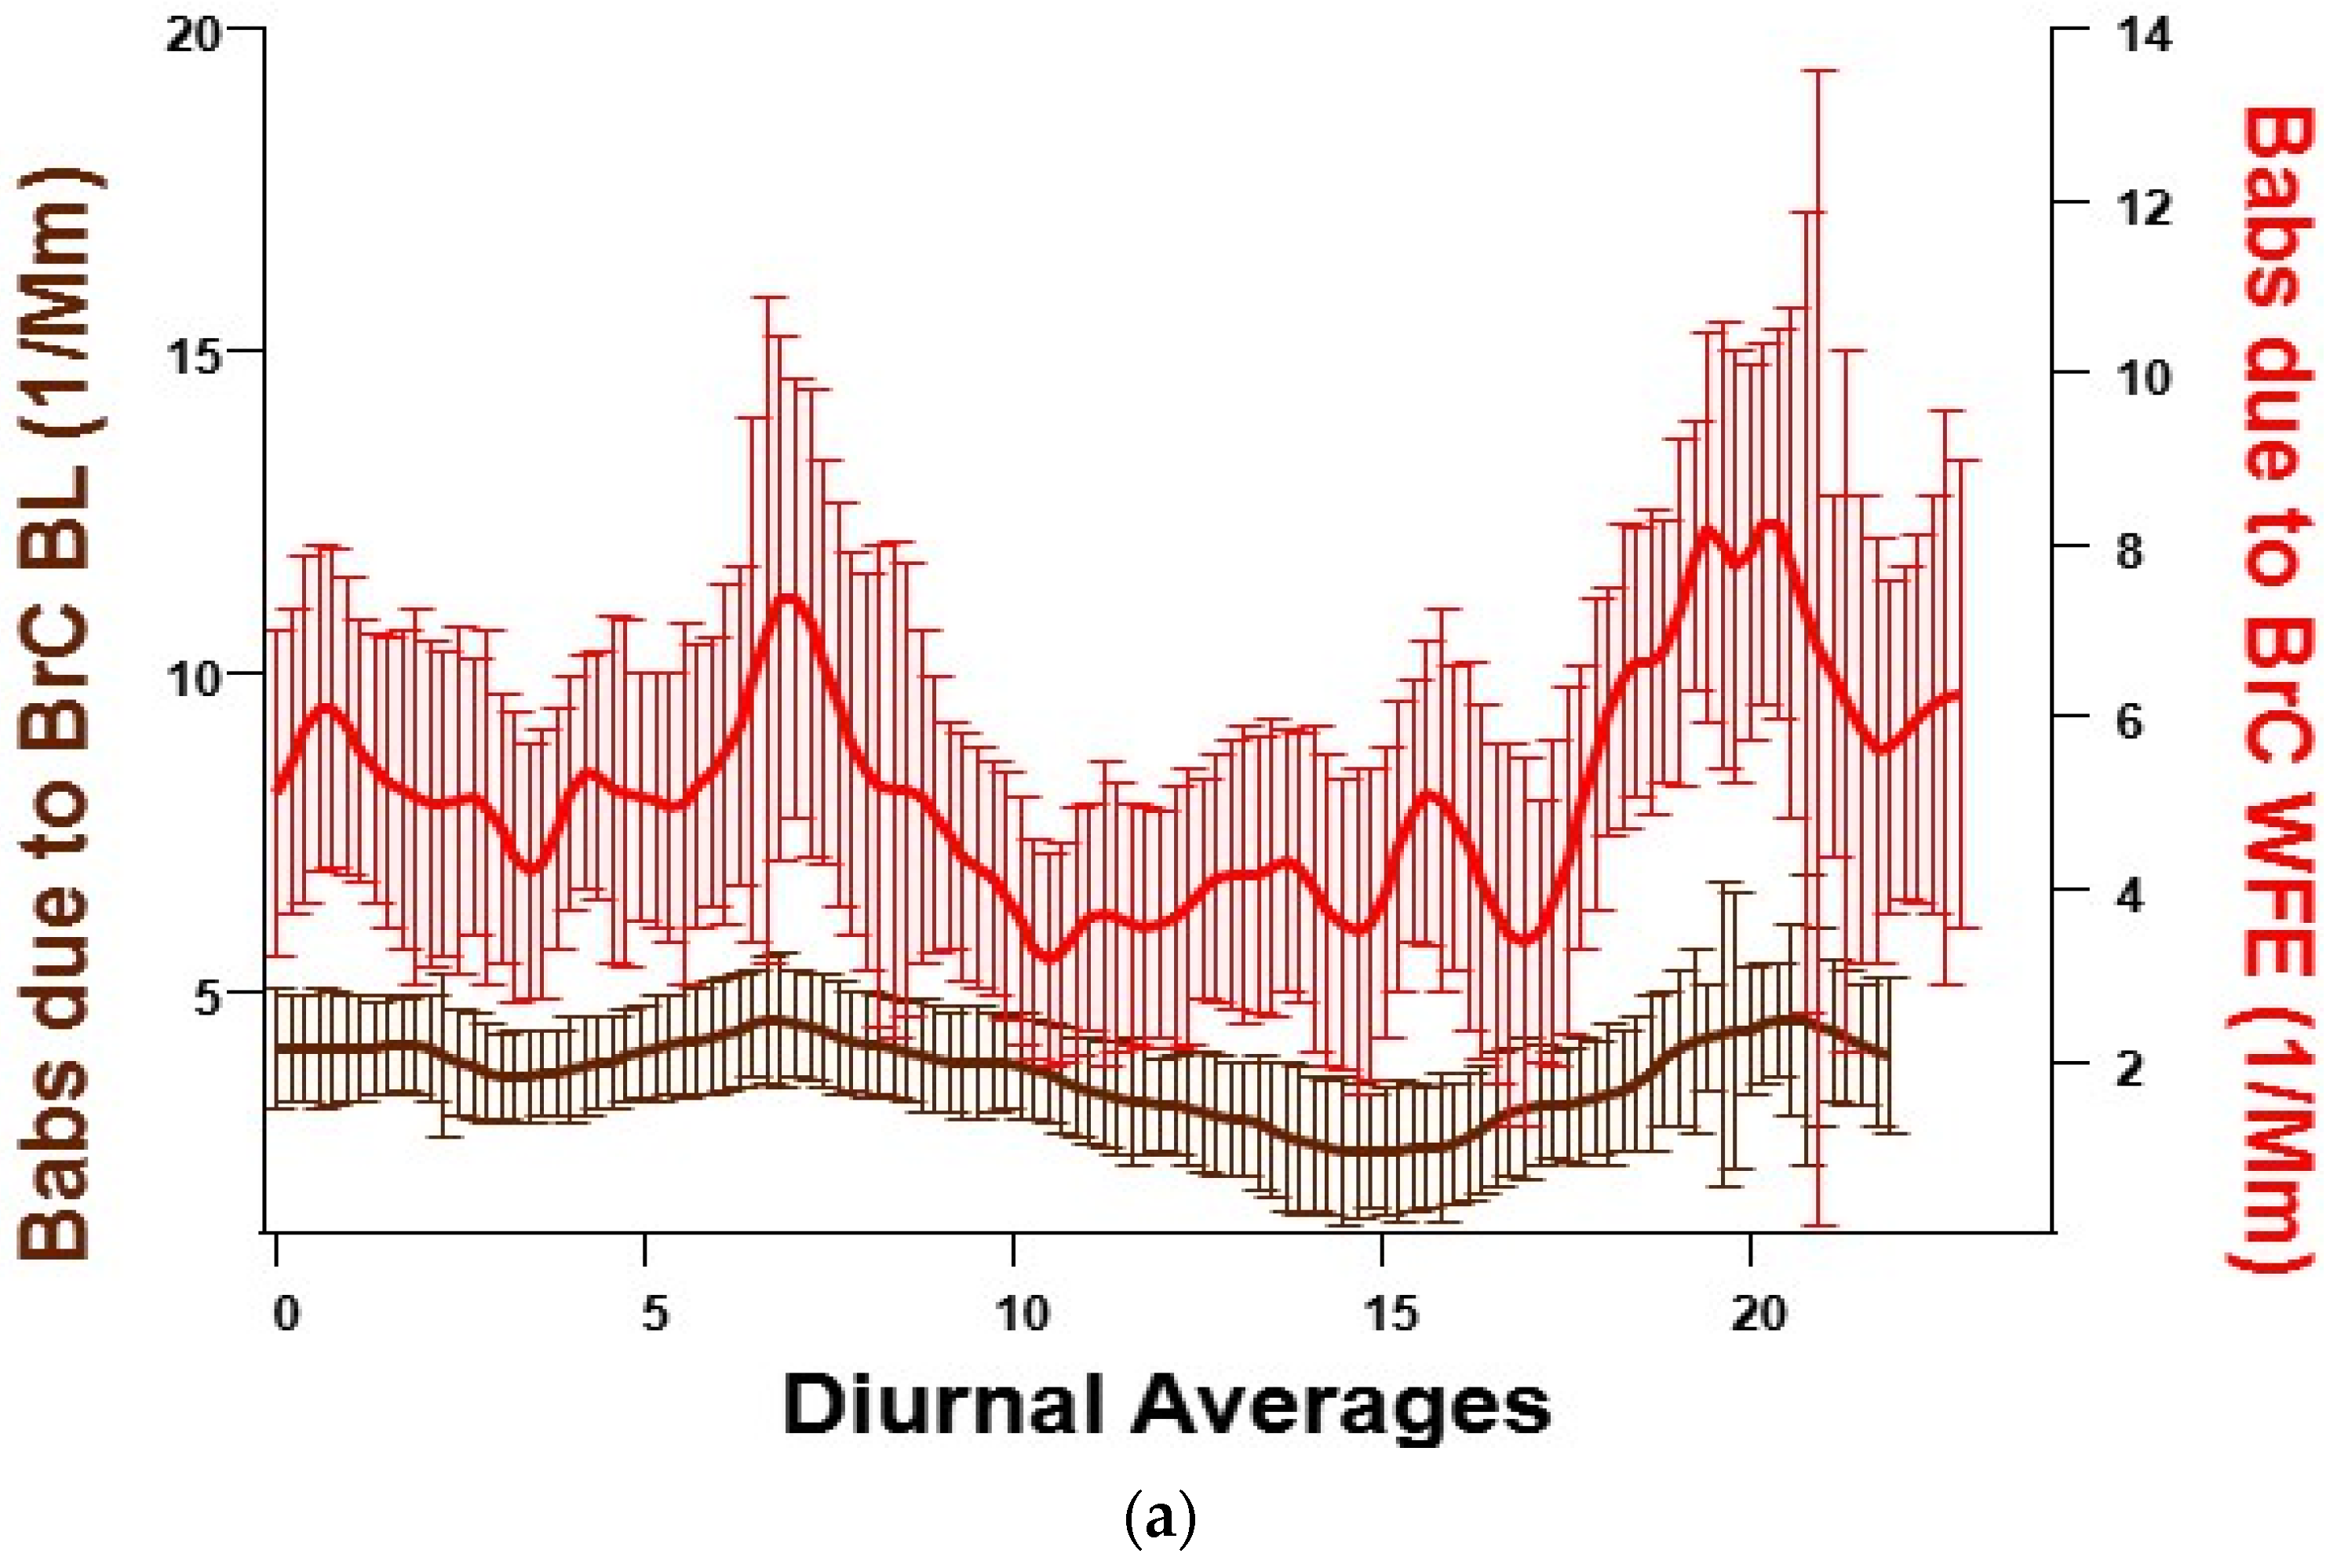
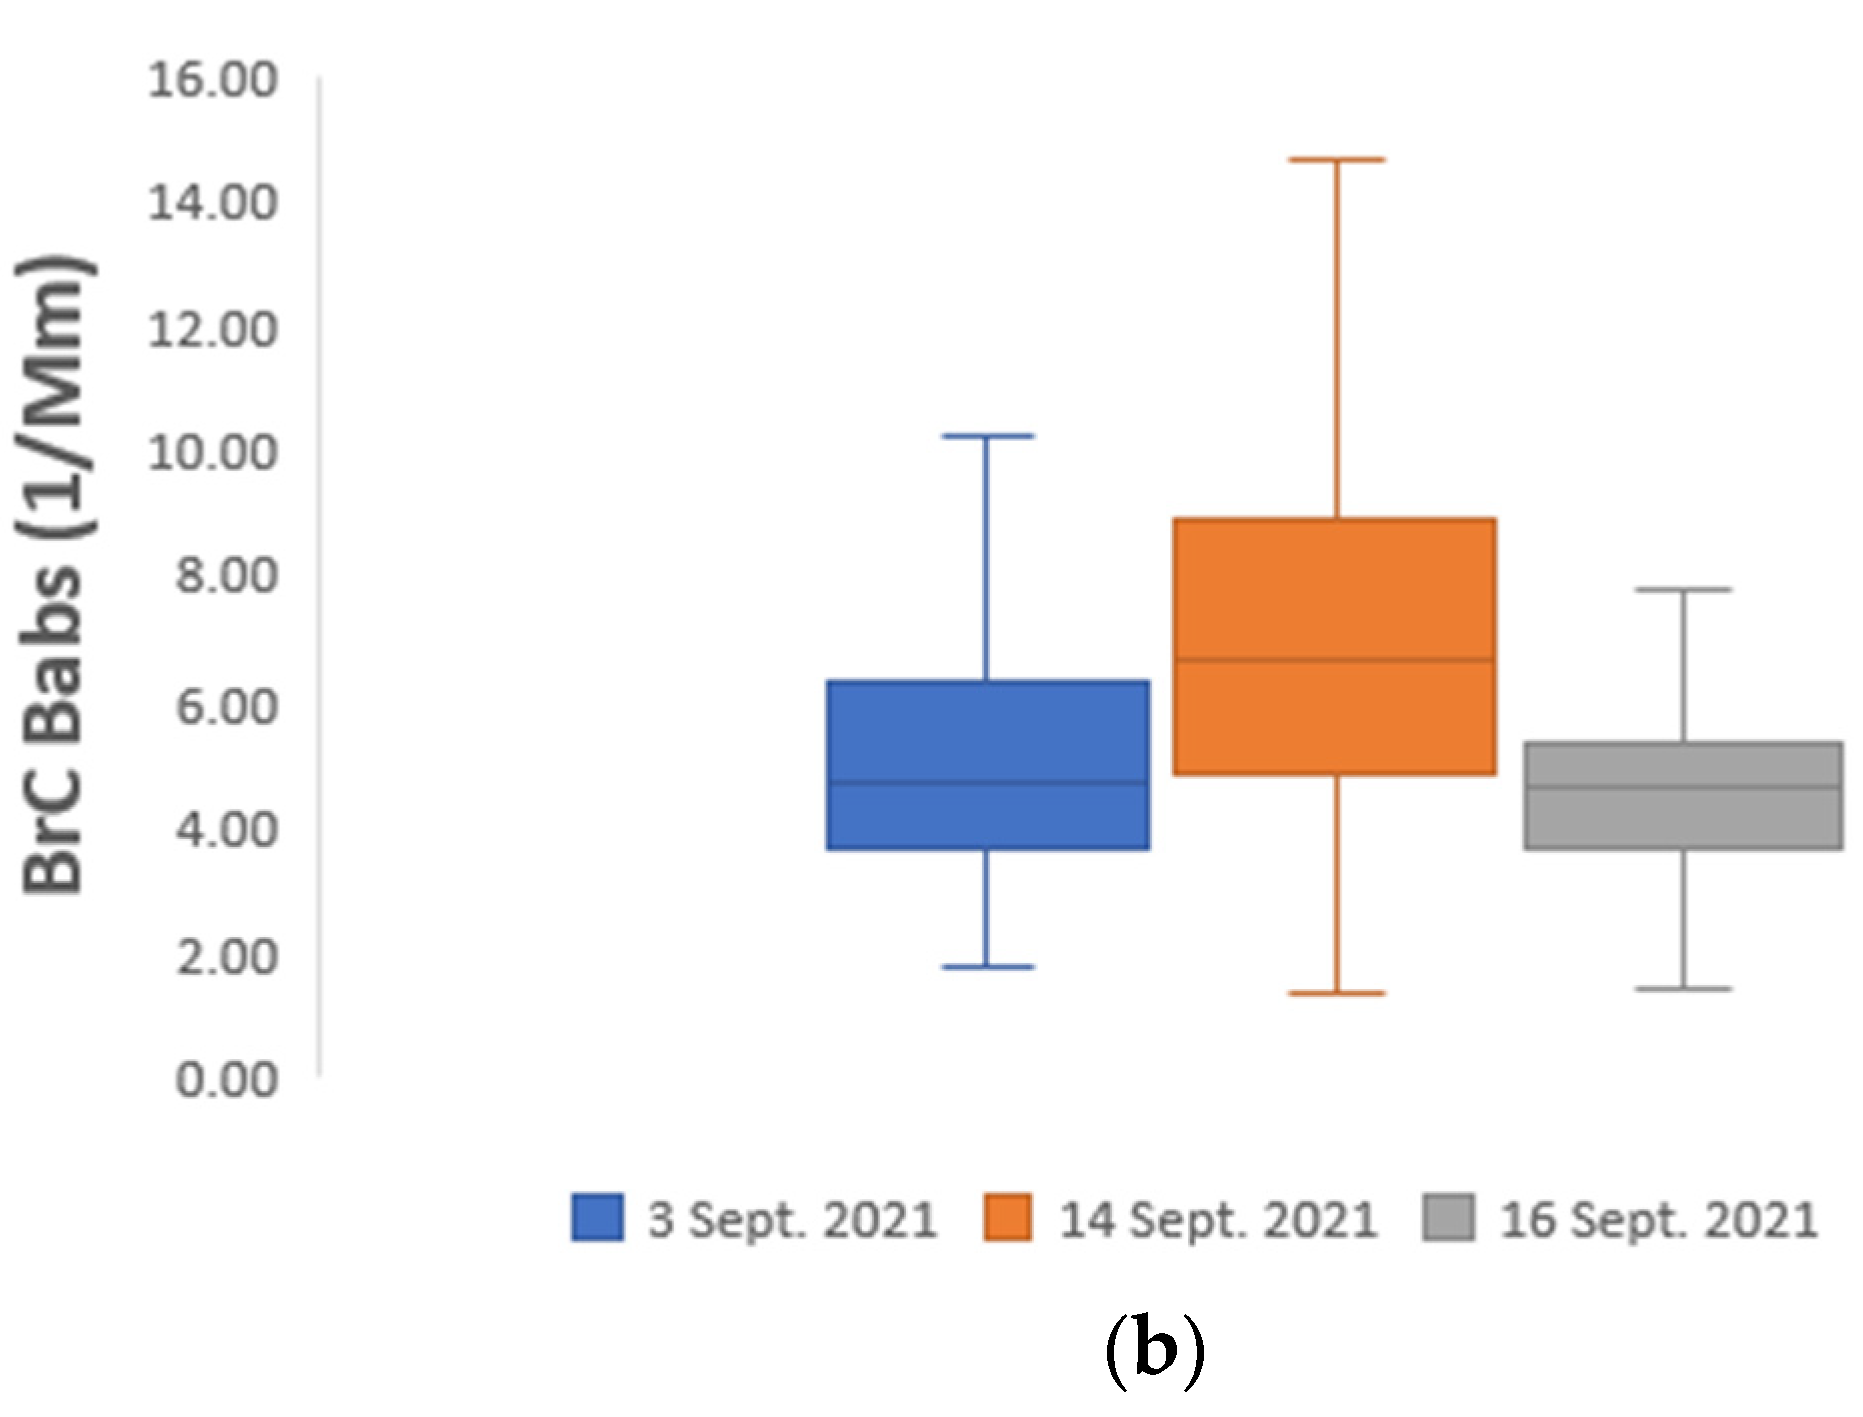
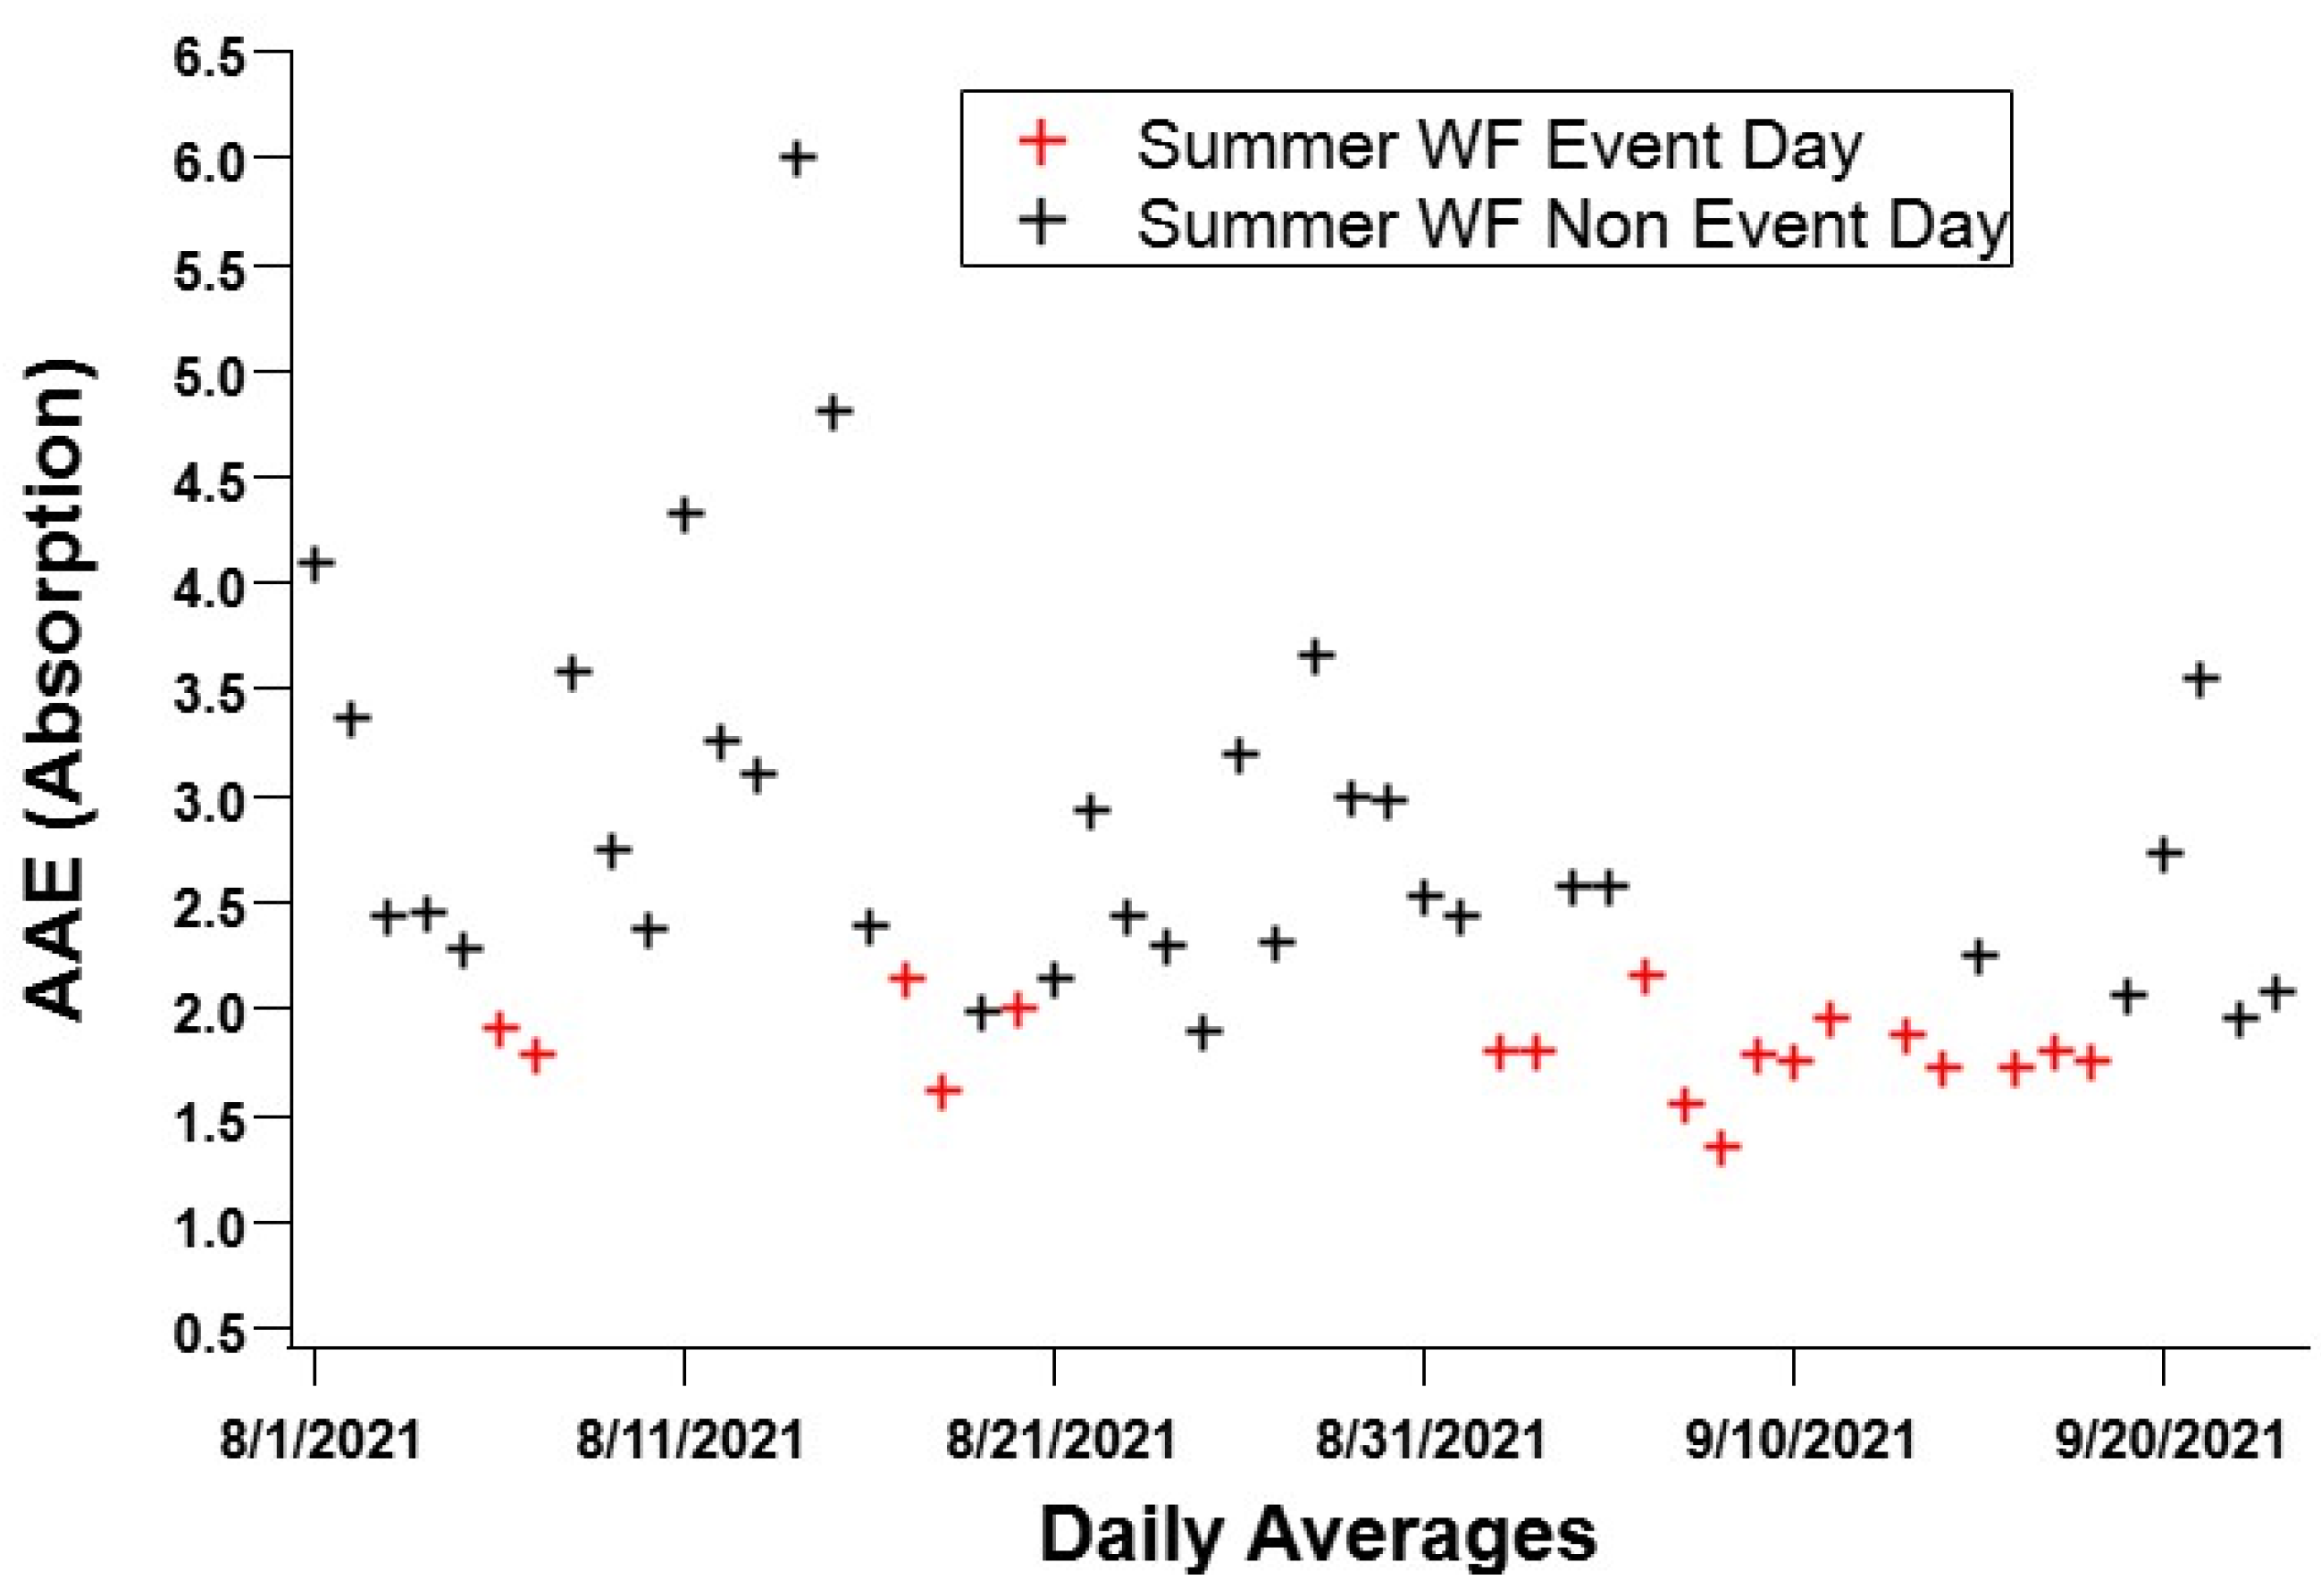
3.2. EBC and BrC Summer Wildfire Seasonal Characterization

One of the primary objectives of our study was to identify BC and BrC particles emitted by wildfires. The first step was to establish the baseline (as defined in Section 2.3.2) of the Babs for the period. Figure 6 shows these baselines as measured by both instruments. Here, we still see the two main peaks, where the third peak in the early morning hours is almost non-existent (compared to Figure 2a for example), which are driven by the heavy traffic at peak hours. The Summer baseline Babs had similar sources to the Winter season in Section 3.1. We observed non-periodical but obvious increments to the baseline during the summer season and conclude that such increments were due to wildfire smoke.
We used two different models to show that the US West Coast wildfire plumes reached the El Paso—Ciudad Juarez airshed. One of these models is the High-Resolution Rapid Refresh (HRRR). The HRRR model maps showed that the west coast wildfire plumes usually travel in a North-East direction, later moving southward into our region.
Using the HRRR and HYSPLIT models we recorded the days when the wind direction and plume trajectories were transporting smoke plume particles to our region and labeled them Event Days when the plumes reached the El Paso-Ciudad Juarez airshed. Thus, for August–September 2021, we encountered eighteen such events, listed in Table 2, along with the location of the wildfires from where these air masses originated. The HRRR product is a map with the smoke near the surface (3 km) reported as a mass concentration in units of μg/m3.
We have used two months of observation, summarized in Figure 7. This graph contains the daily averages of the surface mass concentration due to EBC as derived from the Babs measured by the PAX 870 nm Equation (4). The bold markings are the event days’ averages. The graph covers from 1 August first to 23 September 2021. The event days have an average of higher EBC mass than a non-event day (light marking, baseline). We compared a non-event day to an event day and determined that the wildfire plumes’ EBC mass surface concentration was 58–63% larger than the baseline EBC mass concentration.
The mass concentration the PAX 405 nm calculates includes EBC, BrC, and some mineral dust. However, this is not the case for the PAX 870 nm since most of the Babs is due to BC at that wavelength. The derivation of the mass concentration from the PAX 870 nm-measured Babs (Equation (4)) uses the Babs and a fixed absorption cross-section (Equation (5)), as suggested by Bond et al. (2006) [34] and corrected for wavelength.
BC   Mass ( μ g m 3 ) = B abs   ( 1 Mm ) BC   MAC   ( m 2   g )  
BC   MAC = 7.5   ( m 2 g ) * ( 550   nm 870   nm ) = 4.74   m 2 / g  
Figure 8a presents the trends in the summer wildfire (WFE) Babs due to BC measured with the PAX 870, that had an average value of 2.9 ± 1.8 (Mm−1), and the Babs due to BC and a small amount of mineral dust as derived from the PAX 405 nm with an average of 11.4 ± 4.9 (Mm−1). The trends in the baselines are still present in the seasonal behavior and explain the peaks observed in the figure. However, the three main peaks typical of the background Babs were reduced to two peaks. The error bars represent the standard error associated with each averaged point. Two boxplots were added, Figure 8b,c, to show the data points distribution and spread of selected event days. The BrC Babs average for event days in Figure 9a was 5.2 ± 1.7 (Mm−1) and 3.8 ± 0.76 (Mm−1) for non-event days. The standard error was added to the figure. Evaluating the portion of the Babs from the PAX 405 nm that corresponds to BrC Babs is an innovation for our region. The percentage of the Babs due to BrC from the Babs calculated by PAX 405 nm was 52.7 ± 6.8% for event days. We conclude that at a wavelength of 405 nm, over 50% of the light absorption by particles during wildfire events is due to non-volatile BrC particles. This graph shows a large number of fluctuations, but the standard deviations are also large. Though we did not separate the BrC Babs from the baseline graph in Figure 9, one must assume that there are background BrC particles in the region, independent of the wildfires’ smoke coming from the West of the US. The boxplot in Figure 9b presents the spreadof the BrC data for three random event days, 3 September, 14 September, and 16 September.

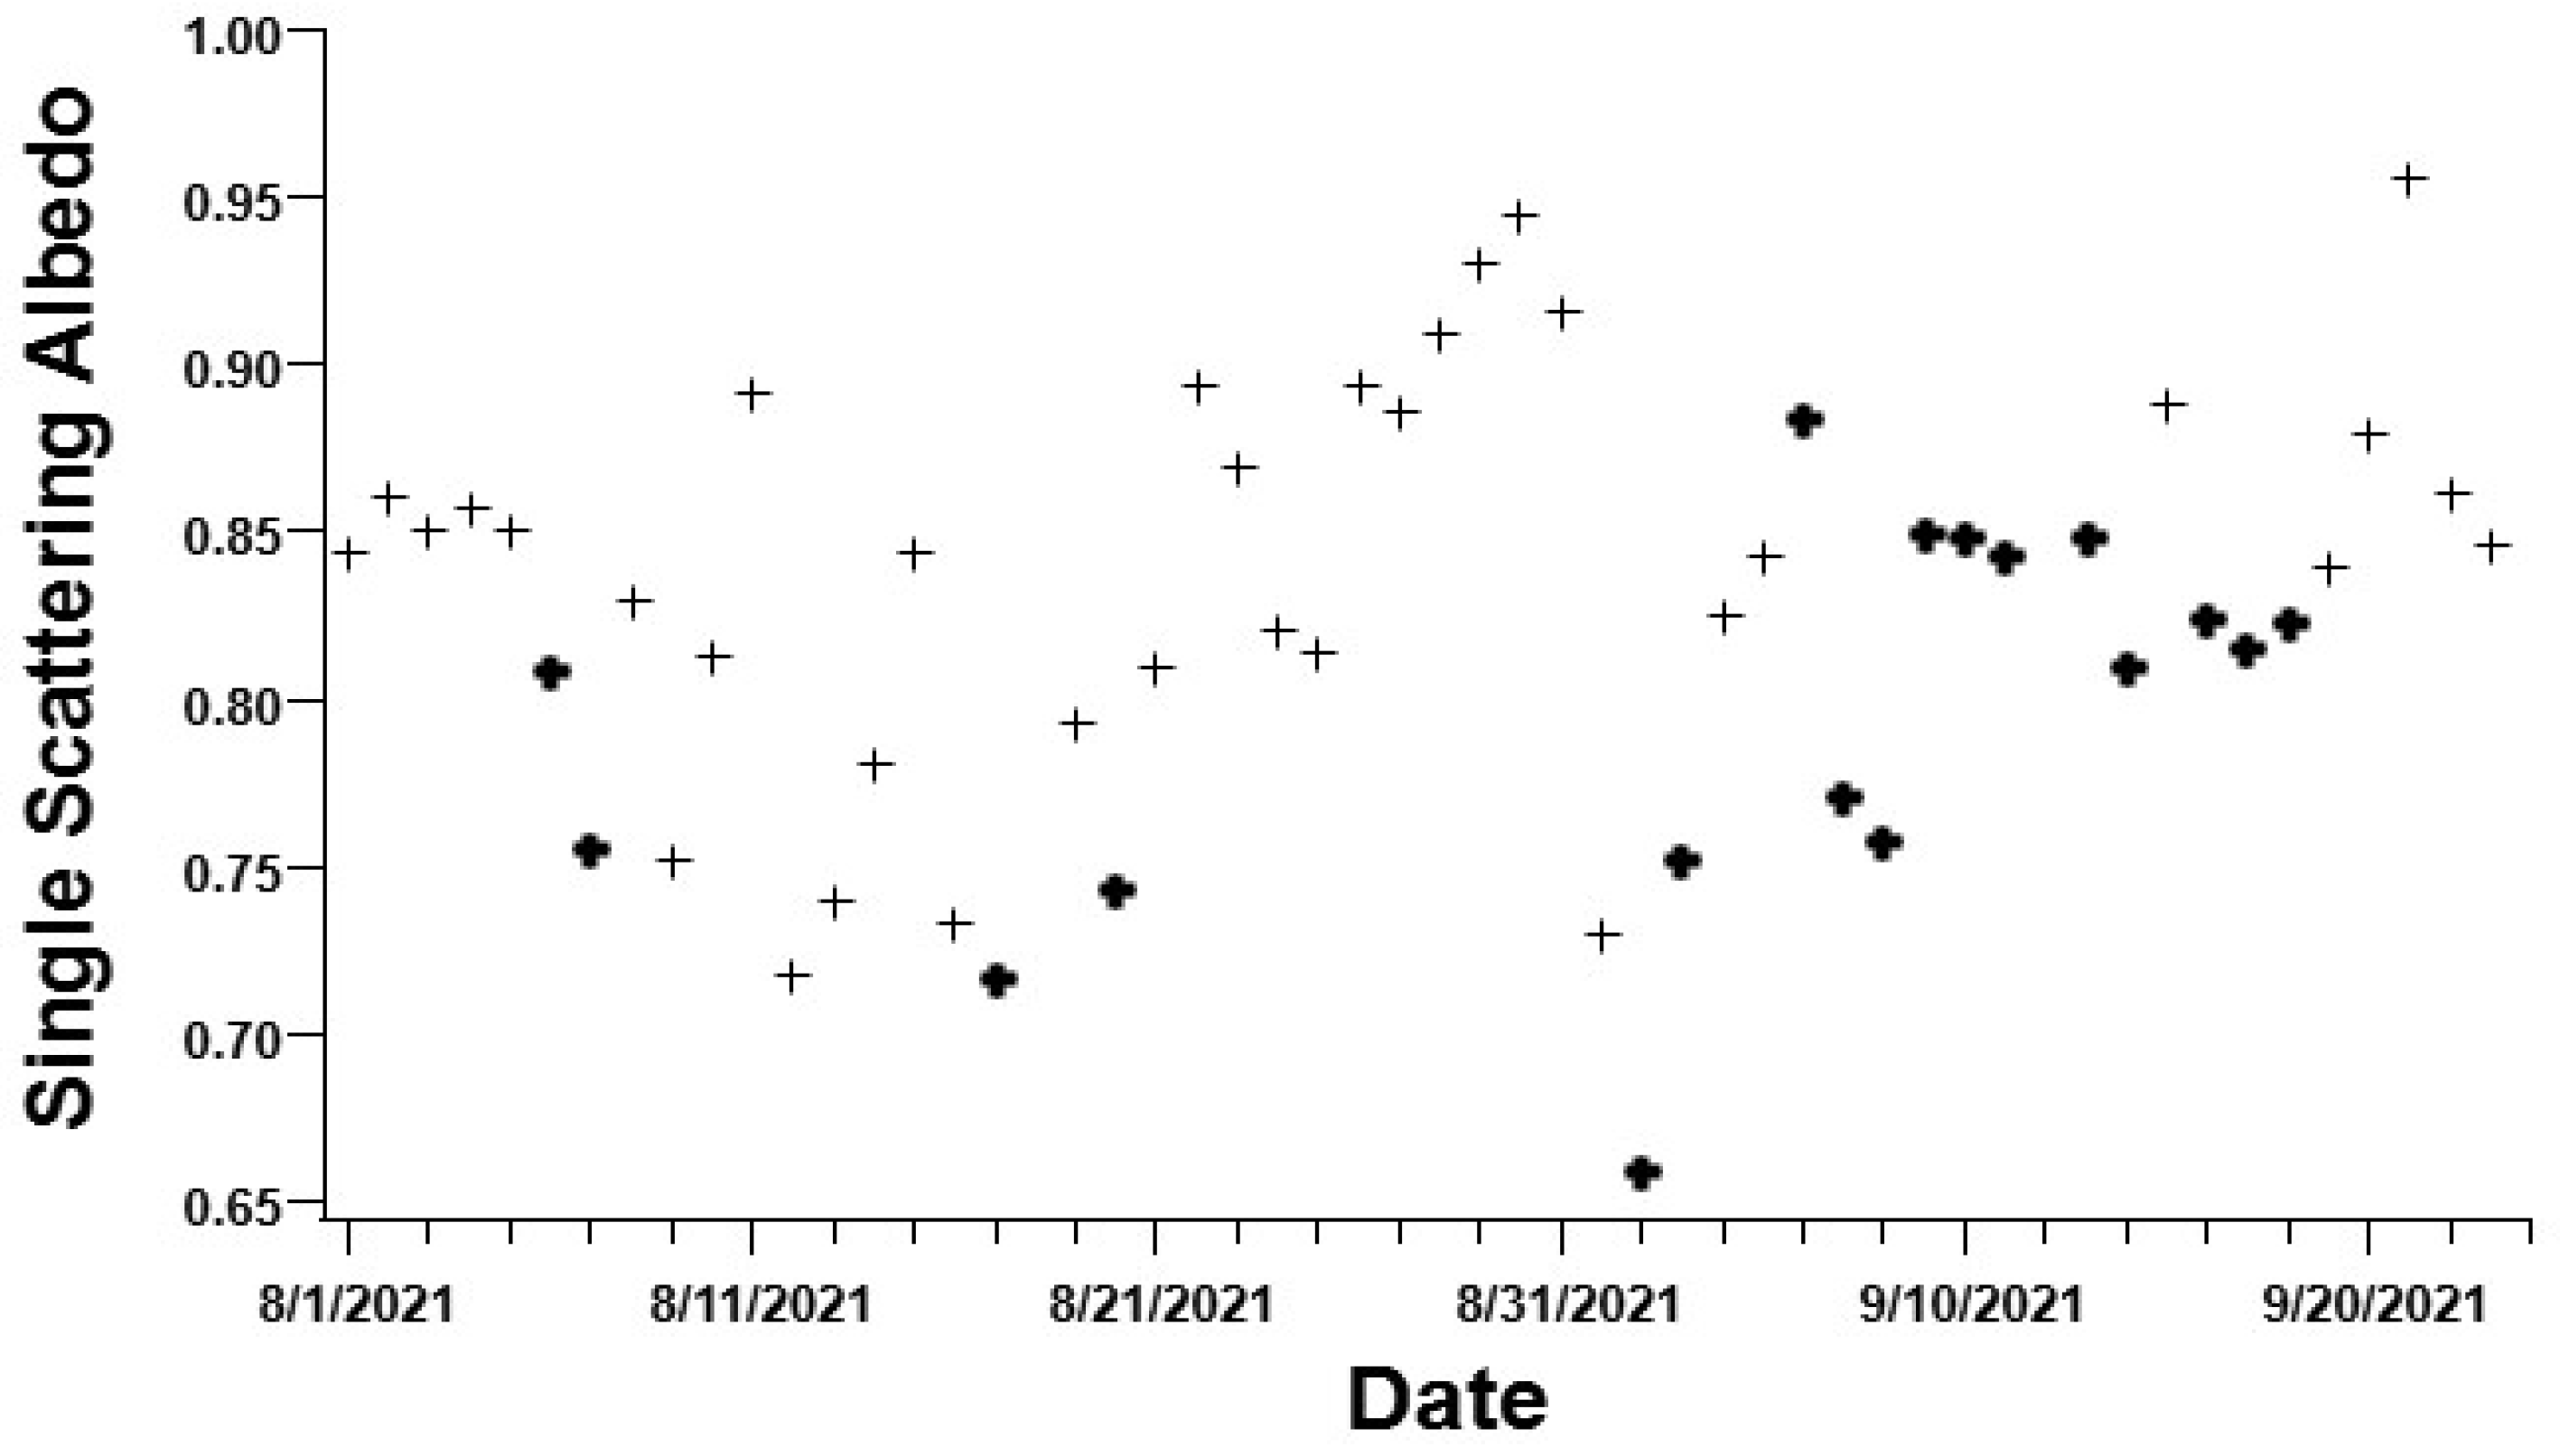
3.2.1. The Single Scattering Albedo (SSA) and the Absorption Ångstrom Exponent for the Summer Season

We reported the SSA over August and September of 2021 derived from the 870 nm PAX; the event days were denoted in bold black markers as shown in Figure 10. The average SSA value for August-September was 0.83 ± 0.06, and the SSA calculated over the event days was 0.79 ± 0.06. The event days resulted in a smaller SSA value which was to be expected as the wildfires introduced many more absorbing BC particles than the baseline, local sources. The SSA has been reported to have a large variation in measurements (differences in the aerosol chemical structure) and Takura et al. mentioned that a value less than 0.85 has a planet warming effect [35].
From the Absorption Ångstrom Exponent Equation (1), the AAE for the Summer Wildfire Event Days and non-Event are shown on Figure 11.
As observed in Figure 11, the AAE for the Summer Wildfire Event Days decreases; this is because the BC AAE becomes smaller in the summer season during a wildfire event, in particular for particles with mean diameters larger than 0.12 μm, which is symptomatic that the BC particles that arrive in the El Paso region are aged [18]. The average value for the baseline AAE for the period was 3.12 ± 1.4. The average value for the eighteen days when wildfire smoke was detected (plus the background or baseline AAE for those days) was 1.81 ± 0.20. Schuster et al. [36] indicated that an AAE less than 1 represent coarse aerosols and AAE greater than 2 bespoke of particles size distribution “dominated by fine mode aerosols…usually associated with urban pollution and biomass burning.”

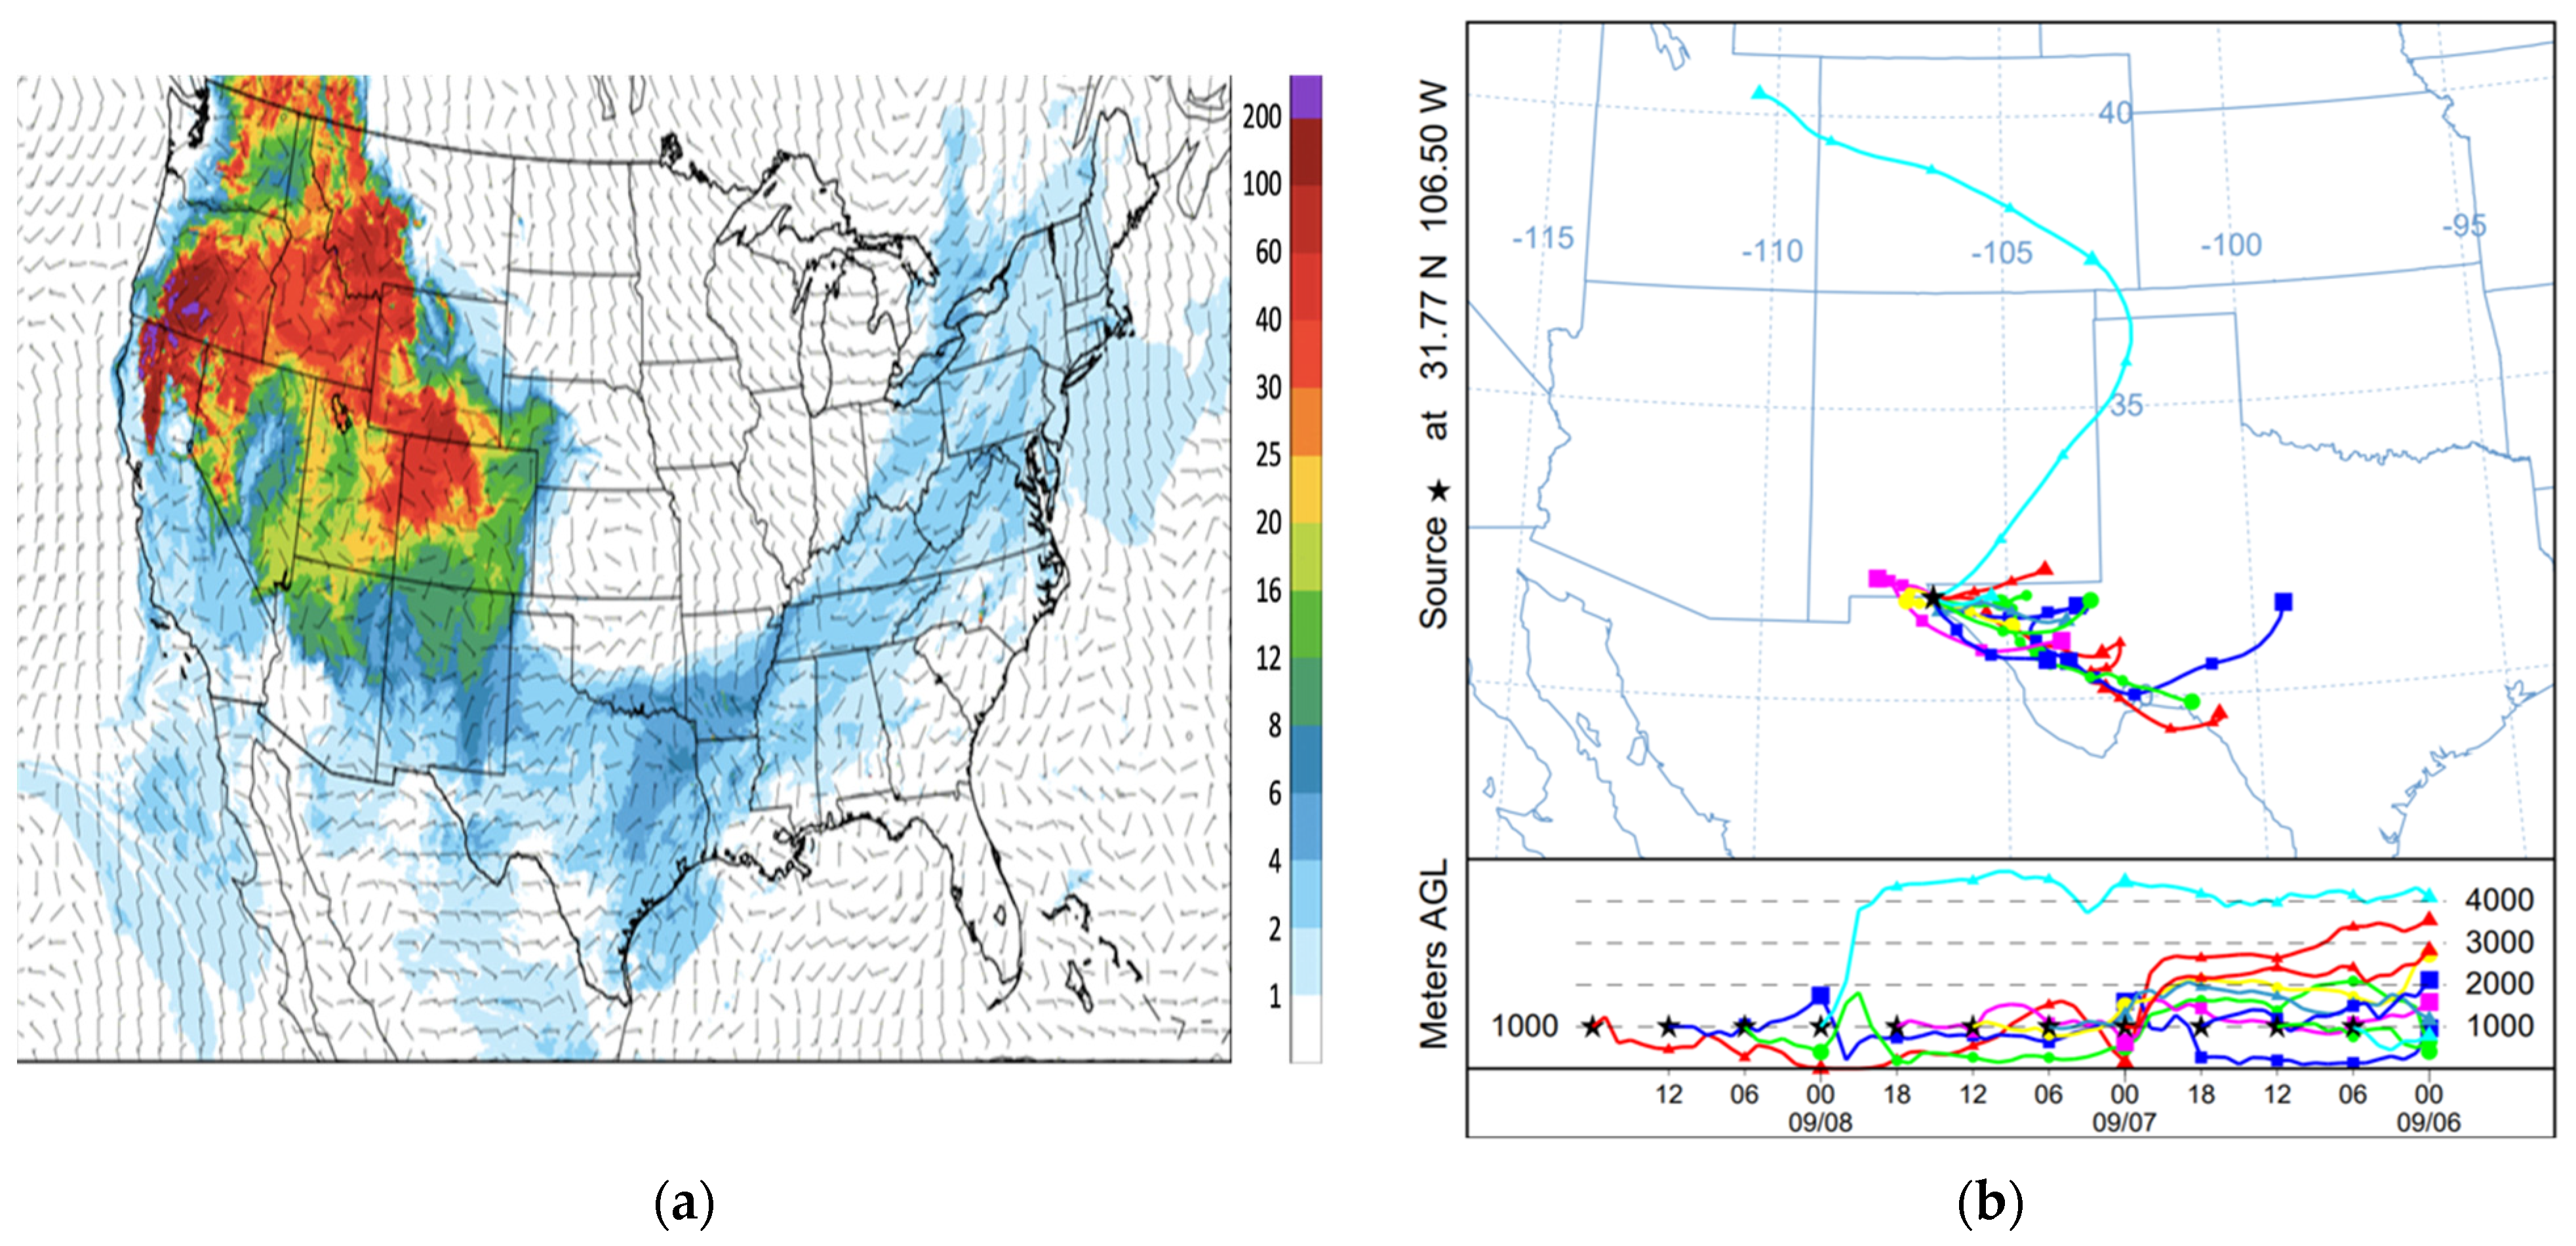
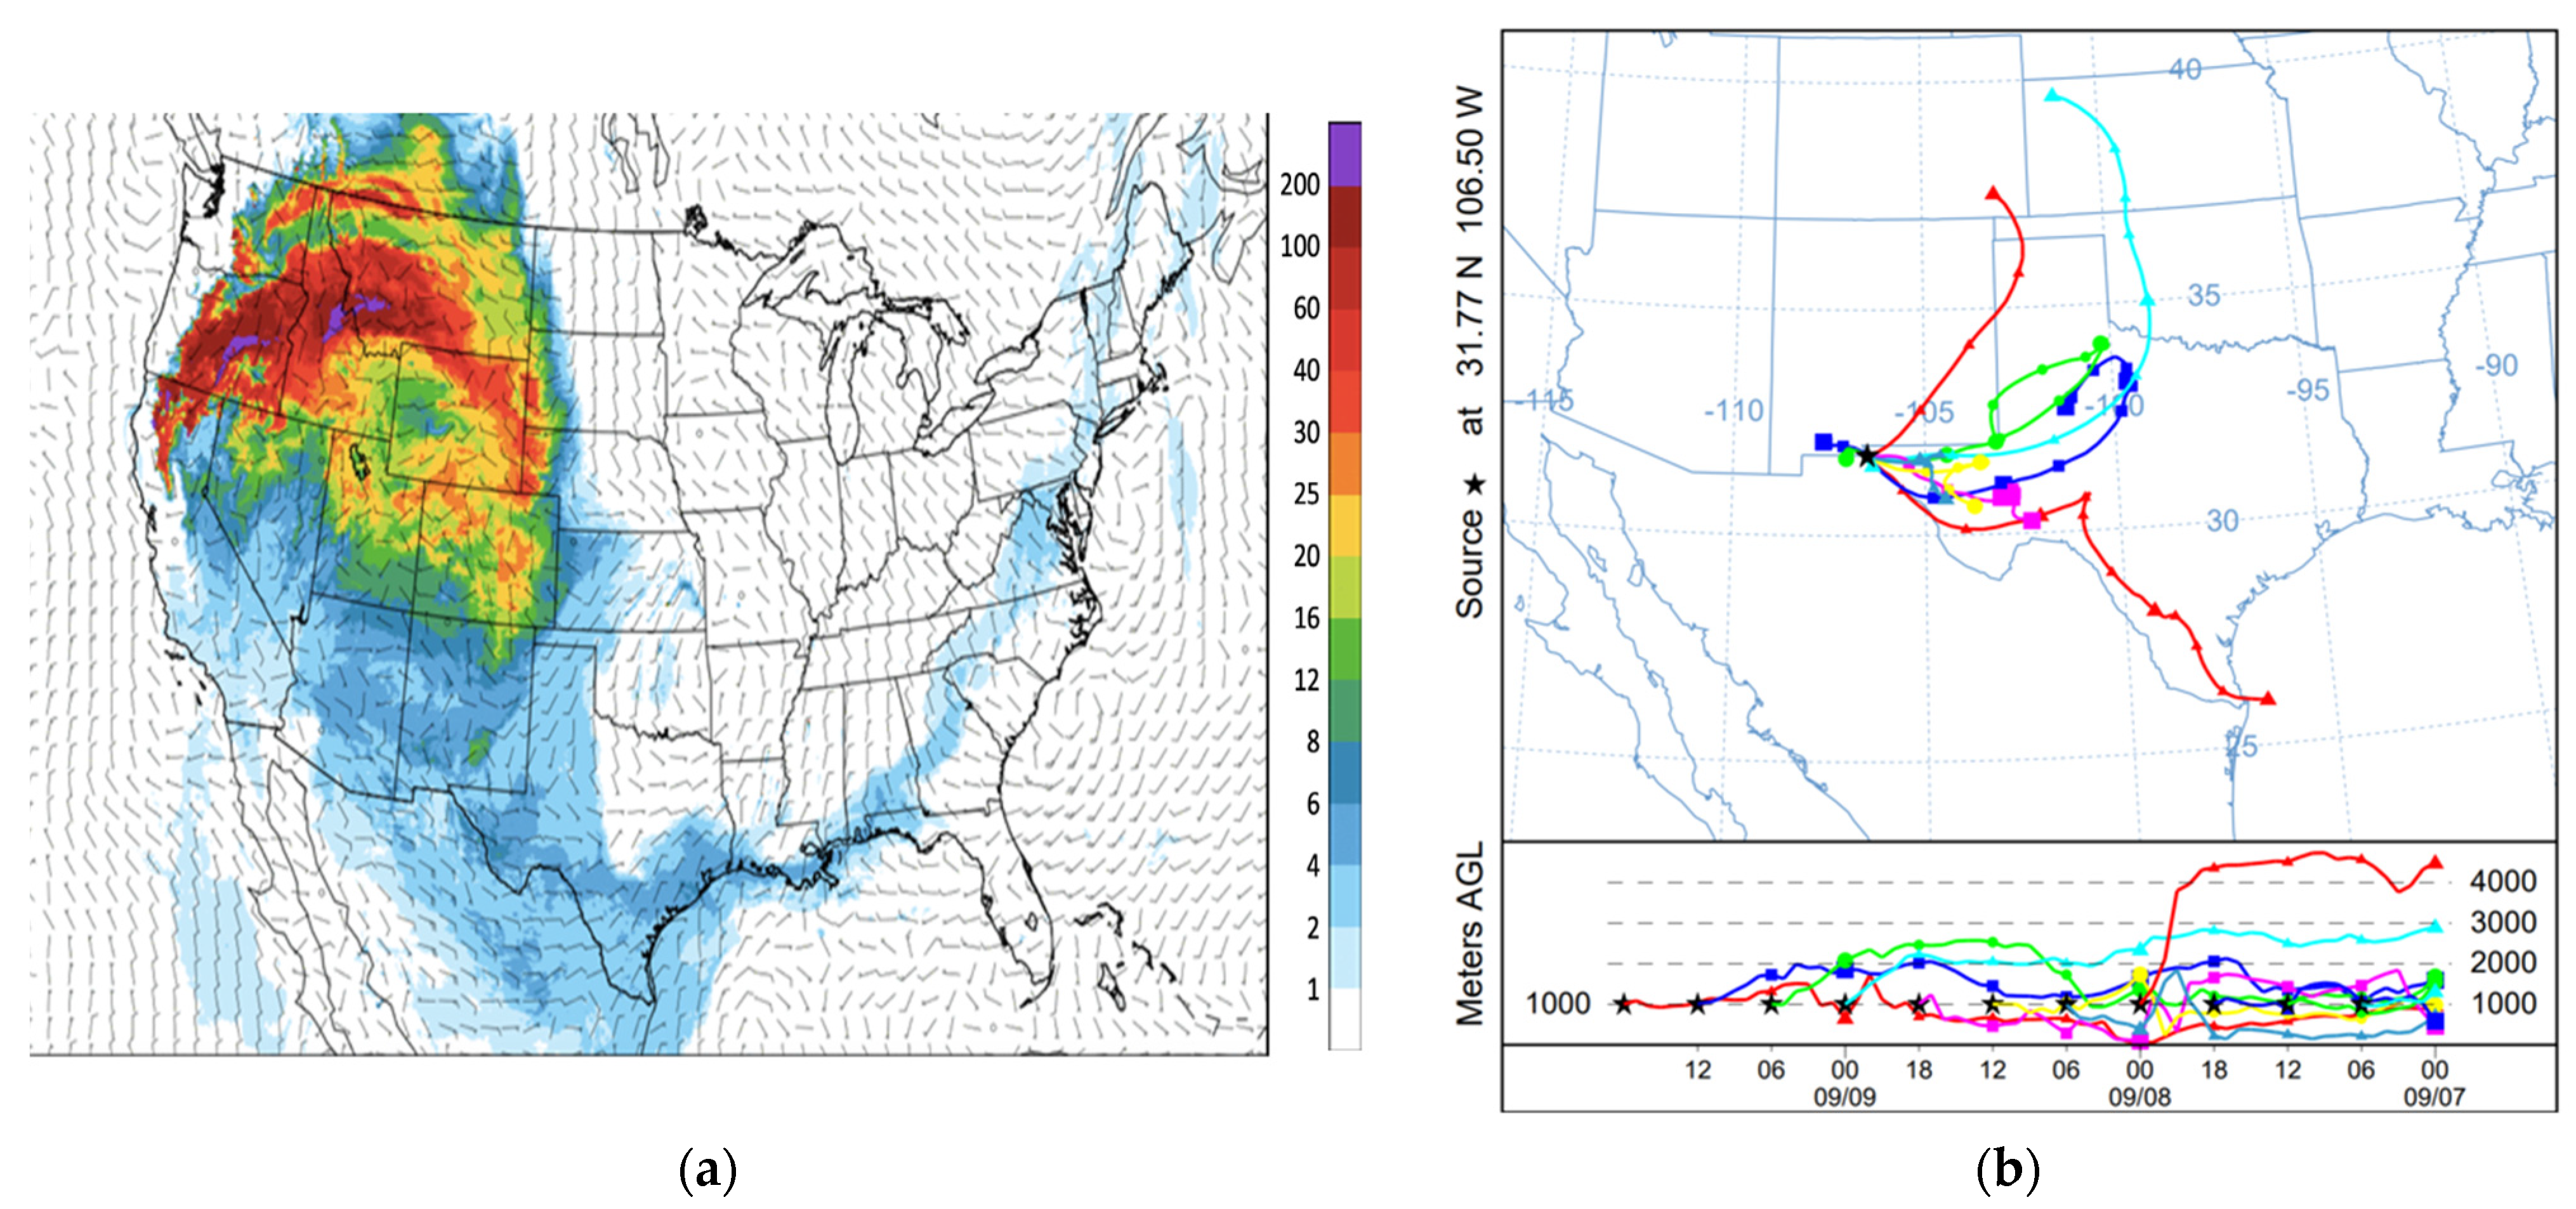
3.2.2. HRRR and HYSPLIT for the Wildfire Event Days

Smoke from the wildfires tends to travel long distances from the source via long-distance transport, affecting local air quality in downwind areas. The HRRR wildfire smoke maps (Figure 12a and Figure 13a) were evaluated for each event day and show the wildfire origin and smoke cloud dispersion. We consider it an event day when the model-simulated smoke plumes arrived at the El Paso-Ciudad Juarez airshed. The HRRR mapshows a high PM2.5 surface mass concentration in the states to the northwest of the area under study. As per the color scale of the HRRR map, El Paso received an average of 2 to 8 μg m−3 of PM2.5 during the event days. The HYSPLIT air parcel trajectory report is shown in Figure 12b and Figure 13b, and each graph contains 72-h backward trajectories from the study location (UTEP), with a new trajectory every 6 h. The HYSPLIT trajectories ensured that the air masses arriving in the study area could be associated with a region with high levels of wildfire smoke. The source of air masses was identified by visually inspecting the HRRR maps showing high concentrations of smoke and HYSPLIT backward trajectories. Figure 12b depicts a backward trajectory (light blue) that began on 6 September 2021, at around 4 km (free troposphere) above ground level and descended to about 1 km (within the PBL) as it approached the study region on 9 September 2021. The HRRR map for 8 September 2021 shows significant concentrations of wildfire smoke in those states.
Similarly, as shown in Figure 13b, two backward trajectories, light blue and red, from 7 September 2021, at the height of around 4 and 3 km, respectively, descended to lower elevations as they approached the El Paso region. Therefore, based on these backward trajectories, the smoke detected by the instruments (both UTEP and TCEQ CAMS) was associated with air masses from western and northwestern US states.

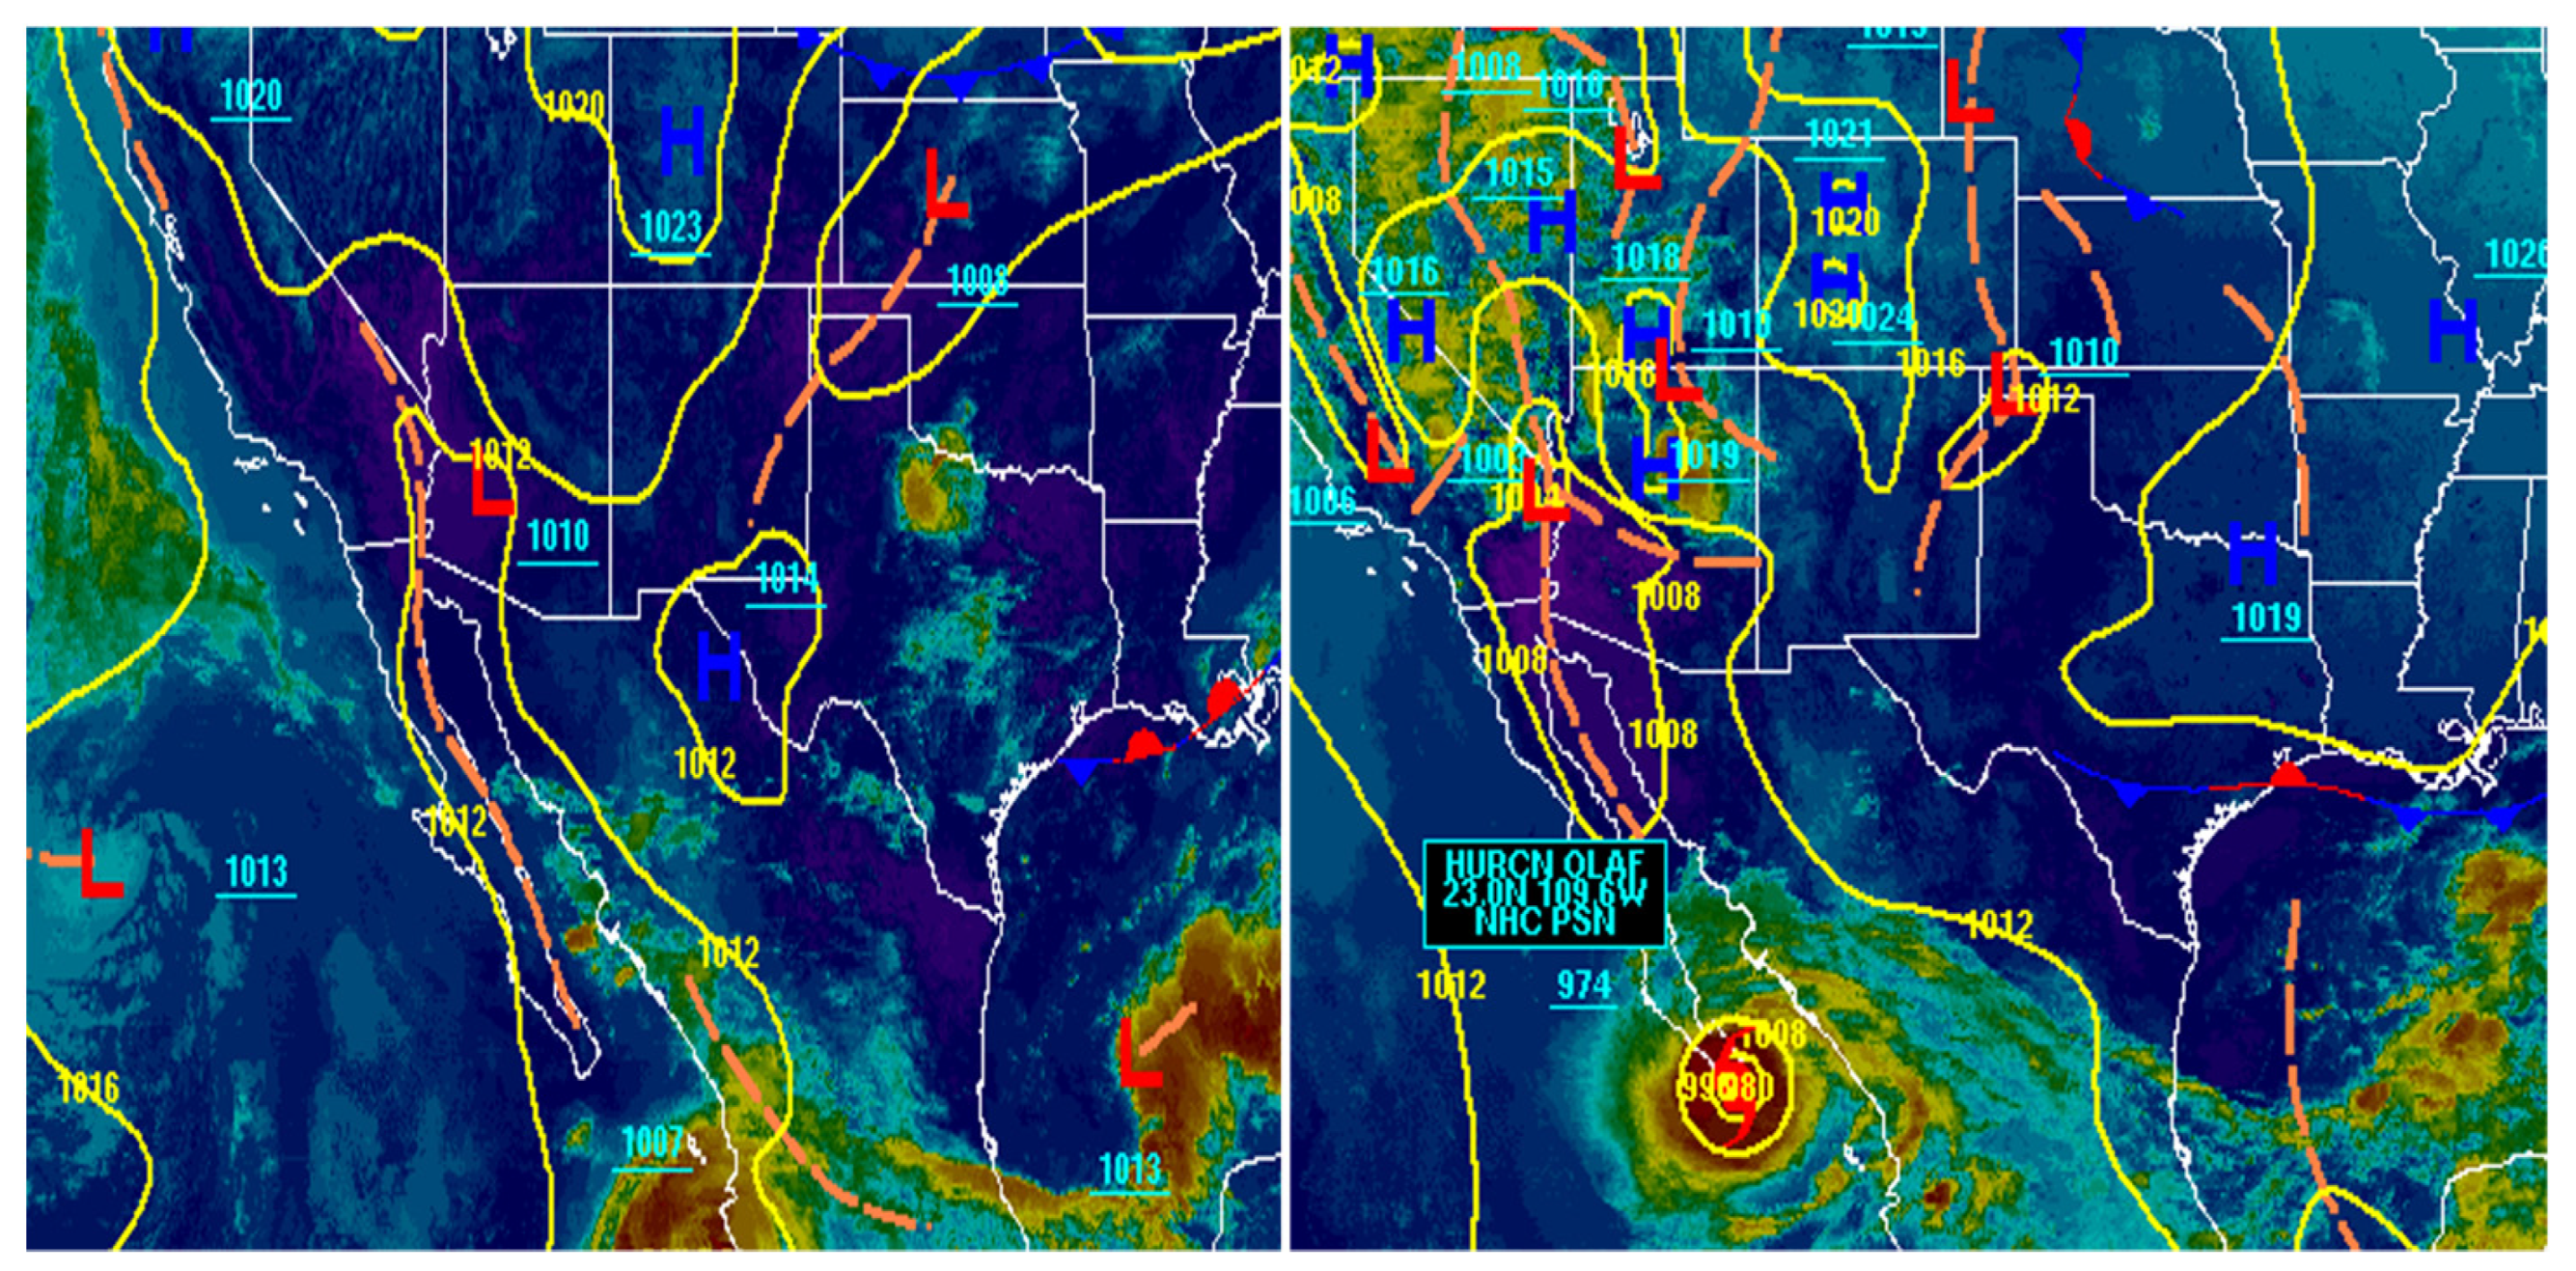
3.2.3. Composite Synoptic Conditions and PBL Structure during the Wildfire Exceedance Events

Synoptic conditions play a significant role in pollution accumulation and its dispersion in the El Paso Juarez region [2,3,37]. Smoke particles in the free troposphere could be transported to lower altitudes by synoptic subsidence and potentially enter the PBL through an entrainment process. Subsequently, turbulence within the PBL mixes these smoke particles, resulting in higher pollutant concentrations recorded by the ground stations. The BC and BrC exceedance episodes locally observed due to wildfires in the north and northwestern states can be linked to two unique synoptic situations during the study period. The first situation was distinguished by a high-pressure system over and to the north-northwest of the study region, which resulted in a stable atmospheric condition and shallow PBLHs. This stable condition is the most common and favorable synoptic scenario linked with severe pollution episodes in the region during the summer months [38]. The circulations linked with the formation and presence of hurricane Olaf near the south of Baja California were the second synoptic scenario during the study period. The stagnant conditions caused by the lower PBLHs, and calm surface winds associated with these synoptic conditions, resulted in high EBC concentration levels in this area.
The composite synoptic maps were obtained from NOAA’s National Weather Prediction Center (WPC) for each of the above-described synoptic situations during the EBC exceedance days. Figure 14 (left) shows the presence of a high-pressure system over the study area leading to stable atmospheric conditions and sinking motion resulting in suppression of the PBL growth. Additionally, in Figure 14 (right), we observe the stable conditions prevalent over the south of New Mexico and west and Southwest of Texas due to the presence of hurricane Olaf near the southern tip of Baja California. The high-pressure system in the north and northwest and the low-pressure system (hurricane Olaf) in the Southwest gave rise to circulation patterns both on the surface and aloft, as seen in Figure 12 and Figure 13, carrying the wildfire smoke to this region.
Backscatter profiles for 6 and 7 September 2021 obtained from the Vaisala ceilometer can be seen in Figure 15. A strong backscattered intensity (green profile) indicating the significant presence of particles was observed. The PBLHs are indicated by the dark green dots in the figure. The black dots around 2 am LST on 6 September are cloud base heights. The residual layer of 5 and 6 September 2021 was deeper (1 km and 2 km, respectively) than the convective boundary layer on the following days, i.e., 6 and 7 September 2021. On 6 September, the convective boundary layer merged with the deep residual layer shortly after it formed around 6 am. Compared to September 6, when the maximum daytime PBLH can be visually observed around 1.5 km, the PBL appeared to be shallow (maximum daytime height around 0.75 km) on 7 September, impacting the local air quality. This daily variation in the PBLH was mainly attributed to the high-pressure region over the study area, as already pointed out in Figure 14.

4. Discussion and Conclusions

The absorption coefficients were measured with two Photoacoustic Extinctiometers (PAX 405 nm and PAX 870 nm) to study the Babs due to black and brown carbon. The winter and wildfire summer seasons in El Paso—Ciudad Juarez airsheds have specific season-related behavior that increased the amounts of Babs due to EBC and BrC from a baseline. This baseline was formed by the heavy international bridges vehicular traffic and by the brick kilns in Ciudad Juarez. A well-established methodology to extract the brown carbon Babs from the PAX 870 and PAX 405 was used. The winter season in this study (January 2022) showed that the Babs of black and brown carbon was caused by biomass burning in Ciudad Juarez, such as for the brick kilns, heavy traffic, and crossing time between cities. Black carbon is emitted from higher temperature combustion than brown carbon. The ratio of black carbon to brown carbon concentrations may be an indicator of the relative ratio of anthropogenic carbonaceous particulate emissions to wildfire emissions and this is a question for future research. The measured Babs formed a baseline. It was found that for the local time segment between 3:00 PM and midnight, a considerable increment in the Babs of black and brown carbon was present. The increment was determined to be due to the burning of wood, charcoal, and other biomasses as an alternative space-heating system and open wood burning for meals’ cooking during the colder winter season among the economically disadvantaged households in Ciudad Juarez. From the PAX 405 nm, Babs due to black carbon during this time segment increased by 266% from the baseline of the morning measurements. From the PAX 870 nm, Babs due to black carbon during this time segment increased 270% from the morning measurements. Finally, the brown carbon Babs for the discussed time segment increased by 154% from the baseline present in the morning measurements. When determining the percentages of the Babs due to black and brown carbon present in the atmosphere, we calculated that 53.74% (±16.5%) of the total Babs (Babs) measured by PAX corresponded to the absorption of brown carbon particles. The TCEQ carbon monoxide graph behavior correlated well with our findings as a notorious rise of the averaged values for the late evening time segment was present in agreement with the literature. The single scattering albedo and the Absorption Ångstrom exponent for the season were also calculated. Both results were in accord with the presence of black and brown carbon particles in the atmosphere.
The wildfire season characterization was facilitated by the extensive wildfire seasonal occurrences on the US West Coast. Given the right atmospheric conditions as stated in Section 3.2.3, we concluded that smoke plumes from these wildfires were transported to our region on eighteen separate occasions (event days). This assertion was endorsed by the HRRR and HYSPLIT platforms. From the PAX 870 nm, mass concentration (µg/m3) due to EBC particles were obtained. It was determined that the West Coast wildfires added more than 58% of the total calculated mass concentration due to EBC in our airshed. Similarly, to the winter season defined in this paper, we also calculated a baseline for the summer season. The PAX 870 nm Babs showed values ranging between 0.6639 and 1.003 per megameter, with an average of 0.8462 ± 0.471 (1/Mm). In contrast, the PAX 405 nm Babs ranged between 3.860 and 7.658 per megameter, with an average of 5.852 ± 1.702 (1/Mm). This baseline had the same sources as the Winter’s, mainly the particulate emissions of the commercial and vehicles waiting to cross between El Paso and Ciudad Juarez. From the eighteen wildfire event days, the Babs due to EBC measured with the PAX 870 nm averaged 2.929 ± 1.823 (1/Mm), signifying a 346% increment from its baseline, and the Babs derived from the PAX 405 nm averaged 11.43 ± 4.895 (1/Mm) with a 195% increment from its baseline. The BrC Babs average for event days was 5.189 ± 1.665 (1/Mm) and 3.773 ± 0.756 (1/Mm) for non-event days, implying a 137% increment. The single scattering albedo and the Ångstrom exponent for the selected wildfire season were also calculated. We observed that the Absorption Angstrom Exponent (AAE) for the summer wildfire season becomes smaller, in particular for particles with mean diameters larger than 0.12 μm, which is symptomatic that the BC particles that arrive in the El Paso region are aged.
We discussed the synoptic conditions associated with the EBC and BrC exceedances at the research site. The atmospheric conditions were predominantly stable due to prevalent synoptic conditions on those days. Growth of the PBL was restricted due to the stable conditions caused by the high-pressure system over the region. Lower PBL affected the vertical dispersion of the pollutants resulting into an increase in concentrations. The circulation patterns resulted as high-pressure systems in the north and low-pressure systems in the south of the study area advected large smoke concentrations from the wildfire emission sources in the west of the US to the research site. The detailed analysis of September 6, 7 and 9 highlights the consequences of the synoptic-scale meteorological conditions and regional PBLHs, leading to detection of wildfire smoke in the El Paso-Juarez region.
Finally, the El Paso–Juárez metropolitan area is a diverse socio-economic area and is the United States’ second-largest majority Hispanic city. The effect of seasonal, meteorological variations on particulate matter concentrations will aid in assessing the impact of climate change on desert regions, such as the El Paso-Juárez region with its diverse population.

Author Contributions

Conceptualization, R.M.F. and P.L.; methodology, P.L. and R.M.F.; software, P.L.; validation, P.L., R.M.F., N.N.K., M.M., D.B. and W.R.S.; formal analysis, P.L., R.M.F., D.B. and W.R.S.; investigation, P.L., N.N.K., M.M., J.T. and R.M.F.; resources, P.L., N.N.K. and R.M.F.; data curation, P.L. and M.M.; writing—original draft preparation, P.L. and N.N.K.; writing—review and editing, R.M.F., D.B. and W.R.S.; visualization, P.L.; supervision, R.M.F.; project administration, R.M.F.; funding acquisition, R.M.F. All authors have read and agreed to the published version of the manuscript.

Funding

This research was supported by the NOAA/Educational Partnership Program under Cooperative Agreement #NA16SEC4810006 and the NOAA Cooperative Science Center in Atmospheric Sciences and Meteorology (NCAS-M).

Institutional Review Board Statement

Not applicable.

Informed Consent Statement

Not applicable.

Data Availability Statement

Not applicable.

Acknowledgments

To the NOAA Center for Atmospheric Science-Meteorology (NCAS-M), which is funded by the National Atmospheric Administration/Educational Partnership Program under cooperative Agreement #NA16SEC4810006. The authors wish to acknowledge Joshua Schwarz and Joseph Katich, from NOAA Atmospheric Composition and Climate Processes, ACCP, Chemical Science Laboratory, for being Lara’s NERTO mentor and for their continued intellectual support. The authors also wish to thank Eddie Moderow and Fernando Mercado from the Texas Commission on Environmental Quality (TCEQ) for their intellectual and financial grant support.

Conflicts of Interest

The authors declare no conflict of interest. The funders had no role in the design of the study; in the collection, analyses, or interpretation of data; in the writing of the manuscript, or in the decision to publish the results.

References

  1. Polanco Gonzalez, J. An Improved Method for Optical Characterization of Mineral Dust and Soot Particles in the El Paso-Juárez Airshed. Available online: http://148.210.21.170/handle/20.500.11961/16767 (accessed on 2 November 2021).
  2. Karle, N.N. Studies of the Planetary Boundary Layer and Their Impact on Air Pollution in a Semi-Arid Region with Complex Terrain. Ph.D. Thesis, The University of Texas at El Paso, El Paso, TX, USA, 2021. [Google Scholar]
  3. Karle, N.N.; Mahmud, S.; Sakai, R.K.; Fitzgerald, R.M.; Morris, V.R.; Stockwell, W.R. Investigation of the Successive Ozone Episodes in the El Paso–Juarez Region in the Summer of 2017. Atmosphere 2020, 11, 532. [Google Scholar] [CrossRef]
  4. Petzold, A.; Ogren, J.A.; Fiebig, M.; Laj, P.; Li, S.-M.; Baltensperger, U.; Holzer-Popp, T.; Kinne, S.; Pappalardo, G.; Sugimoto, N.; et al. Recommendations for reporting “black carbon” measurements. Atmos. Chem. Phys. 2013, 13, 8365–8379. [Google Scholar] [CrossRef]
  5. Grange, S.K.; Lötscher, H.; Fischer, A.; Emmenegger, L.; Hueglin, C. Evaluation of equivalent black carbon source apportionment using observations from Switzerland between 2008 and 2018. Atmos. Meas. Tech. 2020, 13, 1867–1885. [Google Scholar] [CrossRef]
  6. Andreae, M.O.; Gelencsér, A. Black Carbon or Brown Carbon? The Nature of Light-Absorbing Carbonaceous Aerosols. Atmos. Chem. Phys. 2006, 6, 3131–3148. [Google Scholar] [CrossRef]
  7. Esparza, A.E.; Fitzgerald, R.M.; Gill, T.E.; Polanco, J. Use of Light-Extinction Method and Inverse Modeling to Study Aerosols in the Paso Del Norte Airshed. Atmos. Environ. 2011, 45, 7360–7369. [Google Scholar] [CrossRef]
  8. Fitzgerald, R.M.; Karle, N.N.; Lara, P.; Polanco Gonzalez, J.; Stockwell, W.R. Optical Measurements of Particulate Matter in the El Paso-Juarez Region: Natural Mineral Dust and Soot. Environ. Manag. 2021, 2, 11–19. [Google Scholar] [CrossRef]
  9. Yan, J.; Wang, X.; Gong, P.; Wang, C.; Cong, Z. Review of Brown Carbon Aerosols: Recent Progress and Perspectives. Sci. Total Environ. 2018, 634, 1475–1485. [Google Scholar] [CrossRef]
  10. Künzi, L.; Mertes, P.; Schneider, S.; Jeannet, N.; Menzi, C.; Dommen, J.; Baltensperger, U.; Prévôt, A.S.H.; Salathe, M.; Kalberer, M.; et al. Responses of Lung Cells to Realistic Exposure of Primary and Aged Carbonaceous Aerosols. Atmos. Environ. 2013, 68, 143–150. [Google Scholar] [CrossRef]
  11. Stewart, D.R.; Saunders, E.; Perea, R.A.; Fitzgerald, R.; Campbell, D.E.; Stockwell, W.R. Linking Air Quality and Human Health Effects Models: An Application to the Los Angeles Air Basin. Environ. Health Insights 2017, 11, 1178630217737551. [Google Scholar] [CrossRef]
  12. Hand, J.L.; Kreidenweis, S.M.; Eli Sherman, D.; Collett, J.L.; Hering, S.V.; Day, D.E.; Malm, W.C. Aerosol Size Distributions and Visibility Estimates during the Big Bend Regional Aerosol and Visibility Observational (BRAVO) Study. Atmos. Environ. 2002, 36, 5043–5055. [Google Scholar] [CrossRef]
  13. Yang, M.; Howell, S.G.; Zhuang, J.; Huebert, B.J. Attribution of Aerosol Light Absorption to Black Carbon, Brown Carbon, and Dust in China–Interpretations of Atmospheric Measurements during EAST-AIRE. Atmos. Chem. Phys. 2009, 9, 2035–2050. [Google Scholar] [CrossRef]
  14. Kamm, S.; Möhler, O.; Naumann, K.-H.; Saathoff, H.; Schurath, U. The Heterogeneous Reaction of Ozone with Soot Aerosol. Atmos. Environ. 1999, 33, 4651–4661. [Google Scholar] [CrossRef]
  15. Ammann, M.; Kalberer, M.; Jost, D.T.; Tobler, L.; Rössler, E.; Piguet, D.; Gäggeler, H.W.; Baltensperger, U. Heterogeneous Production of Nitrous Acid on Soot in Polluted Air Masses. Nature 1998, 395, 157–160. [Google Scholar] [CrossRef]
  16. Vedal, S.; Dutton, S.J. Wildfire Air Pollution and Daily Mortality in a Large Urban Area. Environ. Res. 2006, 102, 29–35. [Google Scholar] [CrossRef] [PubMed]
  17. Chalbot, M.-C.; Kavouras, I.G.; Dubois, D.W. Assessment of the Contribution of Wildfires to Ozone Concentrations in the Central US-Mexico Border Region. Aerosol Air Qual. Res. 2013, 13, 838–848. [Google Scholar] [CrossRef]
  18. June, N.A.; Hodshire, A.L.; Wiggins, E.B.; Winstead, E.L.; Robinson, C.E.; Thornhill, K.L.; Sanchez, K.J.; Moore, R.H.; Pagonis, D.; Guo, H.; et al. Aerosol Size Distribution Changes in FIREX-AQ Biomass Burning Plumes: The Impact of Plume Concentration on Coagulation and OA Condensation/Evaporation. Atmos. Chem. Phys. Discuss. 2022, 1–35. [Google Scholar] [CrossRef]
  19. Claudia, C. Characterization of Temperature Profiles in a Thermodenuder. UC Davis Undergrad. Res. J. 2013, 15, 1–7. [Google Scholar]
  20. Karle, N.; Mahmud, S.; Fitzgerald, R.; Estes, M.; Walter, P.; Morris, G. Analysis of Boundary Layer Heights Using Ceilometer and Models in the El Paso-Juarez Airshed. In Proceedings of the 101st American Meteorological Society Annual Meeting, Online, 10–15 January 2021. [Google Scholar]
  21. Washenfelder, R.A.; Flores, J.M.; Brock, C.A.; Brown, S.S.; Rudich, Y. Broadband measurements of aerosol extinction in the ultraviolet spectral region. Atmos. Meas. Tech. 2013, 6, 861–877. [Google Scholar] [CrossRef]
  22. Kelly, K.; Wagner, D.; Lighty, J.; Núñez, M.Q.; Vazquez, F.A.; Collins, K.; Barud-Zubillaga, A. Black Carbon and Polycyclic Aromatic Hydrocarbon Emissions from Vehicles in the United States–Mexico Border Region: Pilot Study. J. Air Waste Manag. Assoc. 2006, 56, 285–293. [Google Scholar] [CrossRef]
  23. Shi, Y.; Murr, L.E.; Soto, K.F.; Lee, W.-Y.; Guerrero, P.A.; Ramirez, D.A. Characterization and Comparison of Speciated Atmospheric Carbonaceous Particulates and Their Polycyclic Aromatic Hydrocarbon Contents in the Context of the Paso Del Norte Airshed Along the U.s.-Mexico Border. Polycycl. Aromat. Compd. 2007, 27, 361–400. [Google Scholar] [CrossRef]
  24. Raysoni, A. Assessment of Intra-Urban Traffic-Related Air Pollution on Asthmatic Children’s Exposure at Schools in the Paso Del Norte Region. Ph.D. Thesis, University of Texas at El Paso, El Paso, TX, USA, 2011. Available online: https://scholarworks.utep.edu/open_etd/2566/ (accessed on 5 July 2022).
  25. Avitia, A.Y.C.; De la Mora Covarrubias, A. Environmental Assessment of Brick Kilns in Chihuahua State, México, Using Digital Cartography. Funct. Ecosyst. 2012, 14, 261–281. [Google Scholar]
  26. Montoya, T.; Guarian, P.L.; Velazquez-Angulo, G.; Corella-Barud, V.; Rojo, A.; Graham, J.P. Carbon Monoxide Exposure in Households in Ciudad Juarez, Mexico. Int. J. Hyg. Environ. Health 2008, 211, 40–49. [Google Scholar] [CrossRef]
  27. Kirchstetter, T.W.; Novakov, T.; Hobbs, P.V. Evidence That the Spectral Dependence of Light Absorption by Aerosols is Affected by Organic Carbon. J. Geophys. Res. 2004, 109, D21208. [Google Scholar] [CrossRef]
  28. Lack, D.A.; Langridge, J.M. On the Attribution of Black and Brown Carbon Light Absorption Using the Ångström Exponent. Atmos. Chem. Phys. 2013, 13, 10535–10543. [Google Scholar] [CrossRef]
  29. Zhang, G.; Peng, L.; Lian, X.; Lin, Q.; Bi, X.; Chen, D.; Li, M.; Li, L.; Wang, X.; Sheng, G. An Improved Absorption Angstrom Exponent (AAE)-Based Method for Evaluating the Contribution of Light Absorption from Brown Carbon with High-Time Resolution. Aerosol Air Qual. Res. 2019, 19, 15–24. [Google Scholar] [CrossRef]
  30. Liu, C.; Chung, C.E.; Yin, Y.; Schnaiter, M. The Absorption Ångström Exponent of Black Carbon: From Numerical Aspects. Atmos. Chem. Phys. 2018, 18, 6259–6273. [Google Scholar] [CrossRef]
  31. Stein, A.F.; Draxler, R.R.; Rolph, G.D.; Stunder, B.J.B.; Cohen, M.D.; Ngan, F. NOAA’s HYSPLIT Atmospheric Transport and Dispersion Modeling System. Bull. Am. Meteorol. Soc. 2015, 96, 2059–2077. [Google Scholar] [CrossRef]
  32. Liu, Y.; He, G.; Chu, B.; Ma, Q.; He, H. Atmospheric heterogeneous reactions on soot: A review. Fundam. Res. 2022. preprint. [Google Scholar] [CrossRef]
  33. Baumgardner, D.G.; Raga, O.; Peralta, I.; Rosas, T.; Castro, T.; Kuhlbusch, A.; John, A.; Petzold, A. Diagnosing Black Carbon Trends in Large Urban Areas Using Carbon Monoxide Measurements. J. Geophys. Res. 2022, 107, ICC-4. [Google Scholar] [CrossRef]
  34. Bond, T.C.; Bergstrom, R.W. Light Absorption by Carbonaceous Particles: An Investigative Review. Aerosol Sci. Technol. 2006, 40, 27–67. [Google Scholar] [CrossRef]
  35. Takemura, T.; Nakajima, T.; Dubovik, O.; Holben, B.N.; Kinne, S. Single-Scattering Albedo and Radiative Forcing of Various Aerosol Species with a Global Three-Dimensional Model. J. Clim. 2002, 15, 333–352. [Google Scholar] [CrossRef]
  36. Schuster, G.; Dubovik, O.; Holben, B.N. Angstrom Exponent and Bimodal Aerosol Size Distribution. J. Geophys. Res. 2006, 111, D07207. [Google Scholar] [CrossRef]
  37. Karle, N.N.; Fitzgerald, R.M.; Sakai, R.K.; Sullivan, D.W.; Stockwell, W.R. Multi-Scale Atmospheric Emissions, Circulation and Meteorological Drivers of Ozone Episodes in El Paso- Juárez Airshed. Atmosphere 2021, 12, 1575. [Google Scholar] [CrossRef]
  38. Einfeld, W.; Church, H.W.; Yarbrough, J.W. Winter Season Air Pollution in El Paso-Ciudad Juarez; Region VI, Air, Pesticides & Toxics Division; US Environmental Protection Agency: Washington, DC, USA, 1995.
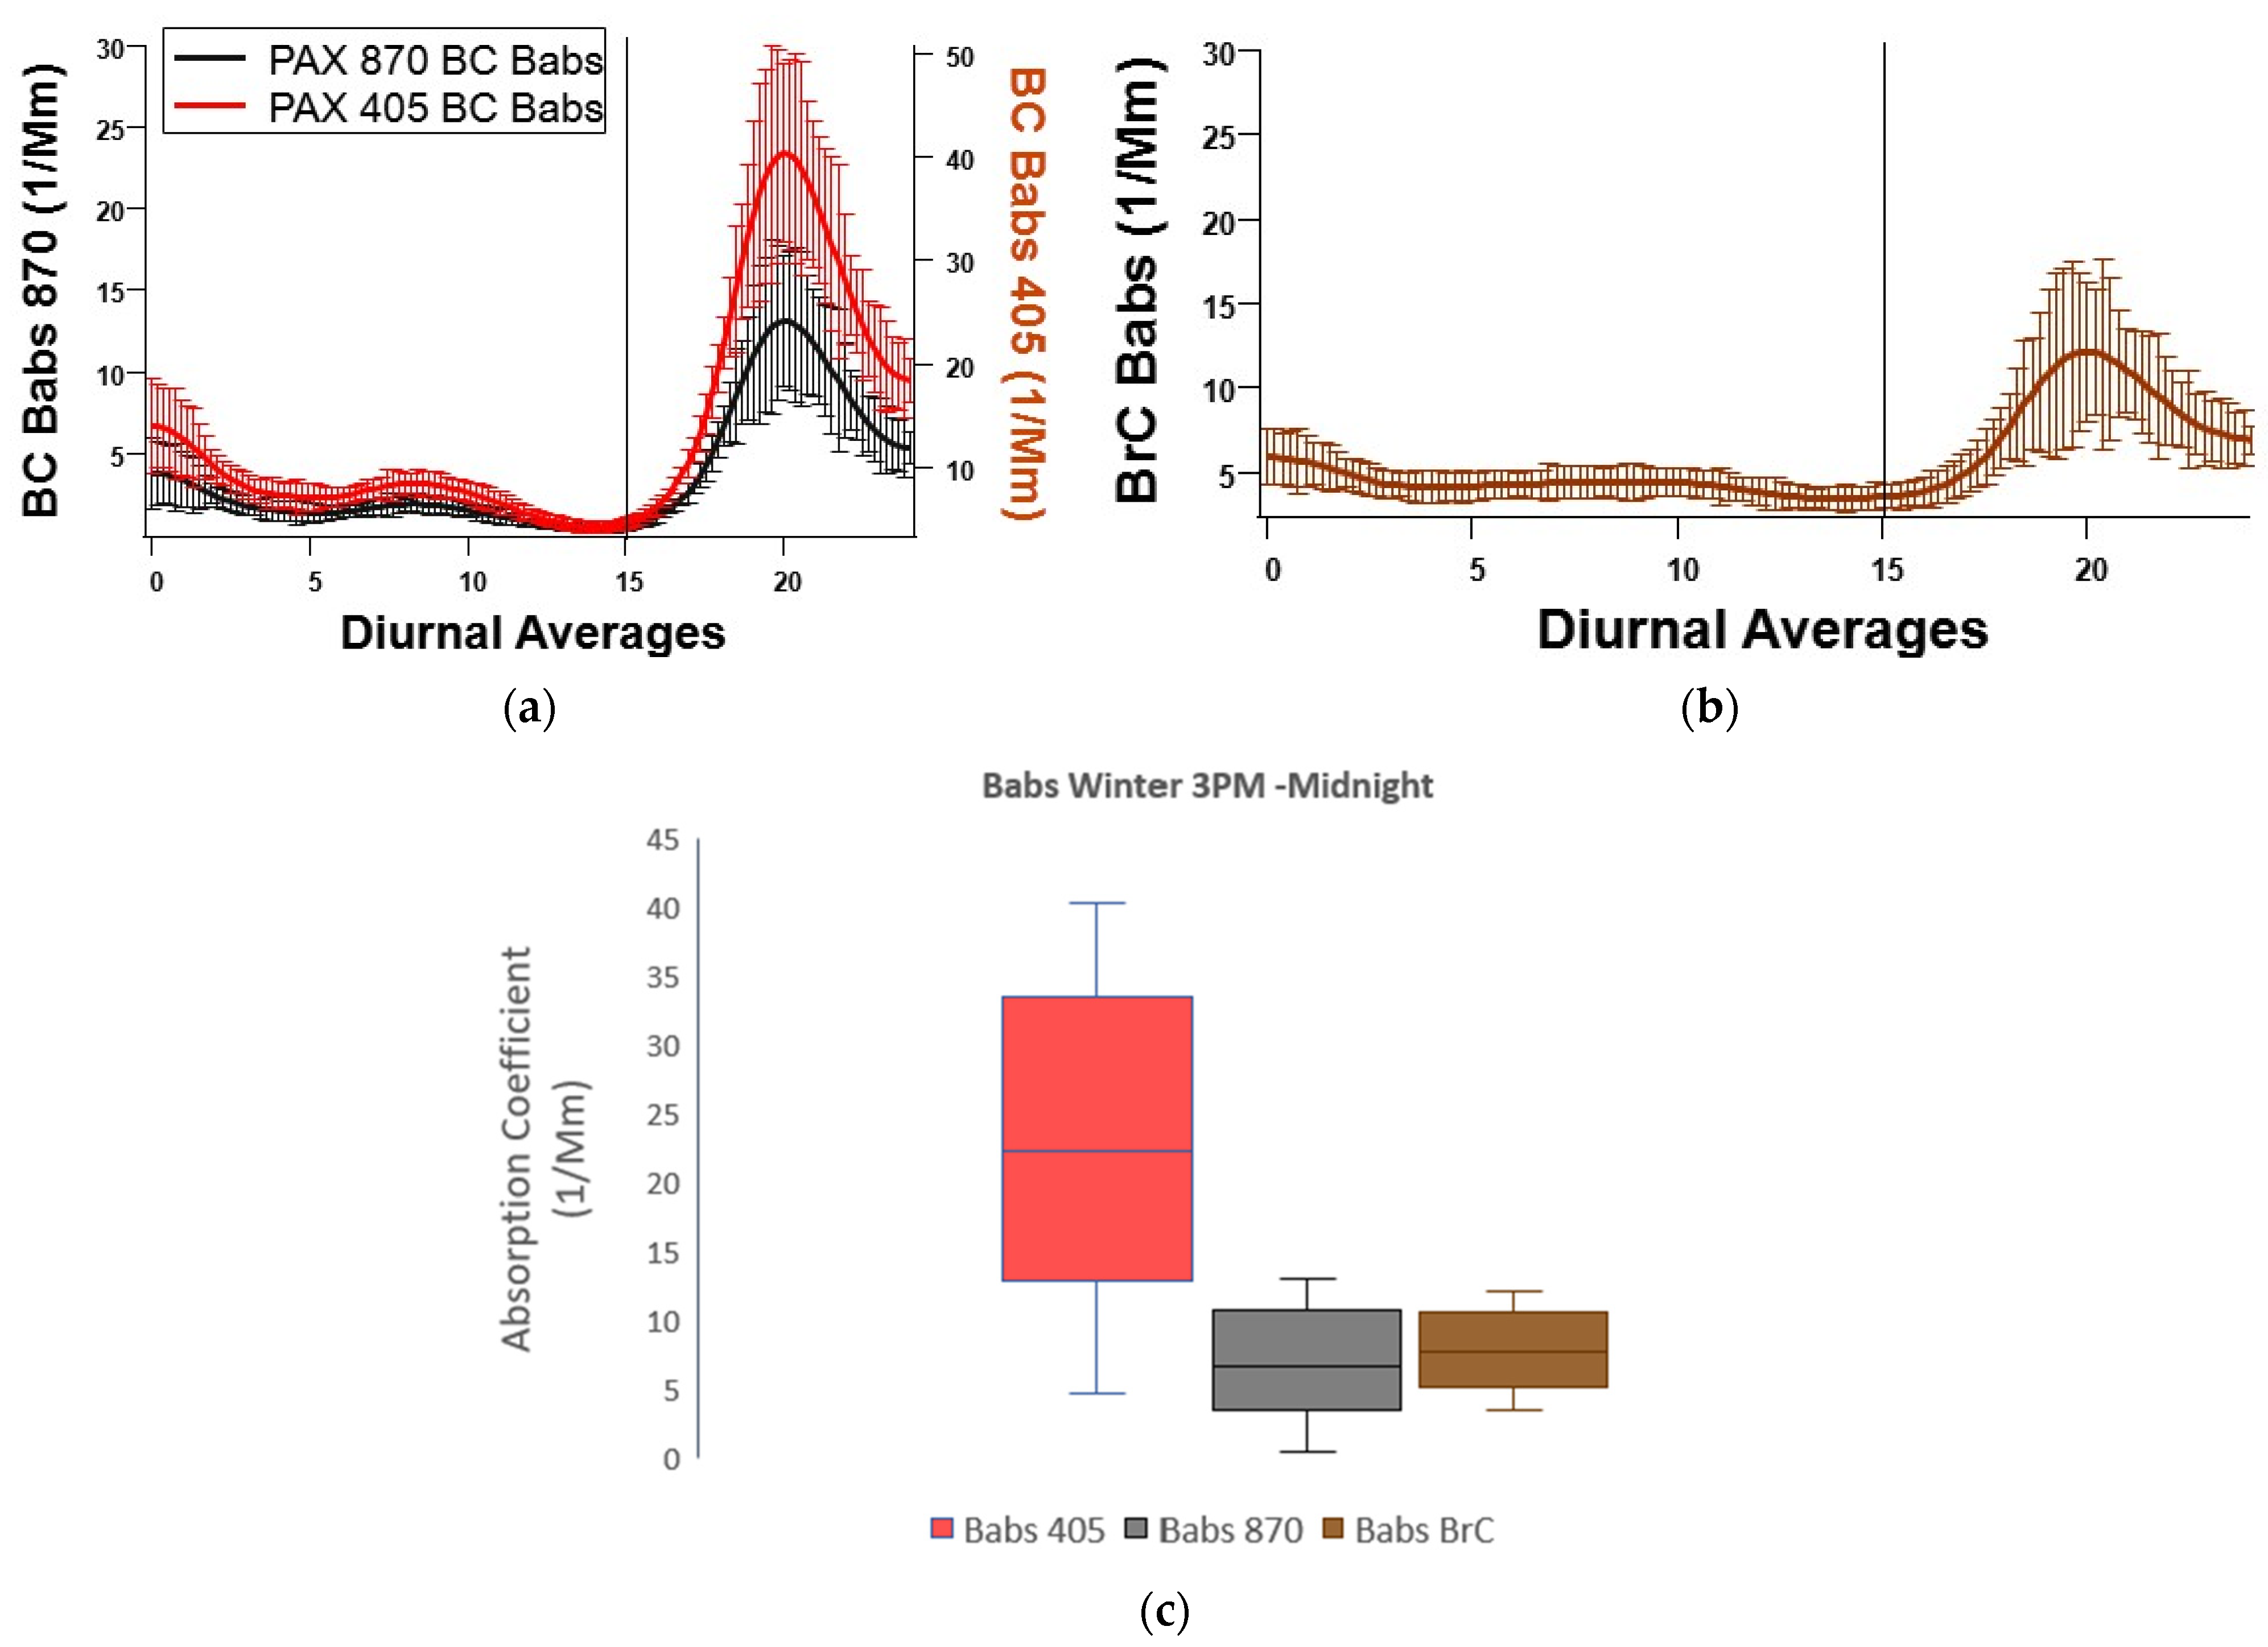
Figure 1. A schematic of an extinctiometer, combining a nephelometer and a photoacoustic spectrometer. The green arrows show the airflow. The instruments’ manual indicates a nominal flow rate of 1.0 L/min ± 10% at 21 °C and 1 atm.
Atmosphere 13 01201 g001
Figure 2. PAX 870 nm and PAX 405 nm Babs due to BC (a) and BrC (b). Each hour (x-axis) represents daily averages calculated over January 2022. The error bars represent the standard error for each point average. The graphs have a smoothing filter applied (binomial smoothing by Wave Metrics Igor Pro 8 platform). The vertical line at 15 h (3:00 PM) divides baseline Babs output from the eventful behaviors driven by an increase in biomass burning during late evenings. The boxplot (c) represents the spread of the data at 10 min average.
Atmosphere 13 01201 g002
Figure 3. Carbon monoxide molar mixing ratios in parts per million by volume diurnally averaged over January 2022 data from the Texas Commission on Environmental Quality monitoring station at Chamizal National Park, CAM41. The graph has been temperature-coded, with the lowest temperatures toward the blue-purple ends and higher temperatures toward the orange red. After 4:00 PM the temperatures start to decrease, and the CO concentration increases.
Atmosphere 13 01201 g003
Figure 4. Daily averages of the single scattering albedo were calculated for January 2022 from the absorption and scattering coefficients due to EBC detected by the PAX 870 nm. The graph has a smoothing filter applied (binomial smoothing by Wave Metrics Igor Pro 8 platform). Each point represents a daily average, and the errors are the standard error associated with each point.
Atmosphere 13 01201 g004
Figure 5. The absorption Ångstrom Exponent—Equation (1)—was calculated using the Babs calculated at 405 nm and 870 nm with the data obtained by the PAX instruments. The values represent daily averages for the month of January 2022. A binomial smoothing was applied (IGOR Pro 8) to show the shape of the data.
Atmosphere 13 01201 g005
Figure 6. The baseline diurnal averages of the Babs for August and September of 2021. In black (left y-axis), the baseline as measured by PAX 870 nm with its highest peak of 1.003 1/Mm at around midnight and its lowest point of 0.6639 1/Mm at around 3:30 PM (local times). In blue (right y-axis), the baseline as measured by PAX 405 nm with its highest peak of 7.658 1/Mm at around 7:30 AM and lowest values of 3.860 1/Mm at around 3:30 PM. The graph has a smoothing filter applied (binomial smoothing by Wave Metrics Igor Pro 8 platform). The errors bars represent the standard error associated with each point.
Atmosphere 13 01201 g006
Figure 7. Equivalent Black Carbon mass concentration measured in micrograms per cubic meter. The bold marking represents those eighteen event days when the wildfire plumes reached our instruments.
Atmosphere 13 01201 g007
Figure 8. (a) shows the diurnal averages of the Babs due to BC particles of the eighteen wildfire event days of the season. The values on the left y-axis (in black) of the graph were reported by the PAX 870 nm, and on the right y-axis (blue) were calculated from the 405 nm PAX. The graph has a smoothing filter applied. The error bars in (a) represent the standard error associated with each averaged point. Boxplots were added to present the spread of the data over 10 min averages for three California wildfire event days, 3 September, 14 September, and 16 September. (b) shows the data spread for the BC Babs PAX 870 nm while (c) shows the spread of the BC Babs calculated from the PAX 405 nm.
Atmosphere 13 01201 g008
Figure 9. (a) The inferred BrC Babs is graphed here for the diurnal averages of 1 August through 23 September 2021. The Babs displayed in red are due to BrC corresponding to the eighteen event days (BrC Babs WFE), and displayed in black is the baseline (BL), BrC Babs driven by pollution from vehicular traffic. The graph has a smoothing filter applied). The error bars represent the standard error associated with each averaged point. (b) represents the spread of this data for three California wildfires event days.
Atmosphere 13 01201 g009aAtmosphere 13 01201 g009b
Figure 10. The Single Scattering Albedo (SSA) for September of 2021 was calculated using the PAX 870 instrument. The bold marking indicates the SSA of event days. Each point represents the average measurement for the day.
Atmosphere 13 01201 g010
Figure 11. The Absorption Ångstrom Exponent was calculated using the Babs as calculated by the PAX instruments at 405 nm and 870 nm. The black markings correspond to the daily averages of the days where no wildfire smoke arrived at the region and therefore represent the AAE for the baseline. The red markings indicate the daily averages for the days when wildfire smoke was detected in the region—event days—(eighteen event days between August and September of 2021). The baseline AAE was not subtracted from the event days AAE, hence the red markings indicate the AAE for the event days plus the background AAE.
Atmosphere 13 01201 g011
Figure 12. The HRRR and HYSPLIT analyses for 8 September 2021. (a) The HRRR map indicates the surface mass concentration, from purple at the origin of the wildfire (northern California and south Oregon) to light blue at its lowest concentrations. El Paso, located at the western corner of the state of Texas received 2 to 8 micrograms per cubic meter of PM2.5. (b) The HYSPLIT backward trajectories run for 72 h at height 1, 1.5 and 2 km from the surface.
Atmosphere 13 01201 g012
Figure 13. The HRRR and HYSPLIT analyses for 9 September 2021. (a) The HRRR map indicates the surface mass concentration, from purple at the origin of the wildfire (northern California and south Oregon) to light blue at its lowest concentrations. El Paso, located at the western corner of the state of Texas received 2 to8 micrograms per cubic meter of PM2.5. (b) The HYSPLIT backward trajectories run for 72 h at height 1, 1.5 and 2 km from the surface.
Atmosphere 13 01201 g013
Figure 14. The satellite composite of 7 September 2021, at 1500 Z showing the presence of a high-pressure system (marked as blue H) over the study area (left), and 10 September 2021, at 03 Z showing hurricane Olaf (marked as red hurricane within yellow circle) near the southern coast of Baja California.
Atmosphere 13 01201 g014
Figure 15. PBL structure as observed on 6 and 7 September 2021. The shallow PBL on 7 September resulted from the sinking motion of the atmosphere due to the presence of a high-pressure region over the study area.
Atmosphere 13 01201 g015
Table 1. The average and maximum values of the BC and BrC Babs (Babs, Mm−1) for\the three prominent peaks in Figure 2a,b and Figure 3.
ParameterFirst PeakSecond PeakThird Peak (3:00 PM—Midnight)
BC Babs PAX 405 nm (1/Mm)6.130 avg.8.188 max.2.688 avg.4.048 max.15.010 avg.28.151 max.
BC Babs PAX 870 nm (1/Mm)2.584 avg.3.811 max.1.249 avg.1.885 max.6.975 avg.13.105 max.
BrC Babs (1/Mm)5.171 avg.5.896 max.4.122 avg.4.443 max.7.944 avg.12.167 max.
CO-TCEQ (ppm)0.236 avg.0.254 max.0.231 avg.0.300 max.0.0341 avg.0.462 max.
Table 2. The August and September event days where the smoke plumes output by a wildfire make their way to our region. The California wildfires were mainly in the north part of the state. The HRRR reported the plumes as PM2.5 in micrograms per cubic meter through a color-coded volume. Most of the fires lasted for a couple of days.
Event DaySmoke Source StateEvent DaySmoke Source State
6 August 2021CA/NV8 September 2021CA/OR
7 August 2021CA9 September 2021OR/ID/MT
17 August 2021CA/NV10 September 2021OR/ID/MT
18 August 2021CA11 September 2021NV/ID
20 August 2021CA13 September 2021CA
2 September 2021CA/NV/ID14 September 2021CA
3 September 2021CA/NV/ID16 September 2021CA
6 September 2021CA/OR17 September 2021CA
7 September 2021CA/OR/ID18 September 2021CA/MT
Publisher’s Note: MDPI stays neutral with regard to jurisdictional claims in published maps and institutional affiliations.

