1. Introduction
Airborne particulate matter has long been associated with negative environmental and health impacts [
1]. Road traffic and transport are one of the main sources of airborne particulate matter in urban areas [
2,
3]. The contribution of exhaust emissions has decreased worldwide due to increasingly stringent regulations, the application of efficient powertrain units and exhaust aftertreatment systems [
4]. Different studies show that other vehicle-related sources of particulate matter are a significantly higher contributor to traffic-related emissions.
Non-exhaust emissions have now replaced exhaust emissions as the primary source of particulate matter emissions from road traffic. Therefore, the main source of particulate matter emissions from road traffic does not fall today within the scope of any legislation process. Since most of the emitted particles belong to the size classes of particulate matter (≤10 µm) and differ significantly in their physico-chemical properties from automotive exhaust emissions, this source is of particular relevance to human health and is therefore the focus of scientific studies [
5,
6,
7,
8,
9,
10].
A review of relevant studies identified inconsistencies possibly related to the lack of a standardized methodology for brake wear particle measurement [
11]. To address the need for harmonization, a task force was established within the Particle Measurement Program (PMP) informal working group, under the auspices of the UNECE Working Group on Pollution and Energy (GRPE). The timeline for these activities of the PMP Task Force is to present a proposal for a valid test and verification procedure by mid-2022. It is unclear whether a proposal for one or more limit values for brake wear particle emissions in Euro 7 can be presented in 2022. A framework needs to be discussed that includes concepts for brake families and a definition of brake system types. Additionally, there are currently no definitions of a traceable calibration standard for the test methods and equipment.
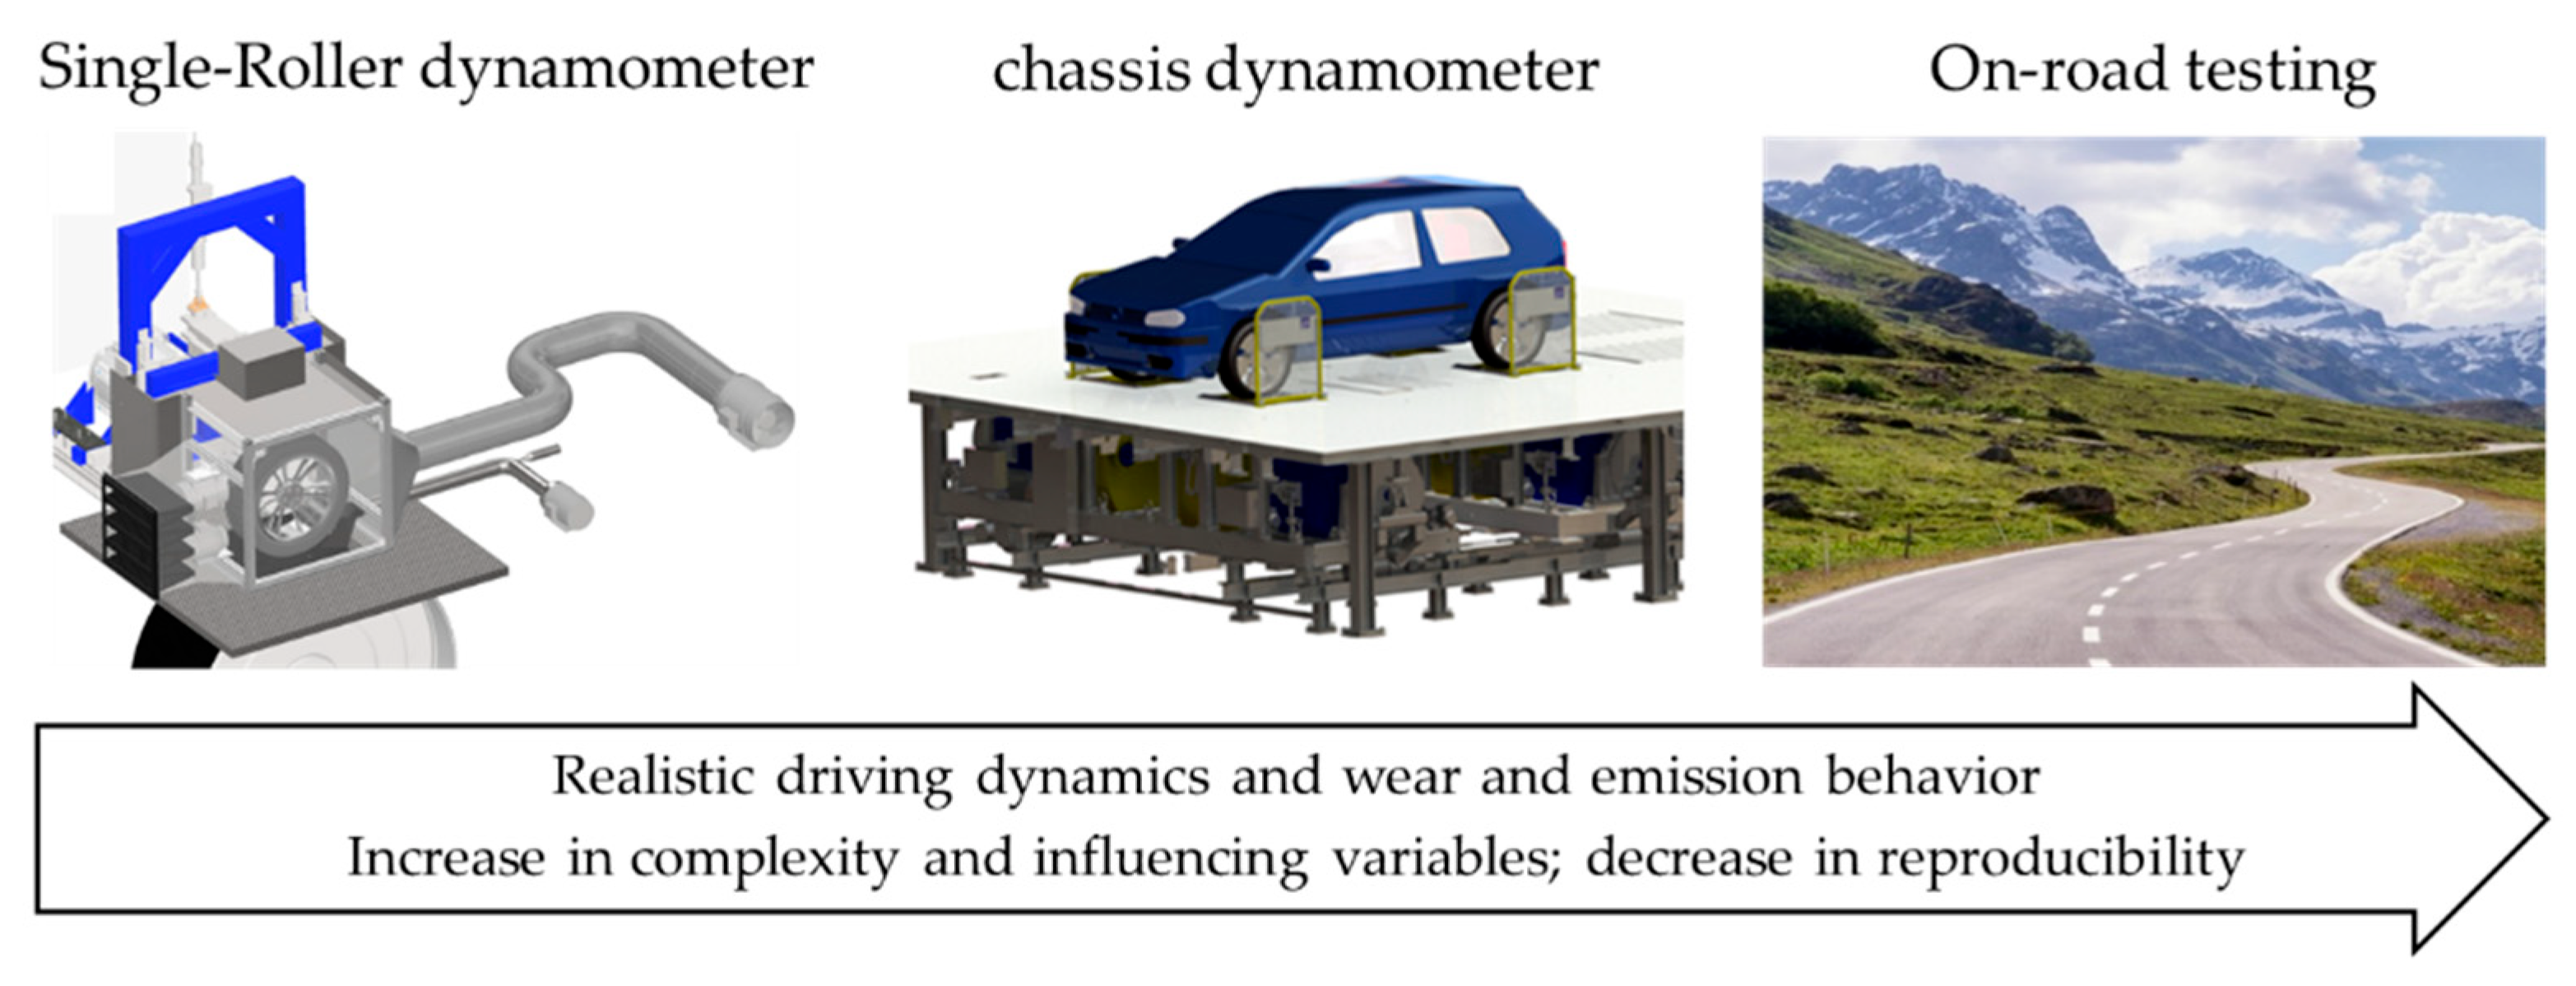
For different test conditions, a differentiated influence on the measurement result is to be expected for each parameter (see
Figure 1). Stationary measurements on the component test bench allow for controllable environmental and load parameters, which should lead to more reproducible measurements. On-road tests allow the mapping of real driving dynamics (e.g., driver influences, traffic situation or topography of the route), which in turn increases the representativeness of the test.
The disadvantage is that influences change dynamically in their effect and often overlap, which reduces the reproducibility of the measurement. The chassis dynamometer is an interim solution that enables clearly reproducible test conditions using a complete or quarter vehicle (Corner Module).
A PMP informal working group (TF TA, according to GRBP-75-39) is planning to develop a standardized methodology for determining tire abrasion rates. The ISO/TS 22,638 standard (Generation and collection of tire and road wear particles (TRWP)-Road simulator laboratory method) has been in place since 2018 to determine the tire abrasion rate and tire wear particles. Based on this, the ISO/TS 22,640 (Framework for physical and chemical characterization of TRWP) was developed. ISO/TS 22,638 describes the method for generating TRWP in a road simulator laboratory that is representative of actual driving conditions. Guidance is provided for the road simulator system, test pavement and tires, collection system, monitoring and reporting. This method is suitable for detecting TRWP of a known road surface and tire type under realistic driving conditions without conclusions about contamination of the road surface (e.g., brake dust, exhaust emissions, etc.). TRWP are generated from a tire and pavement cassettes of known composition with a road simulator system and a collection system. A precision balance is used to weigh collected TRWP. An internal drum test bench or a circular road simulator can be considered for this application. As the analysis of airborne particles of the fine dust fractions PM10 and PM2.5 is not part of this standard, this article presents a concept of a sampling system for the measurement of tire wear particles on the single-roller test bench. In addition to the determination of the tire abrasion rate, this enables the online measurement of the particle number and mass concentration for the calculation of PM emission factors. The simulation of near realistic force and slip ratios, cooling conditions and surface characteristics of the road is a particular challenge. In order to compare the results of stationary measurements with on-road tests, the concept of a sampling system for the detection of tire wear particles under real driving conditions is presented in the third part of this article. The concepts developed by the authors for each test environment are evaluated in a comparative manner. The aim should be to derive characteristic features for each test environment, which can form the basis for the development of a test and verification procedure. For this purpose, simultaneous and experimental investigations are carried out in order to demonstrate the functionality of the developed concepts. Particular emphasis is placed on the particle injection behavior.
2. Tire Wear Particles
2.1. Formation Process and Particle Properties
The tire is a complex elastic rubber product that is the only part of a vehicle that comes into contact with the ground. The wear process of tires is complex, but there are three main influencing factors: tire factors, vehicle factors and environmental [
12]. The tribological principles of the rubber wear mechanism including fatigue wear, friction wear, adhesion wear and chemical erosion wear are known [
12,
13,
14,
15,
16,
17,
18,
19,
20]. An understanding of the rubber wear process and the mechanisms acting on it is the basic prerequisite for the development of test and verification procedures on the single-roller test bench. Friction and slip result in micro cuts and cracks in the tire and road surface, as well as continuous wear. Particulate wear occurs when the accumulated friction energy of a local volume in the contact area reaches the failure energy (critical value) of the tire surface in the contact area. However, tire wear does not usually occur in a single form, but as a mixture of tire and road surface wear, which is about 50% each [
12,
15,
16,
17].
The contribution of TRWP emissions is estimated to be 5–30%, with up to 10% of tire wear mass accounted for by the <10 µm size fraction of airborne particle emissions [
18]. In [
19], literature data on size distributions of tire wear particles (TWP) and TRWP are summarized. This study listed results from 1 nm to hundreds of µm for road simulators, from about 0.4 to 20 µm for on-road testing and above 1 µm to 200 µm from road run-off. The results presented by Faino [
17] rank the diameter of TRWP between 4 and 350 µm with an average diameter of 100 µm and a particle density of 1.8 g/cm
3. The studies presented by Grigoratos [
11], Kwak [
20,
21], Mathissen [
22] and Dall’osto [
23] have comparable results. Similar to studies on the particle size of brake wear particles, these differences are due to differentiated test procedures, sampling systems and measuring systems for the investigation of particle size. Zhang [
14] also showed that the number of particles is mainly ultrafine particles with a maximum concentration of 100 nm. The particle mass is mainly represented by fine and coarse particles with a maximum concentration at 0.5 µm and 1.3–2.5 µm. Typical forms of particles released to the environment by tires are shown in
Figure 2.
The collection of particles was carried out using sampling pads, positioned in each case in a special closed constant volume sampling system (CVS). It should be noted that the shape and structure of tire particles in field tests are influenced by foreign particles (which are assigned to the road/asphalt or from external sources) and that they can form a convolut [
24]. The known chemical composition, morphology and parameters acting on the wear process (generally applicable) for tire wear particles are compared in
Table 1. The most important parameters for the wear process of the tire are the chemical composition, surface condition of the road and longitudinal and lateral accelerations. The parameters influencing the particle formation process and the measurability of tire wear particle emissions are the subject of this study. The manufacturing of tires is a complex process, requiring the use of a wide variety of chemicals, fillers and polymers (tire).
Due to the different compositions of the friction partners and the differentiated influences on the formation of particle-shaped wear, significant differences between exhaust emissions, brake and tire wear particle emissions in particle size, chemical–physical properties (particle density, morphology, composition), as well as different initial conditions (speed and direction of particle injection, deposition probability), are to be expected. As a result, differentiated requirements arise for the development of sampling systems. In order to compare the differences in the initial conditions, the following section presents simulation and experimental methods for the analysis of particle injection and particle distribution.
2.2. Particle Injection
This section introduces the basics of the particle injection and particle distribution process to derive requirements for the design of sampling systems. For this purpose, the authors developed simulation models and methods of experimental validation. The advantage of the simulation models is the simple variation of individual parameters and the evaluation of the influence on the particle distribution. The influencing factors are the rotational speed, the properties of the injected model particles (diameter and density) or the geometry of the friction partners (profile of the tire). The simulation models were built using the simulation tool Ansys Fluent for a model of a C-segment vehicle.
Tire wear particles are generated by abrasive processes between the tire and the road surface and are returned to suspension by tire-induced turbulence. The mixture of tire and road wear particles and as well as the swirled-up road dust (resuspension) can lead to enormous differences in chemical composition, density and morphology, making it difficult to define universal parameters. In [
27], the developed model has already been used to analyze the influence of different vehicle components on the formation of dust flags behind the tire road contact. Based on this, the influence of the driving speed will be demonstrated in the following section. The injection of model particles takes place directly in the tire road contact.
Figure 3 shows particle distribution profiles for driving speeds of 30 and 90 km/h. The increase in vehicle speed initially results in an increase in aerosol dilution, which is relevant for particle measurement. The flow topology of the particle cloud (P-shoulder swirl), on the other hand, remains almost unchanged. This means that the effect of driving speed is scalable. From the evaluation of the particle flow, a dead water area behind the wheel can be observed, which leads to the accumulation of particles, i.e., to an increase in the concentration. In addition, the tire profile reduces the probability of carrying particles in the direction of rotation, which is important for the positioning of the sampling system.
While the smaller particles mostly move along very turbulent tracks and are easily influenced by the flow (≤1 µm), the larger particles move along much more straight tracks and are not subject to slight changes in flow (>>1 µm).
For the analysis of the injection and distribution of particles, a flow test bench, consisting of a flat track for the reproduction of the tire road contact and a Göttinger-type Wind tunnel (a circular tunnel with a closed circuit), is used. A quarter-vehicle architecture of the C-segment cars (left front axle) already used for the simulations is replicated. Since the real concentration is low and thus does not allow clear evidence of correlations, model particles (standardized test dust ISO 12103-1/Arizona dust) with a defined concentration are supplied by a dispersing unit and blown in via a nozzle immediately before the tire road contact (opposite the direction of travel). The optical detection of the particle distribution in the fluid takes place on the basis of laser-illuminated levels.
Figure 4 shows that the concentration of the particles is slightly offset to the outside behind the tire–road contact near the ground. The model particles are injected into the flow (airflow). In addition, a part of the particles is pulled in a vertical direction with the rotation of the tire. Before entering the wheelhouse, the particles are detached from the tire due to the counteracting airstream. Furthermore, particles penetrate the area of the tire laterally. This effect can be explained by a turbulent backflow, which is formed due to flow separation in the tire contact patch. It could be shown that for each tire, a characteristic particle emission behaviour must be taken into account, which can change dynamically depending on numerous parameters. The particle emission behaviour of tires is significantly influenced by adhesion forces.
3. Sampling Requirements for Particulate Emissions
The sampling and measurement of PM10 emission factors requires efficient transport of super micron particles (>1 µm) to the sampling position and the provision of a representative sample, as significant influences by impaction or sedimentation can be expected. In addition, a highly inhomogeneous concentration profile results from the different geometries of the tires available on the market as well as the transient flow conditions, which makes the acquisition of a representative sample a challenge. This is especially true over the course of a test cycle, in which different initial conditions (vehicle speed, flow conditions through rotating components) always prevail. Only a high degree of uniformity, which results from a homogeneous particle distribution, enables representative sampling, even with partial flow sampling. The requirements listed in
Table 2 must be met as a prerequisite for a reproducible and representative measurement. CVS systems are used for this purpose, in which the emitted particles are fed through a constant volume flow to a sampling duct with an integrated probe. This has consequences in terms of particle transport from injection to the sampling position.
4. Tire Wear Particle Emissions Measurement
4.1. Design and Function of the Sampling System
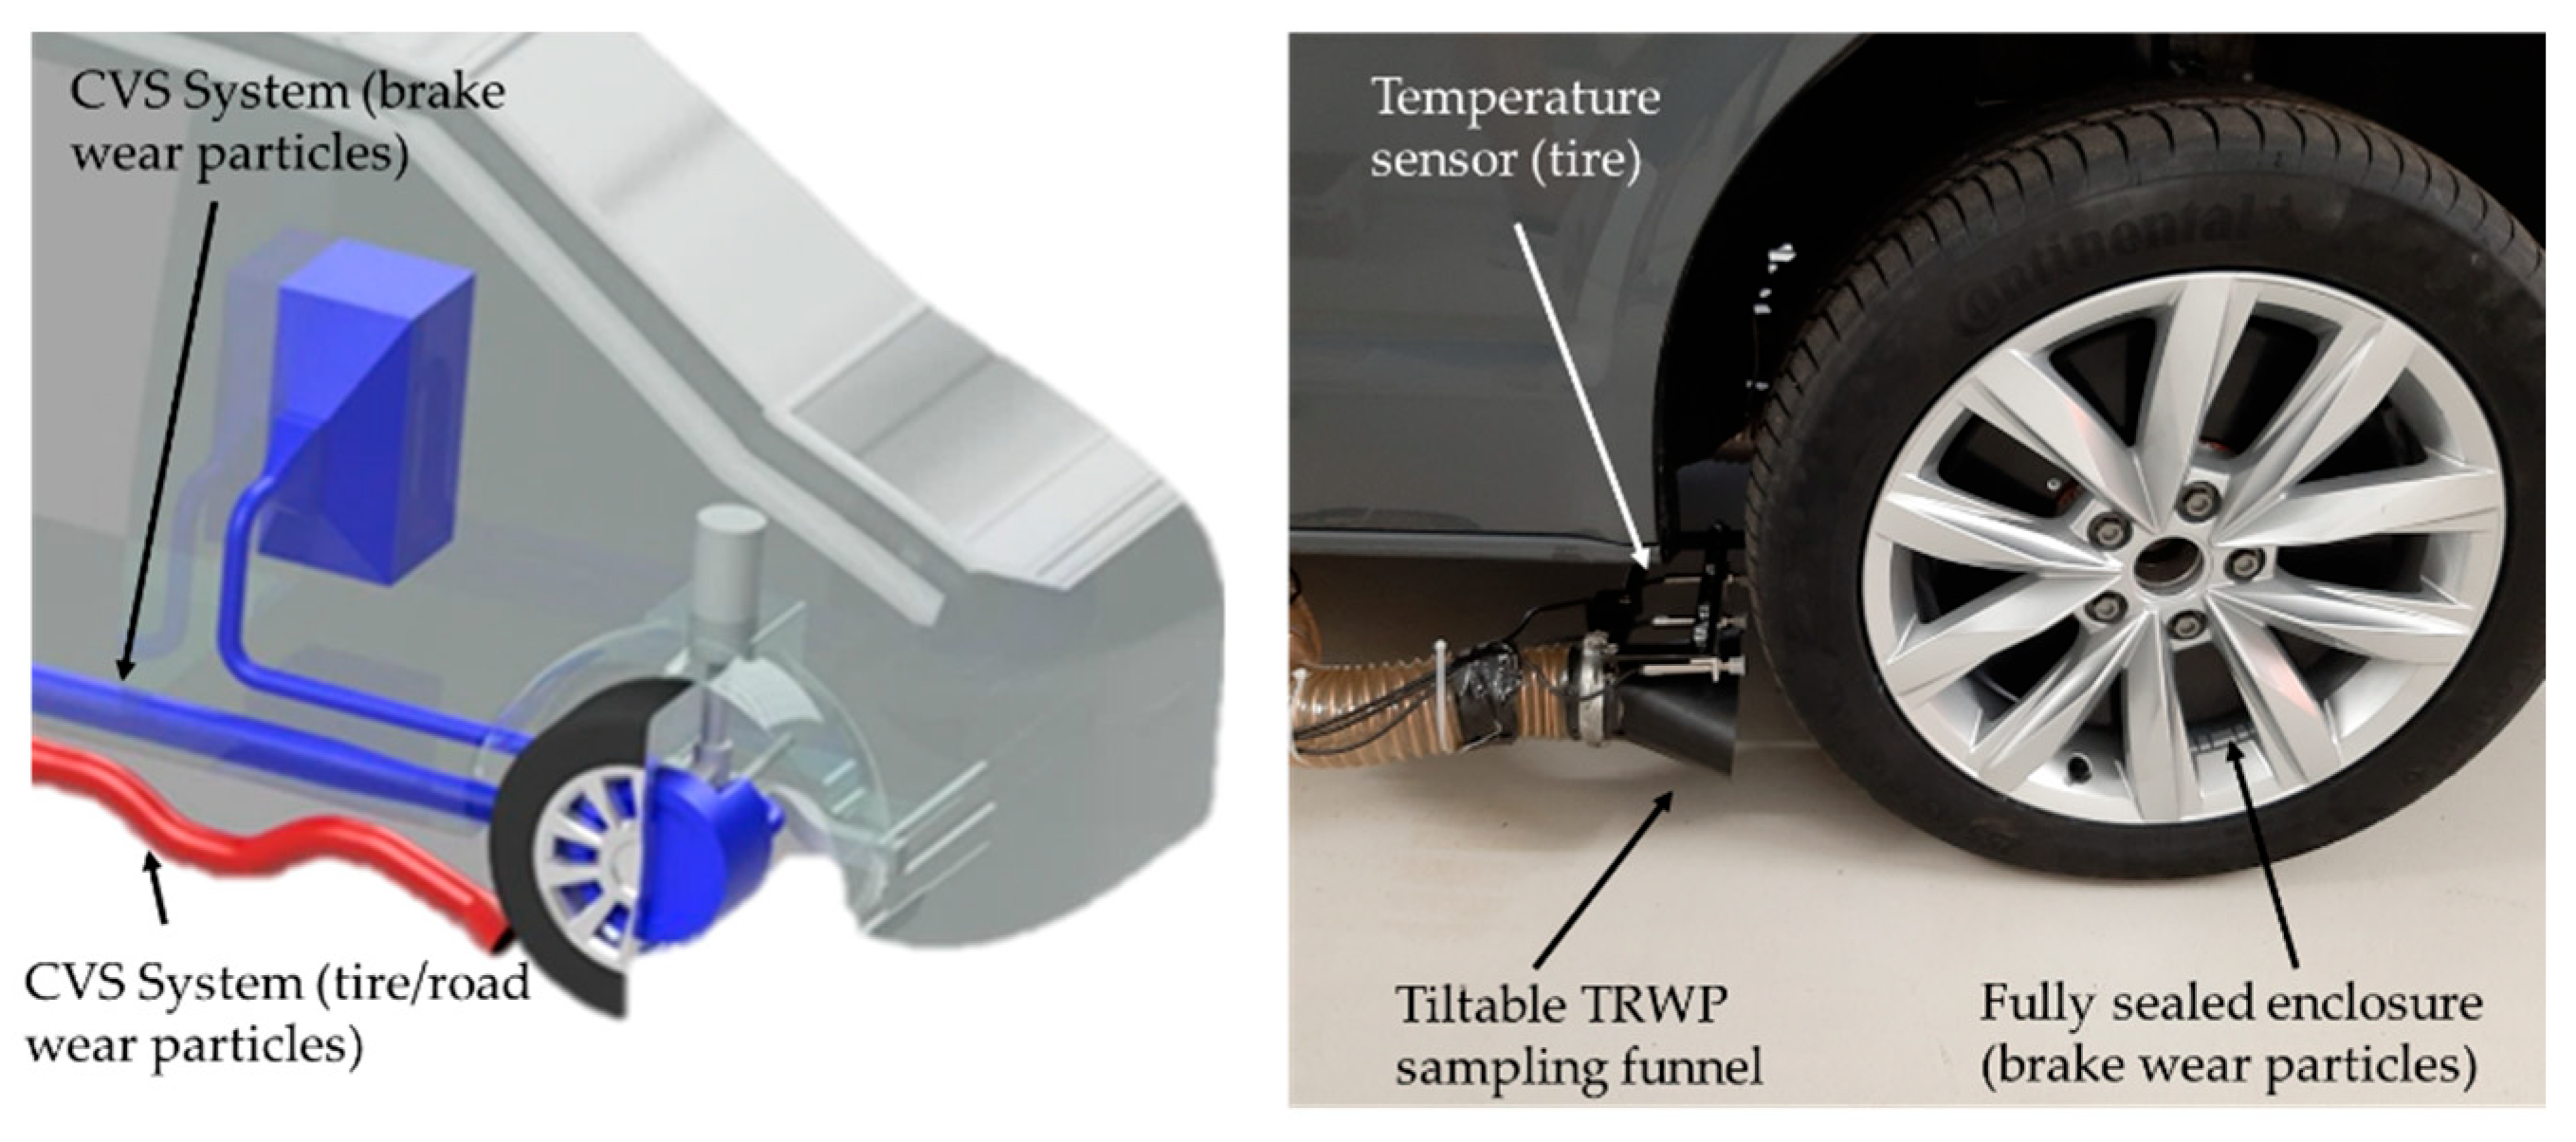
In this section, results from tire wear particle measurements are presented and characteristics for each test environment are derived. The total mass of a Light Duty Vehicle (LDV) used is 2230 kg including the driver, data acquisition systems (time-synchronous data acquisition) and power supply systems. The tests presented below were conducted on a real driving emission (RDE)-compliant test cycle ((EU) 2018/1832) in public road traffic. The urban, rural and motorway sections are conducted in and around Ilmenau, Germany. The driver determines for each brake event the initial and final speed and the deceleration (including the brake pressure and the pressure increase/gradient). Since the influences on the tribological wear process and the measurement result can be varied, individual tests are carried out on a closed-off test track. In a second part, a concept for the determination of abrasion rate and PM emission factors on the single-roller test bench is presented. In accordance with the sampling requirements initially described, the aim is to measure the aerosol continuously. Based on this, the positioning of a sampling funnel behind the tire–road contact is recommended to ensure maximum particle sampling efficiency (
Figure 5). Detailed analyses of the design and positioning of the sampling funnel can be found in [
27].
According to the distribution profile shown in
Figure 3, the sampling funnel is slightly shifted to the outside of the vehicle (isoaxial) to minimize interference and maximize particle concentration. In addition, the design guidelines predefined in the PMP draft (GRPE-81-12) have been adopted. This concerns the layout of bending radii (radius) in the transport line, the positioning of the measuring plane in relation to a flow disturbance element to avoid turbulence or the volume flow to ensure isokinetic sampling conditions. In addition, the brake wear particle sampling system is adapted, allowing overlaps between emission sources to be reduced. According to the analyses carried out in [
18], at a low vehicle speed of 30 km/h, a sampling efficiency (detection of emitted particles by the sampling funnel) of up to 40% can be achieved for particles between 2.5 and 10 µm. For increasing particle size, the sampling efficiency continues to decrease. If the driving speed is increased to 60 km/h, the efficiency decreases to 10% due to the strong dilution of the aerosol by the airflow. At this level, the sampling efficiency remains nearly constant until about 120 km/h.
Figure 6 illustrates that at a vehicle speed of >>30 km/h, the velocity of the airflow in the wheel housing exceeds the intake velocity of the funnel inlet.
As a result, a high-velocity air stream enters the area between the tire and the funnel, transporting increased particulate to the outside of the tire and remaining uncaptured. The transport efficiency within the sampling system is particularly influenced by the effect of inertial separation. While a high transport efficiency of >90% has been demonstrated for particles ≤5 µm, this drops to about 40% for 10 µm particles.
4.2. On-Road Measurement of Tire Wear Particle Emissions
Identical to the previous section, a LDV with winter tires is used. To reduce the influences of emissions from external sources, the tests were carried out in a closed test track as a first step. A TSI DustTrak II aerosol monitor 8530 (mobile sampling device) with a 10 µm pre-separator is used. The TSI DustTrak allows the measurement of the Particle Mass Concentration (PMC).
Figure 7 illustrates the relationship between driving dynamics parameters and the generation of TRWP emissions. A dynamic driving style (lateral accelerations: ±0.1 g; ±0.3 g and ±0.5 g at maximum speeds of 50 km/h), the emission behavior was investigated under a wide range of load conditions. The vehicle speed as well as the longitudinal and lateral acceleration characterise the dynamic state of the vehicle. Looking at the longitudinal dynamics, it is mainly braking manoeuvres that cause increased emission values. However, increased emission values can also be detected at accelerations of >0.2 g in the range of 30 to 50 km/h. Highest concentrations can be observed in superimposed driving scenarios of cornering with simultaneous acceleration or deceleration.
In addition, the measured concentrations increase significantly with increasing vehicle speed, even at low accelerations. Maximum lateral accelerations (short-term up to 0.6 g) could be tested for safety reasons at maximum speeds of 40 km/h, with which the highest concentrations coincided. The frictional power transmitted between the tire and the road surface is transformed into thermal energy (increased tire temperature) and mechanical energy (wear generation). The wear generation process includes the formation of particles below 10 microns. In addition, the particle size distribution is analyzed using a TSI OPS 3330 (optical particle sizer; measurement of particles from 0.3 to 10 µm). This makes it possible to derive correlations between the driving scenario and the properties of the emitted particles.
Figure 8 shows mean particle size distributions (left and right cornering) for different lateral accelerations. The increase in the concentration of 2–3 µm particles with increasing lateral acceleration is striking, which can be attributed to the influence of shear forces (mechanical energy). In addition, high concentrations of particles <1 µm (peak concentration: 0.5 µm) can be measured, the maximum of which occurs at the highest accelerations. Although the concentrations change significantly with increasing stress, the particle size ranges change only slightly overall. The airborne particles collected on a sampling pad during the tests allow evaluation in terms of shape, size, or source. The analysis is performed using a VHX-7000 digital microscope from Keyence. Particles between 0.3 and 150 µm can be detected, each of which has a wide variety of shapes. Particles >20 µm are present in small numbers, but represent the majority of the tire wear mass.
The particles have elongated and roundish shapes. However, shapeless agglomerations can also be observed. Particles whose origin cannot be attributed to tire or road wear are clearly recognizable. The brownish particle shown in the upper part of the figure is presumably due to sand and thus confirms that measurements in the field can be superimposed by external influences. To classify the results obtained on a closed test track, measurements along the RDE test cycle are presented. Influences due to the traffic situation and the driving dynamics determined by the driver are relevant. In comparison to the measurements on the test track, no significant concentration peaks can be detected. This can be explained by the low longitudinal and lateral accelerations shown in
Figure 9. The maximum longitudinal accelerations are +0.2 g to −0.25 g, and the lateral accelerations ±0.4 g. Another influencing factor is the differentiated and dynamically changing road surfaces, which correlate directly with the abrasion rate.
In addition, the existing flow conditions have a very sensitive effect on the measurement capability because of the open design. With increasing vehicle speed (e.g., rural and highway) the dilution rate increases, and the particle concentration decreases. Due to these dynamic influences, the determination of emission factors in the field is considered a major challenge. Instead, the setup is suitable for identifying correlations between driving dynamics and particulate emissions.
The frictional power is calculated in a very simplified manner based on the slip velocity between tire and road and the sum of forces acting on the vehicle. These include the rolling resistance, air resistance and acceleration resistance. To evaluate the influence of emissions from external sources, the particle mass concentration is assessed along the RDE test cycle (
Figure 10). The frictional power transmitted on the right front tire was calculated and compared to the corresponding emissions values. For simplicity, a proportional relationship is assumed between the power transmission and wheel load of each individual tire. For this purpose, a static wheel load factor is used, which relates the static tire load to the vehicle weight. The dynamic tire load change is also calculated by the deflection of the potentiometer mounted on the right front wheel and the spring constant. High emission levels do not directly correlate with high frictional power. The highest particle concentrations can be measured when the frictional power is low. Therefore, a correlation with the pollution of the road surface by road dust can be assumed. This road dust is swirled up by the vehicle, which can be described as tire-induced resuspension. Even though the response of TRWP emissions to frictional power is lower, some effects are comparable to those on the test track (e.g., high concentration during cornering). In addition, an increased PM10 concentration can be observed in sections with an increased frictional power per kilometer (especially in city sections).
Significantly lower emission levels are measured in rural and highway sections. The highway sections, which are characterized by much more constant driving speeds and lower cornering, show few emission peaks except for acceleration and braking events. In summary, a high proportion of the emissions measured during on-road tests are the result of tire-induced resuspension or originate from external emission sources (e.g., combustion processes). Nevertheless, no clear statements can be made about the weighting of the different emission sources with the measurement setup, as they could not be clearly separated. The most accurate statement that could be made for the influencing parameters was that a high volume of traffic and a high manoeuvre density favoured the emission of brake, tire and asphalt particles.
4.3. Laboratory Testing (Single Wheel Dynamometer)
The previously presented methods allowed only limited reproducibility due to influences by the environment (particles from external sources), dynamic changes in the surface condition or the traffic situation. Therefore, a single-roller test bench was developed for the dynamic simulation of force and slip ratios (wheel drive vs. test bench roller), driving resistances and slip angles. This allows individual parameters or entire test cycles to be evaluated under reproducible test and inspection conditions with regard to abrasion rate and PM emission factors. Ensuring efficient sampling (particle transport, particle distribution, isokinetic conditions) requires constant flow conditions. However, this correlates with the replication of realistic cooling performance. Especially in sections of increased velocity, the cooling performance is typically low. Further challenges consist in the dilution of the particle containing aerosol or the particle distribution. To ensure these requirements, the dual dilution system shown in
Figure 11 was developed, which unites the advantages of more realistic cooling conditions and optimal sampling conditions. Subsystem 1 is used for tire cooling by means of an adjustable volume flow. Subsystem 2 is used to suction TWP directly behind the tire–roller contact and to transport the particles to the measuring system. A volume flow of 120 m
3/h allows small dilution rates, which has a positive effect on the analysis (detection limit). The duct diameter of subsystem 2 is 10 cm, the duct diameter of subsystem 1 is 30 cm. To reduce the background concentration, a filter system is positioned upstream of the inlet to the tire enclosure. To reduce contamination with particles from the environment, an overpressure is generated in the enclosure with filtered air via a controllable fan system. The temperature and humidity are controlled by an air conditioning system located in the test chamber. An electric traction machine with an output of up to 240 KW and a torque of 3500 Nm serves as the wheel drive. Dynamic variation is performed using a real-time computing system to implement dynamic real driving cycles. The slip angle can be adjusted by ±2°.
A corundum-coated drum is used to replicate the road surface. This almost wear-free surface enables a selective analysis of TWPs. The section of a simulated RDE test cycle shown in
Figure 12 serves to illustrate the functionality. The constant low particle background concentration (<25 #/cm
3) allows the online analysis of smallest emission events and energy conversions. It can be clearly seen that a change in the slip angle results in an increase in temperature (measured by IR thermometer) and particle number concentration. The particle number concentration is measured by the company TSI’s Condensation Particle Counter (CPC) 3756 with a calibrated cut-off of 2.5 nm. The low background concentration can be used to evaluate correlations between the driving scenario (cornering, acceleration, vehicle speed or tire temperature) and the formation of tire wear particles. It is striking that the concentrations overall are small (max. 100 #/cm
3 for the driving scenarios shown). Acceleration maneuvers can hardly be identified during the simulated RDE test cycle.
Using the three-stage impactor Johnas from Paul Gothe GmbH (according to ISO 23210), only about 4% of the total abrasion mass could be attributed to particulate matter PM10. This corresponds to the sources of literature described at the beginning and is therefore classified as credible. Compared with the brake, this proportion is significantly lower. During brake tests, it was possible to determine proportions between 30 and 55% [
29].
For a direct comparison between the corundum-coated roller test bench and the asphalted roadway, the surface structure and the surface pressure distribution must be analyzed. The road texture was recorded using the ScanCONTROL 2710-100 laser line scanner from Micro-Epsilon. To estimate the surface pressure distribution, contact surface examinations were carried out with prescale pressure measuring films from Fujifilm. If pressure is applied to the measuring films, a dye held in microcapsules reacts with a color developer. The intensity of the discoloration depends on the contact pressure. The surface pressure distribution was determined at a tire inflation pressure of 2.5 bar. As a result of the different road curvature, there is a difference between the contact surfaces, as shown in
Figure 13. In addition, the actual contact surfaces are significantly influenced by the road conditions. On the significantly smoother roller surface, there is a more even pressure distribution in the tire–road contact. The contact surface at the asphalt road is primarily characterized by roughness peaks. The effective contact surface decreases as the macro accuracy increases and the contact pressure at the texture peaks increases.
There is also a correlation between tire inflation pressure and surface contact area. If the tire inflation pressure is reduced, the effective surface contact area on the test bench drum increases significantly more strongly than on the asphalt road. The surface area increases as the tire inflation pressure decreases, but the penetration depth between the roughness peaks decreases due to the reduced contact pressure.
On the basis of these findings, it can be expected that the abrasion rate during tests on the single-roller test bench will be significantly lower than on-road tests. In addition, deviations due to the limited slip angle are to be expected. These assumptions were confirmed by measurements. Although the functionality of the single-roller test bench for determining correlations has been proven, the abrasion rate deviates by a factor >5 from measurements in the real driving test. The advantage of a wear-resistant surface for separate analysis of TWP is accompanied by a different abrasion rate. For future tests to characterize the wear and emission behavior of tires, the determination of a reference value (on-road test, e.g., abrasion rate) is essential. Based on the investigations, numerous parameters can be identified (see
Table 3), by which the particle formation process, particle transport and the measurement capability are influenced. The rating is in a range between 0 and 3 (0 = no influence; 3 = significant influence).
The impact levels were determined from the relative change in number and mass concentration according to the variation of the influencing factors.
The surface structure of the road/roller, particles from external sources and the dynamic flow conditions when using open sampling systems are the main influencing factors. The challenge in carrying out wear and emission tests on the test bench is to reproduce realistic force and slip conditions (e.g., longitudinal and lateral acceleration, dynamic wheel load), the surface condition of the road surface or the flow conditions for tire cooling and particle transport.
The ambient temperature, humidity and wind direction/wind strength (all to be assessed as meteorological influences) are also expected to have an impact. The evaluation is planned by the authors in further studies. It is to be expected that the tire cooling and the particle transport are influenced by the wind direction and wind strength. It is also to be expected that the initial speed and deceleration selected by the driver will be changed by the increase in humidity (especially on wet roads), which correlates directly with the energy conversion/frictional power.
5. Discussion
The sampling concepts presented enable the measurement of tire wear particles on the single-roller test bench and during on-road tests. The advantage is that the real particle emission behavior can be recorded and evaluated under the influence of the driver, the driving distance, the traffic situations and other parameters.
In a first step, the particle injection behavior was evaluated. It could be found that the particles are detached from the tire due to the counteracting airstream. In addition, particles are transported to the outer area of the tire. This effect can be explained by a turbulent backflow, which is formed by the airflow release from the tire contact surface.
In addition, methods for the sampling of tire wear particle emissions were presented. For this purpose, a test vehicle was set up and equipped with a rotating constant volume sampling system. Based on the tests carried out, the emission behavior of the TRWP under real-world driving conditions could be described. Clear correlation between the dynamic driving load (friction power) and the resulting TRWP emissions could be demonstrated. The main factors influencing the wear rate are the surface condition of the road surface and the driving dynamics (in particular longitudinal and lateral acceleration). Tests in real driving tests generally allow the determination of abrasion rates under real driving dynamics, which in turn are a reference for roller bench tests. In reality, the surface condition of the road is characterized by dynamic changes, the reproduction of which on the test bench represents a great challenge. However, the influence of particles from external sources, polluted roadways, construction sites or ambient conditions prevent reliable emission measurements during tests in public traffic. Tests on closed test tracks can help to reduce or even eliminate the influence of numerous influences (e.g., road surfaces, traffic situations/traffic jams and engine exhaust). Most of the results of road measurements seem to capture more background particles and swirls than tire particles. However, it is necessary to use these data to evaluate the particle distribution in the air flow. It is hardly possible to assign the recorded particles to their source (e.g., abrasion of the tire, road surface or other sources) during emission measurements. In this respect, no clear statement can be made about the weighting of the various emission sources. Chemical analyzes of collected samples could be carried out to determine the proportion of tire wear in contrast to external sources (use of tire rubber as tracer element). In addition, high particle concentrations, which occur independently of driving maneuvers, can be attributed to road dust. Due to the open design, there is a correlation between the driving speed and the dynamic changes in the flow with the dilution rate and the collection efficiency during an RDE test cycle or even during simple driving maneuvers on a test track. Due to different body shapes and chassis components, the flow conditions and particle distribution may differ from vehicle to vehicle, thus allowing for limited comparability. Due to this, the determination of representative PM emission factors appears to be almost impossible. Peak emissions that occur in sync with peak tire temperatures can be considered to be induced by friction. This avoids the effects of exhaust fumes when the test is performed at night with low traffic. In addition, exhaust particles (size range 0.1 µm) only have a minor influence on the particulate mass concentration PM10. Overall, it is still possible to determine correlations between driving condition and abrasion rate or tire wear particle emissions on closed test tracks.
Furthermore, the use of the single-roller test bench for the characterization of individual tires and for correlation analyzes between driving condition and emissions was confirmed. Due to the limited driving dynamics (e.g., limitation of the slip angle to ±2°), deviations were determined with on-road tests. At this point, further improvements are necessary to reproduce the real force and slip ratios (roller surface, slip ratios, etc.). According to the current state of development, robust tests for the determination of wear rates are primarily carried out on a test track. Nevertheless, the roller test bench is particularly suitable for the characterization of tires under specific variation of influencing factors. The target variables can be defined as the evaluation based on the abrasion rate, number/mass of particles and size distribution density, the identification of various parameters influencing the particle emission, the identification of individual emission-relevant driving situations and detailed analysis or a detailed analysis of longitudinal and transverse slip scenarios.
The impact levels listed in
Table 3 result from the studies described in this article carried out on a front axle tire. The emissions resulting from the rear axle tire are influenced by different parameters. The flow conditions and thus the cooling effect and particle transport, the reduced mechanical impact when cornering and the lack of drive torque (for front-wheel-drive vehicles) are different. A comparison between front and rear axle is to be carried out in further studies. In addition, only light-duty vehicles were tested. For heavy-duty vehicles, differentiated influences and impacts along real operating conditions are to be expected.
In this article, methods were presented to measure the emissions caused by the tire depending on different operating conditions. However, the question of the tire’s relative contribution to the total emissions caused by the vehicle (e.g., exhaust emissions, brake emissions, traffic-induced resuspension, etc.) remains open. In addition, the contribution of tires to urban pollution remains unclear. To answer these questions, effective simulation models can be used to describe the particle distribution in urban areas on the basis of real measurement data (to describe the initial behavior) and to derive measures for emission reduction.
6. Conclusions
The objective of this study was to identify the parameters that affect the particle formation process, particle transport and the measurement capability of tire wear particles under different test environments and to evaluate their influence. On-road tests allow the determination of real wear rates, which can be useful as a reference for laboratory measurements. Due to the open design of the sampling systems, additional influences (e.g., emissions from external sources, dynamic change in the surface properties of the road surface) must be taken into account in field measurements, which can change dynamically in their effect and can hardly be eliminated. During testing in public road traffic, background particles and swirled-up particles (resuspension) can influence the measurement result. The presented concept is nevertheless suitable for the determination of correlations between driving situation and particle formation, for the derivation of emission maps and for the collection of particle samples. In addition to lateral acceleration, surface texture was identified as one of the main influencing factors. Due to the interaction with the flow and the resulting change in the dilution rate, the determination of PM emission factors in the field is not very useful. Reproducible measurements of PM emission factors are possible on the test bench. The challenge is to recreate realistic power and slip conditions as well as road surfaces. In summary, due to the complexity of the mechanisms involved, the determination of emission factors of tire wear particles is significantly more complex and less reproducible compared with brake wear particles.
Author Contributions
Conceptualization, D.H., T.F., M.K., E.B., T.B. and S.G.; methodology, D.H., T.F., M.K., E.B. and S.G.; validation, D.H., T.F., M.K. and E.B.; investigation, D.H., T.F., M.K. and E.B.; data curation, D.H., T.F., M.K. and E.B.; writing—original draft preparation, D.H.; writing—review and editing, D.H. and T.F.; supervision, D.H., T.B. and S.G. All authors have read and agreed to the published version of the manuscript.
Funding
This research received no external funding.
Conflicts of Interest
The authors declare no conflict of interest.
References
- Pope, C.A., III; Dockery, D.W. Health Effects of Fine Particulate Air Pollution: Lines that Connect. J. Air Waste Manag. Assoc. 2006, 56, 709–742. [Google Scholar] [CrossRef] [PubMed]
- Pope, C.A., 3rd; Burnett, R.T.; Thun, M.J.; Calle, E.E.; Krewski, D.; Ito, K.; Thurston, G.D. Lung Cancer, Cardiopulmonary Mortality, and Long-Term Exposure to Fine Particulate Air Pollution. J. Am. Med. Assoc. 2002, 287, 1132–1141. [Google Scholar] [CrossRef] [PubMed]
- Oberdörster, G.; Maynard, A.; Donaldson, K.; Castranova, V.; Fitzpatrick, J.; Ausman, K.; Carter, J.; Karn, B.; Kreyling, W.; Lai, D.; et al. Principles for characterizing the potential human health effects from exposure to nanomaterials: Elements of a screening strategy. Part. Fibre Toxicol. 2005, 2, 8. [Google Scholar] [CrossRef] [PubMed]
- Pant, P.; Harrison, R.M. Estimation of the contribution of road traffic emissions to particulate matter concentrations from field measurements: A review. Atmos. Environ. 2013, 77, 78–97. [Google Scholar] [CrossRef]
- Harrison, R.M.; Jones, A.M.; Gietl, J.; Yin, J.; Green, D.C. Estimation of the Contributions of Brake Dust, Tire Wear, and Resuspension to Nonexhaust Traffic Particles Derived from Atmospheric Measurements. Environ. Sci. Technol. 2012, 46, 6523–6529. [Google Scholar] [CrossRef]
- Kukutschová, J.; Moravec, P.; Tomášek, V.; Matějka, V.; Smolík, J.; Schwarz, J.; Seidlerová, J.; Šafářová, K.; Filip, P. On airborne nano/micro-sized wear particles released from low-metallic automotive brakes. Environ. Pollut. 2011, 159, 998–1006. [Google Scholar] [CrossRef]
- Kumar, P.; Pirjola, L.; Ketzel, M.; Harrison, R.M. Nanoparticle emissions from 11 non-vehicle exhaust sources—A review. Atmos. Environ. 2013, 67, 252–277. [Google Scholar] [CrossRef]
- Wik, A.; Dave, G. Occurrence and effects of tire wear particles in the environment—A critical review and an initial risk assessment. Environ. Pollut. 2009, 157, 1–11. [Google Scholar] [CrossRef]
- Hicks, W.; Beevers, S.; Tremper, A.; Stewart, G.; Priestman, M.; Kelly, F.; Lanoisellé, M.; Lowry, D.; Green, D. Quantification of Non-Exhaust Particulate Matter Traffic Emissions and the Impact of COVID-19 Lockdown at London Marylebone Road. Atmosphere 2021, 12, 190. [Google Scholar] [CrossRef]
- Charron, A.; Polo-Rehn, L.; Besombes, J.-L.; Golly, B.; Buisson, C.; Chanut, H.; Marchand, N.; Guillaud, G.; Jaffrezo, J.-L. Identification and quantification of particulate tracers of exhaust and non-exhaust vehicle emissions. Atmos. Chem. Phys. 2019, 19, 5187–5207. [Google Scholar] [CrossRef]
- Grigoratos, T.; Martini, G. Brake wear particle emissions: A review. Environ. Sci. Pollut. Res. 2015, 22, 2491–2504. [Google Scholar] [CrossRef]
- Perricone, G.; Matĕjka, V.; Alemani, M.; Wahlström, J.; Olofsson, U. A Test Stand Study on the Volatile Emissions of a Passenger Car Brake Assembly. Atmosphere 2019, 10, 263. [Google Scholar] [CrossRef]
- Plachá, D.; Vaculík, M.; Mikeska, M.; Dutko, O.; Peikertová, P.; Kukutschová, J.; Kutláková, K.M.; Růžičková, J.; Tomášek, V.; Filip, P. Release of volatile organic compounds by oxidative wear of automotive friction materials. Wear 2017, 376–377, 705–716. [Google Scholar] [CrossRef]
- Zhang, X.; Chen, P.; Liu, F. Review of Tires Wear Particles Emission Research Status. IOP Conf. Ser. Earth Environ. Sci. 2020, 555, 012062. [Google Scholar] [CrossRef]
- Huang, H. Study on the Mechanism of Tire Abnormal Wear and Life Prediction. Ph.D. Thesis, Tongji University, Shanghai, China, 2007. [Google Scholar]
- Aatmeeyata; Kaul, D.; Sharma, M. Traffic generated non-exhaust particulate emissions from concrete pavement: A mass and particle size study for two-wheelers and small cars. Atmos. Environ. 2009, 43, 5691–5697. [Google Scholar] [CrossRef]
- Faino, M. The Tyre Industry Perspective, Tyre and Road Wear Particles. In Proceedings of the 48th PMP IWG Meeting, Ispra, Italy, 8 November 2018. UN WP29 GRPE PMP-48-13. [Google Scholar]
- Feißel, T.; Kunze, M.; Hesse, D.; Ivanov, V.; Augsburg, K.; Gramstat, S. On-Road Vehicle Measurement of Tire Wear Particle Emissions and Approach for Emission Prediction. In Proceedings of the 40th Annual Meeting of the Tire Society, Akron, OH, USA, 2 September 2021. [Google Scholar]
- Wagner, S.; Hüffer, T.; Klöckner, P.; Wehrhahn, M.; Hofmann, T.; Reemtsma, T. Tire wear particles in the aquatic environment—A review on generation, analysis, occurrence, fate and effects. Water Res. 2018, 139, 83–100. [Google Scholar] [CrossRef]
- Kwak, J.; Lee, S.; Lee, S. On-road and laboratory investigations on non-exhaust ultrafine particles from the interaction between the tire and road pavement under braking conditions. Atmos. Environ. 2014, 97, 195–205. [Google Scholar] [CrossRef]
- Kwak, J.-H.; Kim, H.; Lee, J.; Lee, S. Characterization of non-exhaust coarse and fine particles from on-road driving and laboratory measurements. Sci. Total Environ. 2013, 458–460, 273–282. [Google Scholar] [CrossRef]
- Mathissen, M.; Scheer, V.; Vogt, R.; Benter, T. Investigation on the potential generation of ultrafine particles from the tire–road interface. Atmos. Environ. 2011, 45, 6172–6179. [Google Scholar] [CrossRef]
- Dall’Osto, M.; Beddows, D.C.; Gietl, J.K.; Olatunbosun, O.A.; Yang, X.; Harrison, R.M. Characteristics of tyre dust in polluted air: Studies by single particle mass spectrometry (ATOFMS). Atmos. Environ. 2014, 94, 224–230. [Google Scholar] [CrossRef]
- Sommer, F.; Dietze, V.; Baum, A.; Sauer, J.; Gilge, S.; Maschowski, C.; Gieré, R. Tire Abrasion as a Major Source of Microplastics in the Environment. Aerosol Air Qual. Res. 2018, 18, 2014–2028. [Google Scholar] [CrossRef]
- Jekel, M. Scientific Report on Tyre and Road Wear Particles, TRWP, in the Aquatic Environment; ETMRA: Brussels, Belgium, 2019. [Google Scholar]
- Liati, A.; Schreiber, D.; Lugovyy, D.; Gramstat, S.; Eggenschwiler, P.D. Airborne particulate matter emissions from vehicle brakes in micro-and nano-scales: Morphology and chemistry by electron microscopy. Atmos. Environ. 2019, 212, 281–289. [Google Scholar] [CrossRef]
- Feißel, T.; Augsburg, K. Analytical Investigations of Tire Induced Particle Emissions. In Proceedings of the Fisita World Congress, Prague, Czech Republic, 14–18 September 2020. F2020-EPV-027. [Google Scholar]
- Feißel, T.; Hesse, D.; Augsburg, K.; Gramstat, S. Measurement of Vehicle Related Non-Exhaust Particle Emissions Under Real Driving Conditions. In Proceedings of the Eurobrake Conference, Barcelona, Spain, 2–4 June 2020. [Google Scholar]
- Hesse, D. Beitrag zur Experimentellen und Analytischen Beschreibung Partikelförmiger Bremsenemissionen. Ph.D. Thesis, Technische Universität Ilmenau, Ilmenau, Germany, 2020. [Google Scholar]
Figure 1.
Test environments for detecting tire wear particles.
Figure 1.
Test environments for detecting tire wear particles.
Figure 2.
Microscopy images of collected tire particles at different magnifications.
Figure 2.
Microscopy images of collected tire particles at different magnifications.
Figure 3.
Simulation results for the distribution of 10 µm model particles around the periphery of the wheel with variation of the driving speed (left: 30 km/h; right: 90 km/h).
Figure 3.
Simulation results for the distribution of 10 µm model particles around the periphery of the wheel with variation of the driving speed (left: 30 km/h; right: 90 km/h).
Figure 4.
Distribution of injected model particles behind the tire road contact, represented by laser-illuminated planes (left) distribution via the center plane of the wheel; (right) distribution via a plane close to the road and representation of the P-shoulder swirl.
Figure 4.
Distribution of injected model particles behind the tire road contact, represented by laser-illuminated planes (left) distribution via the center plane of the wheel; (right) distribution via a plane close to the road and representation of the P-shoulder swirl.
Figure 5.
Sampling system for the capture of tire wear particles during on-road tests-positioning behind the right front wheel [
28].
Figure 5.
Sampling system for the capture of tire wear particles during on-road tests-positioning behind the right front wheel [
28].
Figure 6.
Flow profile behind the tire road contact for (a) 30 km/h, (b) 60 km/h, (c) 90 km/h, and (d) 120 km/h.
Figure 6.
Flow profile behind the tire road contact for (a) 30 km/h, (b) 60 km/h, (c) 90 km/h, and (d) 120 km/h.
Figure 7.
Correlation between longitudinal/lateral accelerations and emission of tire wear particles–test track.
Figure 7.
Correlation between longitudinal/lateral accelerations and emission of tire wear particles–test track.
Figure 8.
Comparison of the particle size distribution of TRWP collected at the test track and illustration of the collected particles on filter pads.
Figure 8.
Comparison of the particle size distribution of TRWP collected at the test track and illustration of the collected particles on filter pads.
Figure 9.
Correlation between longitudinal/lateral accelerations and the emission of tire wear particles–RDE test cycle.
Figure 9.
Correlation between longitudinal/lateral accelerations and the emission of tire wear particles–RDE test cycle.
Figure 10.
Correlation between driving speed, converted friction power and measured particulate mass concentration to clarify the influence of emissions from external sources–RDE test cycle.
Figure 10.
Correlation between driving speed, converted friction power and measured particulate mass concentration to clarify the influence of emissions from external sources–RDE test cycle.
Figure 11.
Test setup for the analysis of abrasion rate and PM emission factors on the single-roller test bench.
Figure 11.
Test setup for the analysis of abrasion rate and PM emission factors on the single-roller test bench.
Figure 12.
Correlation between vehicle speed, slip angle and particle number concentration on single-roller test bench–RDE test cycle (excerpt).
Figure 12.
Correlation between vehicle speed, slip angle and particle number concentration on single-roller test bench–RDE test cycle (excerpt).
Figure 13.
Comparison of the road surfaces (a) present on the single-roller test bench and in the real driving test with regard to the surface pressure distribution, (b) and the surface profiles, (c) at a tire inflation pressure of 2.5 bar.
Figure 13.
Comparison of the road surfaces (a) present on the single-roller test bench and in the real driving test with regard to the surface pressure distribution, (b) and the surface profiles, (c) at a tire inflation pressure of 2.5 bar.
Table 1.
Properties of tire wear particle emissions [
11,
18,
22,
25,
26].
Table 1.
Properties of tire wear particle emissions [
11,
18,
22,
25,
26].
| Parameters | Description |
|---|
| Chemical composition | Rubber/elastomers (BR, SBR, NR), fillers (carbon black, silica, silanes), additives (preservative, antioxidants), textile and metal reinforcement, vulcanization agents (ZnO, S, Se, Te, thiazoles, organic peroxides, nitrocompounds), process oils |
| Morphology | Circular/dendritic particles |
| Main influences on wear and particle formation | Tire factors: construction and structure, chemical composition, wear resistance, tire pressure, contact patch area, bedding conditions;
Road surface factors: pavement construction, micro and macro texture, porosity, road dust loading of the road surface, binder (bitumen, cement);
Vehicle factors: speed, longitudinal/lateral acceleration, vehicle weight and distribution of loads, suspension type, frequency and extent of braking and cornering;
Environmental factors: temperature, humidity |
Table 2.
Requirements for the sampling of tire wear particle emissions.
Table 2.
Requirements for the sampling of tire wear particle emissions.
| No. | Request |
|---|
| 1 | High transport efficiency (PM2.5/PM10) |
| 2 | High degree of uniformity (distribution) |
| 3 | High reproducibility (operating conditions) |
| 4 | Low particle residence time |
| 5 | Elimination of external influences (flow; emissions from external sources) |
Table 3.
Influencing factors on the formation process, the particle transport and the measurement capability of tire wear particle emissions under varying test environments.
Table 3.
Influencing factors on the formation process, the particle transport and the measurement capability of tire wear particle emissions under varying test environments.
| Subgroup | Parameter/Influencing Factor | Description | Impact Level |
|---|
Test cycle and test conditions
(Section 2.2, Section 4.2
and Section 4.3) | Driving style | Longitudinal and lateral acceleration and vehicle speed (correlation with energy transmission and temperature) | 3 |
| Road profile | 1. Route sections (city, urban or highway); 2. topography; 3. curves (number, curve radius); influence of the initial velocity, the number of maneuvers and the lateral and longitudinal acceleration | 3 |
Traffic
situation | Influence of the number and intensity of lateral and longitudinal accelerations by the traffic ahead, traffic jams or construction sites | 2 |
| Topography | In the case of routes with increased gradient content, the (sectional) friction energy is increased due to the difference in height and braking time | 1 |
| Flow conditions (chassis) | Influence of tire airflow due to different suspension/chassis components (e.g., test bench vs. on-road test); effect: change in tire cooling and particle transport | 2 |
Loads and vehicle conditions
(Section 4.2 and Section 4.3) | (Wheel) load; Load conditions | Load condition (max. loaded/unloaded) and dynamic wheel load distribution; incorrect setting affects friction energy or friction power | 1 |
| Tire inflation pressure | Modification of the contact surface between the tire and the road surface | 1 |
Initial conditions
(Section 4.3) | Bedding procedure | Influence due to deviating conditioning state/surface structure; changing driving conditions in on-road tests | 2 |
| Initial surface properties of the tire | Tires may have lubricants and antioxidants on the surface when new; this results in reduced grip and change in wear behavior (bedding procedure) | 2 |
Surface condition
(Section 4.3) | Surface properties (e.g., roughness) | Influence on the wear rate by dynamically changing surface characteristics, such as the asphalt type | 3 |
Ambient influences
(Section 4.2) | Particles from external sources | Evaporated or airborne particles; source, e.g., preceding traffic, combustion processes, agriculture (e.g., sand); effect: Superposition of particles from several sources | 3 |
| Publisher’s Note: MDPI stays neutral with regard to jurisdictional claims in published maps and institutional affiliations. |
© 2022 by the authors. Licensee MDPI, Basel, Switzerland. This article is an open access article distributed under the terms and conditions of the Creative Commons Attribution (CC BY) license (https://creativecommons.org/licenses/by/4.0/).


 ,
, 


