Article

Demarcation of Coordinated Prevention and Control Regions in the Yangtze River Delta Based on Spatio-Temporal Variations in PM2.5 and O3 Concentrations

1
School of Geomatics, Anhui University of Science and Technology, Huainan 232001, China
2
Key Laboratory of Aviation-Aerospace-Ground Cooperative Monitoring and Early Warning of Coal Mining-Induced Disasters of Anhui Higher Education Institutes, Anhui University of Science and Technology, Huainan 232001, China
3
Coal Industry Engineering Research Center of Mining Area Environmental and Disaster Cooperative Monitoring, Anhui University of Science and Technology, Huainan 232001, China
*
Author to whom correspondence should be addressed.
Atmosphere 2022, 13(8), 1300; https://doi.org/10.3390/atmos13081300
Submission received: 14 July 2022 / Revised: 10 August 2022 / Accepted: 12 August 2022 / Published: 16 August 2022

Abstract

:
The PM2.5 and O3 pollution situation in the Yangtze River Delta (YRD) region is increasingly complex. Existing coordinated prevention and control programs are demarcated according to administrative regions, making fine-scale pollution control difficult. This study proposed a method for delineating regional control and pollution types based on the analysis of PM2.5 and O3 pollution characteristics. Four key indicators were used to comprehensively evaluate regional pollution trends: PM2.5 concentration ρ(PM2.5), O3 concentration ρ(O3), and the rates of change r(PM2.5) and r(O3). Our results demonstrate that from 2015 to 2020, cities in the YRD show a transition in the main pollution type from PM2.5 to O3. By 2020, the main types of pollution in the YRD region are co-pollution (ρ(PM2.5) > 35 µg/m3 and ρ(O3) > 100 µg/m3), O3 pollution (ρ(PM2.5) < 35 µg/m3 and ρ(O3) > 100 µg/m3), and low pollution (ρ(PM2.5) < 35 µg/m3 and ρ(O3) < 100 µg/m3), accounting for 41.9%, 26.3%, and 30% of the study area, respectively, which is roughly consistent with the remote sensing results (40.4%, 25.6%, and 33.7%, respectively). The proposed method can predict future trends in pollution and assist in decision-making for the coordinated prevention and control of PM2.5 and O3 pollution.

1. Introduction

Rapid advancements in urbanization and industrialization made the problem of air pollution increasingly prominent [1]. Since 2015, pollution days where PM2.5 and O3 are the primary pollutants account for 66.8% and 16.9%, respectively, of the total pollution days of China [2]. By 2020, these ratios are 57% and 37.1%, respectively [3]. PM2.5 and O3 pose serious health risks to humans [4], with long-term exposure associated with respiratory and cardiovascular diseases [5]. Accordingly, the control of PM2.5 and O3 pollution received extensive global research attention.
In recent years, with the effective implementation of China’s Air Pollution Prevention and Control Action Plan (APPCAP), the air pollution problem significantly improved [6]. However, Chinese residents are still exposed to PM2.5 concentrations more than six times greater than the World Health Organization’s (WHO) annual standard (5 µg/m3), issued in September 2021. While there is a significant downward trend in PM2.5 concentrations, O3 concentrations are currently increasing [7]. In this context, to formulate and implement effective air-pollution prevention and control strategies in China, and to clarify the characteristics of PM2.5 and O3 pollution, it is important to identify areas that are suitable for combined pollution prevention and control [8].
Previous studies analysed PM2.5 and O3 from different aspects, such as their formation mechanisms [9], temporal and spatial distributions [10], and regional transmission [11], and the effects of anthropogenic emissions [12], meteorology [13,14], and policy [15]. Moreover, studies on temporal and spatial changes in PM2.5 and O3 concentrations at local, regional, and national scales found that air-pollutant concentrations are spatially heterogeneous [16,17,18,19]. However, current regional-scale research either focuses on the characteristics of a single air pollutant, or on the influences of policy on the six major air pollutants (PM2.5, PM10, O3, NO2, CO, SO2). A poor overall understanding of the spatio-temporal dynamics of PM2.5 and O3 pollution characteristics remains. In studying spatial distributions, Tan et al. argued that 1 km resolution raster data better capture air pollution trends in urban and suburban areas [20]. Thompson and Selin proposed that O3 data with a resolution of <12 km are unsuitable for air pollution exposure studies [21]. These studies show that spatially continuous high-resolution raster data obtained from remote sensing are better for the spatial and temporal analysis of air pollutants than data from ground monitoring stations, which are usually unevenly distributed [22].
To address large-scale and regional air pollution in China, the government proposed the Joint Prevention and Control of Air Pollution policy (JPCAP). Researchers are focusing on how to accurately define the scope of the JPCAP and prioritise pollution prevention and control in various regions. Some previous studies analysed data from air quality monitoring stations, and based on this, allocated PM2.5 or O3 JPCAP regions and regional priorities in the Beijing–Tianjin–Hebei (BTH) region [23], the YRD [24], and all of China [25] according to economic, societal, or geographic perspectives. These studies used administrative boundaries as prevention and control boundaries and provide some reference for the implementation of China’s JPCPA policy. However, the pollution types (PM2.5 pollution, O3 pollution, and combined pollution) considered in current air pollution coordinated prevention and control programs are too rigid in the context of increasingly complex air pollution conditions, and there are no reports that consider the classification of transitional pollution types. In addition, as the grid management of air pollution prevention and control has been carried out in various parts of China, the current single pollutant prevention, and control areas and priorities divided by administrative boundaries, cannot meet the practical needs of coordinated control of complex pollution. Therefore, there is an urgent need to carry out research on the coordinated prevention and control of PM2.5 and O3 pollution at a finer region scale.
Based on the above background, this study focused on pollution control in the YRD, which has characteristics (e.g., meteorology, topography, and economic development level) that vary both between coastal and inland areas. Ground monitoring data and high-resolution remote sensing data were used to analyse the spatio-temporal characteristics of PM2.5 and O3 pollution. To divide the air pollution prevention and control regions at a finer level and fill the gap of the lack of pollution transition state in the current classification of pollution types, we proposed a method for dividing these regions based on a pollution level threshold. Four indicators (PM2.5 concentration and its rate of change, O3 concentration and its rate of change) were used to comprehensively evaluate the degree of trend development in prevention and control regions.

2. Materials and Methods
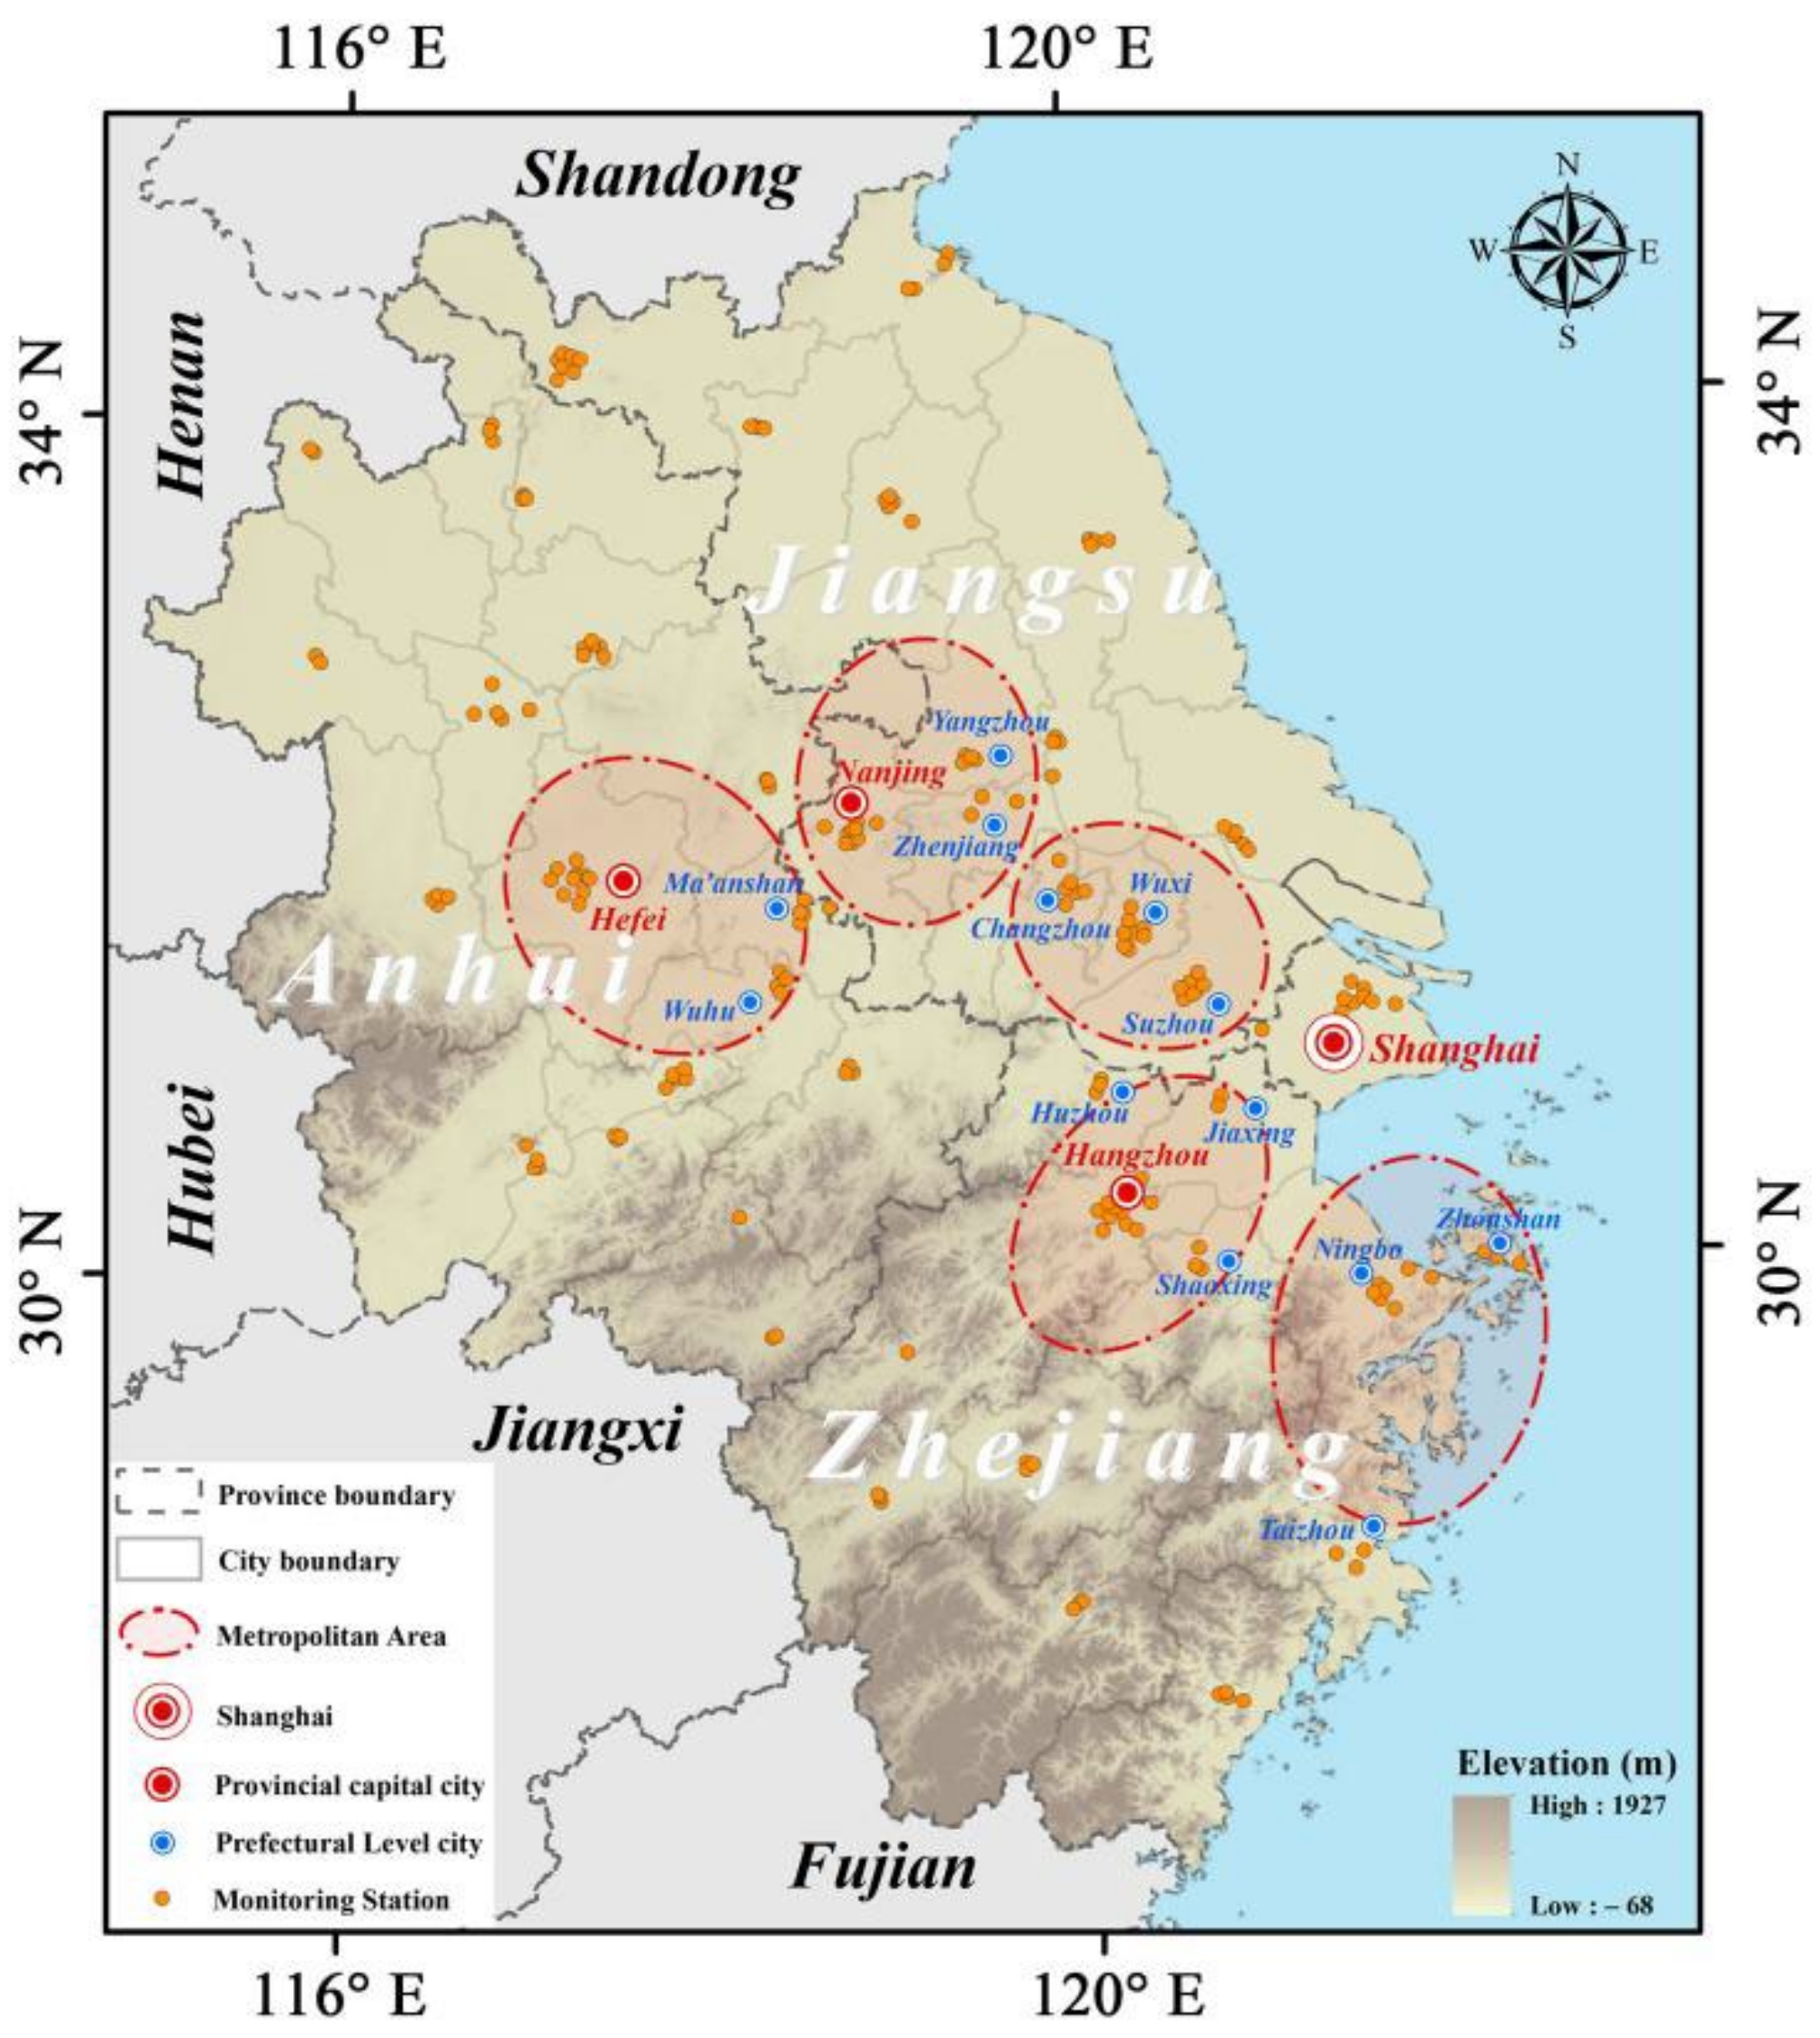
2.1. Study Area

The YRD region includes Shanghai, Jiangsu Province, Zhejiang Province, and Anhui Province, China, and includes 41 cities (Figure 1). The YRD is located in the lower reaches of the Yangtze River and has a typical subtropical monsoon climate with high temperatures and precipitation in summer, and low temperatures and wet cold in winter. The YRD is oriented from north to south and has variable topography. The northern region is a plain, while the southwest is mostly mountainous and hilly, and the eastern region has cities located close to the Yellow Sea and East China Sea. As one of the most active economic regions in China, the YRD has a development pattern of “one core and five circles”, where Shanghai is the core and accounts for 24.5% of the national economy. Along with rapid economic development, the YRD is facing degradation in ecosystem functions and environmental quality [26].

2.2. Data Sources

2.2.1. Ground-Monitored Air Pollutant Data

We collected hourly PM2.5 and O3 concentration data from a total of 191 sites in 41 cities (mainly urban areas) in the YRD region from 1 January 2015 to 31 December 2020 (Figure 1; data obtained from the China National Environmental Monitoring Centre, CNEMC). We used ground-monitored data from air sampling stations to study the temporal changes in PM2.5 and O3 concentrations and verify the accuracy of PM2.5 and O3 remote sensing data. Since the gas observation conditions changed from 273 K and 1013 hPa to 298 K and 1013 hPa, respectively, after 31 August 2018, we multiplied the O3 concentrations for September 2018 and afterwards by a factor of 1.09375 [27]. In addition, we selected the maximum daily 8 h average (MDA8) concentration of O3 to represent the day’s O3 pollution.

2.2.2. Remote Sensing Data on PM2.5 and O3

High-precision, high-resolution estimates of PM2.5 and O3 concentrations (raster data) were generated by Wei’s team based on multi-source data such as ground observations, remote sensing products, atmospheric reanalysis data, and emission inventories, with deep learning methods used for spatio-temporal modelling [28,29]. We collected the latest and highest resolution rasters of PM2.5 and O3 concentrations from Wei’s personal homepage (https://weijing-rs.github.io/product.html accessed on 14 July 2022). Among them, the PM2.5 concentration data have a resolution of 1 km, while the O3 concentration data resolution was 10 km. We collected data for 6 years, from 2015 to 2020, for the spatial analysis of PM2.5 and O3 pollution and fine-scale analysis of the control scope in the YRD region. We evaluated the accuracy of pollutant estimates using data measured at ground stations. The results show that the data are reliable, with the R2 of PM2.5 and O3 data being 0.873 and 0.821, respectively (Figure A1, Appendix B).

2.2.3. Other Data

The digital elevation model used in this study was the ASTER GDEM v3 product (https://www.earthdata.nasa.gov/ accessed on 14 July 2022), which provides comprehensive coverage and a spatial resolution of 30 m. These data were used to identify the influence of topography on the distribution of pollutants.

2.3. Methods

2.3.1. Trend Analysis

Univariate linear regression is a commonly used prediction method, which uses the least-squares method to find a relationship between two variables. Its advantage is that the operation mode is simple, and it is suitable for trend analysis of time series data [30]. The method can calculate the interannual variability of PM2.5 and O3 concentrations with the following formula [31]:
S l o p e = n i = 1 n ( i × ρ i ( p o l ) ) i = 1 n i × i = 1 n ρ i ( p o l ) n i = 1 n i 2 ( i = 1 n i ) 2
where Slope is the slope of the pixel regression equation, ρ(pol) is the average pollutant concentration of the pixel in the ith year, and n is the study period. A Slope > 0 means that the pollutant concentration of the pixel is increasing; Slope = 0 means that the pollutant concentration of the pixel is basically unchanged; and Slope < 0 means that the pollutant concentration of the pixel is decreasing.

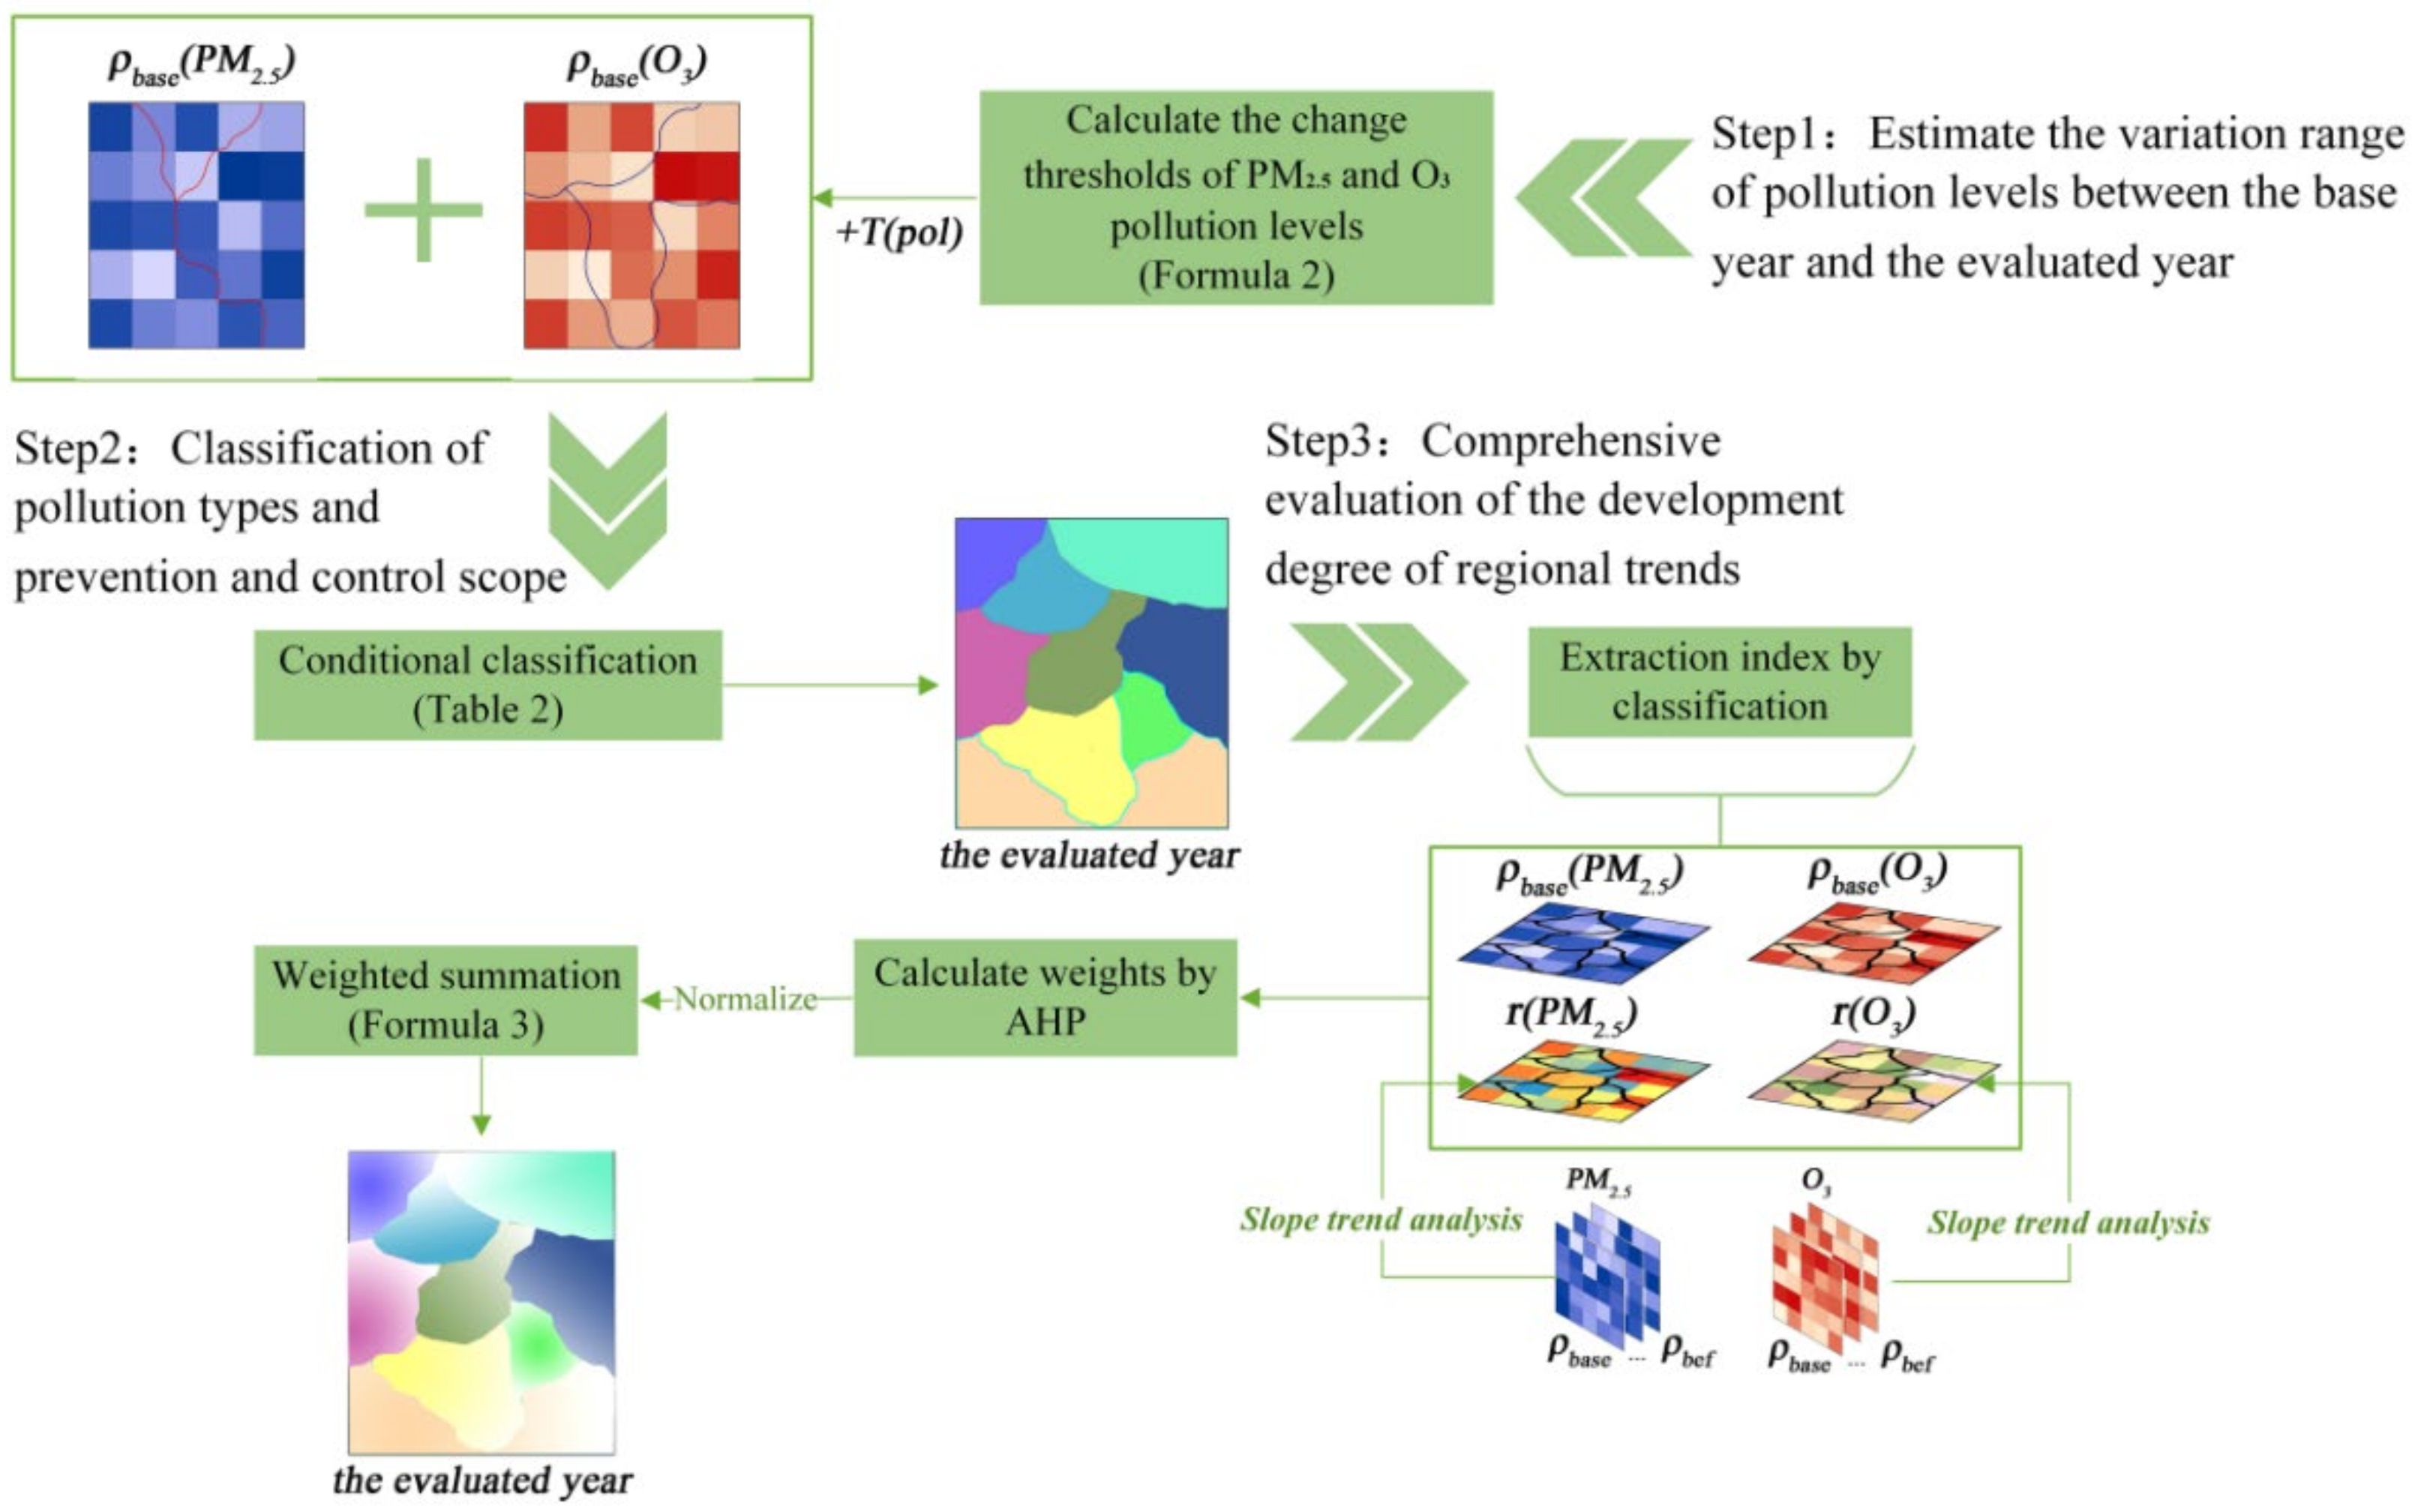
2.3.2. Division of Pollution Prevention and Control Regions

To subdivide the scope of air pollution prevention and control and the types of composite pollution, we estimated the concentrations of PM2.5 and O3 in the evaluated year by analysing the interannual variation in pollutant concentrations in previous years, thereby establishing a pollution type classification system that included transition types. At the same time, we used four indicators (PM2.5 concentration, O3 concentration, PM2.5 rate of change, and O3 rate of change) to evaluate the regional trends in each pollution type. The strength of the evaluation results is a further explanation for the distribution of pollution types in the future.
We set 2020 as the evaluated year in the experiment and predicted the spatial distributions of various pollution types for 2020 according to changes in pollutants in three prior years (2017–2019), on the basis of PM2.5 and O3 concentrations in the base year (2017). The research method was divided into the following three steps (Figure 2).
Step 1: First, estimate the pollution level change threshold V(pol) based on the changes in PM2.5 and O3 between the base year and evaluated year. The threshold V(pol) represents the critical point at which the pollution level (or pollution type) changes in the evaluated year. The V(pol) is calculated as follows:
V ( p o l ) = T ( p o l ) n × c m e a n ( p o l )
c m e a n ( p o l ) = A v e r a g e ρ b e f ( p o l ) ρ b a s e ( p o l ) n 1
n = y e v a y b a s e
where T(pol) is the standard value of China’s environmental quality, T(PM2.5) = 35 µg/m3, T(O3) = 100 µg/m3, yeva is the evaluated year, ybase is the base year, and cmean(pol) is the average annual change concentration of pollutants in the period between the base year and the year before the evaluated year.
Then, according to the standard and threshold values, the PM2.5 and O3 concentrations in the base year were divided into three states (Table 1): excessive, non-excessive, and transitional. A pollution type in an area with a base year concentration that is between the standard value and the threshold V(pol) is classified as transitional.
Step 2: On the basis of classifying the PM2.5 and O3 pollution status in the first step, the composite pollution types and prevention and control scope of the evaluated year were divided, according to Table 2.
Step 3: Using the base year PM2.5 concentration ρ(PM2.5) and O3 concentration ρ(O3), the rates of change r(PM2.5) and r(O3) from the base year to the evaluated year were used as key indicators to comprehensively evaluate the trend d in each region in the second step.
For single pollution types (High PM2.5 pollution, High O3 pollution):
d = θ × ρ p o l + γ × r p o l
where θ = 0.4 and γ = 0.6 are the weights of the PM2.5 or O3 concentration ρ and change rate r. Approximate proportions of θ and γ were obtained by fitting a quadratic curve to a large number of PM2.5 concentrations during the study period.
For composite pollution types:
d = α × ρ P M 2.5 + β × ρ O 3 + ω × r P M 2.5 + σ × r O 3
where α, β, ω, and σ are the weights of the four indicators. The weights were calculated by analytic hierarchy process (AHP), and are 0.2627, 0.1411, 0.455, and 0.1411, respectively. The AHP results are shown in Appendix A.

3. Results and Discussion

3.1. Temporal Variations in PM2.5 and O3 Concentrations in the YRD

From 2015 to 2020, the overall PM2.5 concentration in the YRD shows a significant downward trend. The annual variation shows a “U” shape, with a nadir in summer (June–August) and a peak in winter (December–February; Figure 3a). In contrast, the O3 concentrations generally show an upward trend, and the annual variation shows an inverted “U” shape with a peak in April to September (Figure 3b). The main reason for the significant seasonality in PM2.5 and O3 is that higher relative humidity is generally associated with low levels of PM2.5 and O3, while higher temperatures are associated with low PM2.5 and high O3 concentrations [32,33]. In addition, PM2.5 affects the photochemical reaction rate through the radiation effect, thereby promoting O3 generation in summer and inhibiting O3 generation in winter [34]. Conversely, the high summer concentration of O3 can promote the formation of secondary PM2.5. It is worth noting that the variation of O3 concentrations in the YRD has a double-peak structure; that is, the O3 concentration decreases around July, which is related to a decrease in sunshine hours and an increase in relative humidity caused by cloudy and rainy weather conditions [35].
The strict implementation of China’s APPCAP policy ensures that the PM2.5 concentration in the YRD region continues to decline [36]. However, the average PM2.5 concentration in the winter of 2020 still reaches 63.43 µg/m3, and 98.9% of the days seriously exceed the WHO guideline for the average 24 h PM2.5 concentration (15 µg/m3). Similarly, the O3_MDA8 concentration greatly exceeds the WHO standard at the O3 warm season peak (60 µg/m3) from March to August 2019, with the highest value (152 µg/m3) appearing in June (Figure 3b). Research shows that increases in solar radiation and air temperature and decreases in sea level pressure are the main reasons for the increases in ozone in the YRD from 2015 to 2019 [37]. As PM2.5 concentrations decrease, the weakening of shortwave radiation by aerosols decreases, creating higher temperatures, longer sunshine duration, and lower relative humidity to a certain degree [38], which promote O3 generation. Therefore, the abatement of primary PM and gaseous PM precursors cannot effectively control air pollution, which leads to an increase in O3 concentration, especially in summer [39]. It is very important for APPCAP to clarify the spatial distributions and trends in PM2.5 and O3 pollution in the YRD, and to formulate effective and targeted prevention and control measures.

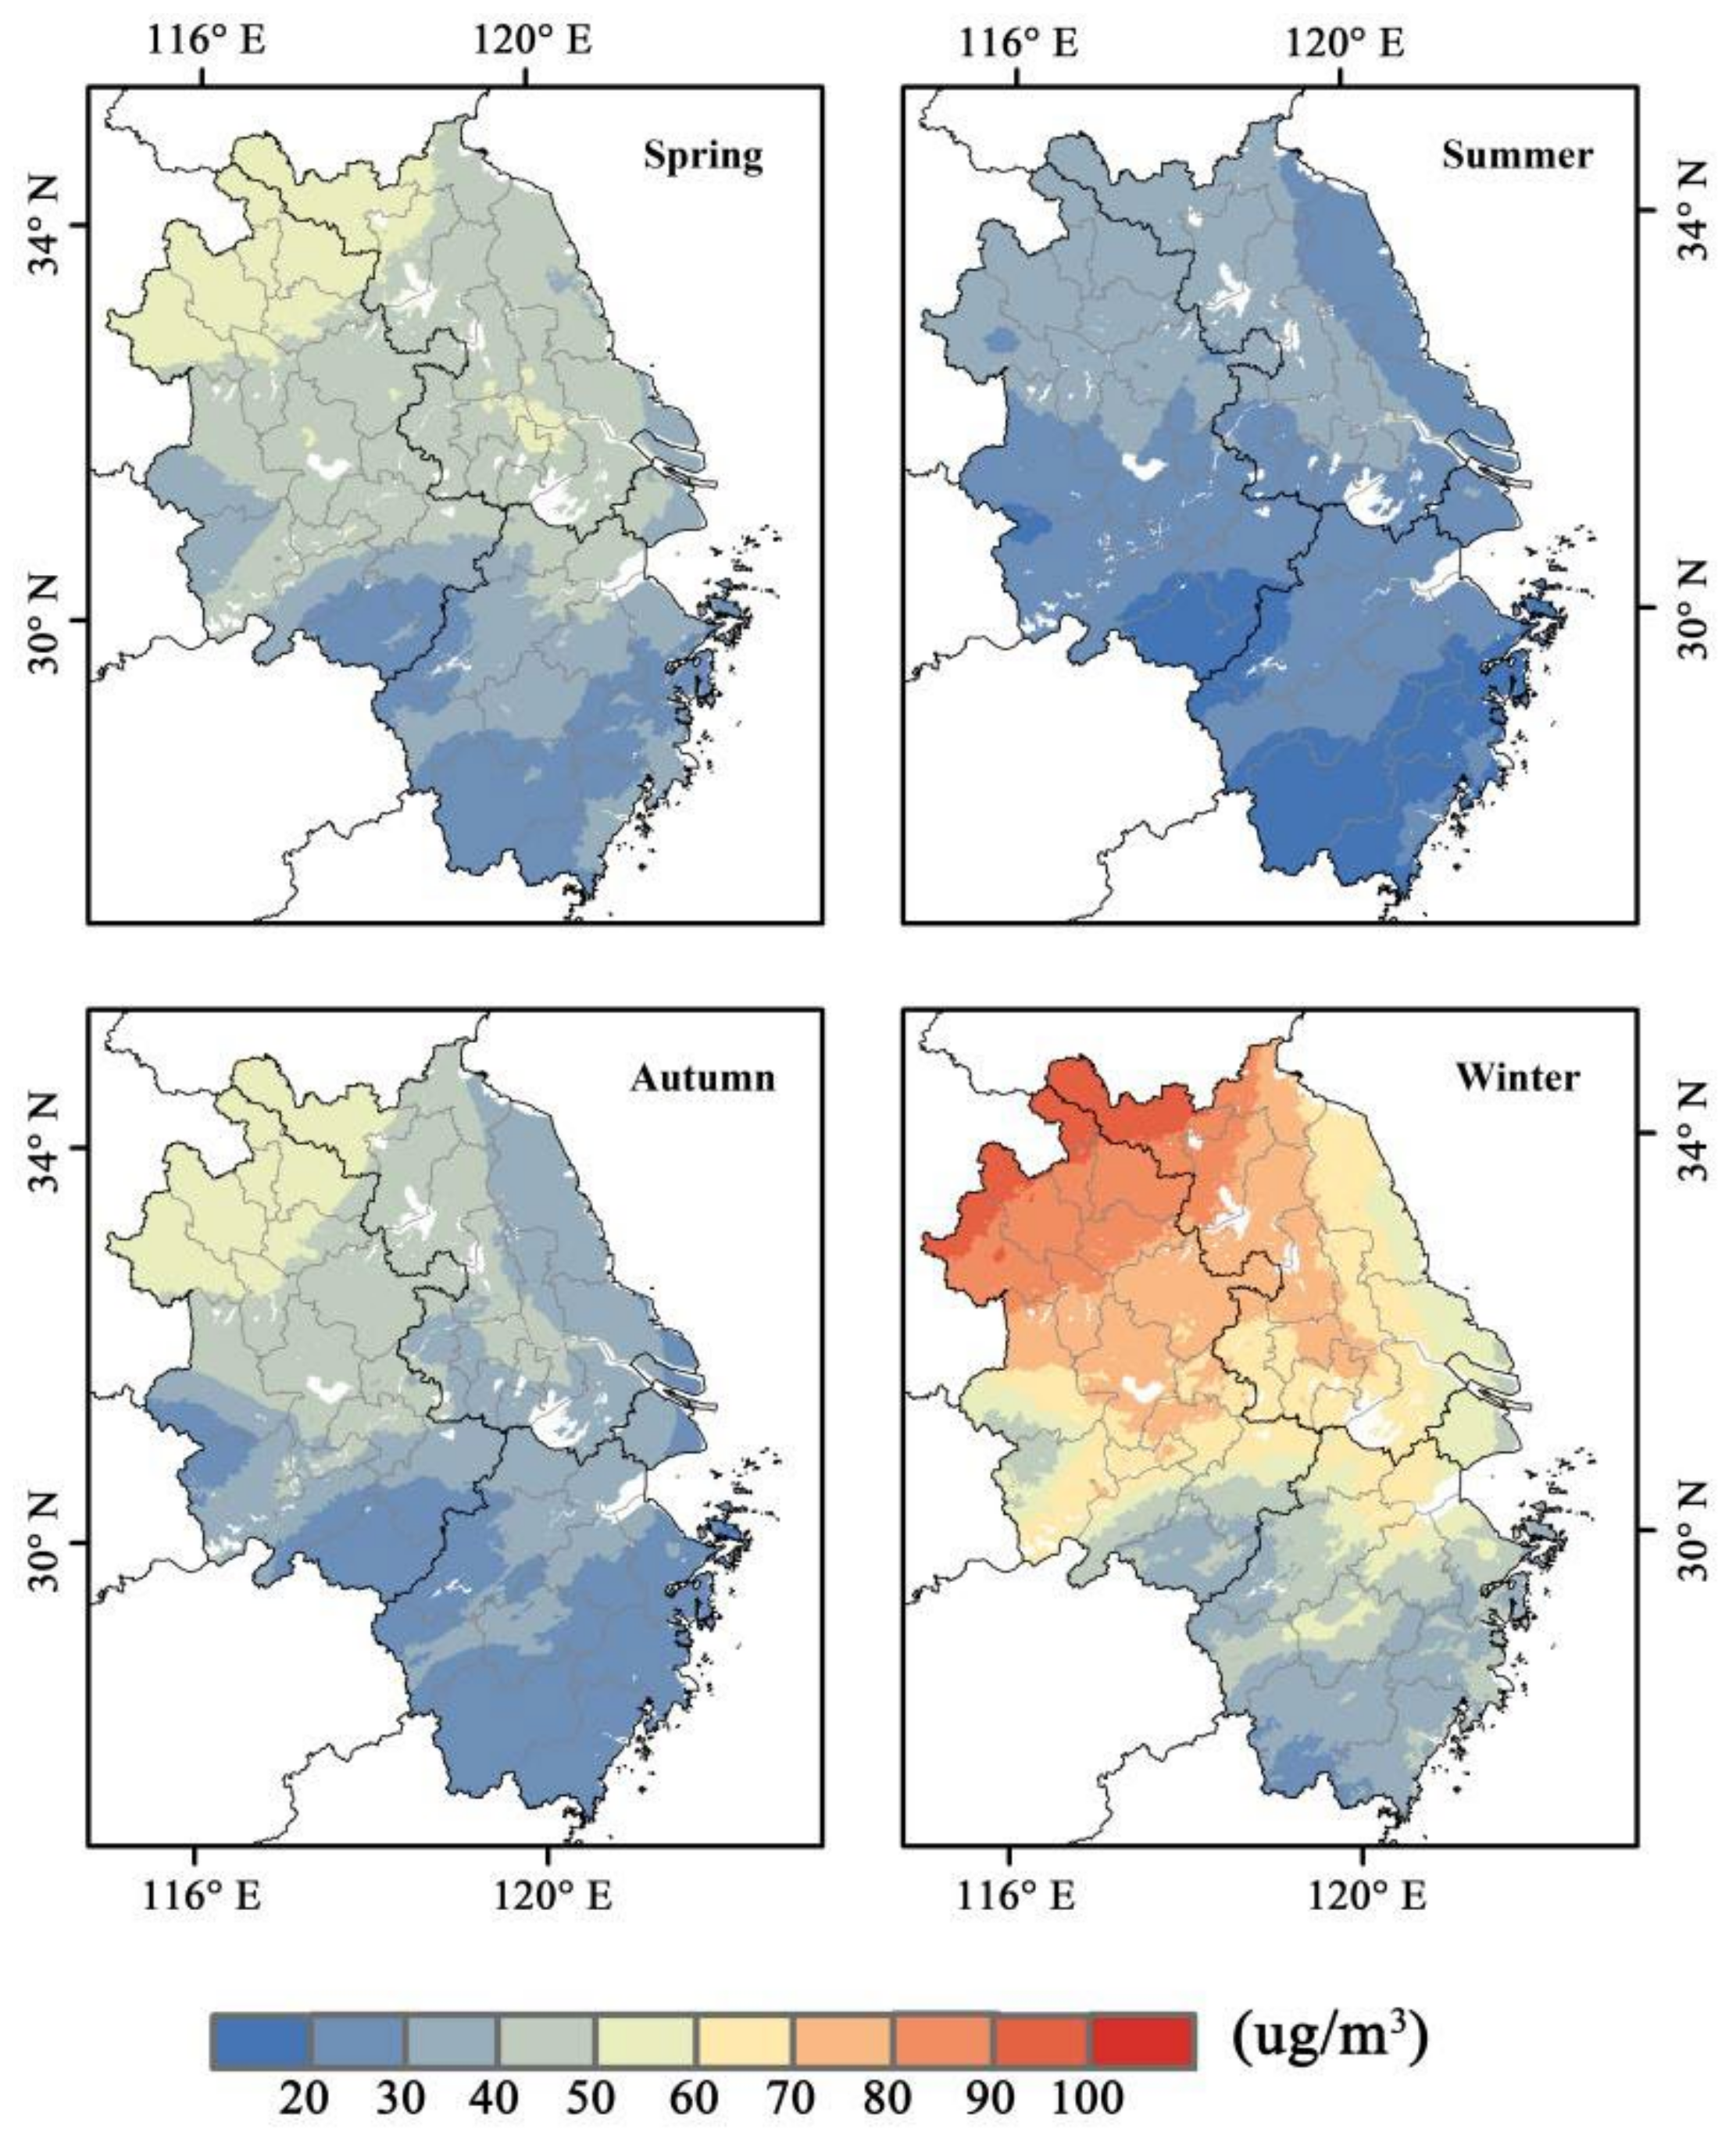
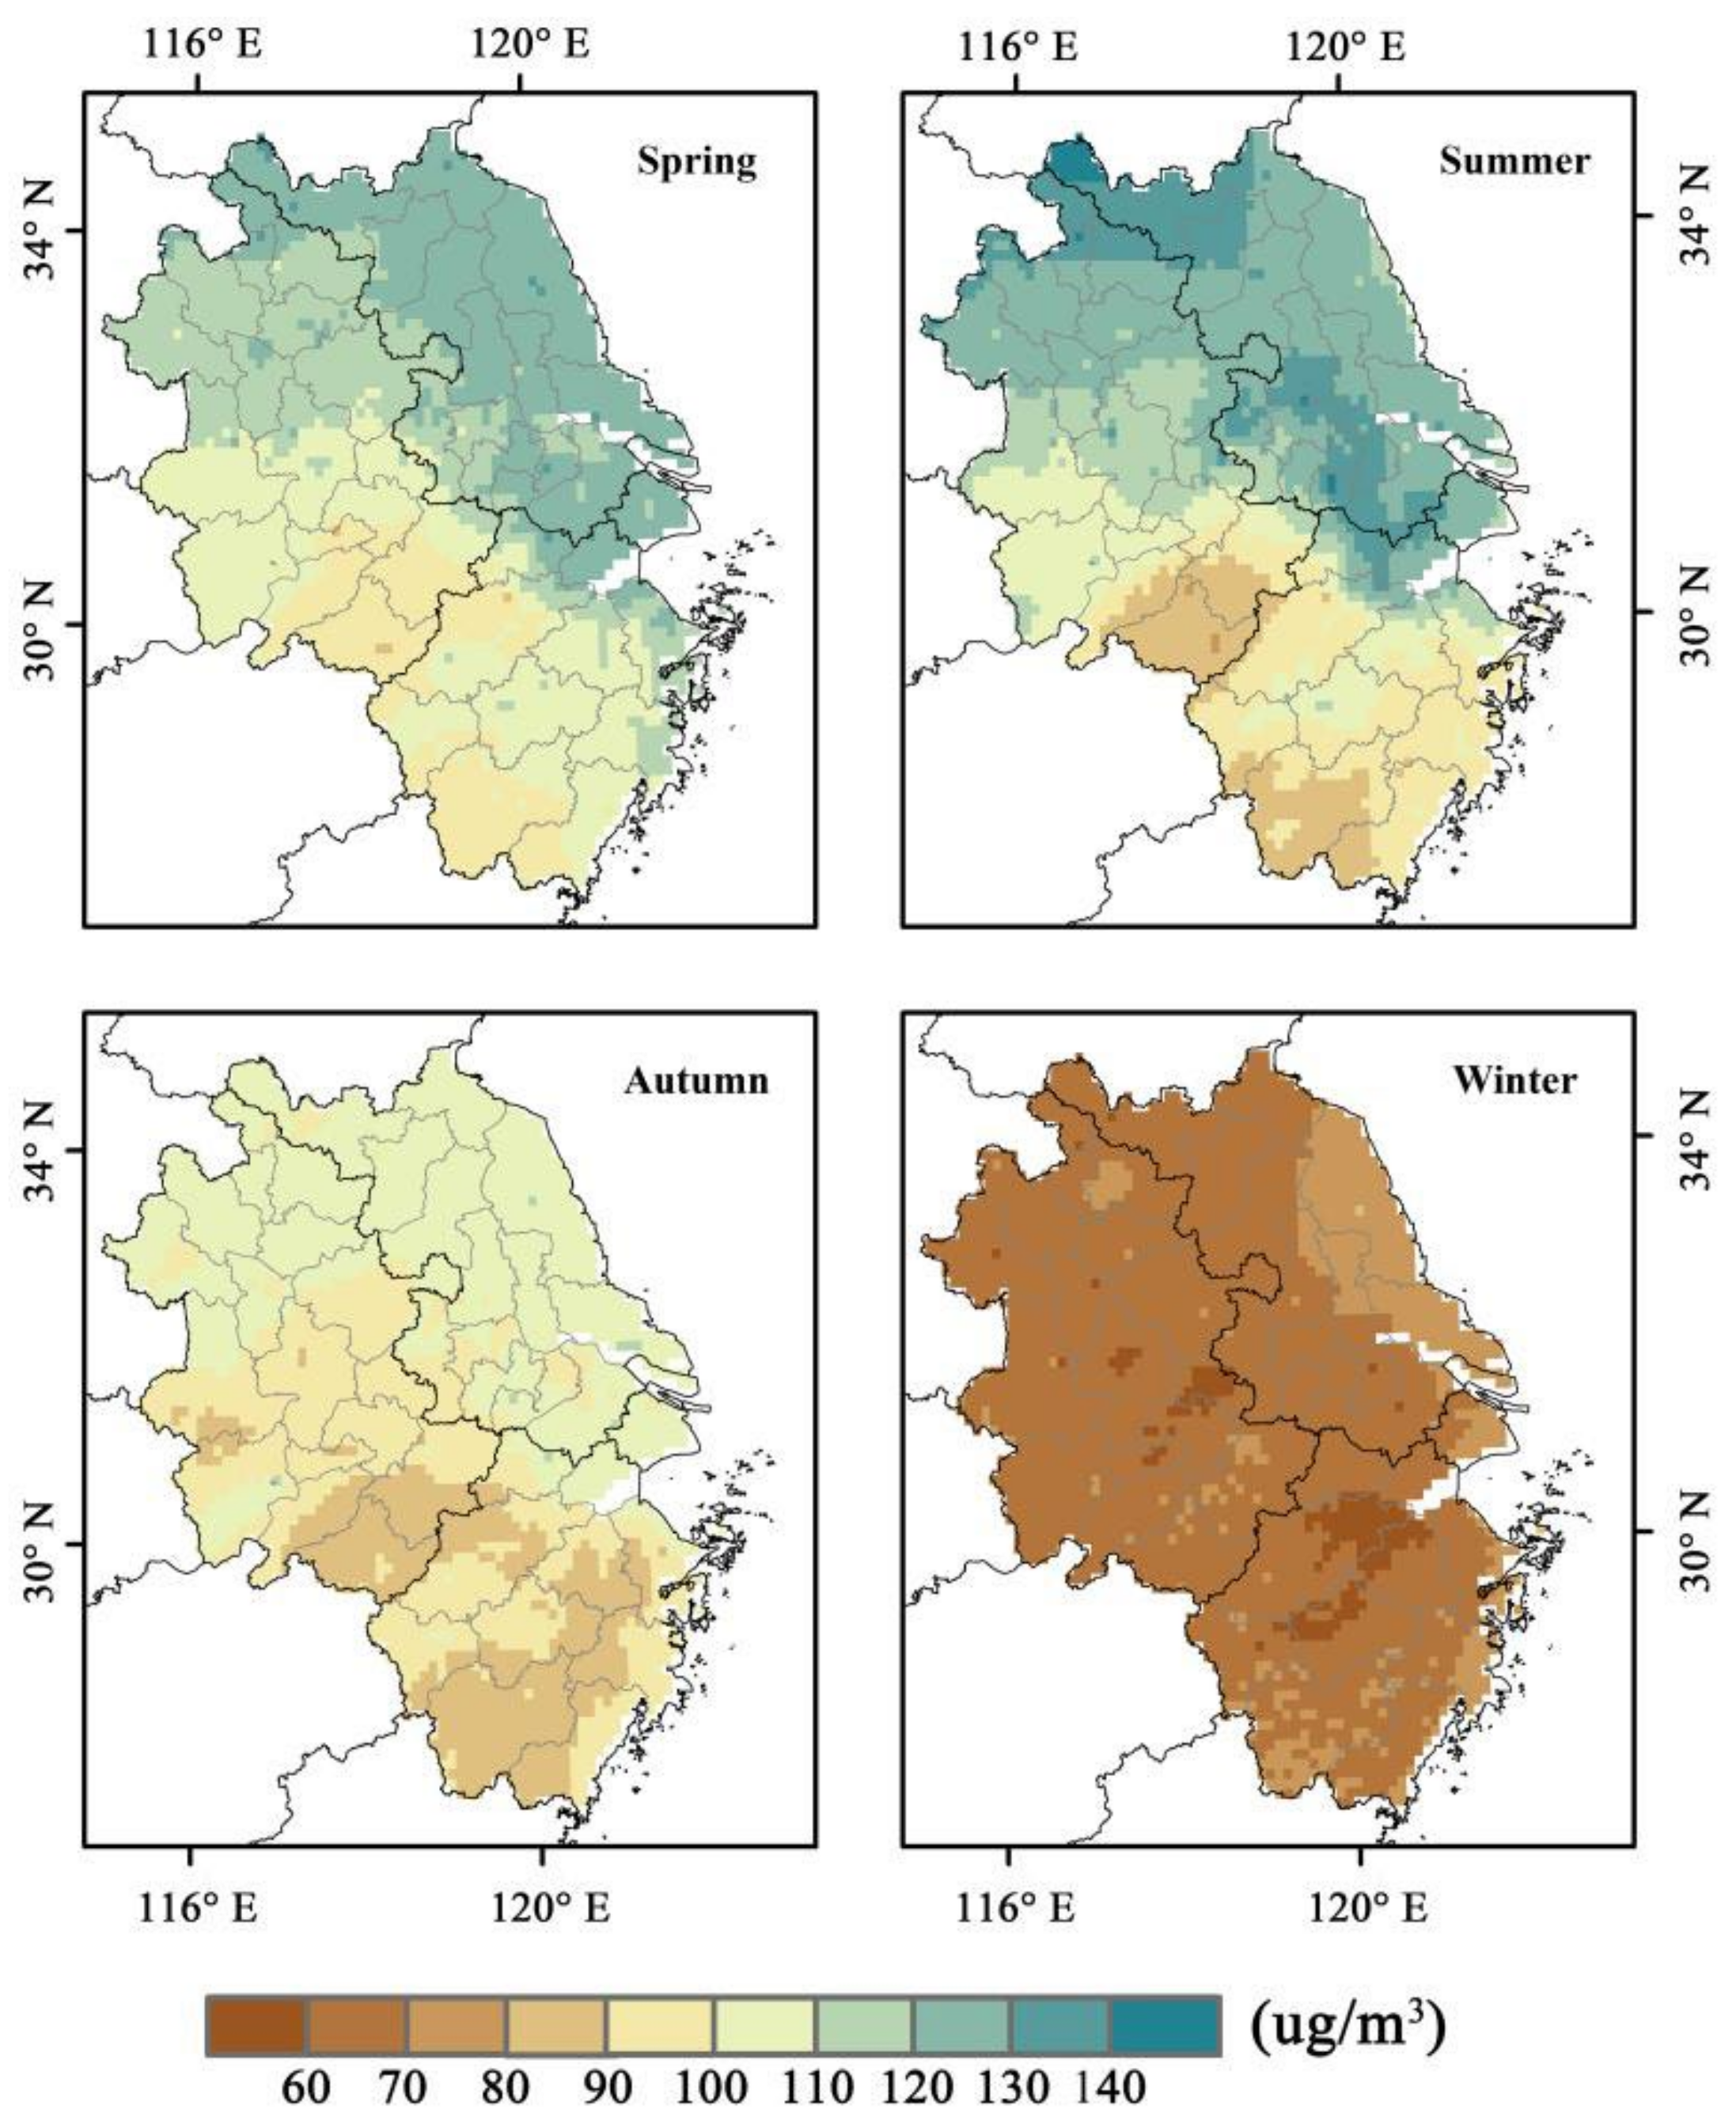
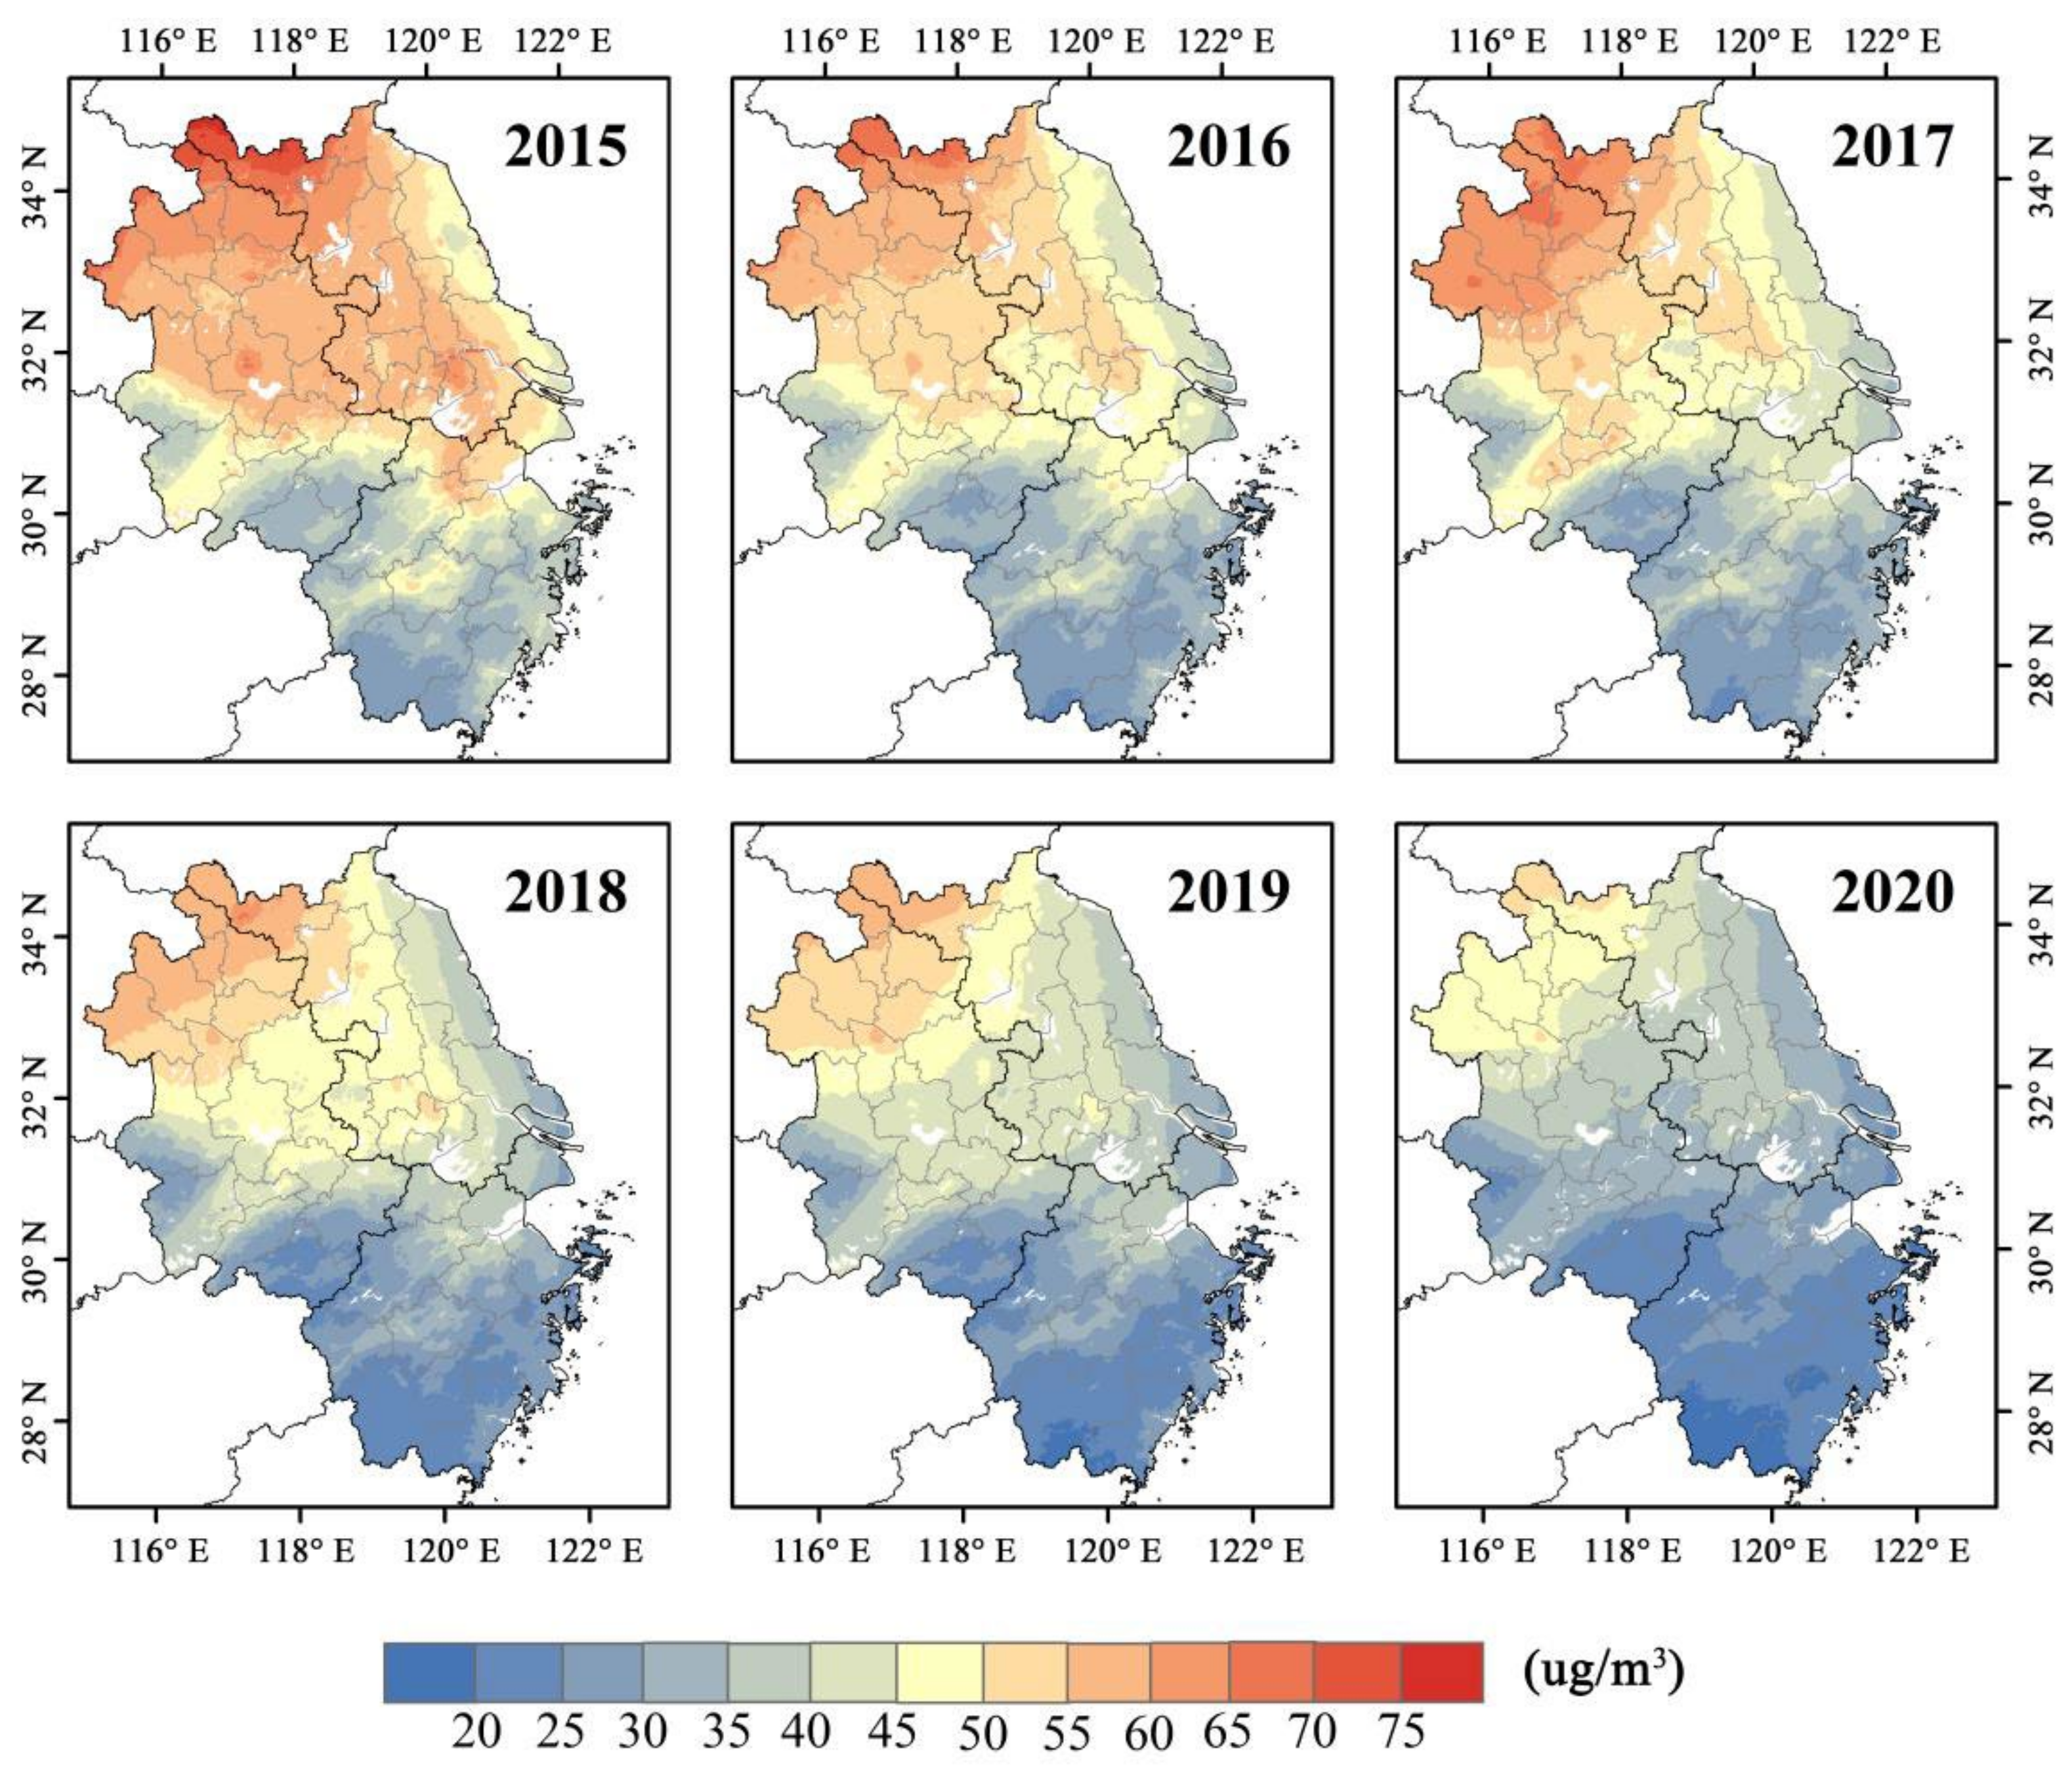
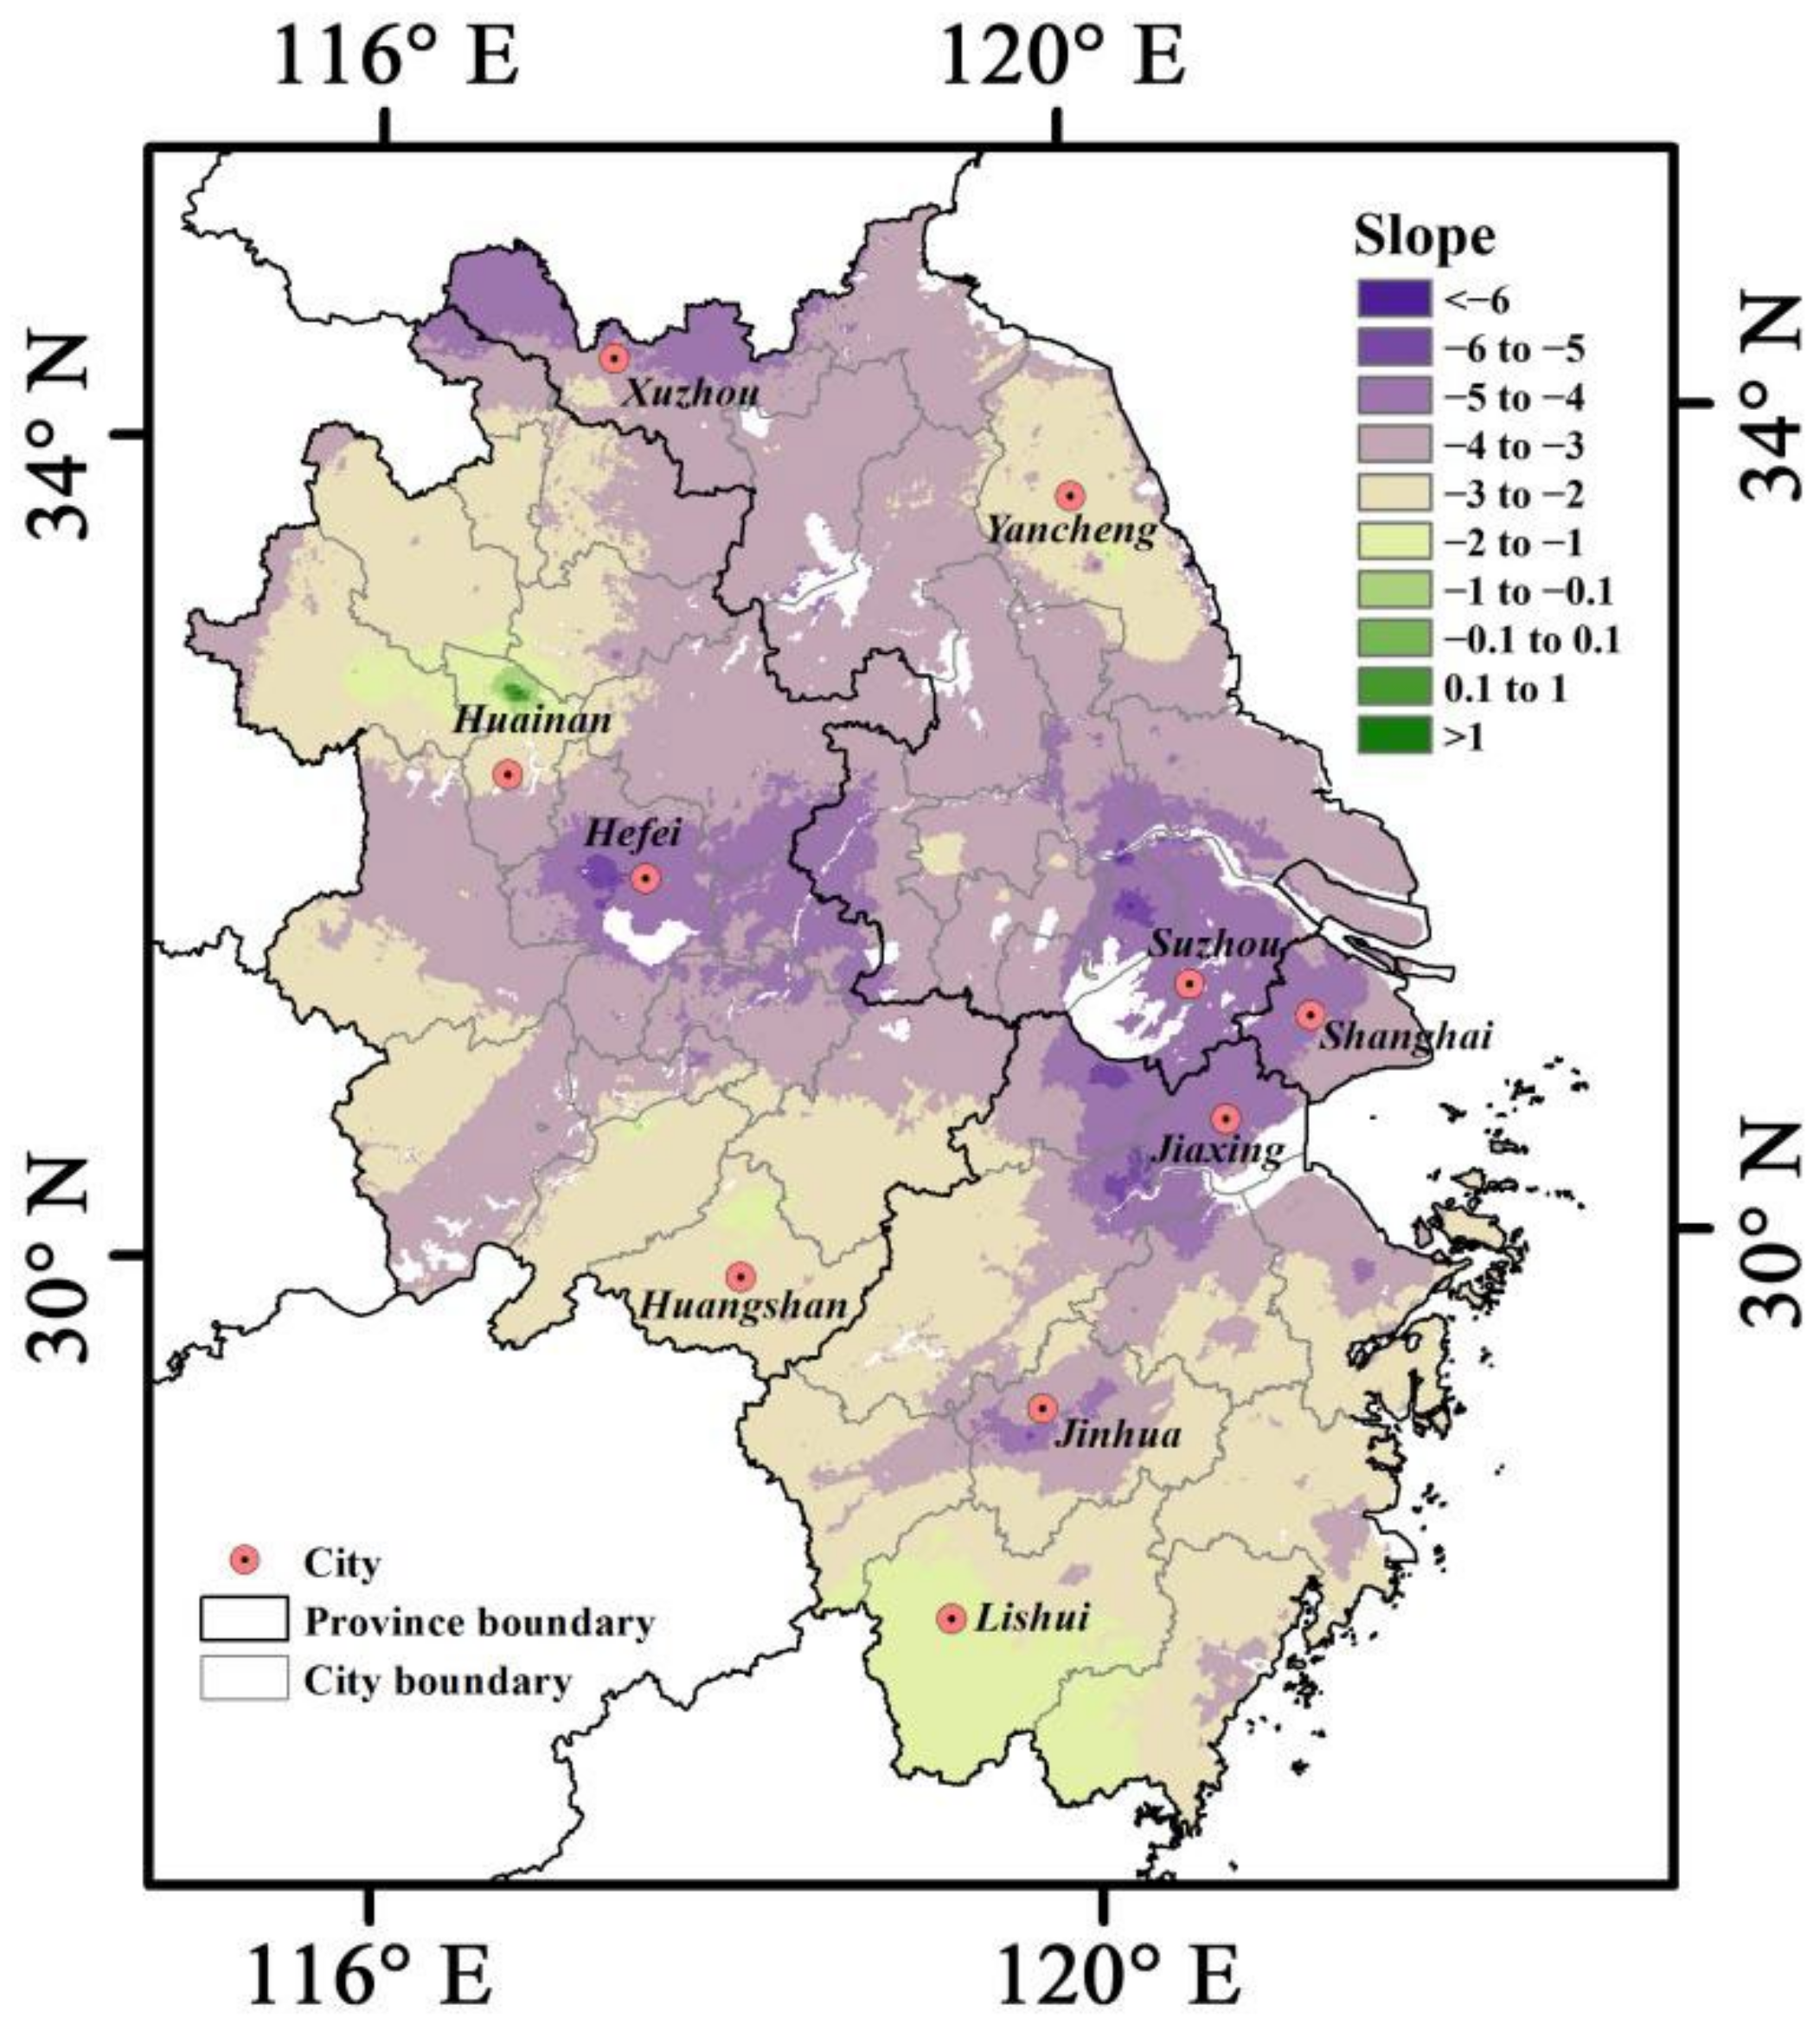
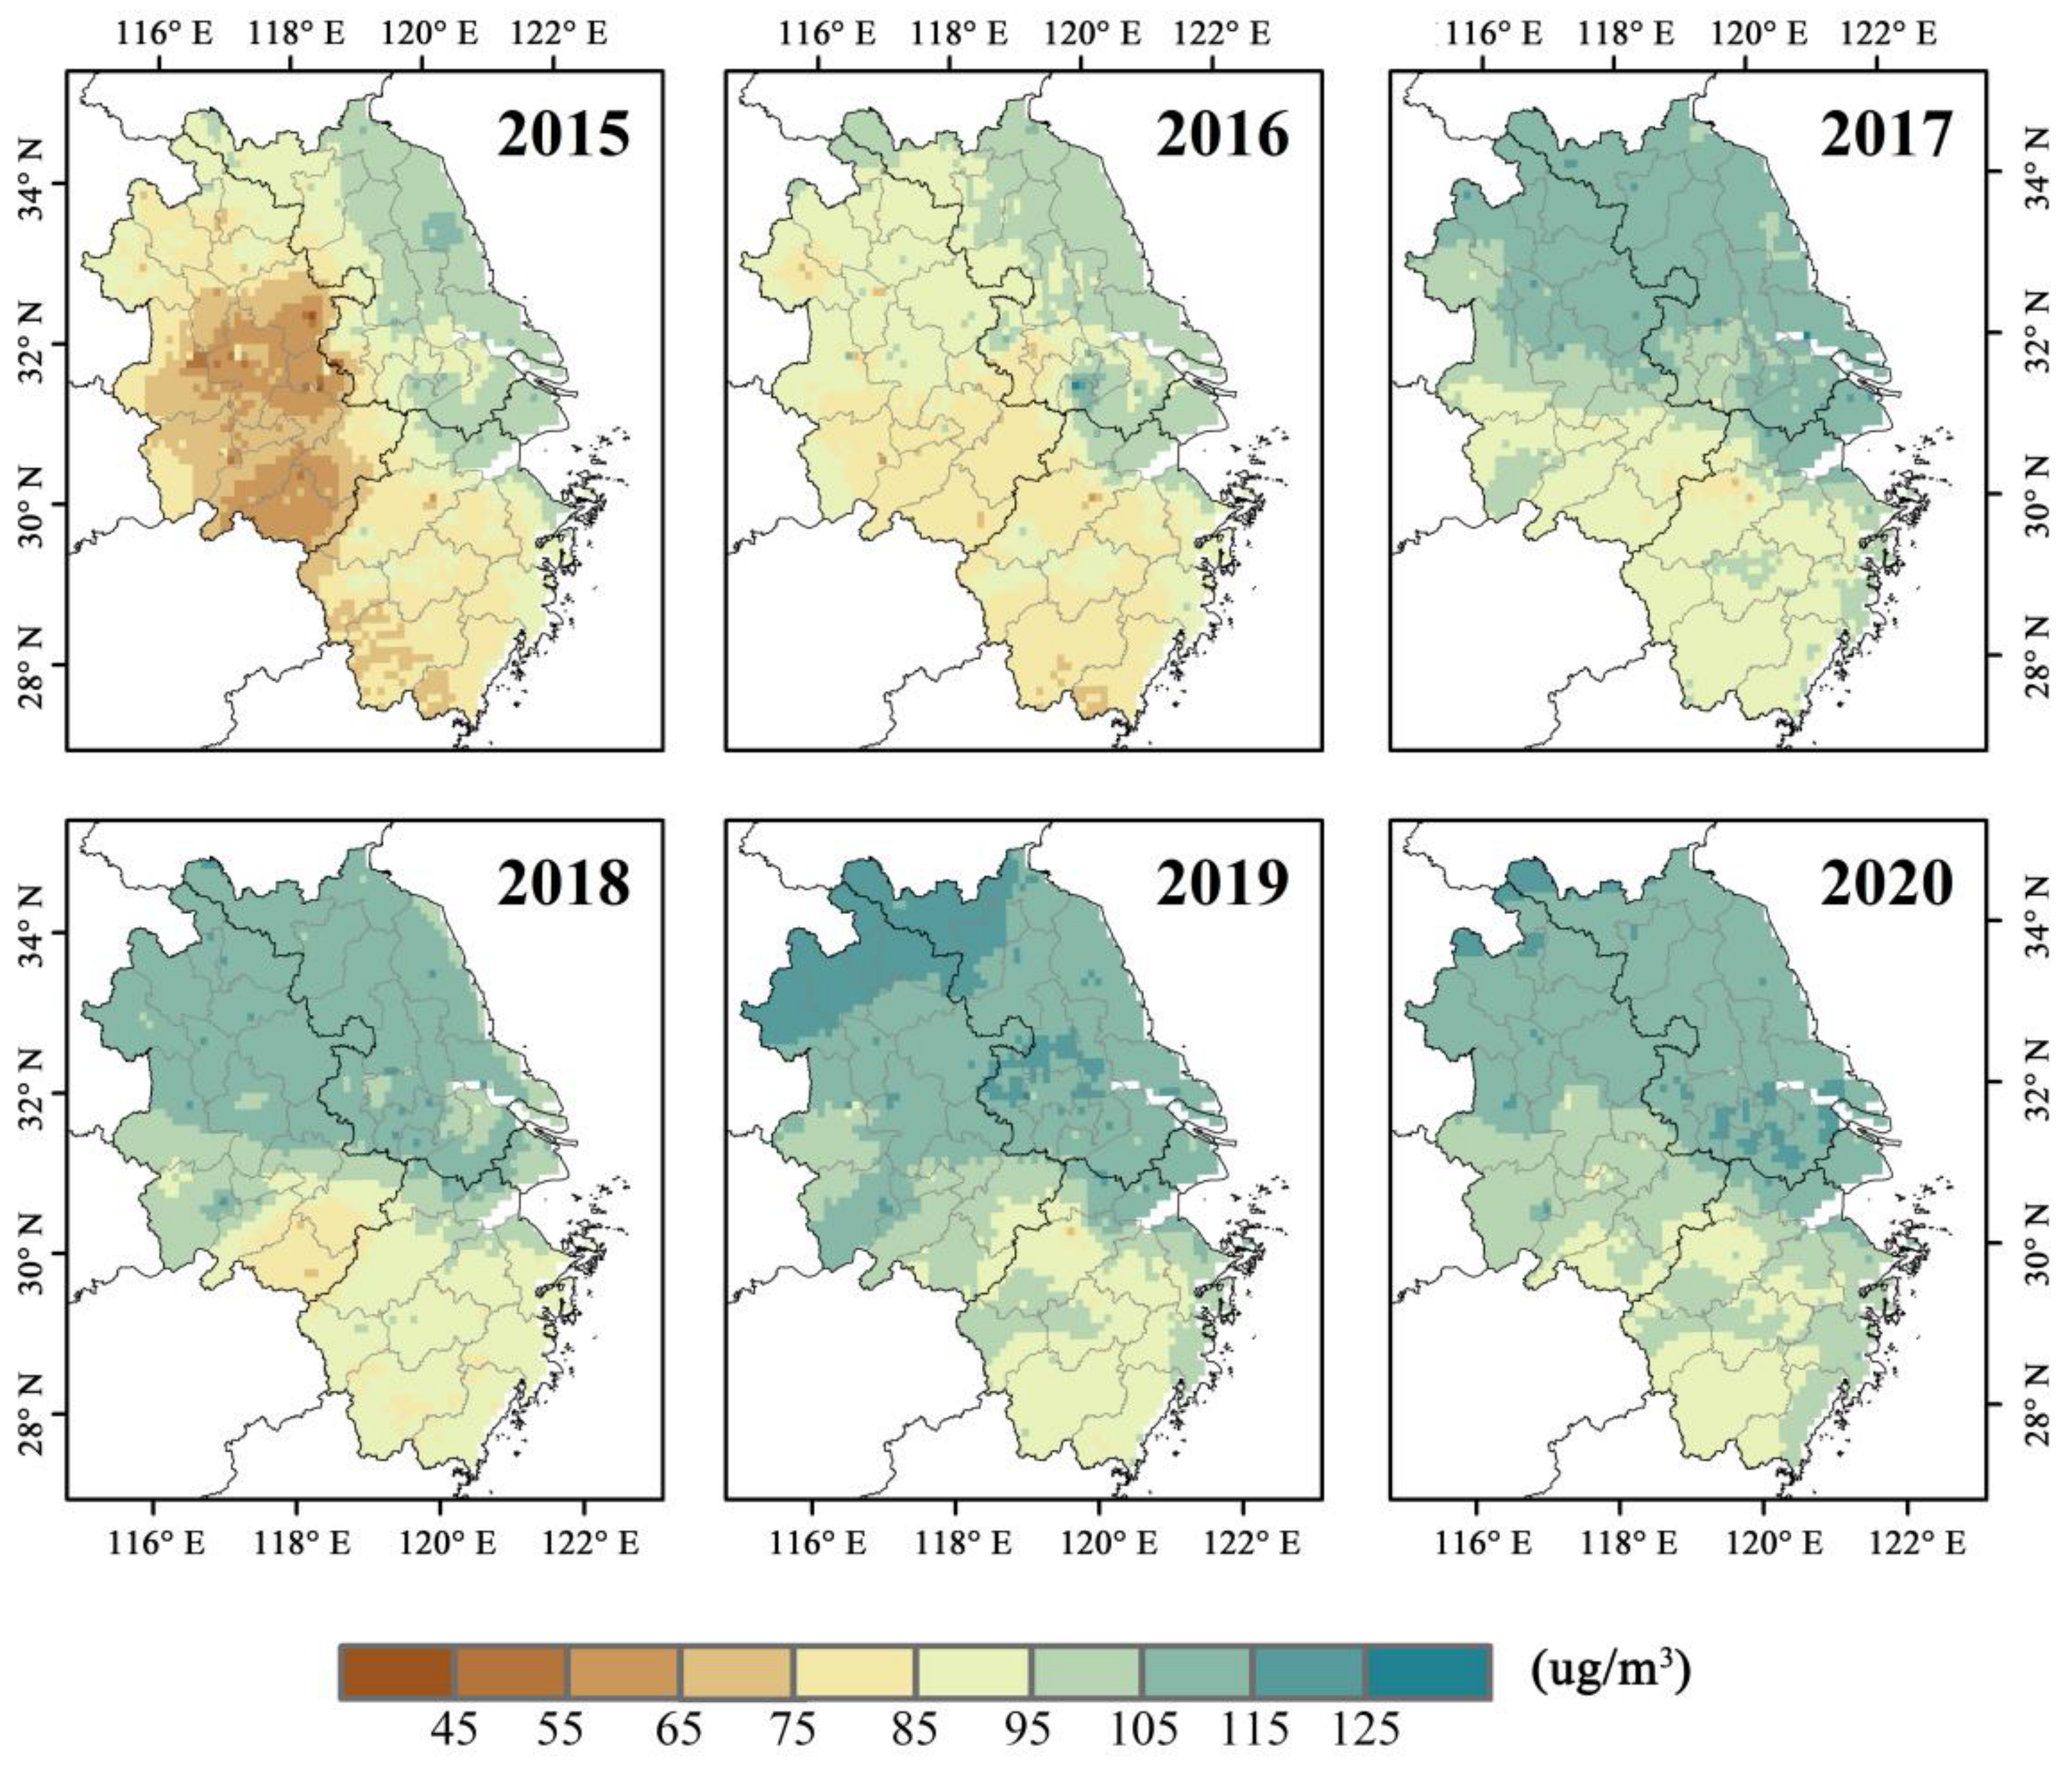
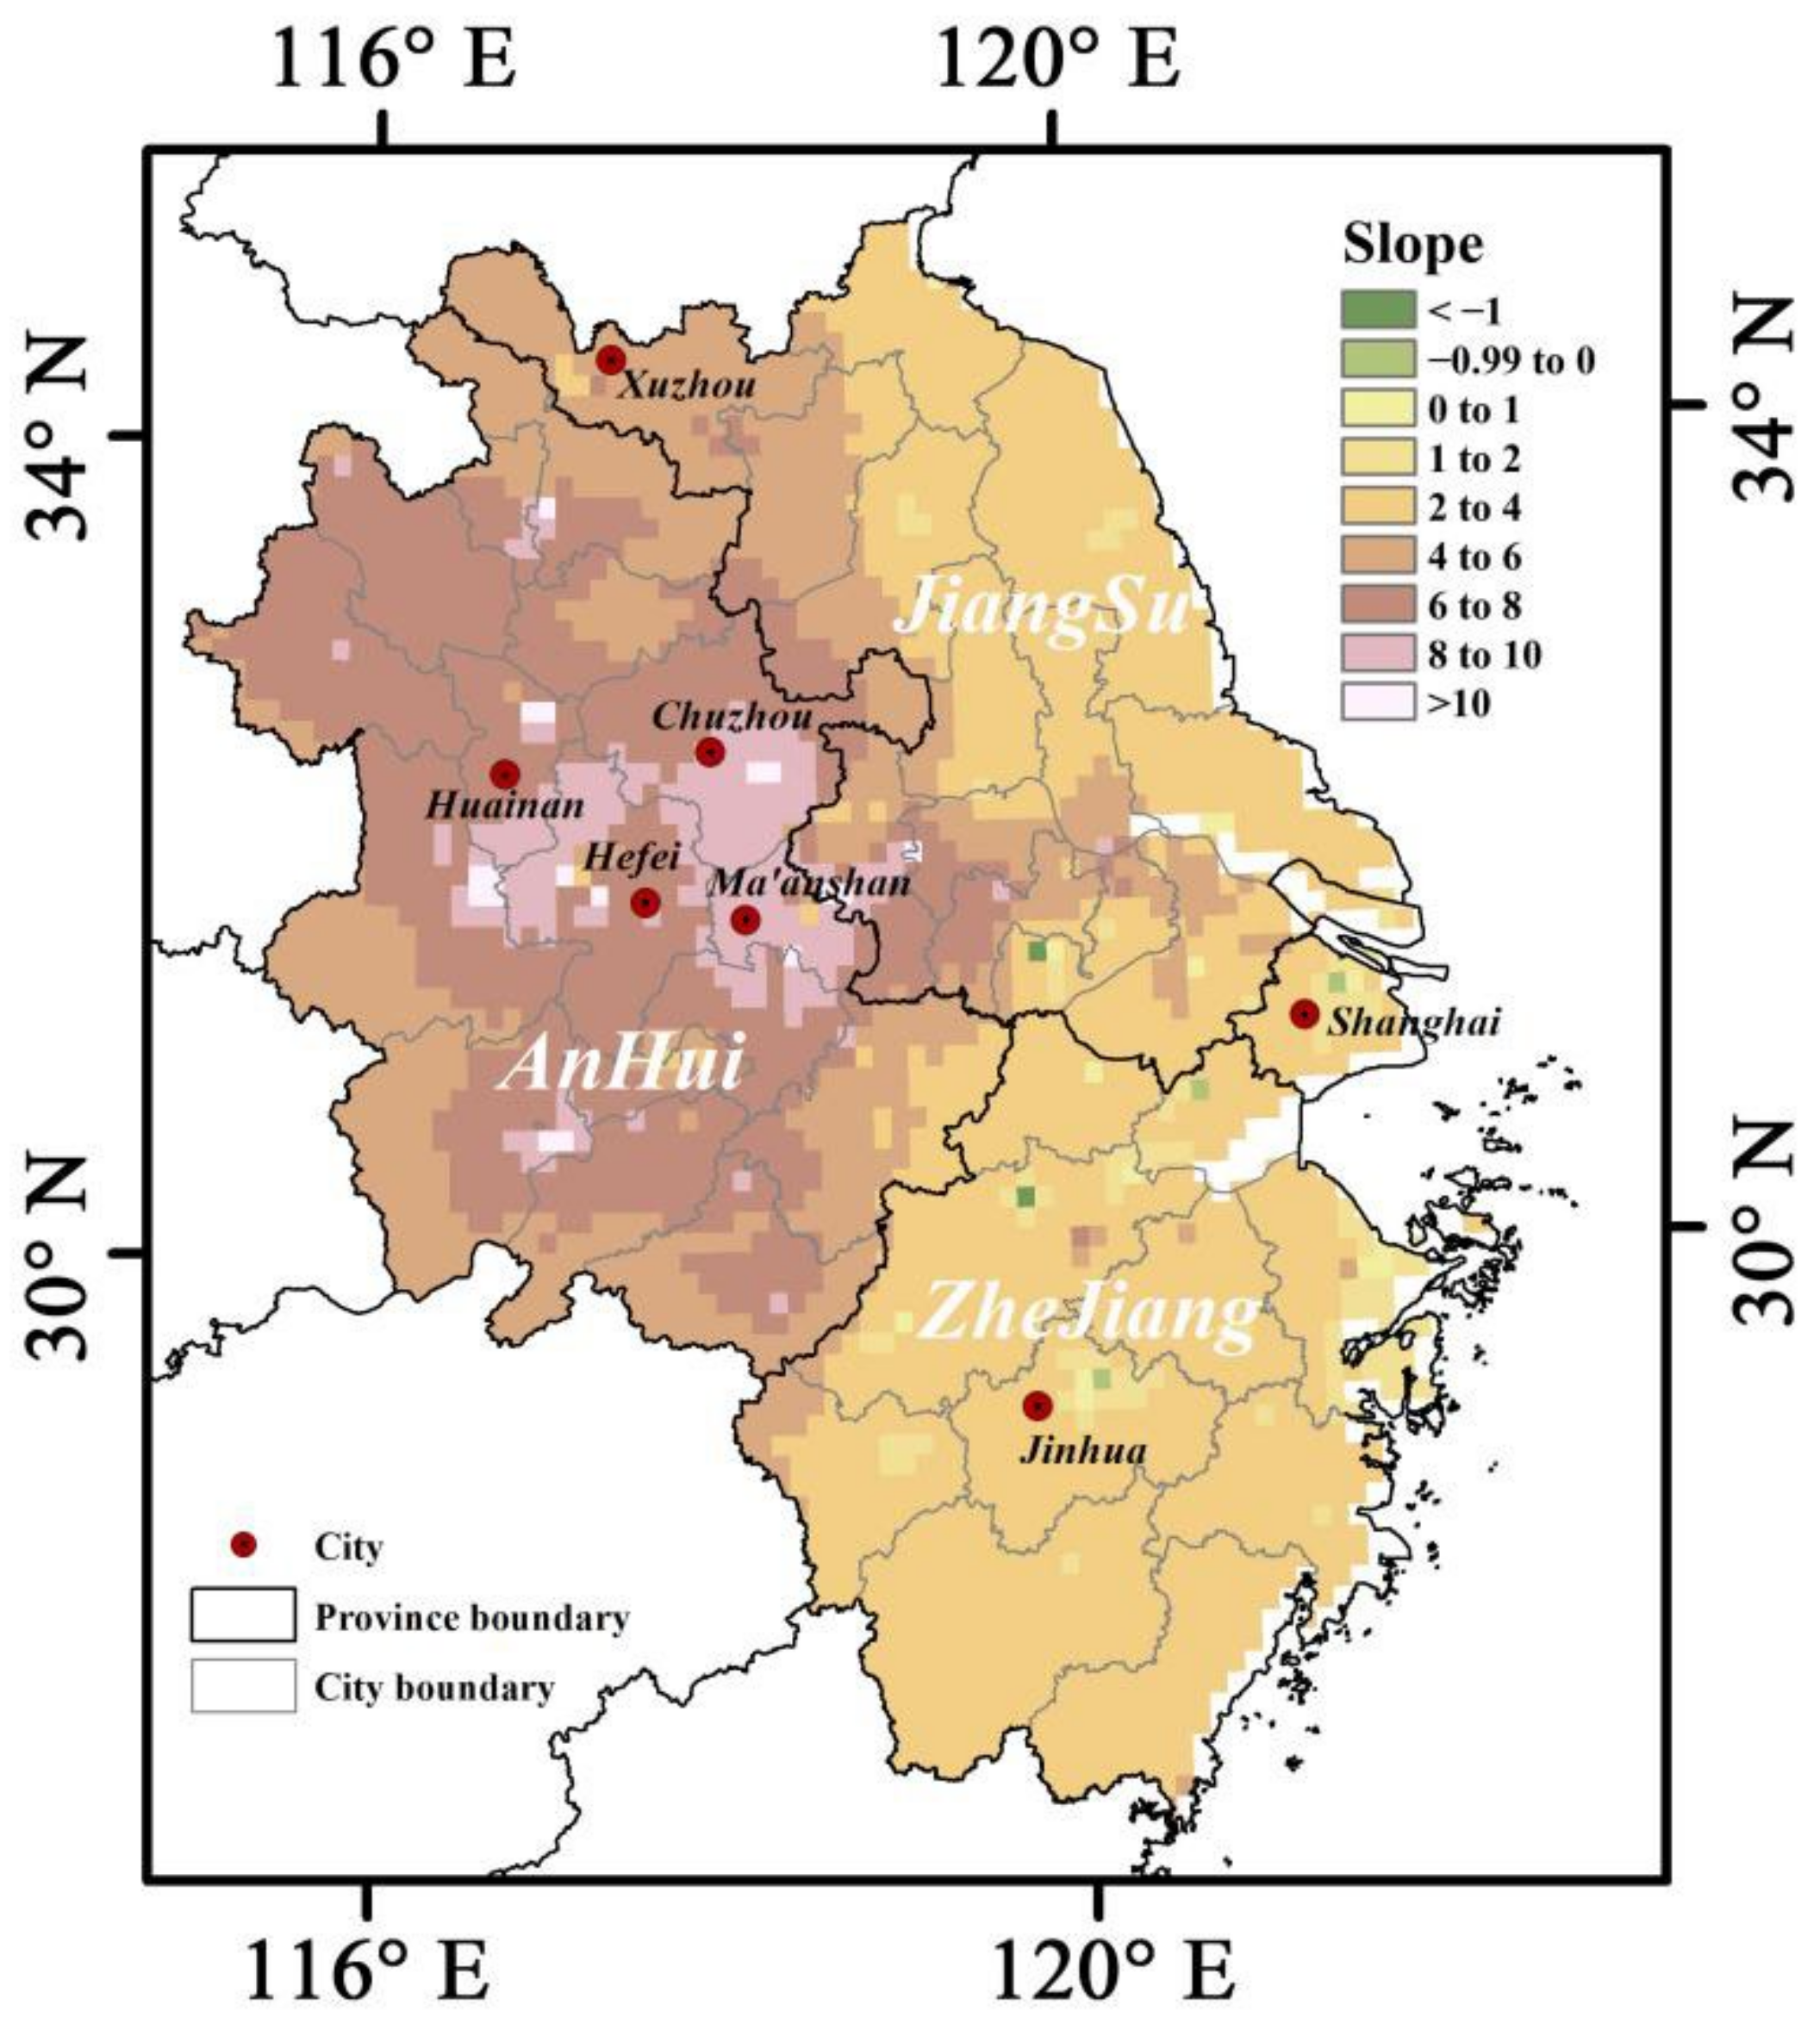
3.2. Spatial Variations in PM2.5 and O3 Concentrations in the YRD

Figure 4 shows that the PM2.5 concentrations in the YRD region have obvious spatial differences and are closely related to the terrain. They tend to be high in the north and low in the south. The most polluted area in the YRD is Xuzhou in the north; its annual average concentration of PM2.5 reaches 78.7 µg/m3 in 2015 and remains at a high level of 56.8 µg/m3 in 2020. The northern part of the YRD is heavily polluted by PM2.5 in winter (Figure A2), being affected by polluted air masses from northern and southern China. On the one hand, it receives pollutants transported from the north and, on the other hand, significant downward movement of the air mass stabilizes the weather conditions, thus hindering the diffusion of pollutants [40]. However, the sea–land wind in the south-eastern coastal cities is conducive to the diffusion of pollutants [41], resulting in distinct PM2.5 concentrations in the coastal and inland areas of Jiangsu Province, while the area bordering Shandong Province has more serious PM2.5 pollution. In addition, high altitudes hinder the transport of fine particles by surface wind (10 m wind) [42,43], so the mountainous areas of Anhui and Zhejiang Provinces maintain low PM2.5 concentrations.
Single linear regression analysis of the PM2.5 concentrations in the YRD region from 2015 to 2020 shows a significant decrease, except for slight increases in some local areas. The PM2.5 concentrations in the metropolitan areas centred on Hefei and Shanghai have the largest declines, while cities such as Lishui, Huangshan, and Yancheng have relatively stable concentrations (Figure 5). The vigorous implementation of emission-reduction measures, such as adjustments of industrial and energy structures, is the main reason for the obvious improvement in PM2.5 pollution [44]. In contrast, the PM2.5 concentration in some parts of Huainan increases slightly. This is due to the widespread coal mining activities in the area, and the late implementation of prevention and control work. On the other hand, Shi et al. found that 40% of PM2.5 in Huainan is contributed by transboundary air pollution (TAP). During serious pollution events, with changes in wind direction, the key PM2.5 pollution areas in Hefei and Chizhou become the source areas for Huainan [45], preventing its PM2.5 concentration from decreasing.
From 2015 to 2020, O3 pollution in the YRD region intensifies, with a trend of spreading from east to west. After 2016, high O3 concentrations appear in the northern part of the YRD and spread downward. By 2019, the annual average O3_MDA8 concentrations in 69.3% of the YRD region exceed 100 µg/m3 (Figure 6). In contrast to PM2.5 pollution, the causes of O3 pollution are more complicated in coastal areas, due to coastal geographical features, thus, maintaining higher O3 concentrations [46], especially in summer (Figure A3). This is related to the prevailing mesoscale sea–land wind circulation in summer in coastal areas. Figure 7 shows a significant increase in O3 concentrations in Anhui and western Jiangsu in recent years, with the trend related to air mass-transport paths (the Hefei–Nanjing–Shanghai axis and its urban agglomeration) in the central part of the YRD [47]. The O3 concentrations in the Hefei metropolitan area have the largest change, mainly due to the intensification of local emissions in recent years [48]. In addition, the enhanced atmospheric radiation caused by the sharp drop in PM2.5 concentrations in this region is also an important cause of the aggravated O3 pollution. It should be noted that O3 pollution in the YRD manifests as “flaky” pollution, and local pollution control policies can only improve O3 pollution in small areas. Relevant departments urgently need to undertake coordinated control measures in different administrative regions to improve the air quality of the YRD.

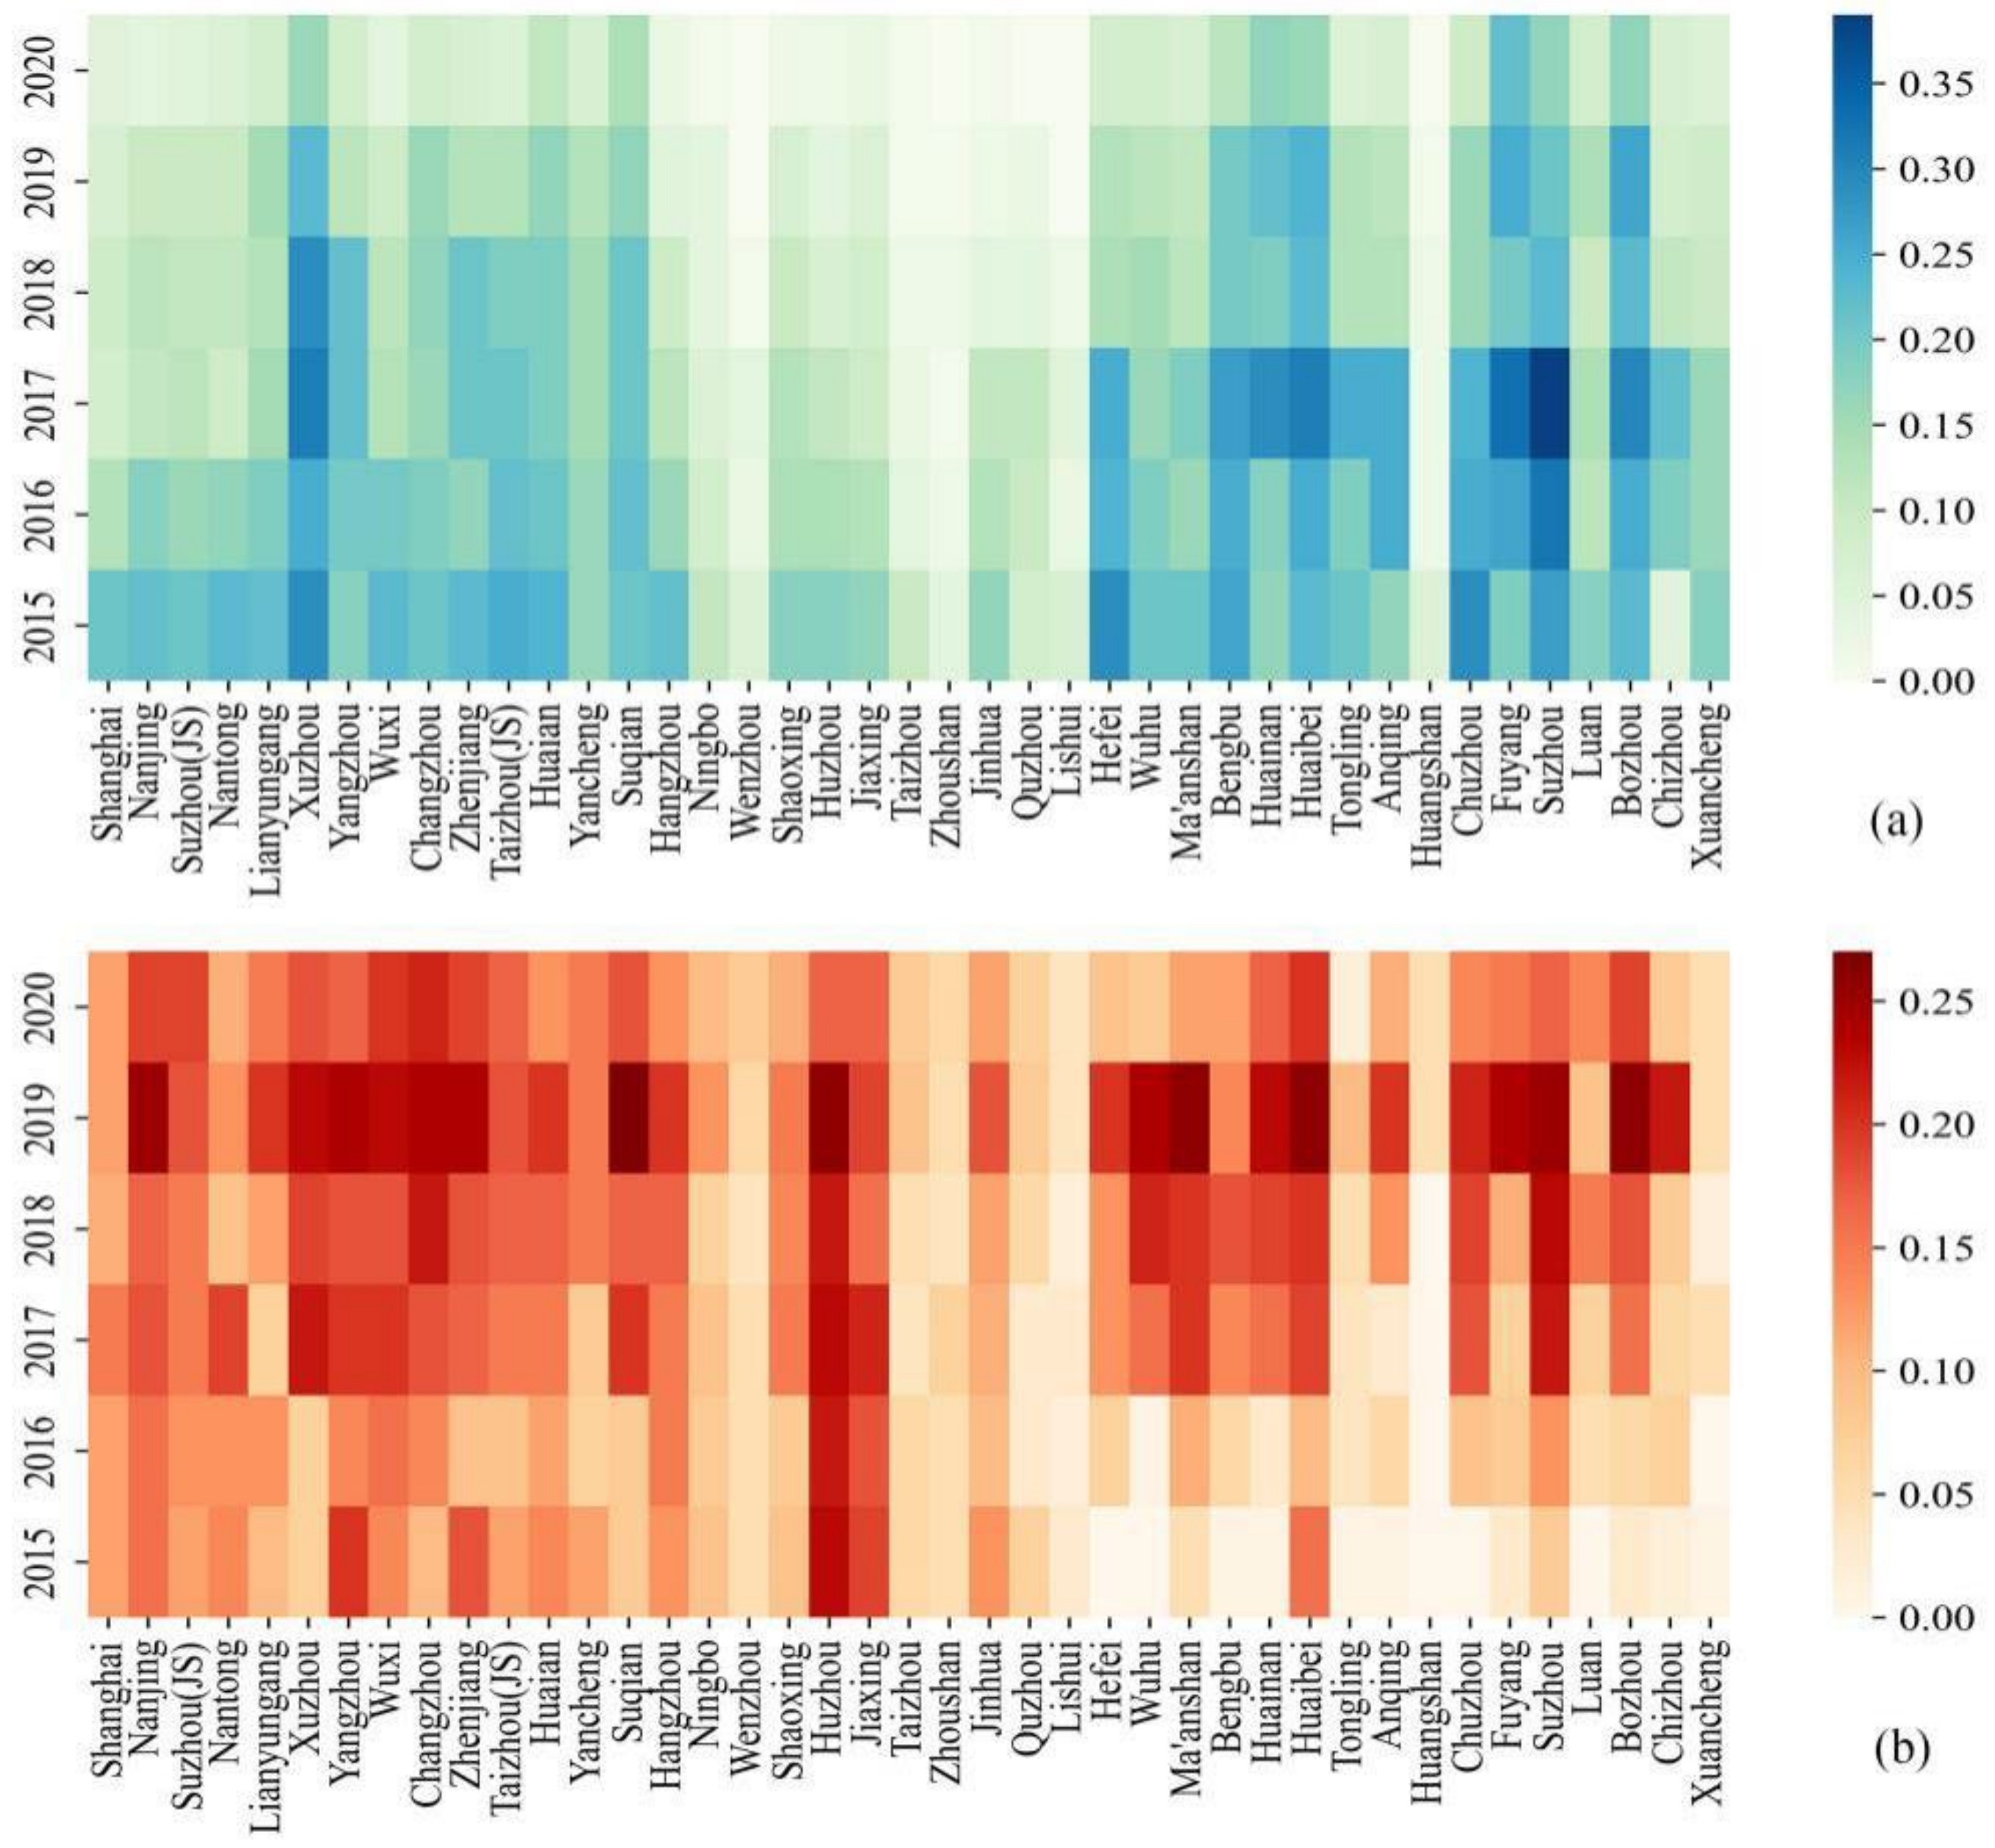
3.3. PM2.5 and O3 Pollution in YRD Cities from 2015 to 2020

Figure 8a shows the PM2.5 concentrations in cities in the YRD. From 2015 to 2020, the number of days with daily average PM2.5 concentrations exceeding the standard (>75 µg/m3) decreases year by year. The maximum proportion of days exceeding the standard occurs in 2017 (37%), and the minimum appears in 2020 (about 0). Some cities, such as Taizhou, Zhoushan, and Huangshan, have fewer days exceeding the standard. In contrast, Xuzhou, Huaibei, Suzhou (Anhui Province), and Bozhou are seriously polluted by PM2.5, with the proportions of days exceeding the standard in 2017 being 31%, 31%, 39%, and 30%, respectively. At the provincial scale, PM2.5 pollution is more serious in Anhui Province, with PM2.5 pollution days accounting for 48.9% of the overall pollution days in the YRD from 2015 to 2020. However, the PM2.5 pollution level in Zhejiang Province is relatively low, and the number of polluted days from 2015 to 2020 only accounts for 12.3% of the total number of polluted days in the YRD.
In contrast to the pollution status of PM2.5, Figure 8b shows that O3 pollution in cities in the YRD increases during 2015–2019. In 2019, the overall O3_MDA8 concentration seriously exceeds the standard (>160 µg/m3), and 17 cities have concentrations exceeding the standard on >20% of days. In 2020, the pollution situation improves. but there are still nine cities with >10% of days exceeding the standard. In Jiangsu Province overall, a large proportion of days have excessive O3 concentrations, and its number of days with O3 pollution from 2015 to 2020 accounts for 40.7% of the total number of days with O3 pollution in the YRD. In Zhejiang Province, only two cities—Huzhou and Jiaxing—have serious O3 pollution. However, Anhui Province has the largest change in O3 pollution, with 12.6% of total days of the YRD featuring O3 pollution in 2015, which increases to 35.1% in 2020.
Based on the PM2.5 and O3 concentration standards set by China, whether PM2.5 and O3 concentrations are excessive corresponds to four basic pollution types: co-pollution, PM2.5 pollution, low pollution, and O3 pollution. The results in Figure 9 show that most cities in the YRD have been in a co-pollution environment in the past few years. In addition, among these 41 cities, no cities have O3 pollution, only four have low pollution, and all cities in Jiangsu Province are of the co-pollution type. According to the gradual decline in PM2.5 concentrations and increases in O3 concentrations in recent years, the pollution type of each city will develop towards the lower right of its position in the figure. For example, Ningbo, Taizhou, and Zhoushan can be easily converted to the O3 pollution type, while Wenzhou may be converted from PM2.5 pollution to low pollution. Of course, considering the volatility of the PM2.5 and O3 pollution trends, cities located near the dividing line are also very likely to transition to adjacent pollution states.
Figure 10 shows the distribution of air pollution in different seasons from 2015 to 2020. The O3 accounts for the largest proportion of pollution in summer and pollutes 69.8% of the total area. The main pollution type in spring and autumn is co-pollution of PM2.5 and O3, accounting for 67.5% and 37.1%, respectively, in these seasons. Co-pollution mainly occurs in the northernmost part of the YRD. This means that the meteorological conditions for co-pollution of PM2.5 and O3 are higher relative humidity, higher surface temperature, and lower wind speed. These conditions benefit the hygroscopic growth of PM2.5 and the formation of O3 and, at the same time, are not conducive to the diffusion of pollutants [49]. In winter, almost the whole area features PM2.5 pollution. On a provincial scale, except for Zhejiang Province, Anhui, Jiangsu, and Shanghai have poor pollution situations. They have severe O3 pollution in spring and summer and suffer PM2.5 pollution in winter. In addition, autumn co-pollution is distributed in Anhui and Jiangsu Provinces. This requires the relevant departments to focus on reducing VOCs first when controlling air pollution in Anhui, Jiangsu, and Shanghai. Next, the reduction in NOx should be focused on, because NOx-focused strategies may exacerbate O3 pollution [50]. In Anhui and Jiangsu provinces, it is important to increase emission-reduction efforts.

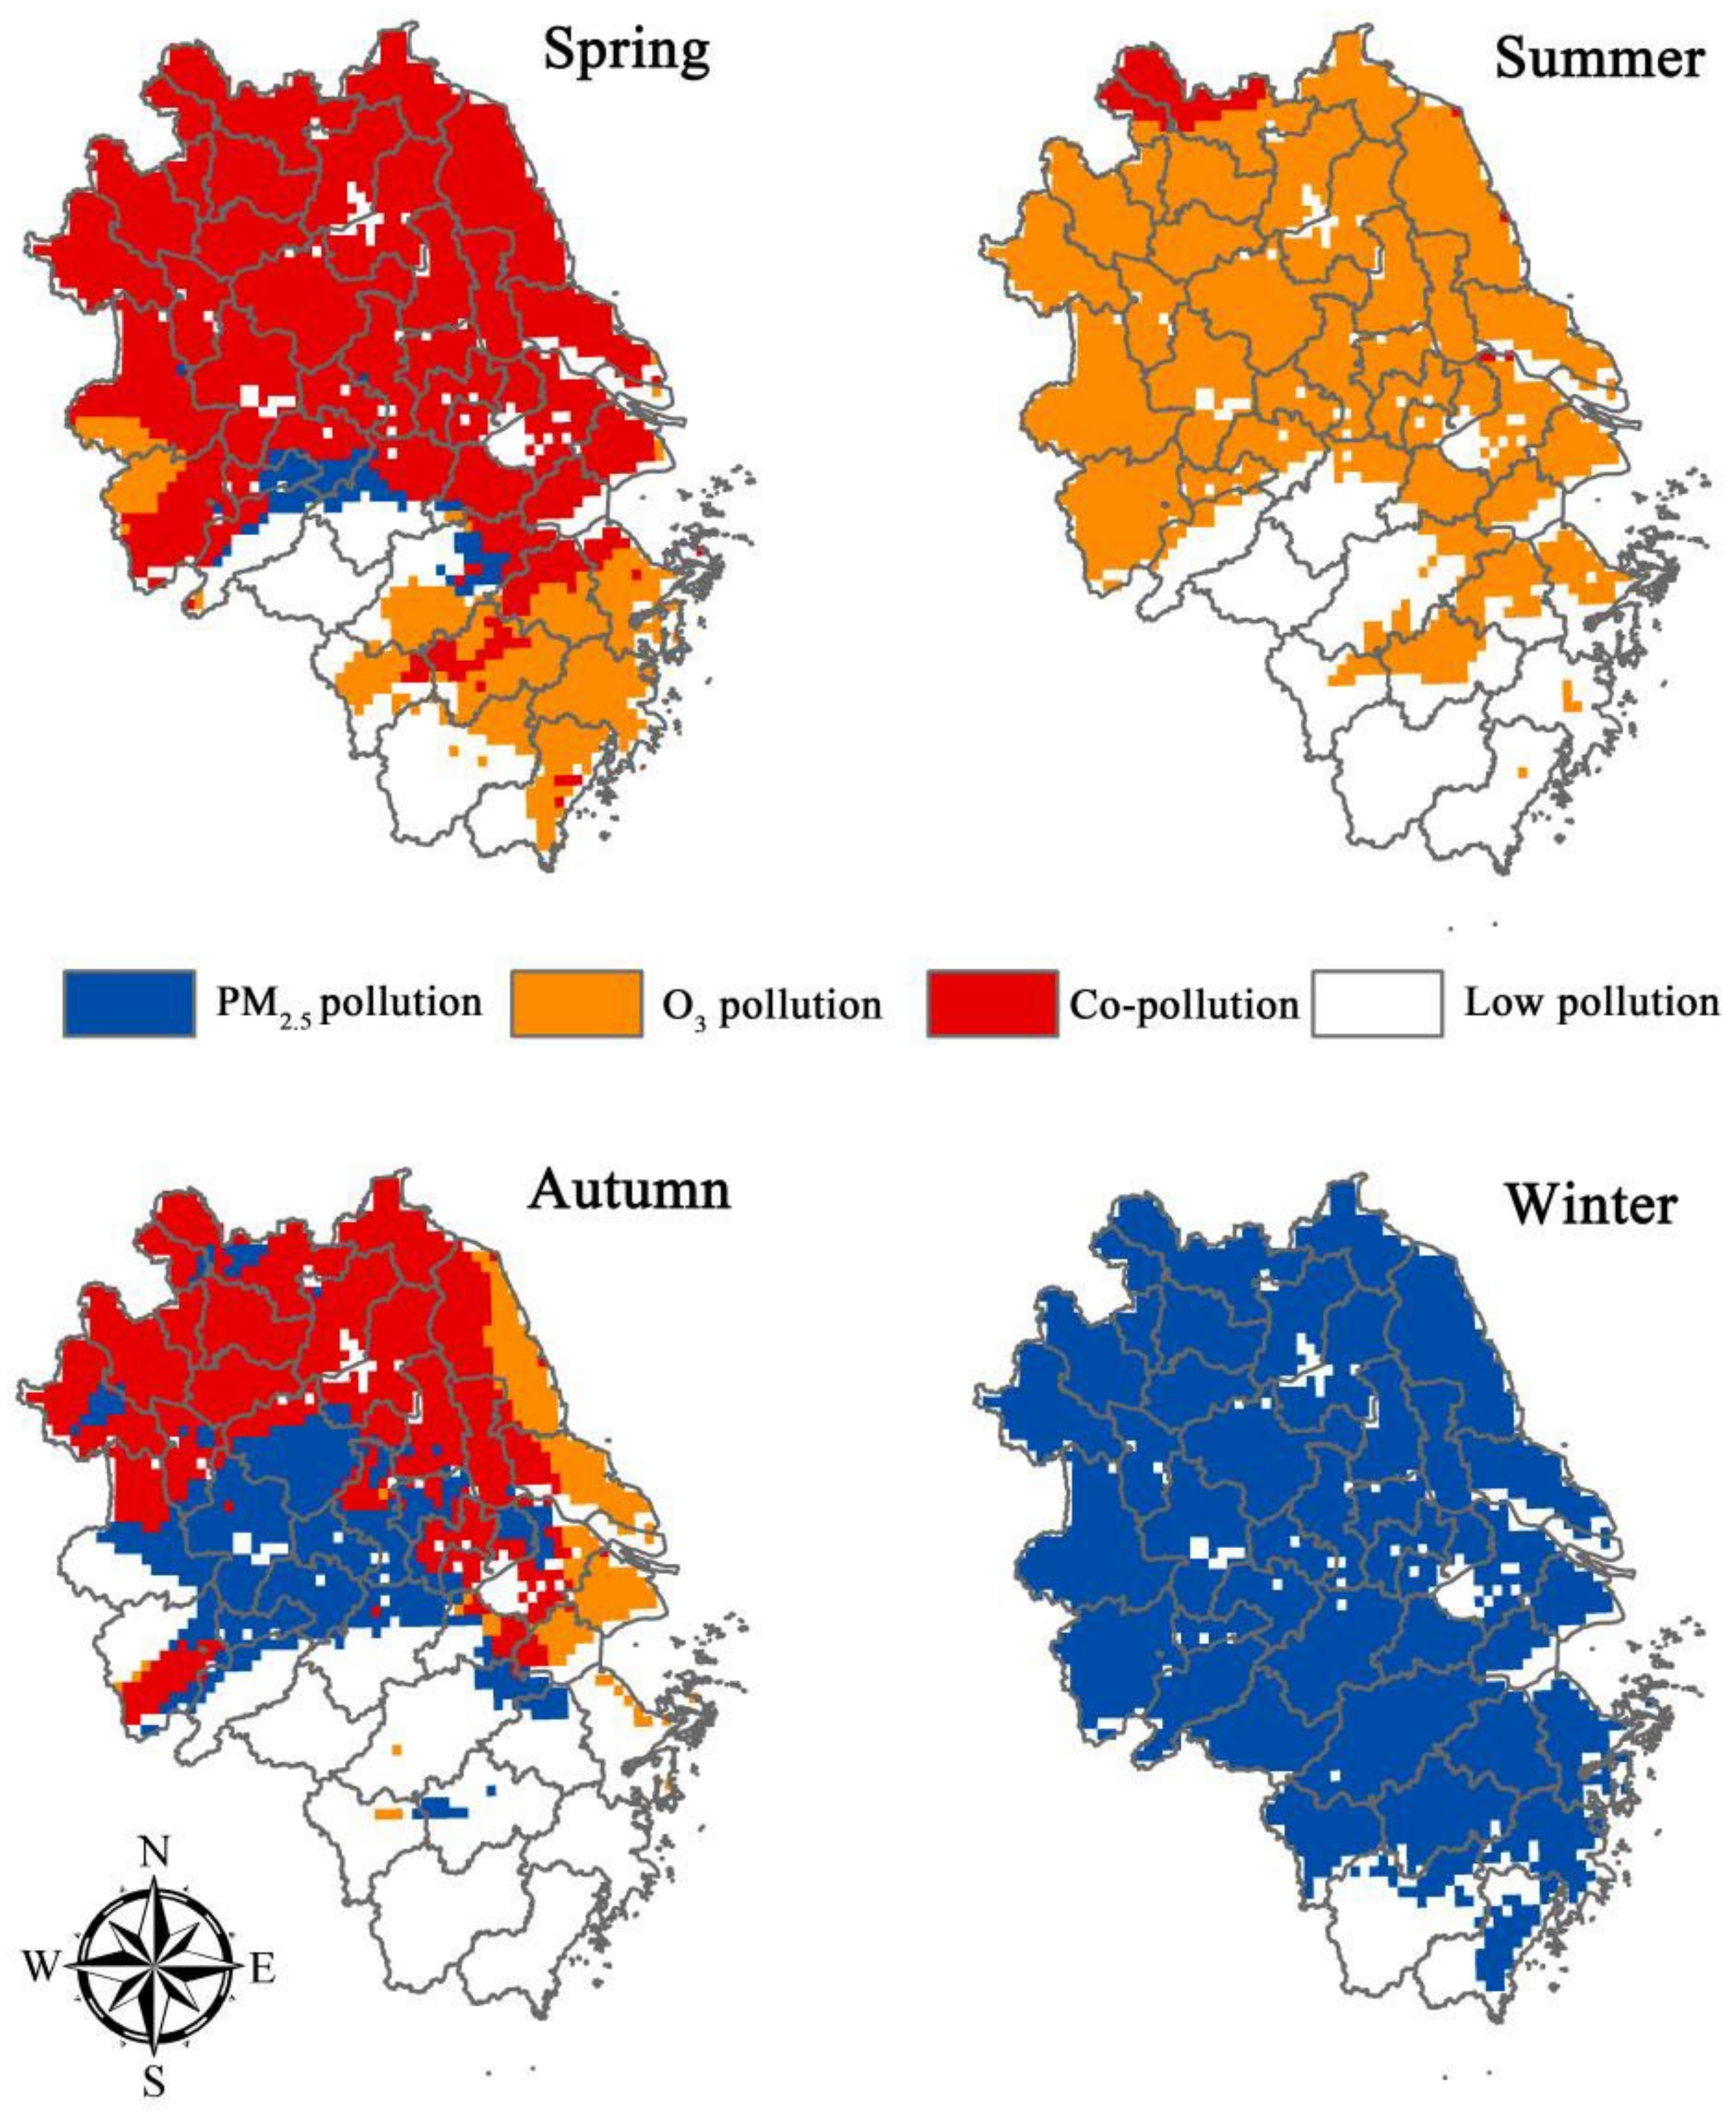
3.4. Pollution Types and Regional Division of Coordinated Prevention and Control Programs in the YRD

In order to achieve precise control of air pollution, pollution prevention and control programs must be demarcated by region at a fine level. Figure 11 shows the regional division results and trends within each region based on the pollution changes. The results show that the three main types of pollution in the Yangtze River Delta in 2020 are co-pollution, O3 pollution, and low pollution, with proportions of 41.9%, 26.3%, and 30%, respectively. These are roughly consistent with the remote sensing estimates of PM2.5 and O3 concentrations in 2020 (corresponding values = 40.4%, 25.6%, and 33.7%, respectively; Table 3). On the basis of the 2017 pollutant concentrations, the co-pollution region in the north-eastern YRD shrank in 2020, and the area changing from co-pollution to O3 pollution status accounts for 15.9% of the total area. The range of the ecological barrier brought by the south-western mountainous areas of the YRD is further expanded, and the area that changes from PM2.5 pollution to low pollution accounts for 9.1% of the total area (Table A3, Appendix B). More importantly, pollution trends in the regions demarcated by this study have obvious boundary effects, and the trends in boundary areas bordering other pollution types are weak.
From the previous analysis (Figure 4, Figure 5, Figure 6 and Figure 7), it can be seen that the rate of decrease in PM2.5 and rate of increase in O3 in area (a) of Figure 11 are both rapid, so the areas where the high PM2.5 pollution trend is quite weak may be improved to a low pollution status, while low-priority areas of the region with a status of PM2.5 pollution to co-pollution may also be converted to a O3 pollution status. In area (b), the rate of decrease in PM2.5 is lower and the rate of increase in O3 is higher, so it is easier to shift to the co-pollution status than for PM2.5 pollution to shift to O3 pollution. At the same time, since the rates of change in PM2.5 and O3 in area (c) are exactly the opposite to those in area (b), it is more likely to improve from PM2.5 pollution to low pollution. In general, since the rate of decrease in PM2.5 and rate of increase in O3 in central Anhui Province are both higher than the averages for the YRD region, it is easier to transition to a pollution status with high O3 in places where the regional trend in its own pollution type is weak. The overall air quality in Zhejiang Province is relatively good, making it easier to apply prevention and control. In addition, the rate of decline in PM2.5 in Shanghai and the surrounding areas is so high that O3 is the main target of prevention and control programs. In the coordinated prevention and control measures used in the YRD region, limiting the emissions of precursors (VOCs and NOX) can effectively make up for the negative impact of PM2.5 emission-reduction measures on O3 pollution [51,52]. Furthermore, in the classification results, there are local areas with strong pollution trends in regions of co-pollution and co-pollution to O3 pollution. This means that while coordinated prevention and control measures should also be targeted at point sources, government departments should increase the implementation of emission-reduction policies to rapidly improve local cases of high pollution.
Compared with related studies [23,24,25], the proposed method has certain advantages: (1) The composite pollution types we defined can reflect the phase transition of pollution, (2) the regions of prevention and control measures we demarcated can facilitate fine grid management, and (3) the development degrees we evaluated can help predict future pollution trends. Li et al. [6] also finely delineated the scope of coordinated PM2.5 and O3 pollution prevention and control programs based on remote sensing images. However, their results are insufficient to provide effective future control measures because no type of transitional pollution is included in their classification. More importantly, we used four key indicators to comprehensively evaluate the trends in polluted regions. The strength of the trends represents the stability of the pollution type in the region, which can assist departments to make dynamic decisions according to the conditions. We note that the PM2.5 pollution in 2020 is overestimated, which occurs in places where the pollution trend is weak. The study by Li et al. [53] shows that significant reductions in 2020 PM2.5 levels in our overestimated regions are associated with COVID-19 lockdowns. This confirms that our assessment of the trends in polluted regions can predict areas where pollution will change when external conditions change.
Of course, since our pollutant change threshold is based on the overall average value of the study area, the expected transition state does not match the actual situations of certain areas (a, b, and c in Figure 11) where the pollutant trends are substantially lower or higher than the overall mean. To predict pollution trends more accurately, future research can develop in two directions: (1) Using machine learning, deep learning, and other high-precision predictive models to estimate PM2.5 and O3 concentrations in the evaluated year, so as to set thresholds based on the difference between the base year and the evaluated year to classify transitional pollution scope, and (2) when dividing the transition types, the PM2.5 and O3 concentration rates of change of each pixel should be considered. This can avoid the misclassification of transition types caused by differences between local and average rates of change, which requires the establishment of a comprehensive calculation model.

4. Conclusions

In recent years, PM2.5 and O3 became the main pollutants affecting urban and regional air quality in China. Their coordinated control is the key to improving China’s air quality. This study proposed a new method to finely classify pollution types and control boundaries on the basis of analysing the characteristics of changes in PM2.5 and O3 in the YRD. Moreover, we selected four indicators to comprehensively evaluate regional pollution trends: PM2.5 and O3 concentrations, and PM2.5 and O3 rates of change. The main conclusions of this paper are as follows:
(1)
The temporal and spatial distribution of PM2.5 and O3 pollution are closely related to topographical and meteorological conditions. The YRD region has high O3 pollution in summer and high PM2.5 pollution in winter, while co-pollution of PM2.5 and O3 is most significant in spring and covers 67.5% of the area. The most serious PM2.5 and O3 pollution occurs in the northern part of the YRD, while the air quality is generally better in the southwestern mountainous area.
(2)
During the period 2015 to 2020, the main pollution type in the YRD changes from PM2.5 pollution to O3 pollution. The areas of changed pollution are basically consistent with the predictions, which shows that our method is reliable in guiding pollution control.
(3)
In view of the trend of decreasing PM2.5 and increasing O3 of air pollution in the YRD, a strategy of focusing on VOCs first and then NOx should be implemented in Anhui, Jiangsu, and Shanghai, with greater attention paid to the former two. Jiangsu and Anhui must actively respond to regional coordinated prevention and control programs and focus on transforming their industry and energy structures.

Author Contributions

Conceptualization, Z.Z.; methodology, L.W.; software, L.W.; validation, Z.Z.; formal analysis, L.W. and Z.Z.; investigation, L.W. and Z.Z.; resources, L.W. and Z.Z.; data curation, L.W. and Z.G.; writing—original draft preparation, L.W. and Z.Z.; writing—review and editing, L.W. and Z.Z.; visualization, L.W. and Z.G.; supervision, Z.Z.; project administration, L.W.; funding acquisition, Z.Z. and L.W. All authors have read and agreed to the published version of the manuscript.

Funding

This research was funded by Graduate Scientific research project of Anhui Universities in 2021 (Grant No. YJS20210412), the National Natural Science Foundation of China (Grant Nos. 42071085 and 41701087), and the Open Project of the State Key Laboratory of Cryospheric Science (Grant No. SKLCS 2020-10).

Institutional Review Board Statement

Not applicable.

Informed Consent Statement

Not applicable.

Data Availability Statement

Not applicable.

Acknowledgments

We would like to thank the National Aeronautics and Space Administration (https://www.earthdata.nasa.gov/ accessed on 8 August 2022) for the DEM data, the China National Environmental Monitoring Centre (http://www.cnemc.cn/ accessed on 8 August 2022) for the ground monitoring data, and Wei’s team who used deep learning methods for spatio-temporal modelling (https://weijing-rs.github.io/product.html accessed on 8 August 2022) for the remote sensing data of PM2.5 and O3.

Conflicts of Interest

The authors declare no conflict of interest.

Appendix A

The steps of analytic hierarchy process (AHP):
(1)
Comparing the importance of the four indicators (PM2.5 concentration ρ(PM2.5), O3 concentration ρ(O3), the rates of change r(PM2.5) and r(O3)) in pairs, and their proportions are obtained by the value of the quadratic curve fitting;
(2)
Comprehensively sort out all the ratios obtained from the pairwise comparisons, thereby constructing the judgment matrix of the four indicators, which is subjective to a certain extent;
(3)
Calculating the weight vectors and perform the consistency check.
Table A1. Subjective evaluation matrix of four indicators.
ρ(PM2.5)ρ(O3)r(PM2.5)r(O3)
ρ(PM2.5)121/22
ρ(O3)1/211/31
r(PM2.5)2313
r(O3)1/211/31
Table A2. The weights of four indicators calculated by AHP.
IndicatorEigenvectorWeightMaximal
Eigenvalue
CI *
ρ(PM2.5)1.18920.26274.01040.0035
ρ(O3)0.63890.1411
r(PM2.5)2.05980.455
r(O3)0.63890.1411
* CI means consistency index.
Consistency Check Results:
The maximum eigenvalue is 4.0104, and the corresponding random index (RI) value is 0.882, according to the RI table. So, consistency ratio (CR) = CI/RI = 0.0039 < 0.1, consistency check passed.

Appendix B

Figure A1. Validation of remote sensing estimates using ground-truth data.
Atmosphere 13 01300 g0a1
Figure A2. Spatial distribution of PM2.5 concentrations in spring, summer, autumn. and winter (2015–2020 means for each season).
Atmosphere 13 01300 g0a2
Figure A3. Spatial distribution of O3 concentration in spring, summer, autumn, and winter (2015–2020 means for each season).
Atmosphere 13 01300 g0a3
Table A3. Proportions of pollution types as defined by pollution thresholds.
Pollution TypeArea
High PM2.5 pollution1.8%
High O3 pollution0.2%
High co-pollution38%
PM2.5 pollution to co-pollution3.9%
PM2.5 to O3 pollution6.7%
Co-pollution to O3 pollution15.9%
PM2.5 pollution to low pollution9.1%
Low pollution to O3 pollution3.5%
Good air quality20.9%

References

  1. Peng, J.; Wang, X.; Liu, Y.; Zhao, Y.; Xu, Z.; Zhao, M.; Qiu, S.; Wu, J. Urbanization impact on the supply-demand budget of ecosystem services: Decoupling analysis. Ecosyst. Serv. 2020, 44, 101139. [Google Scholar] [CrossRef]
  2. China National Environmental Monitoring Centre (CNEMC). Available online: http://www.cnemc.cn/jcbg/ (accessed on 14 July 2022).
  3. China National Environmental Monitoring Centre (CNEMC). Available online: http://www.cnemc.cn/jcbg/zghjzkgb/202105/W020210527493805924492.pdf (accessed on 14 July 2022).
  4. Lelieveld, J.; Pozzer, A.; Pöschl, U.; Fnais, M.; Haines, A.; Münzel, T. Loss of life expectancy from air pollution compared to other risk factors: A worldwide perspective. Cardiovasc. Res. 2020, 116, 1910–1917. [Google Scholar] [CrossRef] [PubMed]
  5. Orellano, P.; Reynoso, J.; Quaranta, N.; Bardach, A.; Ciapponi, A. Short-term exposure to particulate matter (PM10 and PM2.5), nitrogen dioxide(NO2), and ozone(O3) and all-cause and cause-specific mortality: Systematic review and meta-analysis. Environ. Int. 2020, 142, 105876. [Google Scholar] [CrossRef] [PubMed]
  6. Zhang, N.N.; Ma, F.; Qin, C.B.; Li, Y.F. Spatiotemporal trends in PM2.5 levels from 2013 to 2017 and regional demarcations for joint prevention and control of atmospheric pollution in China. Chemosphere 2018, 210, 1176–1184. [Google Scholar] [CrossRef]
  7. Maji, K.J.; Dikshit, A.K.; Arora, M.; Deshpande, A. Estimating premature mortality attributable to PM2.5 exposure and benefit of air pollution control policies in China for 2020. Sci. Total Environ. 2018, 612, 683–693. [Google Scholar] [CrossRef]
  8. Li, S.X.; Zou, B.; Zhang, F.Y.; Liu, N.; Xue, C.H.; Liu, J. Regionalization and Analysis of PM2.5 and O3 Synergetic Prevention and Control Areas Based on Remote Sensing Data. Environ. Sci. 2022. [Google Scholar] [CrossRef]
  9. Li, M.; Wang, L.; Liu, J.; Gao, W.; Song, T.; Sun, Y.; Li, L.; Li, X.; Wang, Y.; Liu, L.; et al. Exploring the regional pollution characteristics and meteorological formation mechanism of PM2.5 in North China during 2013–2017. Environ. Int. 2020, 134, 105283. [Google Scholar] [CrossRef]
  10. Yan, D.; Lei, Y.; Shi, Y.; Zhu, Q.; Li, L.; Zhang, Z. Evolution of the spatiotemporal pattern of PM2.5 concentrations in China—A case study from the Beijing-Tianjin-Hebei region. Atmos. Environ. 2018, 183, 225–233. [Google Scholar] [CrossRef]
  11. Fang, C.; Wang, L.; Li, Z.; Wang, J. Spatial Characteristics and Regional Transmission Analysis of PM2.5 Pollution in Northeast China, 2016–2020. Int. J. Environ. Res. Public Health 2021, 18, 12483. [Google Scholar] [CrossRef]
  12. Li, N.; He, Q.; Greenberg, J.; Guenther, A.; Li, J.; Cao, J.; Wang, J.; Liao, H.; Wang, Q.; Zhang, Q. Impacts of biogenic and anthropogenic emissions on summertime ozone formation in the Guanzhong Basin, China. Atmos. Chem. Phys. 2018, 18, 7489–7507. [Google Scholar] [CrossRef]
  13. Li, K.; Chen, L.; Ying, F.; White, S.J.; Jang, C.; Wu, X.; Gao, X.; Hong, S.; Shen, J.; Azzi, M.; et al. Meteorological and chemical impacts on ozone formation: A case study in Hangzhou, China. Atmos. Res. 2017, 196, 40–52. [Google Scholar] [CrossRef]
  14. Chen, Z.; Chen, D.; Zhao, C.; Kwan, M.; Cai, J.; Zhuang, Y.; Zhao, B.; Wang, X.; Chen, B.; Yang, Y.; et al. Influence of meteorological conditions on PM2.5 concentrations across China: A review of methodology and mechanism. Environ. Int. 2020, 139, 105558. [Google Scholar] [CrossRef]
  15. Xiao, Q.; Geng, G.; Liang, F.; Wang, X.; Lv, Z.; Lei, Y.; Huang, X.; Zhang, Q.; Liu, Y.; He, K. Changes in spatial patterns of PM2.5 pollution in China 2000–2018: Impact of clean air policies. Environ. Int. 2020, 141, 105776. [Google Scholar] [CrossRef]
  16. Wang, W.N.; Cheng, T.H.; Gu, X.F.; Chen, H.; Guo, H.; Wang, Y.; Bao, F.W.; Shi, S.Y.; Xu, B.R.; Zuo, X.; et al. Assessing spatial and temporal patterns of observed ground-level ozone in China. Sci. Rep. 2017, 7, 3651. [Google Scholar] [CrossRef]
  17. Wang, L.; Xiong, Q.; Wu, G.; Gautam, A.; Jiang, J.; Liu, S.; Zhao, W.; Guan, H. Spatio-temporal variation characteristics of PM2.5 in the Beijing-Tianjin-Hebei Region, China, from 2013 to 2018. Int. J. Environ. Res. Public Health 2019, 16, 4276. [Google Scholar] [CrossRef]
  18. Liu, H.; Liu, J.; Liu, Y.; Yi, K.; Yang, H.; Xiang, S.; Ma, J.; Tao, S. Spatiotemporal variability and driving factors of ground-level summertime ozone pollution over eastern China. Atmos. Environ. 2021, 265, 118686. [Google Scholar] [CrossRef]
  19. Lou, Y.; Teng, M.; Yang, K.; Zhu, Y.; Zhou, X.; Zhang, M.; Shi, Y. Research on PM2.5 estimation and prediction method and changing characteristics analysis under long temporal and large spatial scale-A case study in China typical regions. Sci. Total Environ. 2019, 696, 133983. [Google Scholar]
  20. Tan, J.; Zhang, Y.; Ma, W.; Yu, Q.; Wang, J.; Chen, L. Impact of spatial resolution on air quality simulation: A case study in a highly industrialized area in Shanghai, China. Atmos. Pollut. Res. 2015, 6, 322–333. [Google Scholar] [CrossRef]
  21. Thompson, T.M.; Selin, N.E. Influence of air quality model resolution on uncertainty associated with health impacts. Atmos. Chem. Phys. 2012, 12, 9753–9762. [Google Scholar] [CrossRef]
  22. Tao, H.; Xing, J.; Zhou, H.; Pleim, J.; Ran, L.; Chang, X.; Wang, S.; Chen, F.; Zheng, H.; Li, J. Impacts of improved modeling resolution on the simulation of meteorology, air quality, and human exposure to PM2.5, O3 in Beijing, China. J. Clean. Prod. 2020, 243, 118574. [Google Scholar] [CrossRef]
  23. Wang, H.; Zhao, L. A joint prevention and control mechanism for air pollution in the Beijing-Tianjin-Hebei region in china based on long-term and massive data mining of pollutant concentration. Atmos. Environ. 2018, 174, 25–42. [Google Scholar] [CrossRef]
  24. Xie, Y.; Zhao, L.; Xue, J.; Gao, H.; Li, H.; Jiang, R.; Qiu, X.; Zhang, S. Methods for defining the scopes and priorities for joint prevention and control of air pollution regions based on data-mining technologies. J. Clean. Prod. 2018, 185, 912–921. [Google Scholar] [CrossRef]
  25. Zhang, N.; Guan, Y.; Li, Y.F.; Wang, S. New region demarcation method for implementing the Joint Prevention and Control of Atmospheric Pollution policy in China. J. Clean. Prod. 2021, 325, 129345. [Google Scholar] [CrossRef]
  26. Zhang, D.; Wang, X.; Qu, L.; Li, S.; Lin, Y.; Yao, R.; Zhou, X.; Li, J. Land use/cover predictions incorporating ecological security for the Yangtze River Delta region, China. Ecol. Indic. 2020, 119, 106841. [Google Scholar] [CrossRef]
  27. Ministry of Ecology and Environment (MEE). Available online: http://www.mee.gov.cn/xxgk2018/xxgk/xxgk01/201808/t20180815_629602.html (accessed on 14 July 2022).
  28. Wei, J.; Li, Z.; Lyapustin, A.; Sun, L.; Peng, Y.; Xue, W.; Su, T.; Cribb, M. Reconstructing 1-km-resolution high-quality PM2.5 data records from 2000 to 2018 in China: Spatiotemporal variations and policy implications. Remote Sens. Environ. 2021, 252, 112136. [Google Scholar] [CrossRef]
  29. Wei, J.; Li, Z.; Li, K.; Dickerson, R.R.; Pinker, R.T.; Wang, J.; Liu, X.; Sun, L.; Xue, W.; Cribb, M. Full-coverage mapping and spatiotemporal variations of ground-level ozone (O3) pollution from 2013 to 2020 across China. Remote Sens. Environ. 2022, 270, 112775. [Google Scholar] [CrossRef]
  30. Mudelsee, M. Trend analysis of climate time series: A review of methods. Earth-Sci. Rev. 2019, 190, 310–322. [Google Scholar] [CrossRef]
  31. Ye, Q.; Liu, H.; Lin, Y.; Han, R. Study of Maowusu sandy land vegetation coverage change based on modis Ndvi. ISPRS-Int. Arch. Photogramm. Remote Sens. Spat. Inf. Sci. 2018, 42, 2127–2133. [Google Scholar] [CrossRef]
  32. Yang, Q.; Yuan, Q.; Li, T.; Shen, H.; Zhang, L. The relationships between PM2.5 and meteorological factors in China: Seasonal and regional variations. Int. J. Environ. Res. Public Health 2017, 14, 1510. [Google Scholar] [CrossRef]
  33. U.S. Environmental Protection Agency (EPA). Available online: https://www.epa.gov/air-trends/trends-ozone-adjusted-weather-conditions (accessed on 8 August 2022).
  34. Zhang, T.Y.; Shen, N.; Zhao, X.; Wang, X.; Zhao, W. Spatiotemporal variation characteristics of ozone and its population exposure risk assessment in Chengdu-Chongqing urban agglomeration during 2015 to 2019. Acta Sci. Circumstantiae. 2021, 41, 4188–4199. [Google Scholar]
  35. Wang, J.; Zhang, X.; Li, D.; Yang, Y.; Zhong, J.; Wang, Y.; Che, H.; Che, H.; Zhang, Y. Interdecadal changes of summer aerosol pollution in the Yangtze River Basin of China, the relative influence of meteorological conditions and the relation to climate change. Sci. Total Environ. 2018, 630, 46–52. [Google Scholar] [CrossRef] [PubMed]
  36. Li, Z.; Yu, S.; Li, M.; Chen, X.; Zhang, Y.; Song, Z.; Li, J.; Jiang, Y.; Liu, W.; Li, P.; et al. The Modeling Study about Impacts of Emission Control Policies for Chinese 14th Five-Year Plan on PM2.5 and O3 in Yangtze River Delta, China. Atmosphere 2021, 13, 26. [Google Scholar] [CrossRef]
  37. Mousavinezhad, S.; Choi, Y.; Pouyaei, A.; Ghahremanloo, M.; Nelson, D.L. A comprehensive investigation of surface ozone pollution in China, 2015–2019: Separating the contributions from meteorology and precursor emissions. Atmos. Res. 2021, 257, 105599. [Google Scholar] [CrossRef]
  38. Hu, C.; Kang, P.; Jaffe, D.A.; Li, C.; Zhang, X.; Wu, K.; Zhou, M. Understanding the impact of meteorology on ozone in 334 cities of China. Atmos. Environ. 2021, 248, 118221. [Google Scholar] [CrossRef]
  39. Wang, P.; Guo, H.; Hu, J.; Kota, S.H.; Ying, Q.; Zhang, H. Responses of PM2.5 and O3 concentrations to changes of meteorology and emissions in China. Sci. Total Environ. 2019, 662, 297–306. [Google Scholar] [CrossRef]
  40. Shu, L.; Xie, M.; Gao, D.; Wang, T.; Fang, D.; Liu, Q.; Huang, A.; Peng, L. Regional severe particle pollution and its association with synoptic weather patterns in the Yangtze River Delta region, China. Atmos. Chem. Phys. 2017, 17, 12871–12891. [Google Scholar] [CrossRef]
  41. Zhou, C.; Wei, G.; Zheng, H.; Russo, A.; Li, C.; Du, H.; Xiang, J. Effects of potential recirculation on air quality in coastal cities in the Yangtze River Delta. Sci. Total Environ. 2019, 651, 12–23. [Google Scholar] [CrossRef]
  42. Wang, X.; Dickinson, R.E.; Su, L.; Zhou, C.; Wang, K. PM2.5 pollution in China and how it has been exacerbated by terrain and meteorological conditions. Bull. Am. Meteorol. Soc. 2018, 99, 105–119. [Google Scholar] [CrossRef]
  43. Wang, X.C.; Klemeš, J.J.; Dong, X.; Fang, W.; Xu, Z.; Wang, Y.; Varbanov, P.S. Air pollution terrain nexus: A review considering energy generation and consumption. Renew. Sustain. Energy Rev. 2019, 105, 71–85. [Google Scholar] [CrossRef]
  44. Zhang, Q.; Zheng, Y.; Tong, D.; Li, F.; Zhang, W.; Li, W.; Wang, Z.; Zhang, G.; Tang, G.; Liu, Z.; et al. Drivers of improved PM2.5 air quality in China from 2013 to 2017. Proc. Natl. Acad. Sci. USA 2019, 116, 24463–24469. [Google Scholar] [CrossRef]
  45. Shi, C.; Nduka, I.C.; Yang, Y.; Huang, Y.; Yao, R.; Zhang, H.; He, B.; Xie, C.; Wang, Z.; Yim, S.H.L. Characteristics and meteorological mechanisms of transboundary air pollution in a persistent heavy PM2.5 pollution episode in Central-East China. Atmos. Environ. 2020, 223, 117239. [Google Scholar] [CrossRef]
  46. Zhao, D.; Xin, J.; Wang, W.; Jia, D.; Wang, Z.; Xiao, H.; Liu, C.; Zhou, J.; Tong, L.; Ma, Y.; et al. Effects of the sea-land breeze on coastal ozone pollution in the Yangtze River Delta, China. Sci. Total Environ. 2022, 807, 150306. [Google Scholar] [CrossRef]
  47. Wang, L.; Lyu, B.; Bai, Y. Aerosol vertical profile variations with seasons, air mass movements and local PM2.5 levels in three large China cities. Atmos. Environ. 2020, 224, 117329. [Google Scholar] [CrossRef]
  48. Dai, H.; Zhu, J.; Liao, H.; Li, J.; Liang, M.; Yang, Y.; Yue, X. Co-occurrence of ozone and PM2.5 pollution in the Yangtze River Delta over 2013–2019: Spatiotemporal distribution and meteorological conditions. Atmos. Res. 2021, 249, 105363. [Google Scholar] [CrossRef]
  49. Xiang, S.; Liu, J.; Tao, W.; Yi, K.; Xu, J.; Hu, X.; Liu, H.; Wang, Y.; Zhang, Y.; Yang, H.; et al. Control of both PM2.5 and O3 in Beijing-Tianjin-Hebei and the surrounding areas. Atmos. Environ. 2020, 224, 117259. [Google Scholar] [CrossRef]
  50. Li, L.; Hu, J.; Li, J.; Gong, K.; Wang, X.; Ying, Q.; Qin, M.; Liao, H.; Guo, S.; Hu, M.; et al. Modelling air quality during the EXPLORE-YRD campaign—Part II. Regional source apportionment of ozone and PM2.5. Atmos. Environ. 2021, 247, 118063. [Google Scholar] [CrossRef]
  51. Li, K.; Jacob, D.J.; Liao, H.; Shah, V.; Shen, L.; Bates, K.H.; Zhang, Q.; Zhai, S. A two-pollutant strategy for improving ozone and particulate air quality in China. Nat. Geosci. 2019, 12, 906–910. [Google Scholar] [CrossRef]
  52. Li, K.; Jacob, D.J.; Shen, L.; Lu, X.; Smedt, L.D.; Liao, H. Increases in surface ozone pollution in China from 2013 to 2019: Anthropogenic and meteorological influences. Atmos. Chem. Phys. 2020, 20, 11423–11433. [Google Scholar] [CrossRef]
  53. Li, L.; Li, Q.; Huang, L.; Wang, Q.; Zhu, A.; Xu, J.; Liu, Z.; Li, H.; Shi, L.; Li, R.; et al. Air quality changes during the COVID-19 lockdown over the Yangtze River Delta Region: An insight into the impact of human activity pattern changes on air pollution variation. Sci. Total Environ. 2020, 732, 139282. [Google Scholar] [CrossRef]
Figure 1. Overview of the study area.
Atmosphere 13 01300 g001
Figure 2. Process of dividing the scope of combined pollution and evaluating regional trends.
Atmosphere 13 01300 g002
Figure 3. Monthly mean (a) PM2.5 and (b) O3_MDA8 concentrations in the YRD from 2015 to 2020. In (a), the blue area represents the maximum and minimum daily mean PM2.5 concentrations in that month. In (b), the pink area represents the 10th–90th percentiles of O3_MDA8 concentrations in that month.
Atmosphere 13 01300 g003
Figure 4. Spatial distributions of annual PM2.5 concentrations in the YRD from 2015 to 2020.
Atmosphere 13 01300 g004
Figure 5. Trends in PM2.5 concentrations in the YRD.
Atmosphere 13 01300 g005
Figure 6. Spatial distributions of annual O3 concentrations in the YRD from 2015 to 2020.
Atmosphere 13 01300 g006
Figure 7. Trends in O3 concentrations in the YRD.
Atmosphere 13 01300 g007
Figure 8. Annual proportion of days with pollutant concentrations exceeding the Chinese standards in 41 cities in the YRD from 2015 to 2020 (the horizontal axis, from left to right, shows Shanghai, 13 cities in Jiangsu Province, 11 cities in Zhejiang Province, and 16 cities in Anhui Province). (a) PM2.5 concentrations (standard = 75 µg/m3) and (b) O3_MDA8 concentrations (standard = 160 µg/m3).
Atmosphere 13 01300 g008
Figure 9. Classification of basic pollution types in cities of the YRD. According to the annual average PM2.5 and O3_MDA8 concentrations from 2016 to 2019, the basic pollution types of these cities are divided into PM2.5 pollution, O3 pollution, co-pollution, and low pollution, according to the standard of T(PM2.5) = 35 µg/m3 and T(O3) = 100 µg/m3.
Atmosphere 13 01300 g009
Figure 10. Seasonal spatial distributions of air pollution from 2015 to 2020.
Atmosphere 13 01300 g010
Figure 11. Pollution types and regional trends in the YRD from 2017 to 2020. The main figure shows the combined pollution situation in the YRD region in 2020 predicted using the method in Section 2.3.2. The upper-right inset shows an empirical image of PM2.5 and O3 pollution types in 2020. The bands in the legend indicate the regional trends from weak to strong.
Atmosphere 13 01300 g011
Table 1. Pollutant condition classification according to the threshold and standard values.
ConditionConcentration (ρ)Variation (cmean) *
Excessiveρ(pol) ≥ T(pol)cmean(pol) > 0
ρ(pol) ≥ V(pol)cmean(pol) < 0
Non-excessiveρ(pol) ≤ V(pol)cmean(pol) > 0
ρ(pol) ≤ T(pol)cmean(pol) < 0
TransitionalExcessive to non-excessiveT(pol) < ρ(pol) < V(pol)cmean(pol) < 0
Non-excessive to excessiveV(pol) < ρ(pol) < T(pol)cmean(pol) > 0
* cmean(pol) = 0 means that the year selected by the study is not appropriate.
Table 2. Classification conditions for PM2.5 and O3 coordinated prevention and control.
Pollution TypeCondition
High PM2.5 pollution ρ ( P M 2.5 ) > T ( P M 2.5 ) Λ ρ ( O 3 ) < T ( O 3 )
High O3 pollution ρ ( P M 2.5 ) < T ( P M 2.5 ) Λ ρ ( O 3 ) > T ( O 3 )
High co-pollution ρ ( P M 2.5 ) > V ( P M 2.5 ) Λ ρ ( O 3 ) > T ( O 3 )
PM2.5 pollution to co-pollution ρ ( P M 2.5 ) > V ( P M 2.5 ) Λ V ( O 3 ) < ρ ( O 3 ) < T ( O 3 )
PM2.5 to O3 pollution ρ ( P M 2.5 ) > V ( P M 2.5 ) Λ V ( O 3 ) < ρ ( O 3 ) < T ( O 3 )
Co-pollution to O3 pollution T ( P M 2.5 ) < ρ ( P M 2.5 ) < V ( P M 2.5 ) Λ ρ ( O 3 ) > T ( O 3 )
PM2.5 pollution to low pollution T ( P M 2.5 ) < ρ ( P M 2.5 ) < V ( P M 2.5 ) Λ ρ ( O 3 ) < T ( O 3 )
Low pollution to O3 pollution ρ ( P M 2.5 ) < T ( P M 2.5 ) Λ V ( O 3 ) < ρ ( O 3 ) < T ( O 3 )
Table 3. Proportions of basic pollution types in 2020 predicted by the proposed method (“predicted”) and estimated by remote sensing (“actual”).
Pollution TypePredictedActual
PM2.5 pollution1.8%0.3%
O3 pollution26.3%25.6%
Co-pollution41.9%40.4%
Low pollution30.0%33.7%
Publisher’s Note: MDPI stays neutral with regard to jurisdictional claims in published maps and institutional affiliations.

