
Study on Characteristics Optimization of Combustion and Fuel Injection of Marine Diesel Engine


Abstract
:Highlights
- Compared with discharge valve chamber volume, high-pressure tubing diameter shows more influence on injection mass and SMD.
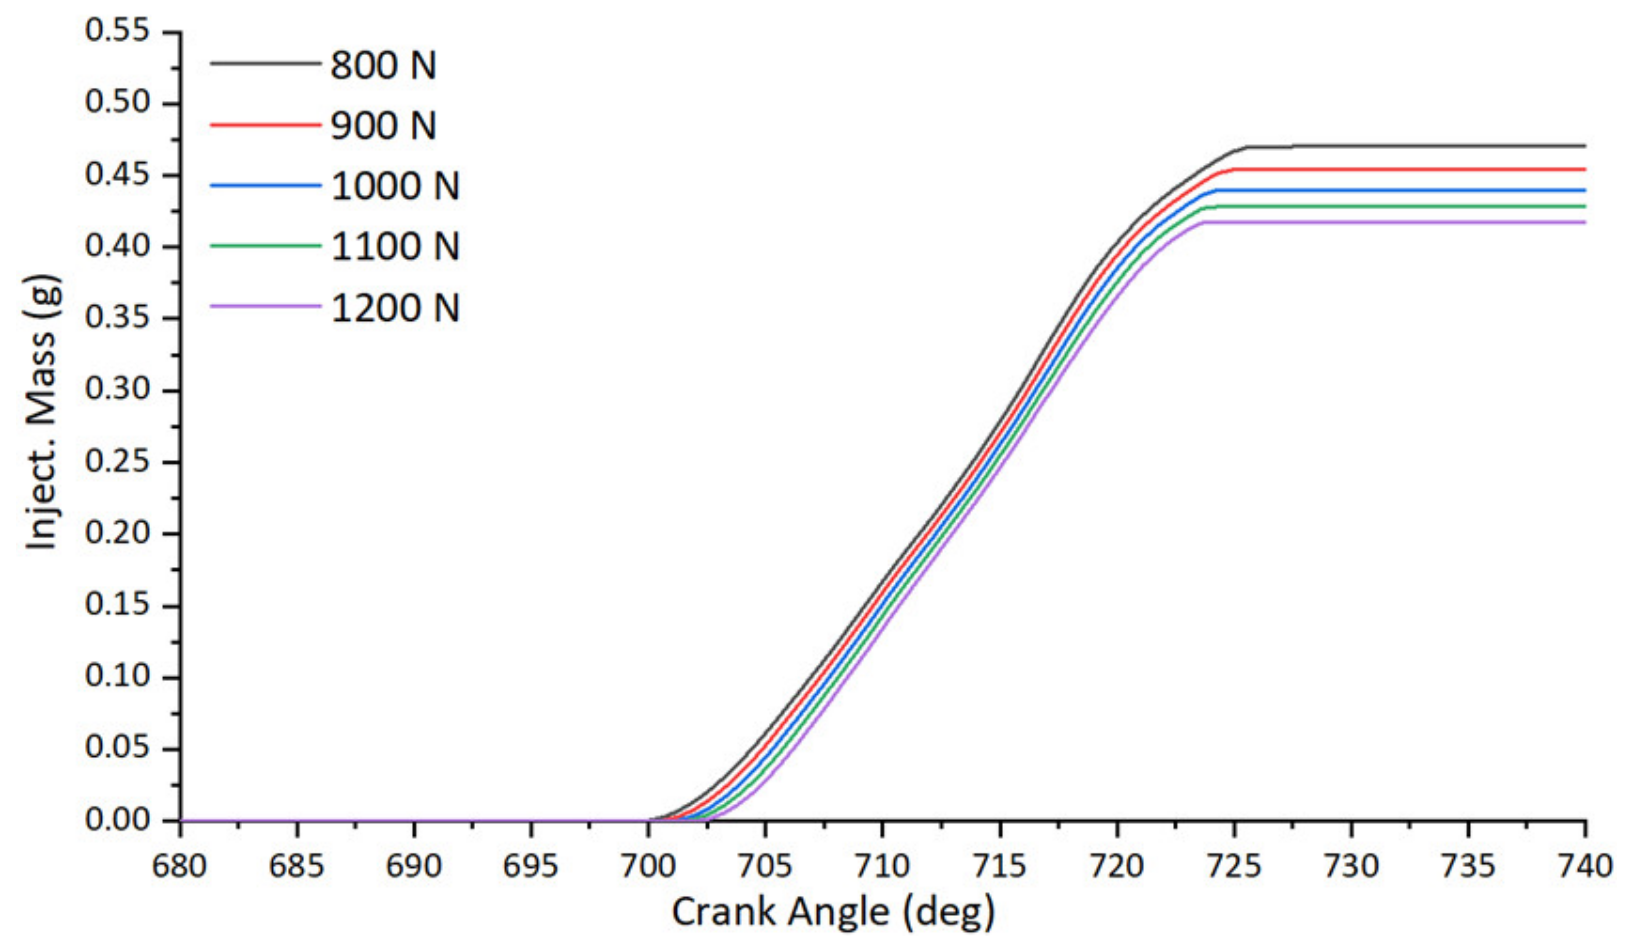
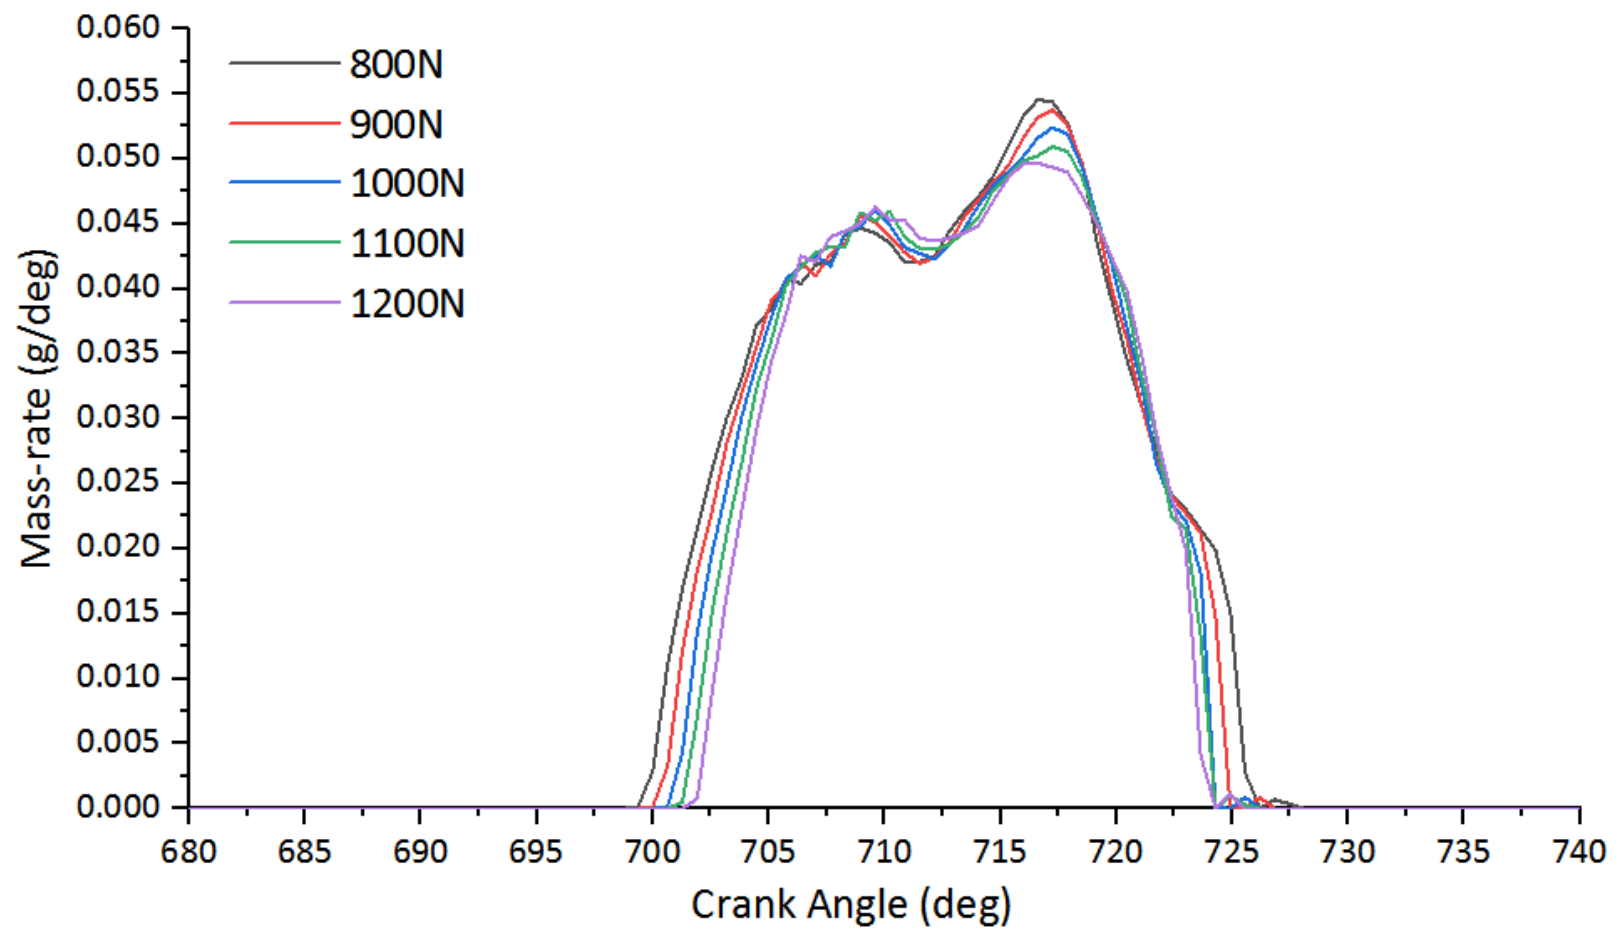
- The opening pressure of needle valve is more sensitive to SMD.
- An overall simultaneous reduction of pollutant emissions was obtained, alleviating the trade-off relations between NO and soot emissions.
- Reasonable optimization of spray angle can improve power, economy and emission performance simultaneously.
Abstract
1. Introduction
2. Results and Discussion
2.1. Performance of Structures of Fuel Injection System on Spray Characteristics
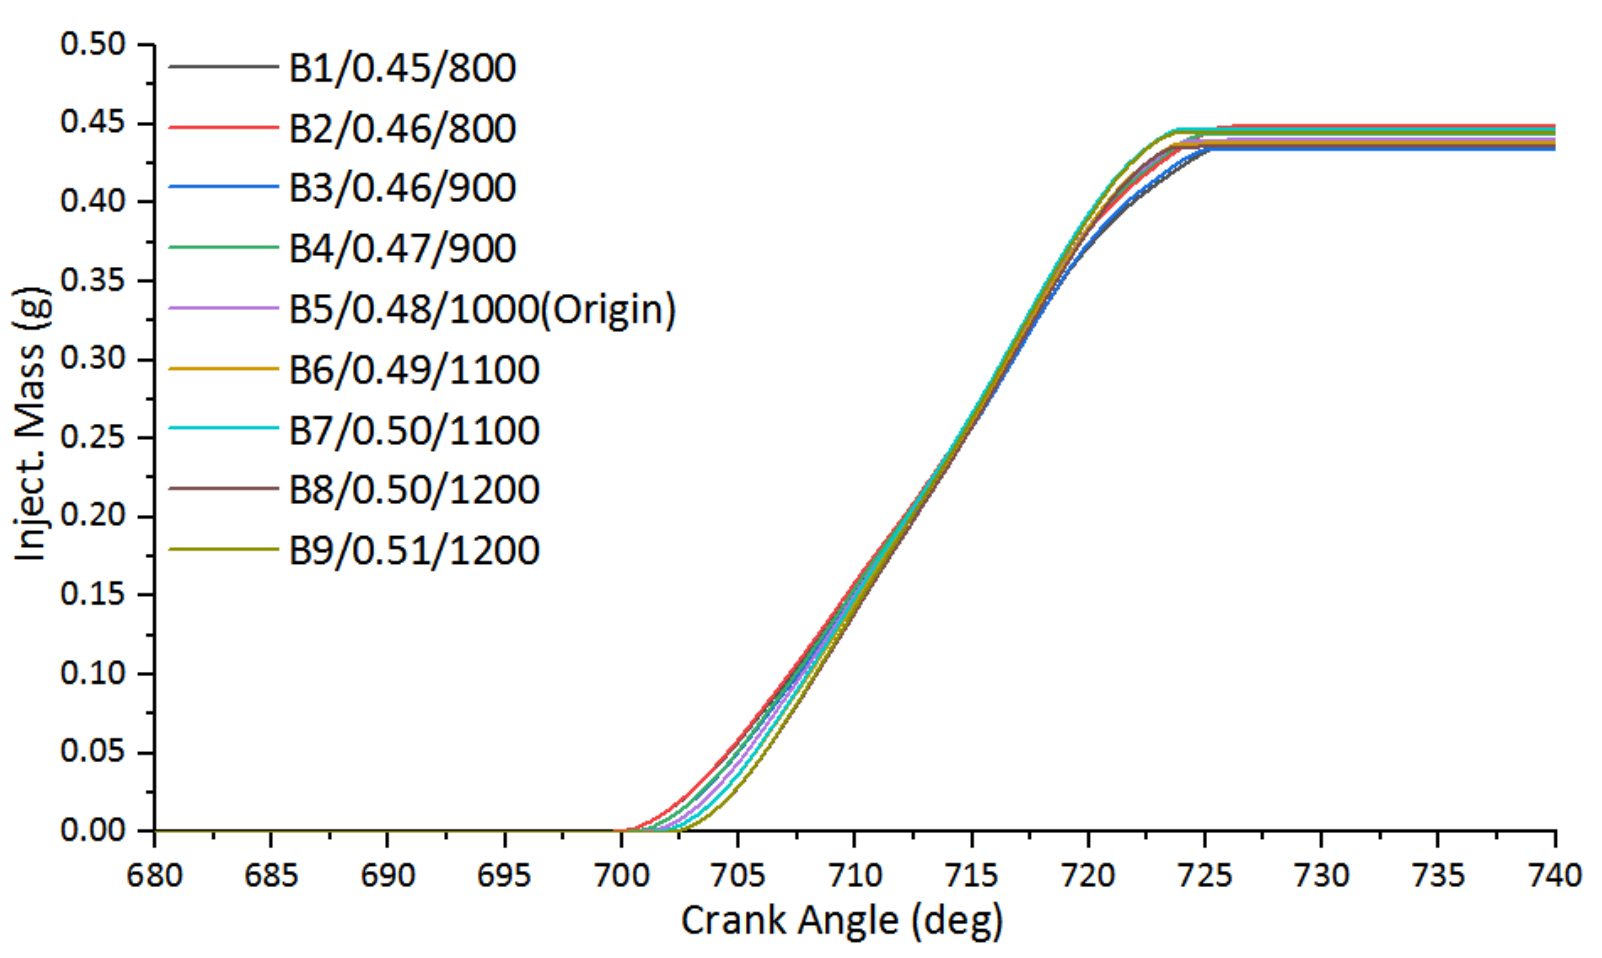
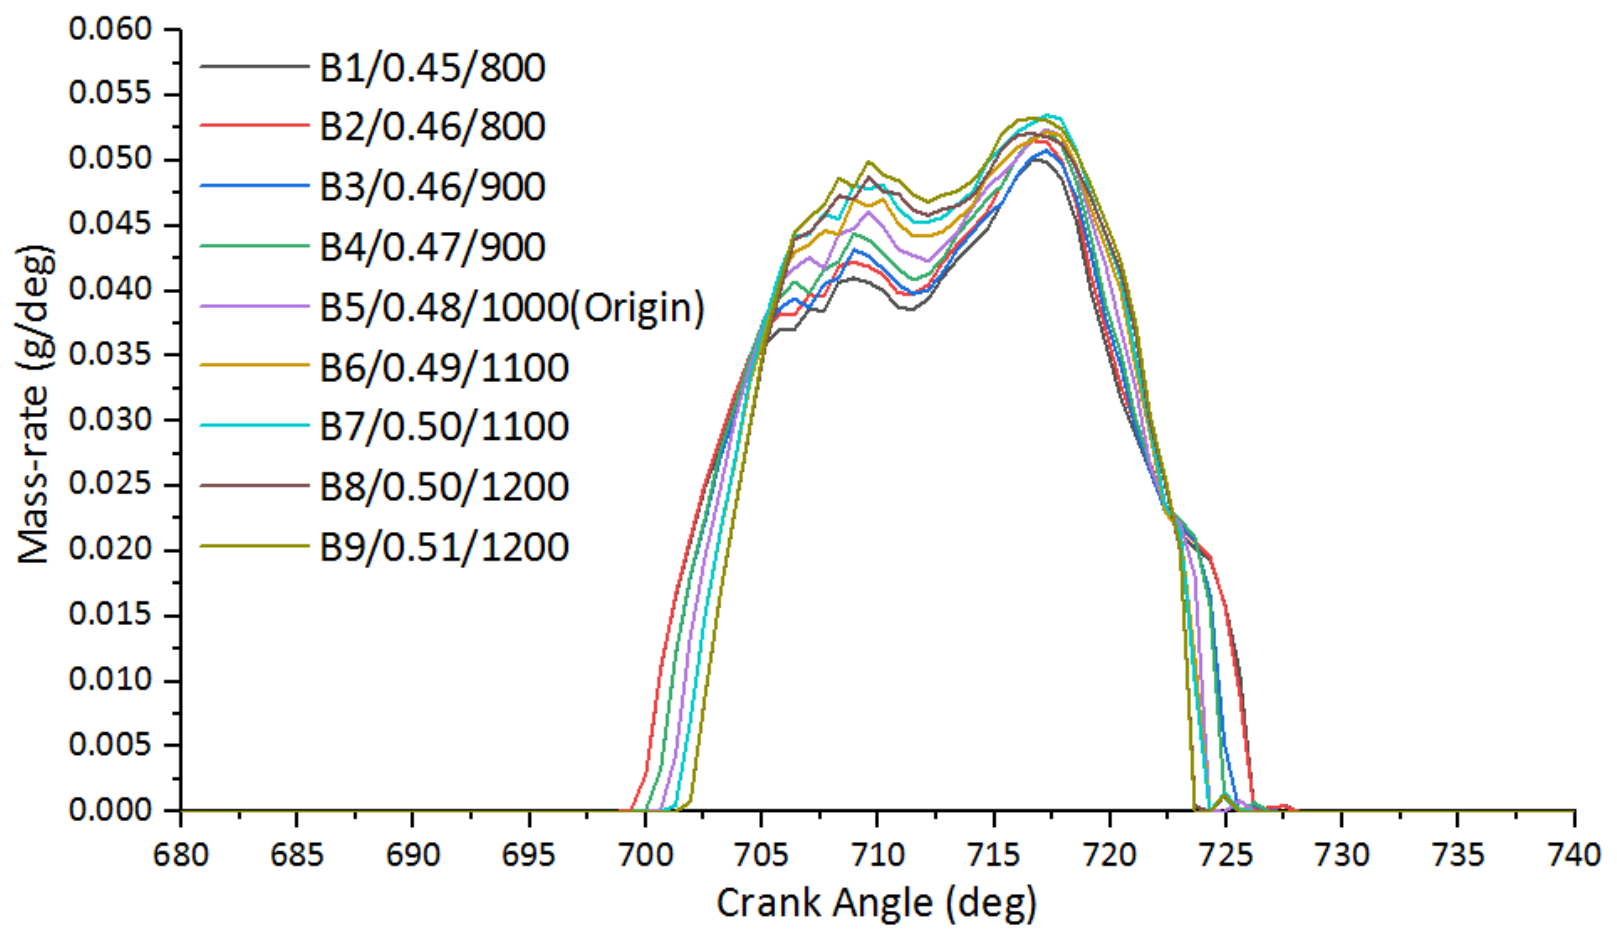
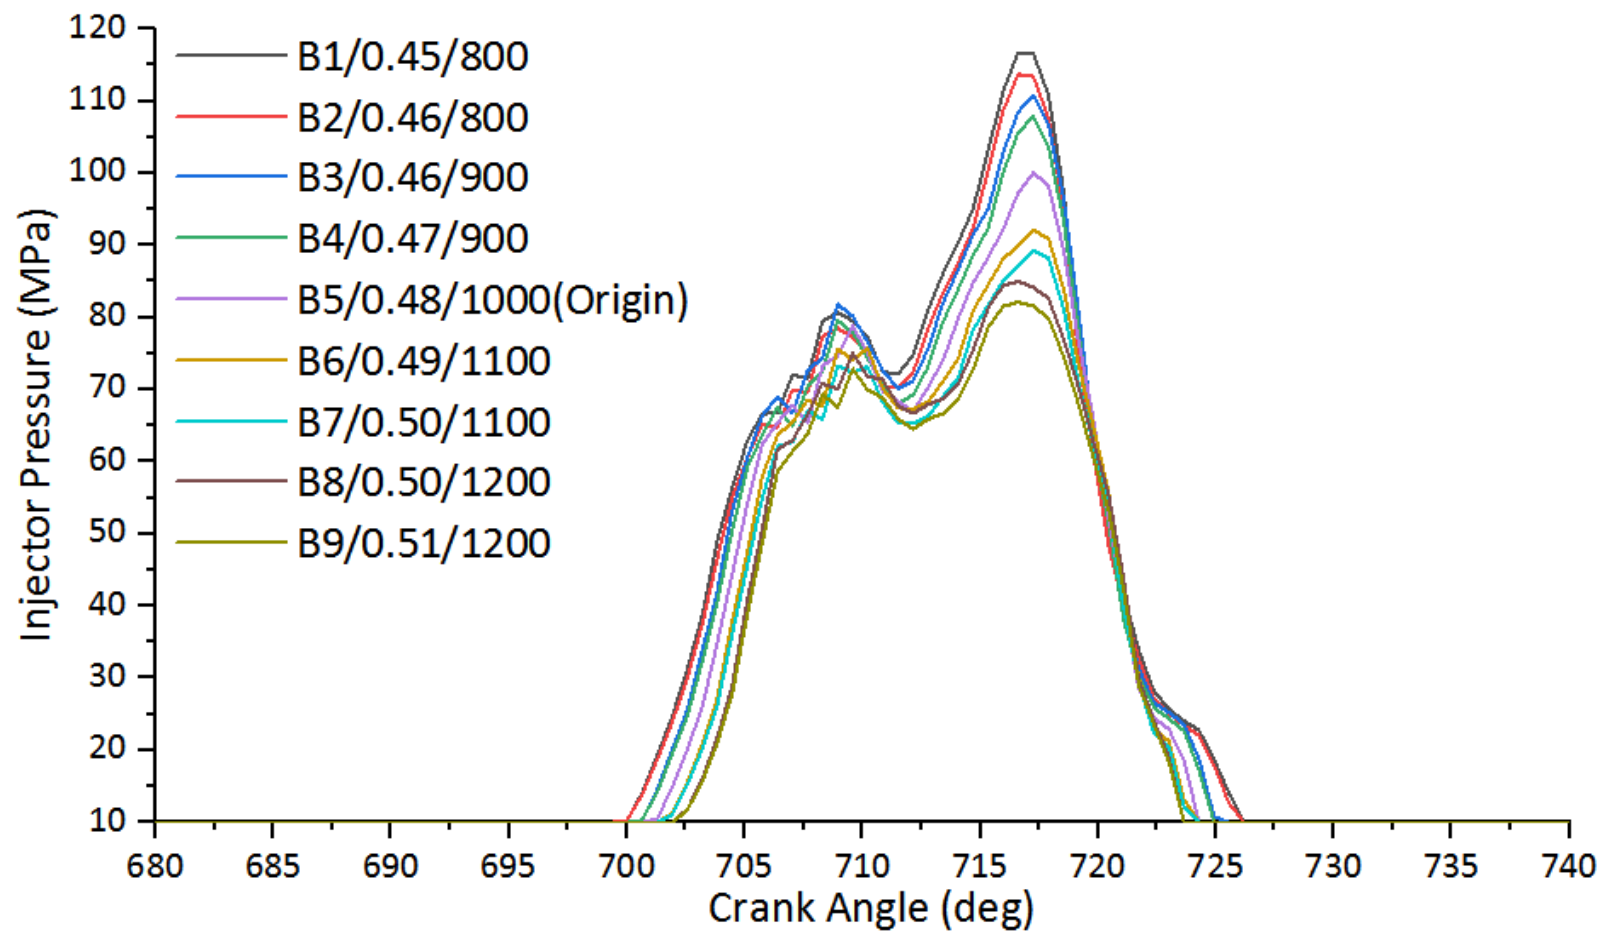
2.1.1. Fuel Spray Characteristics
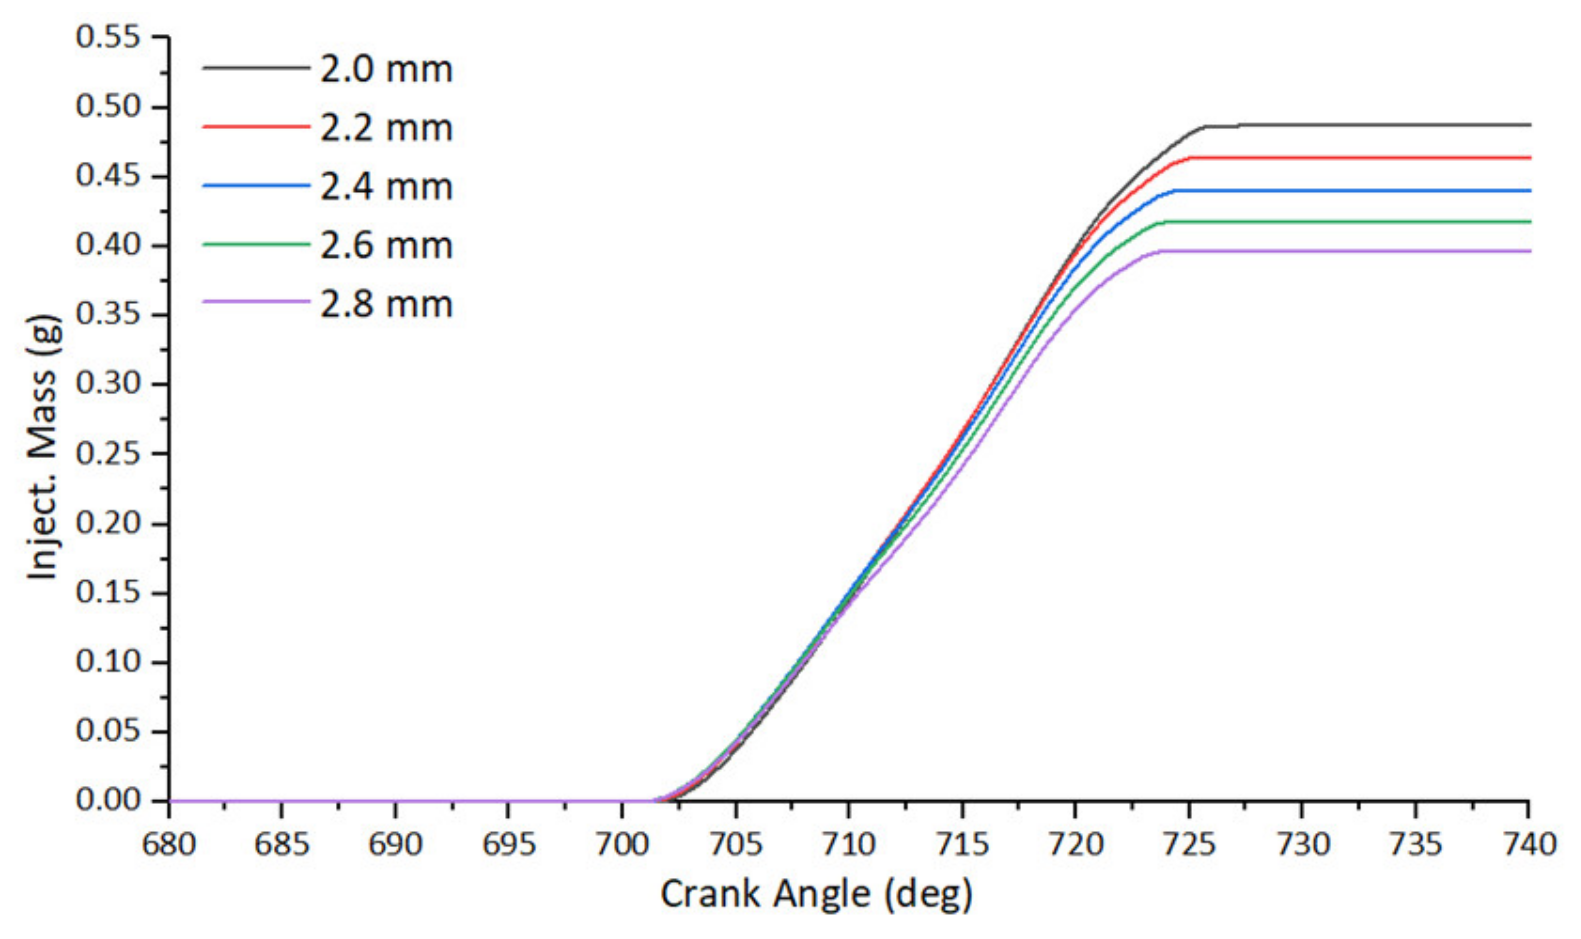
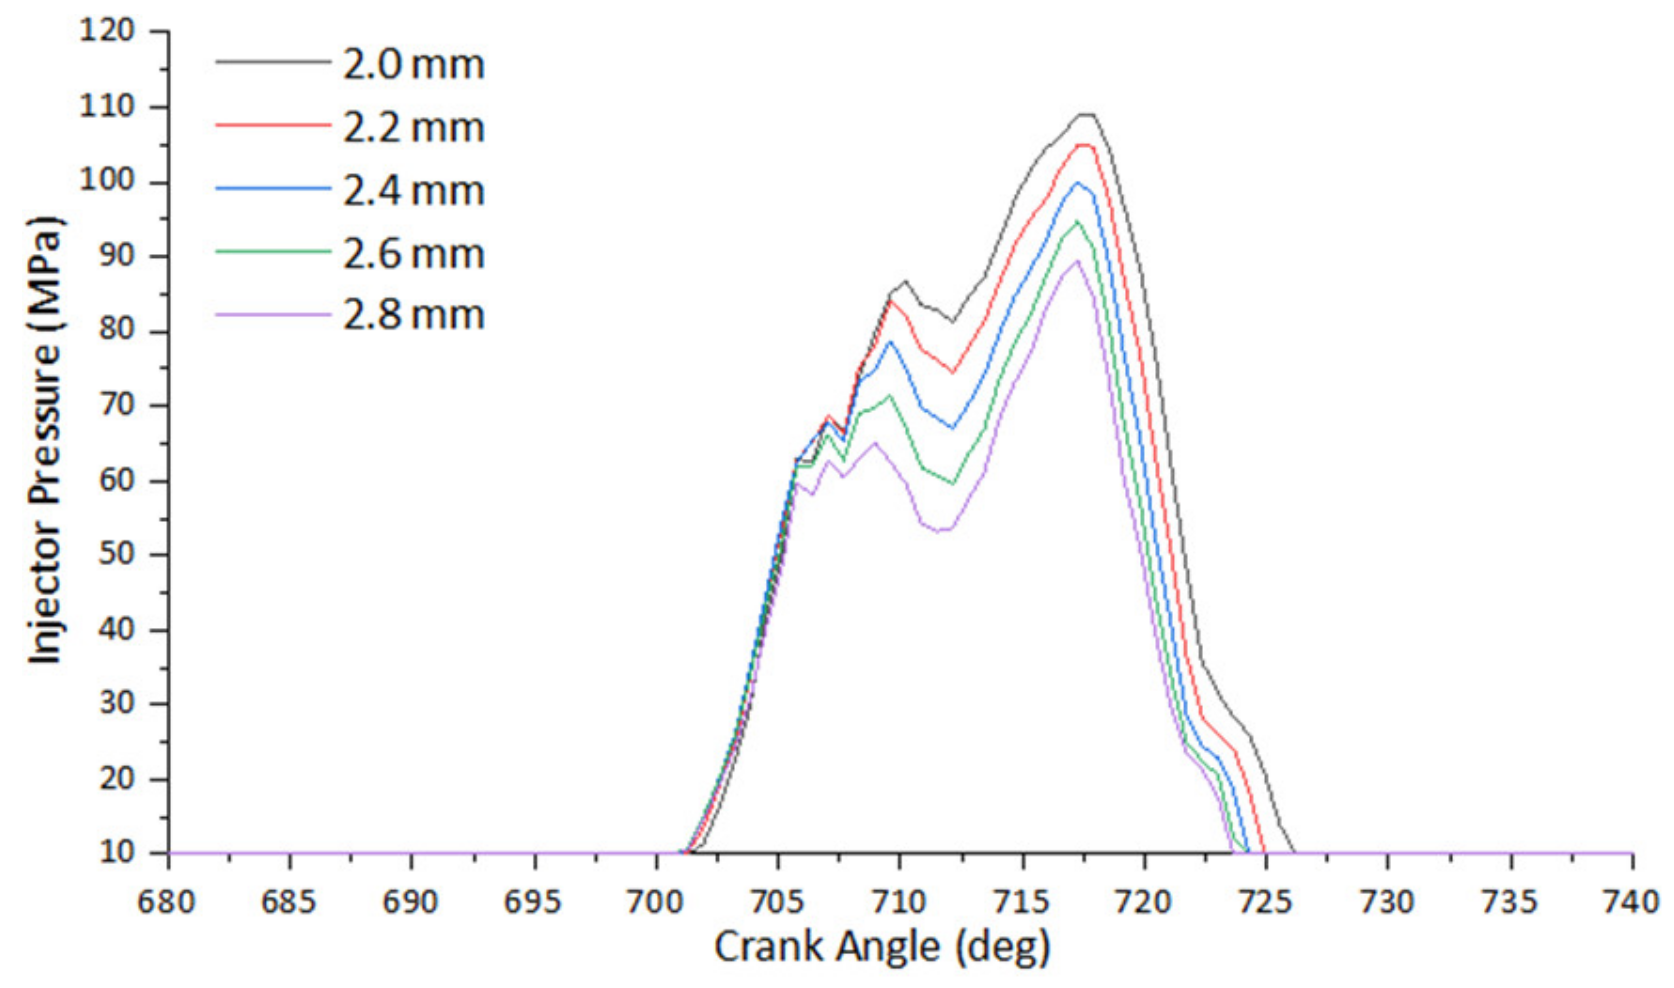
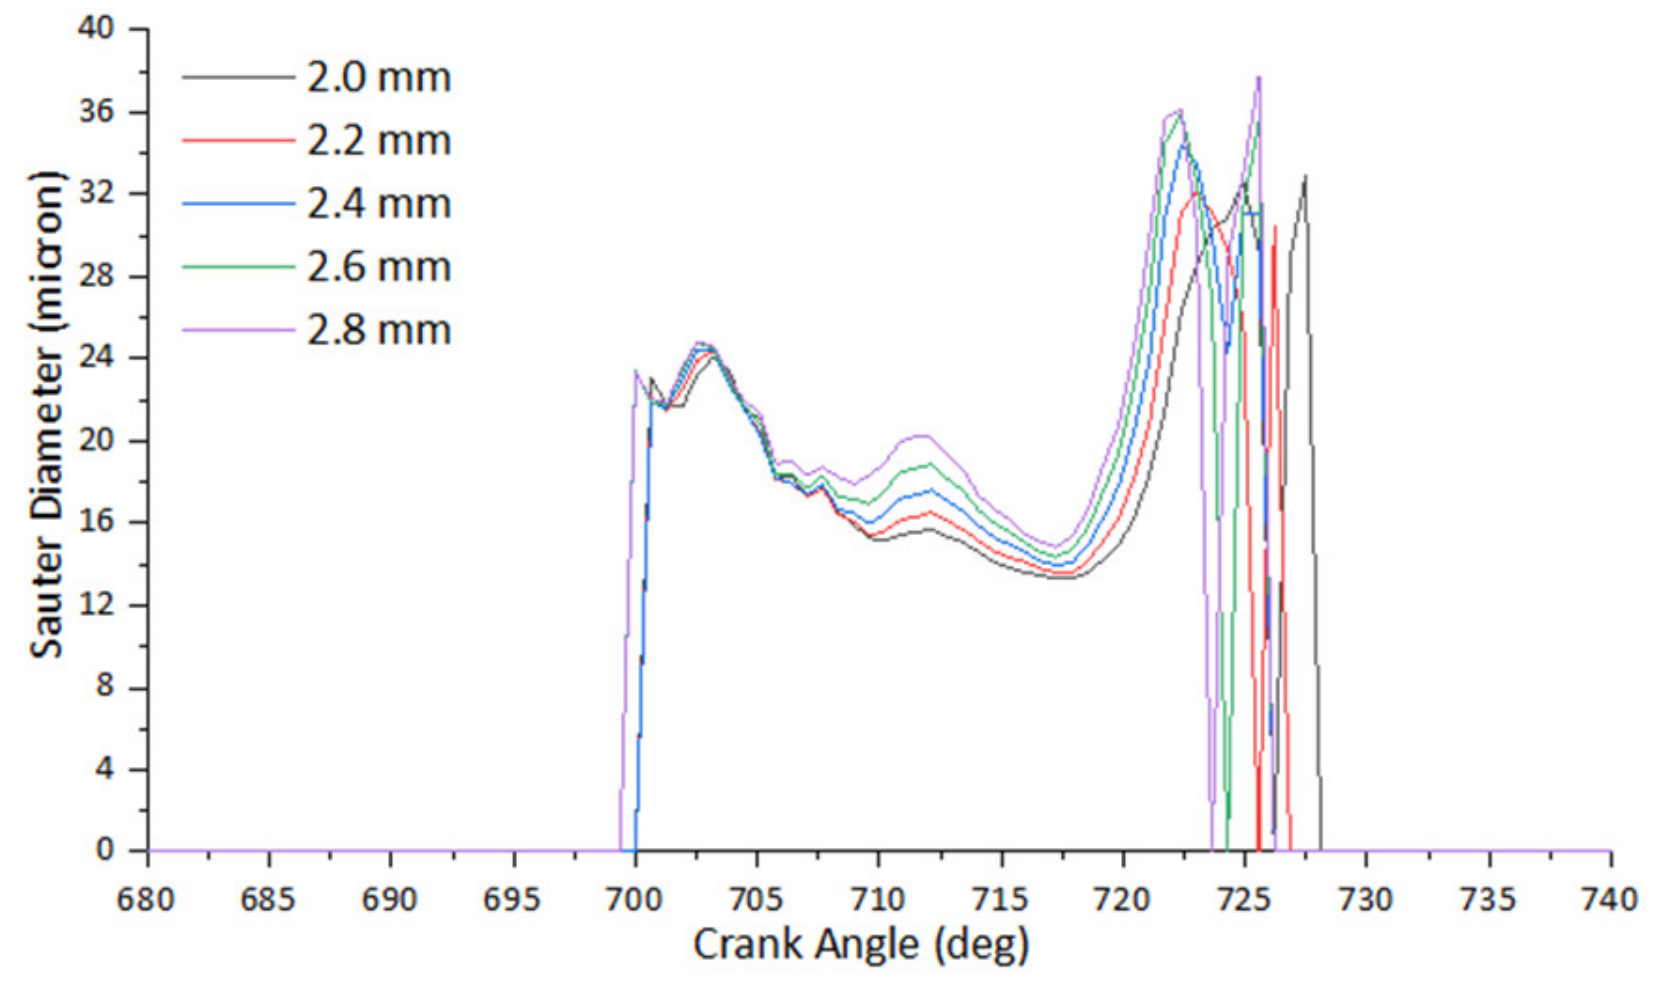
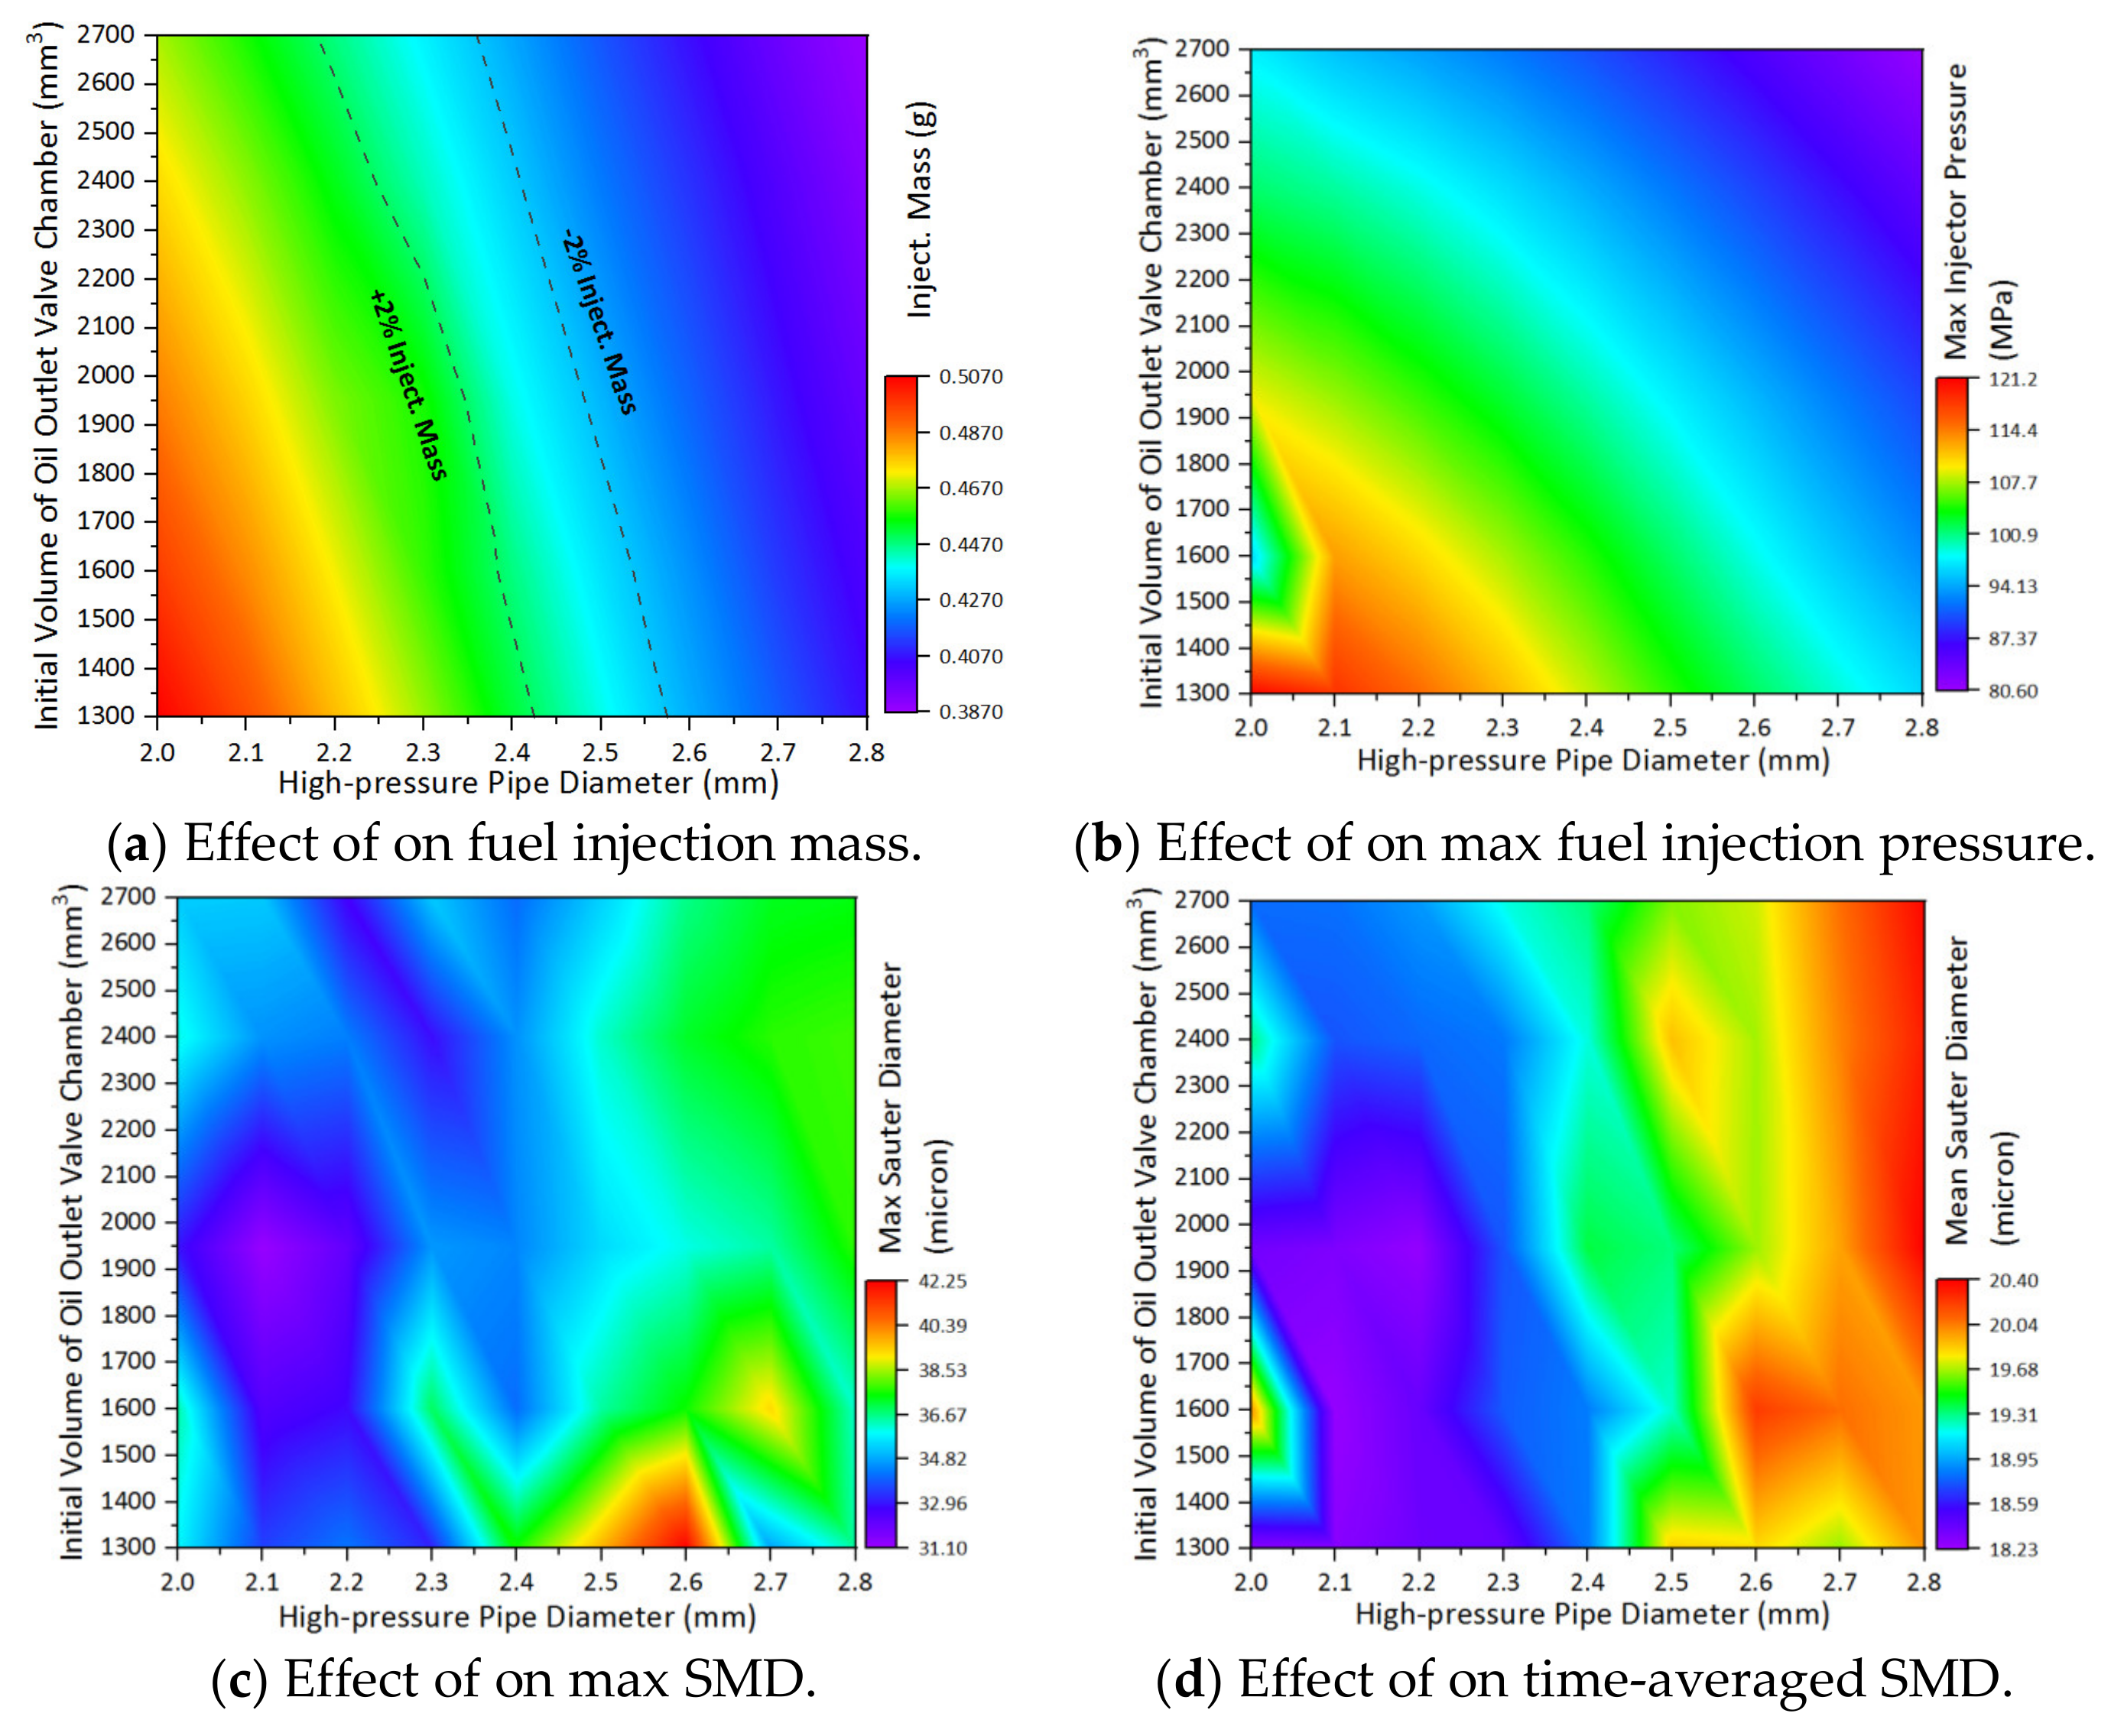
2.1.2. Performance of Diameters of High-Pressure Oil Pipe on Spray Characteristics
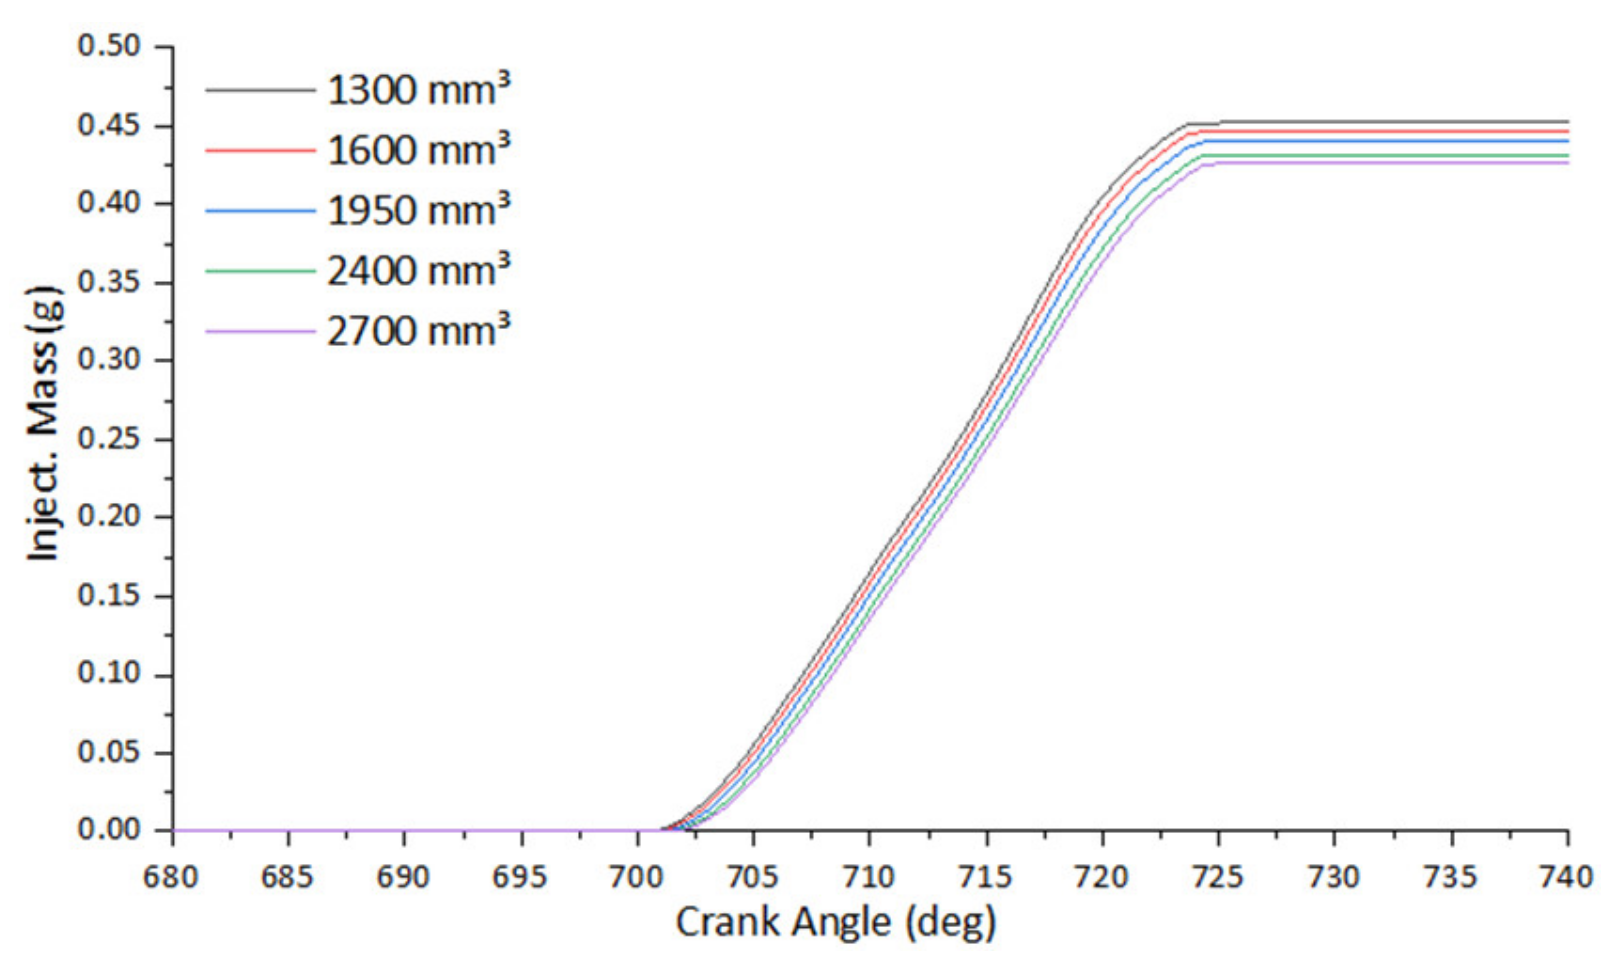
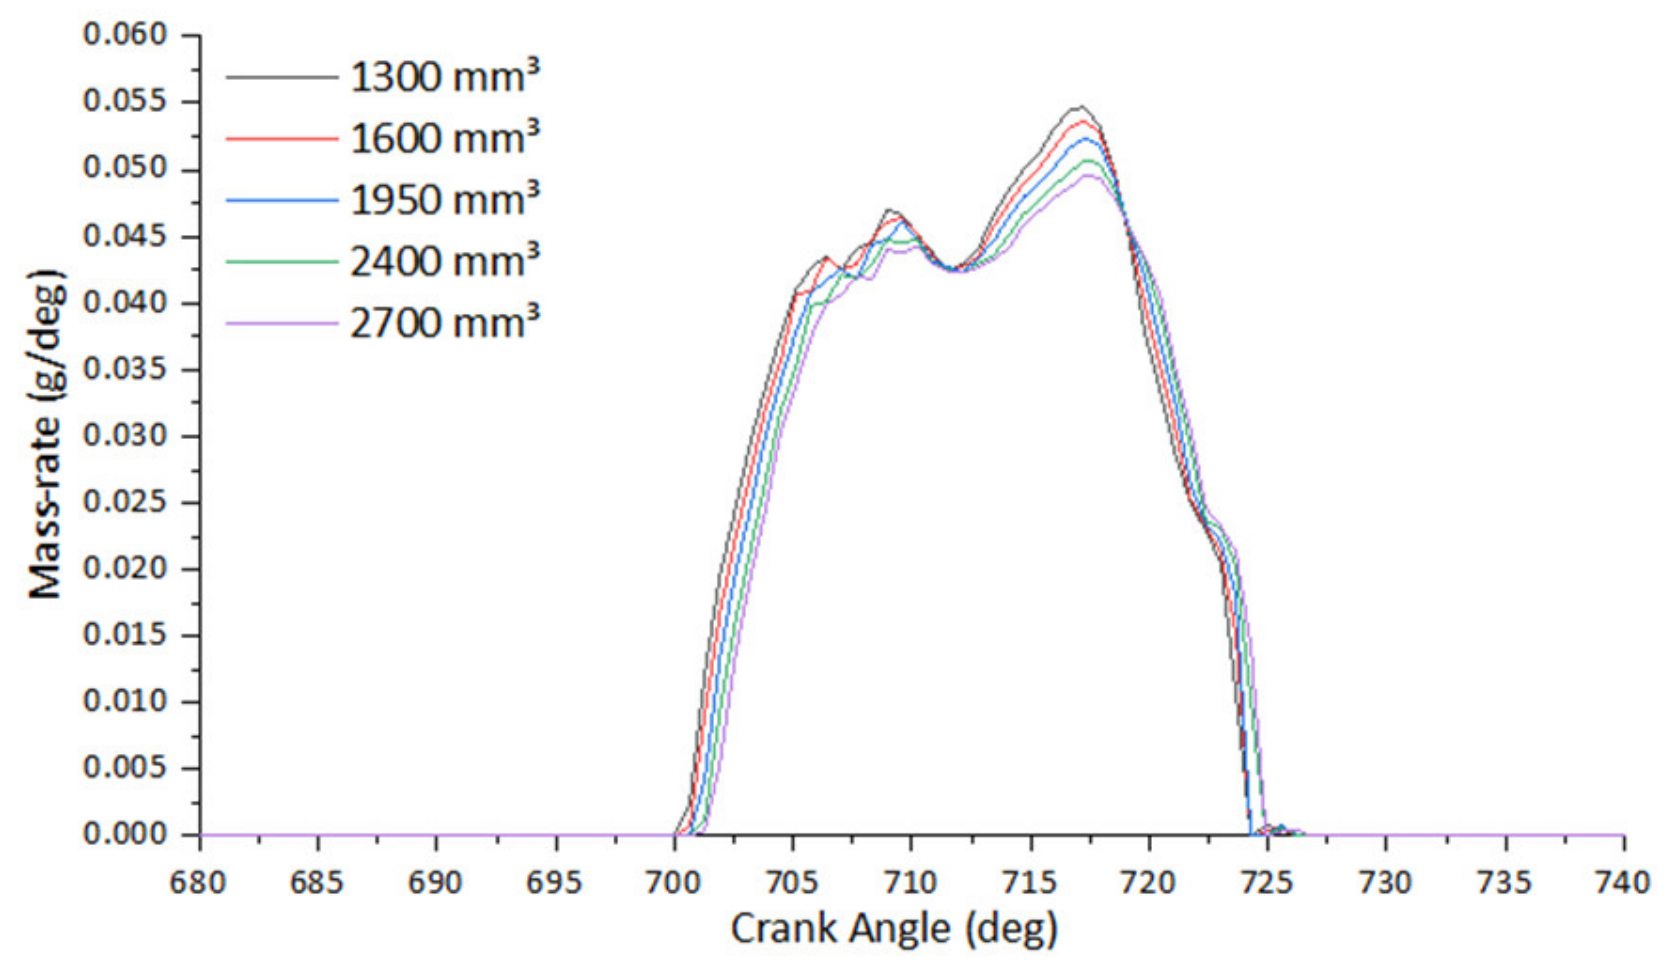
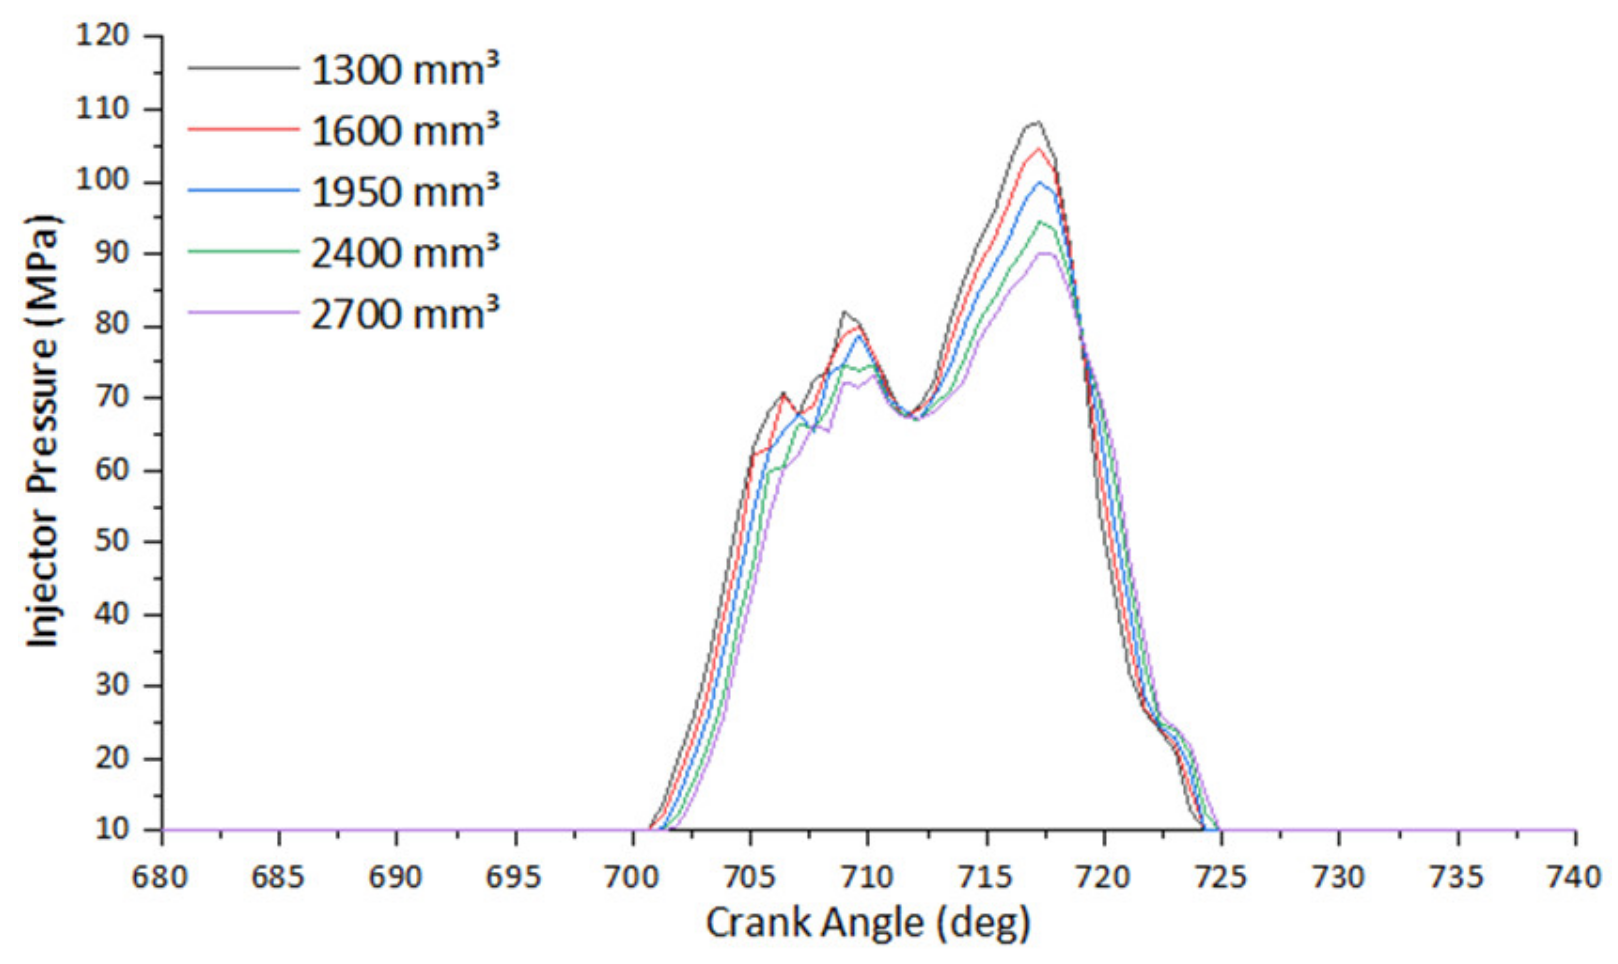
2.1.3. Performance of Initial Volume of Fuel Outlet Valve on Fuel Spray Characteristics
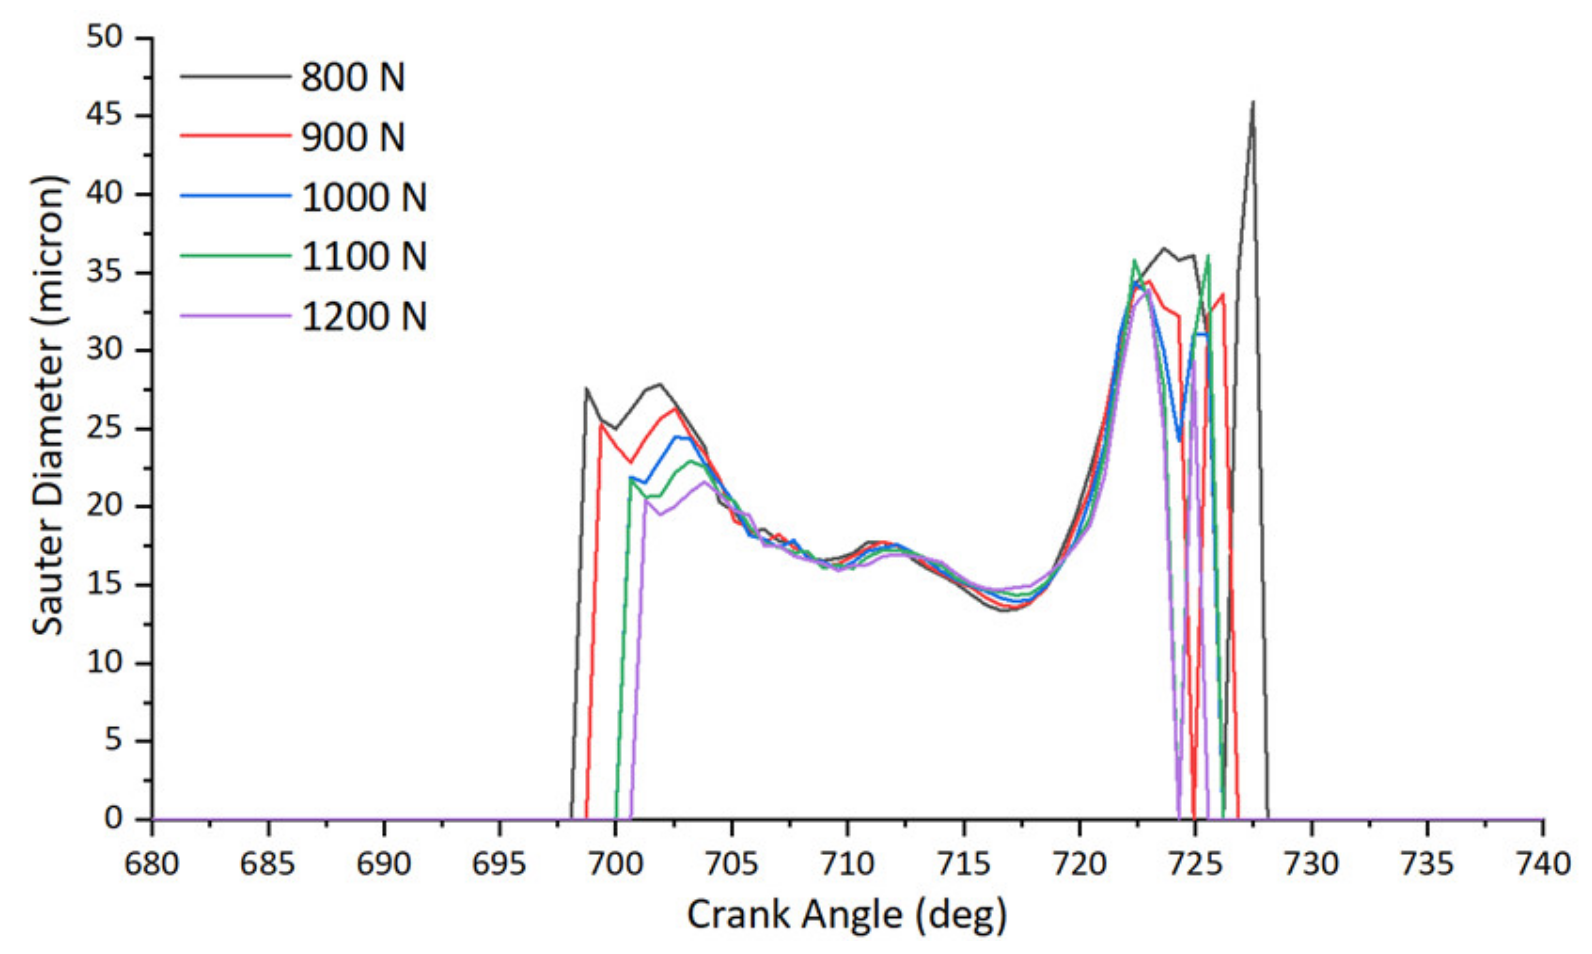
2.1.4. Performance of Needle Valve Opening Pressure on Fuel Spray Characteristics
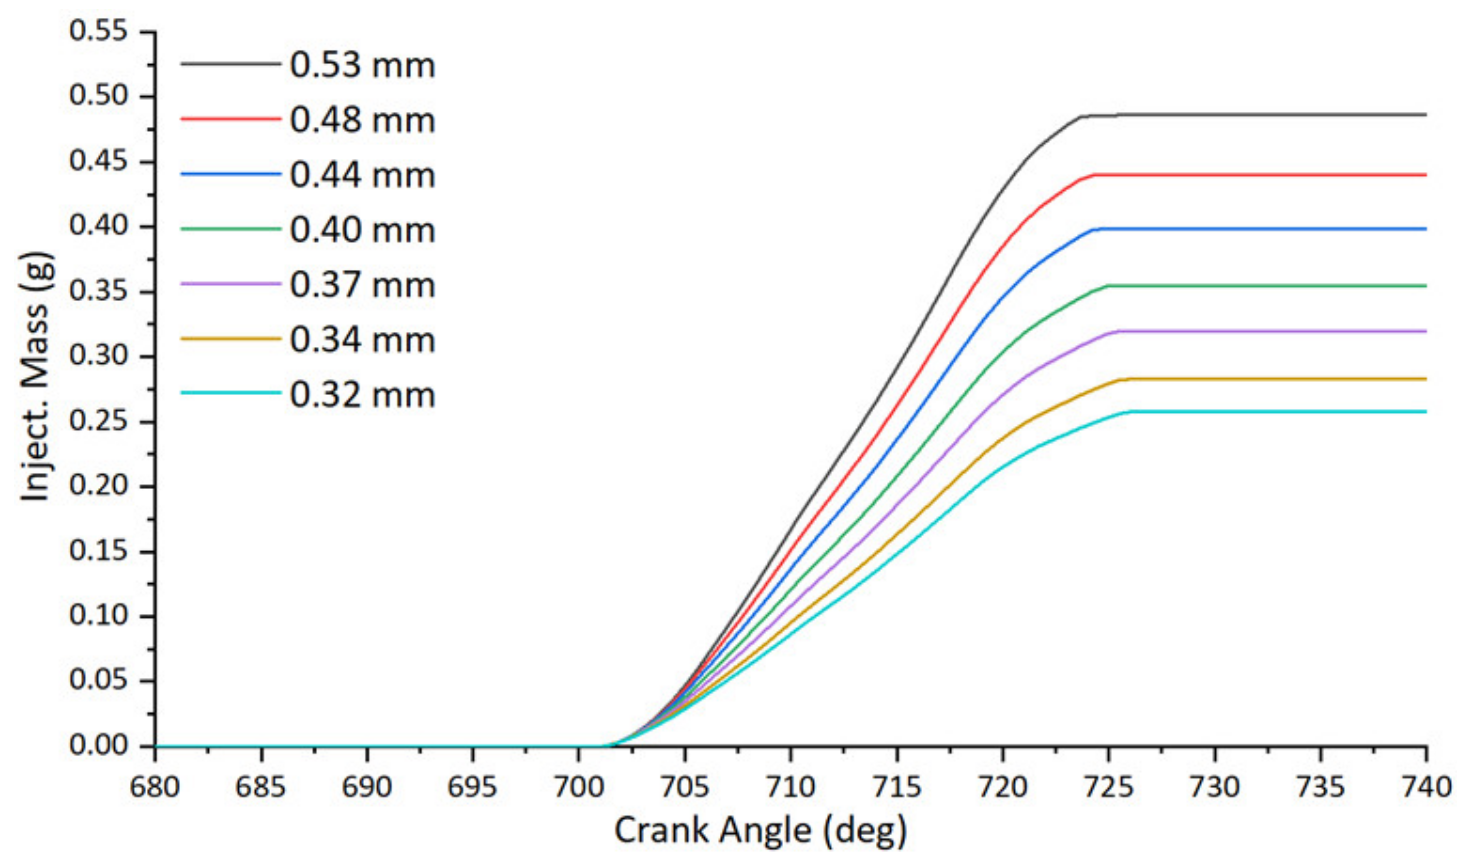
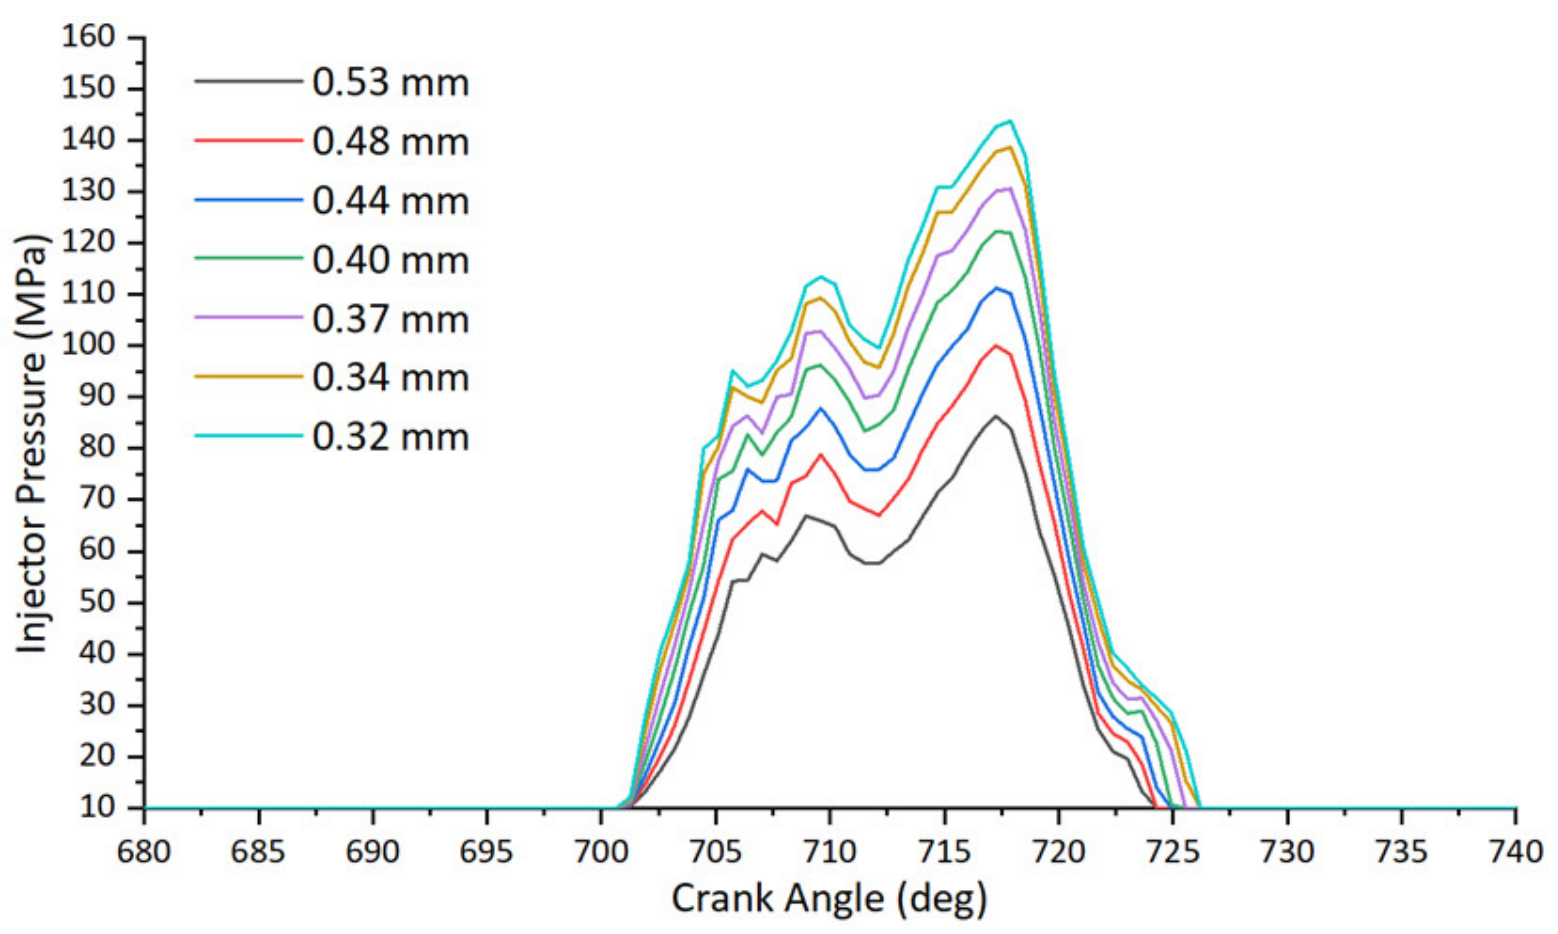
2.1.5. Performance of Nozzle Diameters on Spray Characteristics
2.2. Optimization of Fuel Injection System Based on Orthogonal Optimization Method
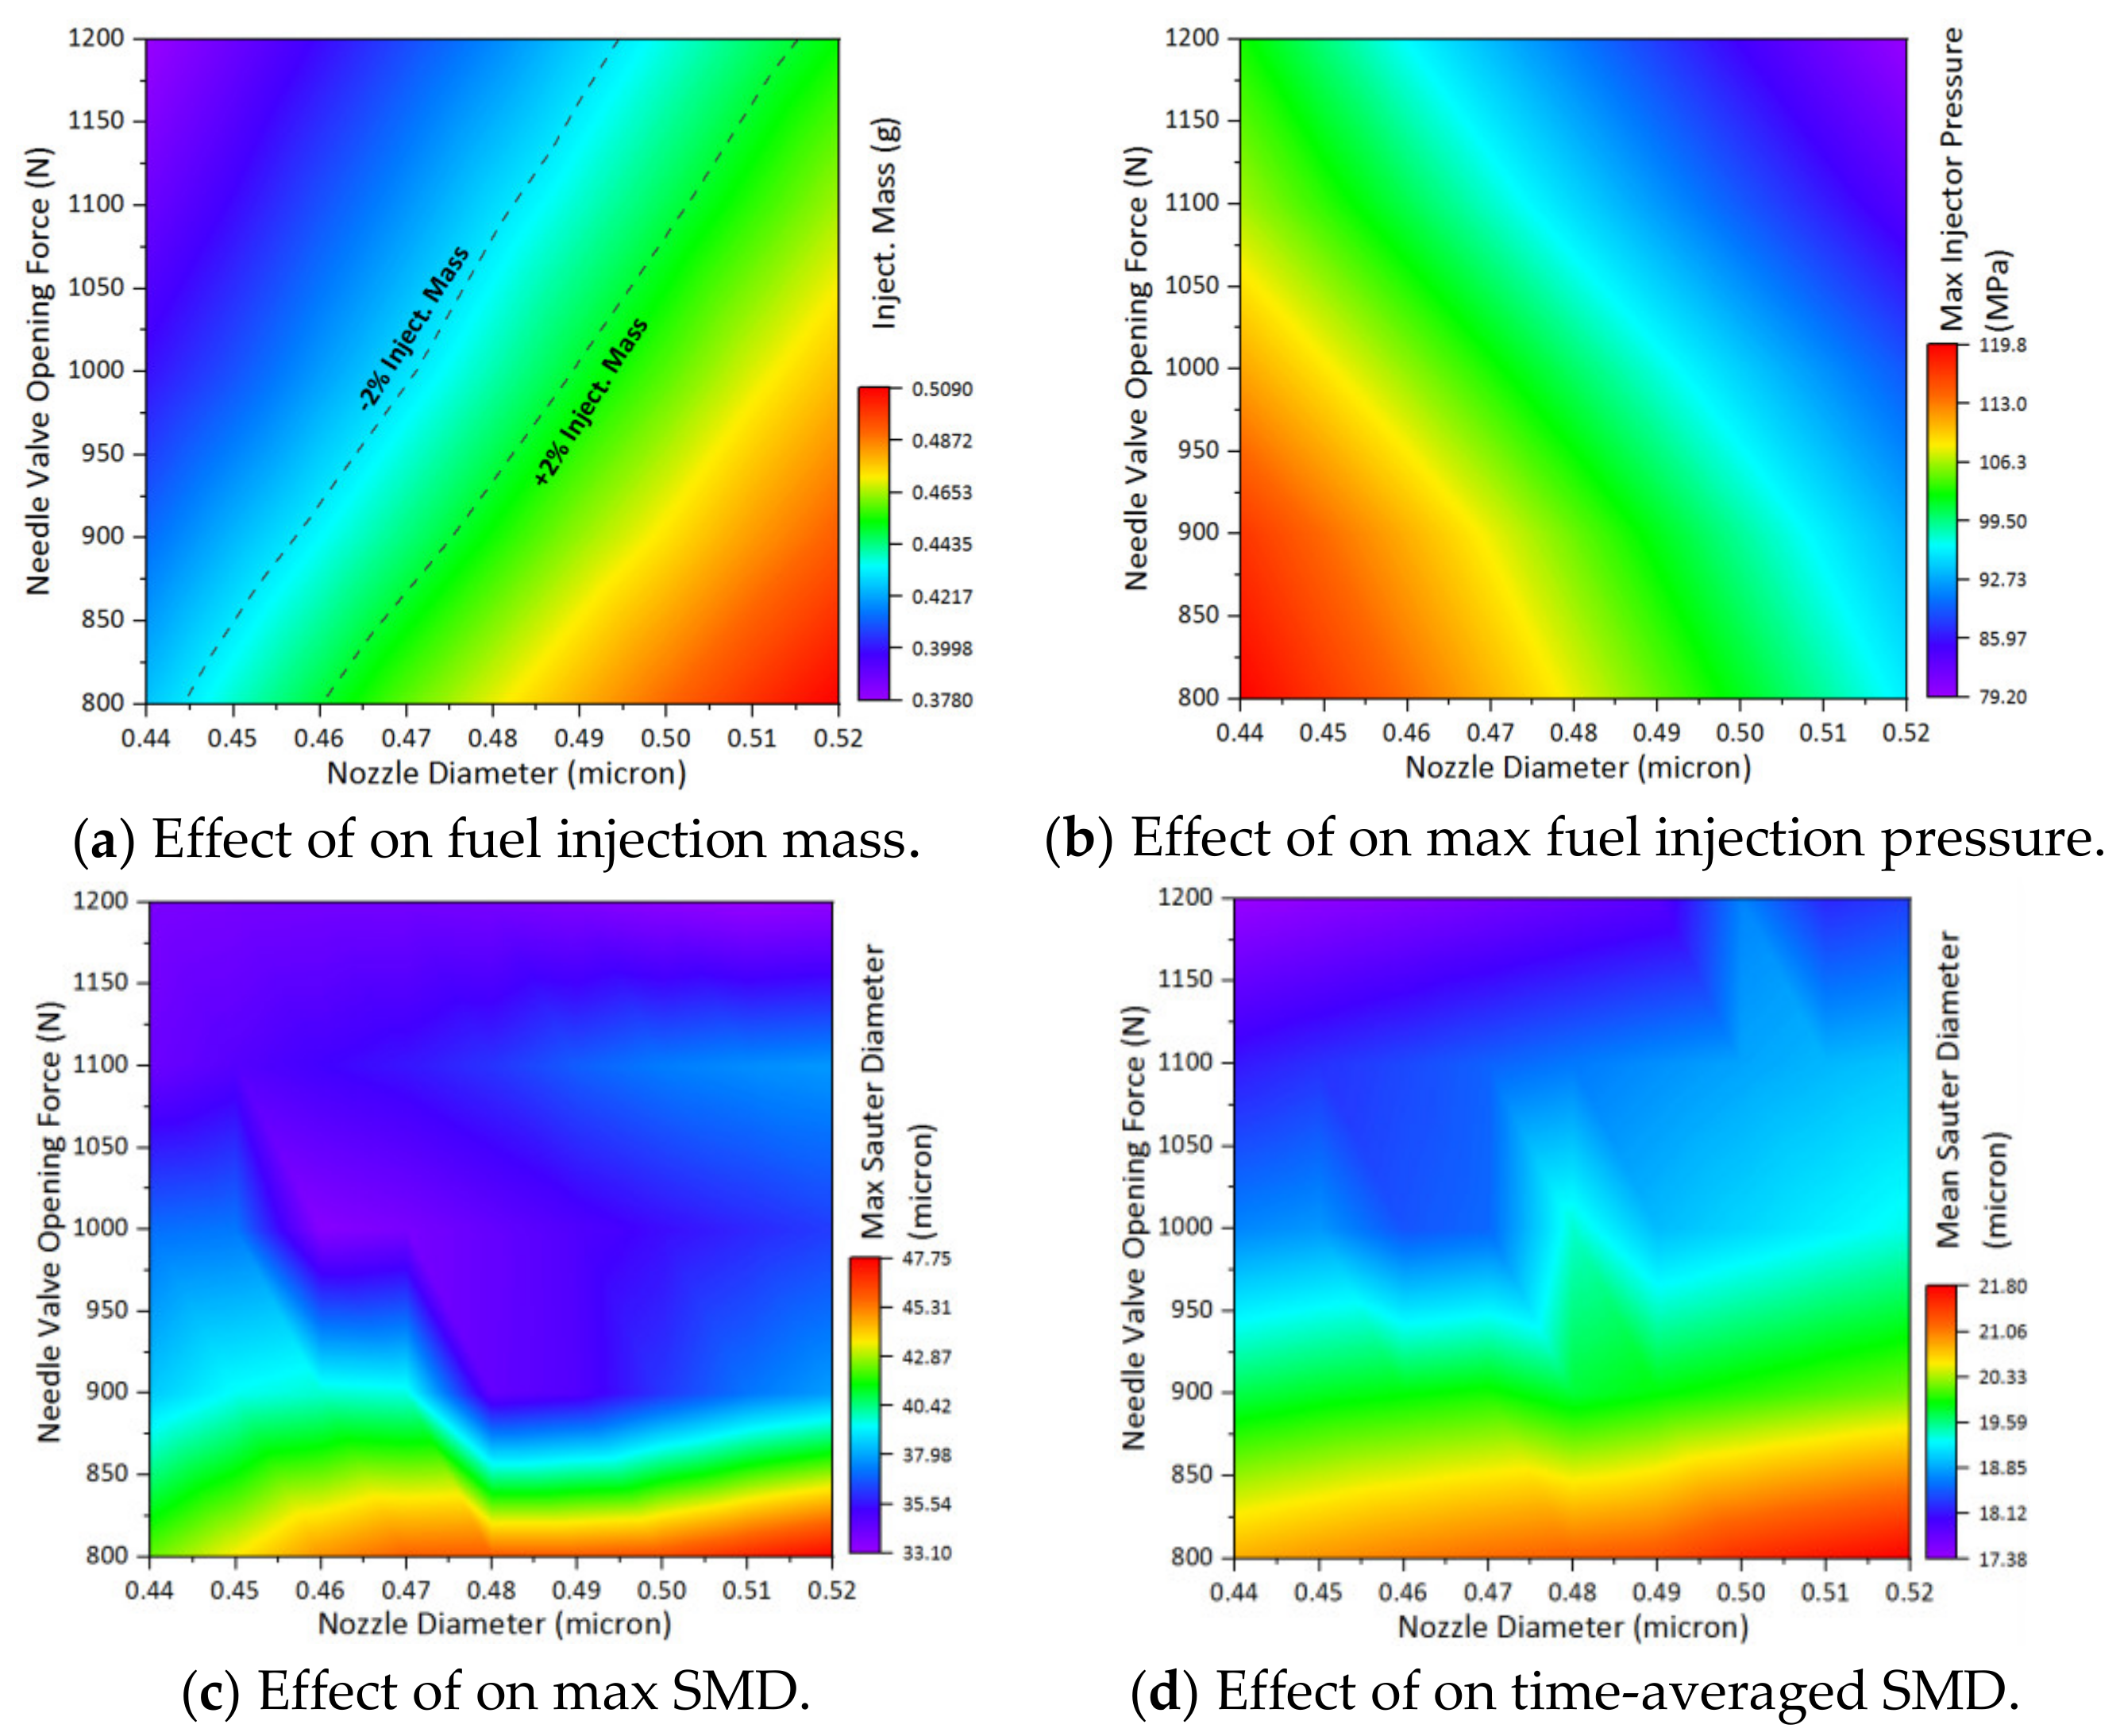
2.2.1. Orthogonal Optimization of Needle Valve Opening Pressure and Nozzle Diameter on Spray Characteristics
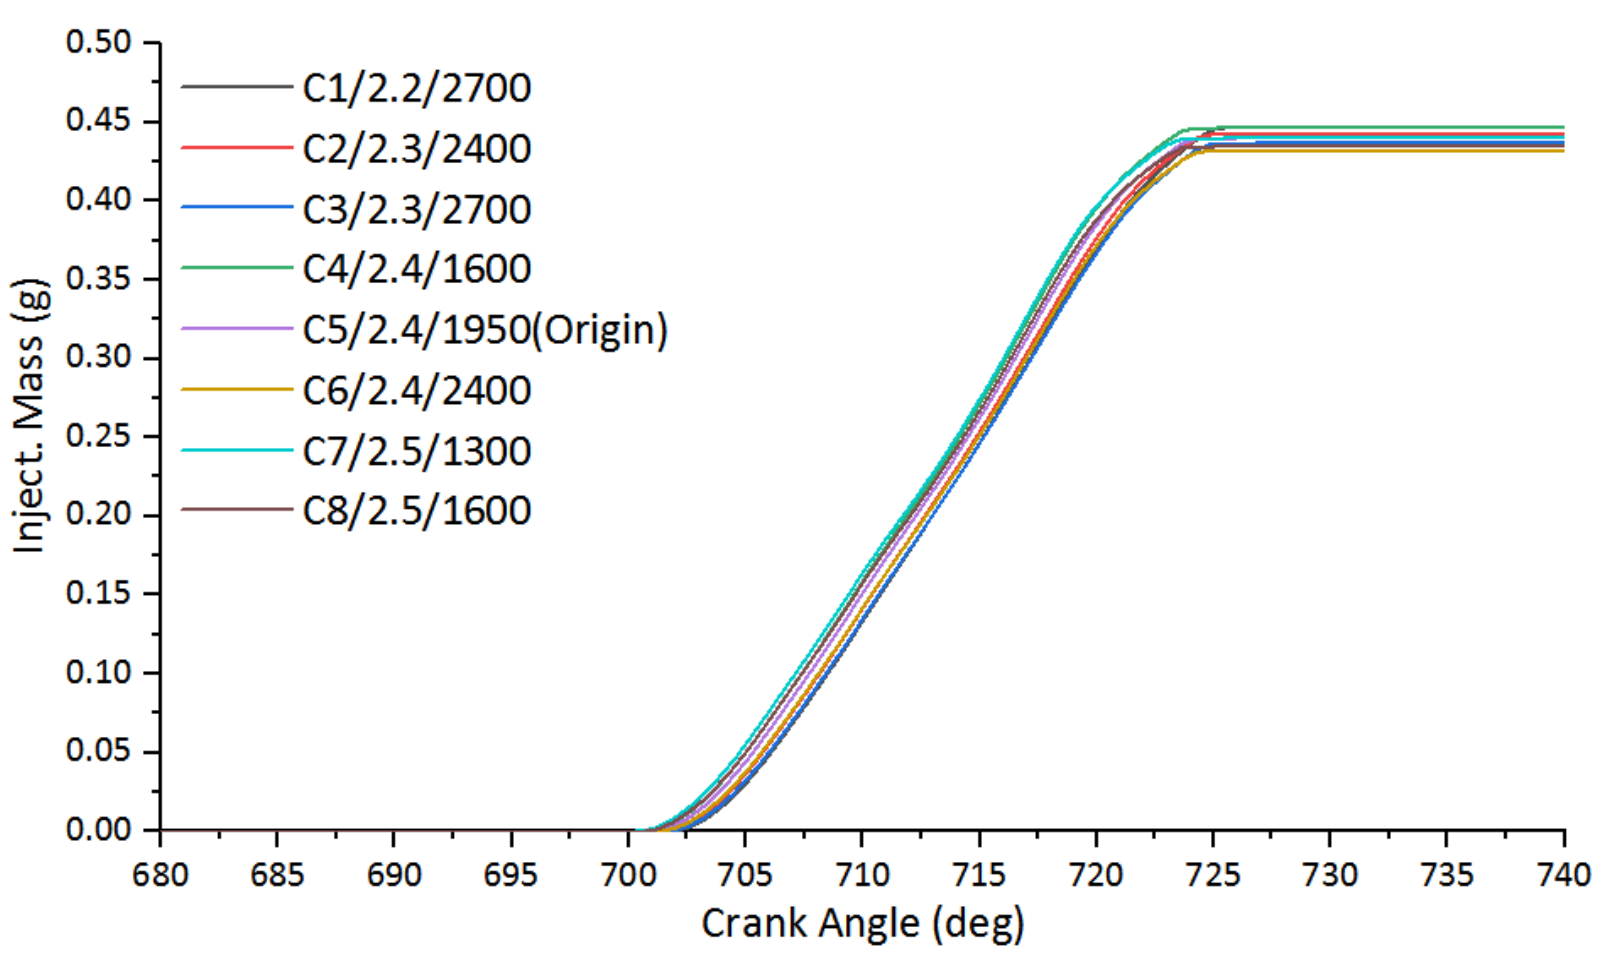
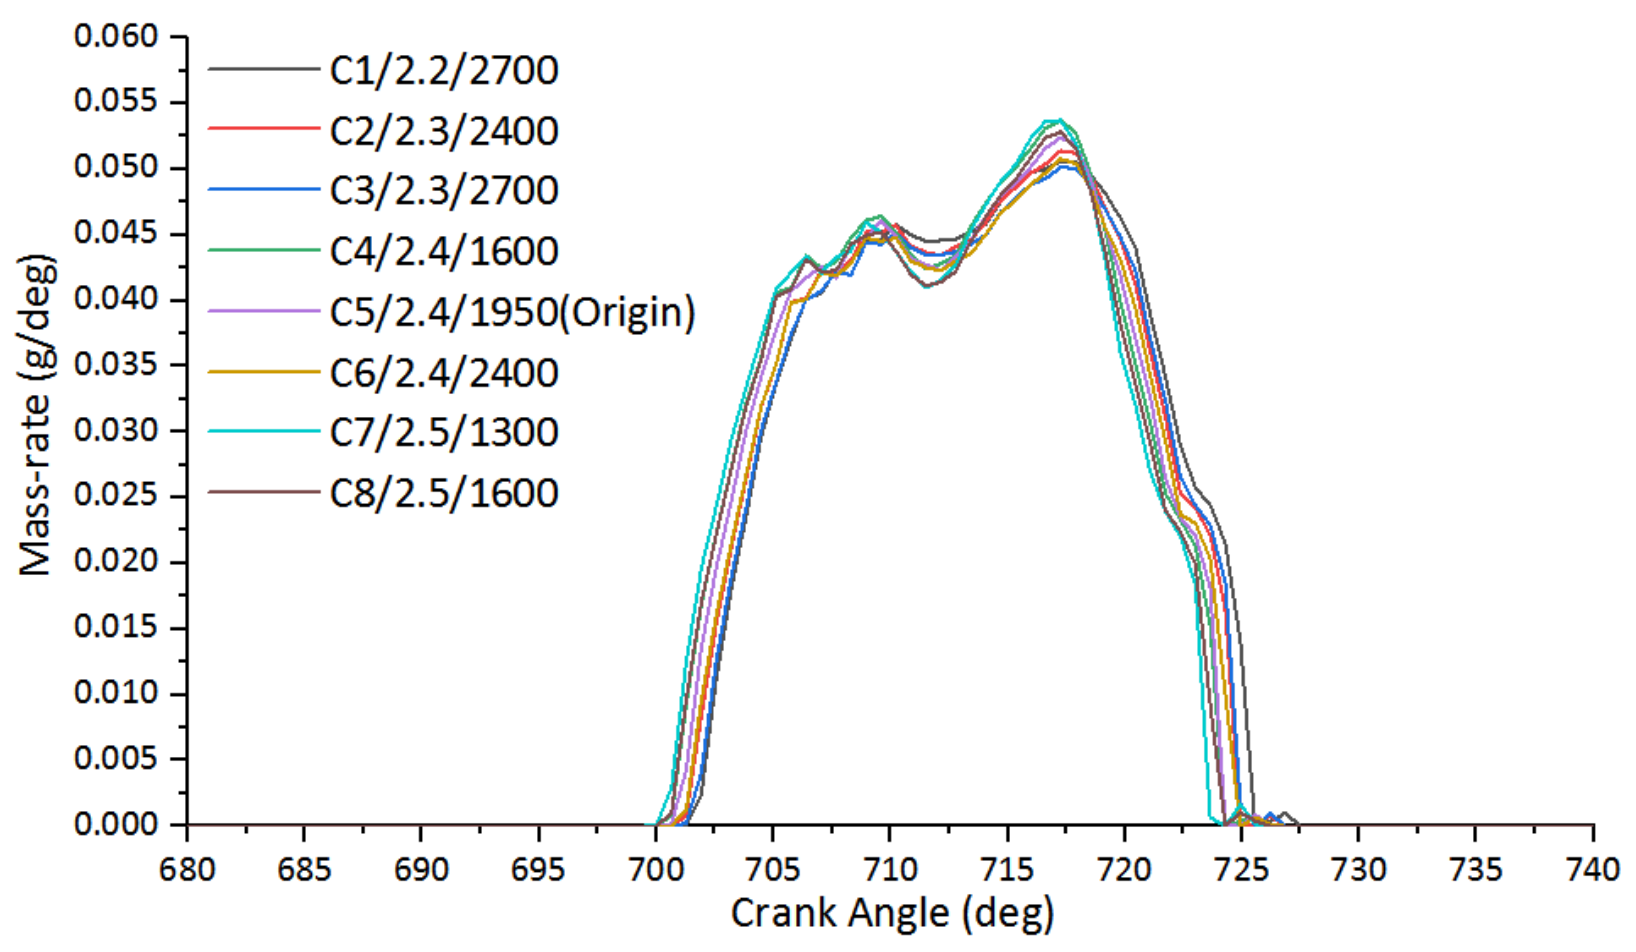
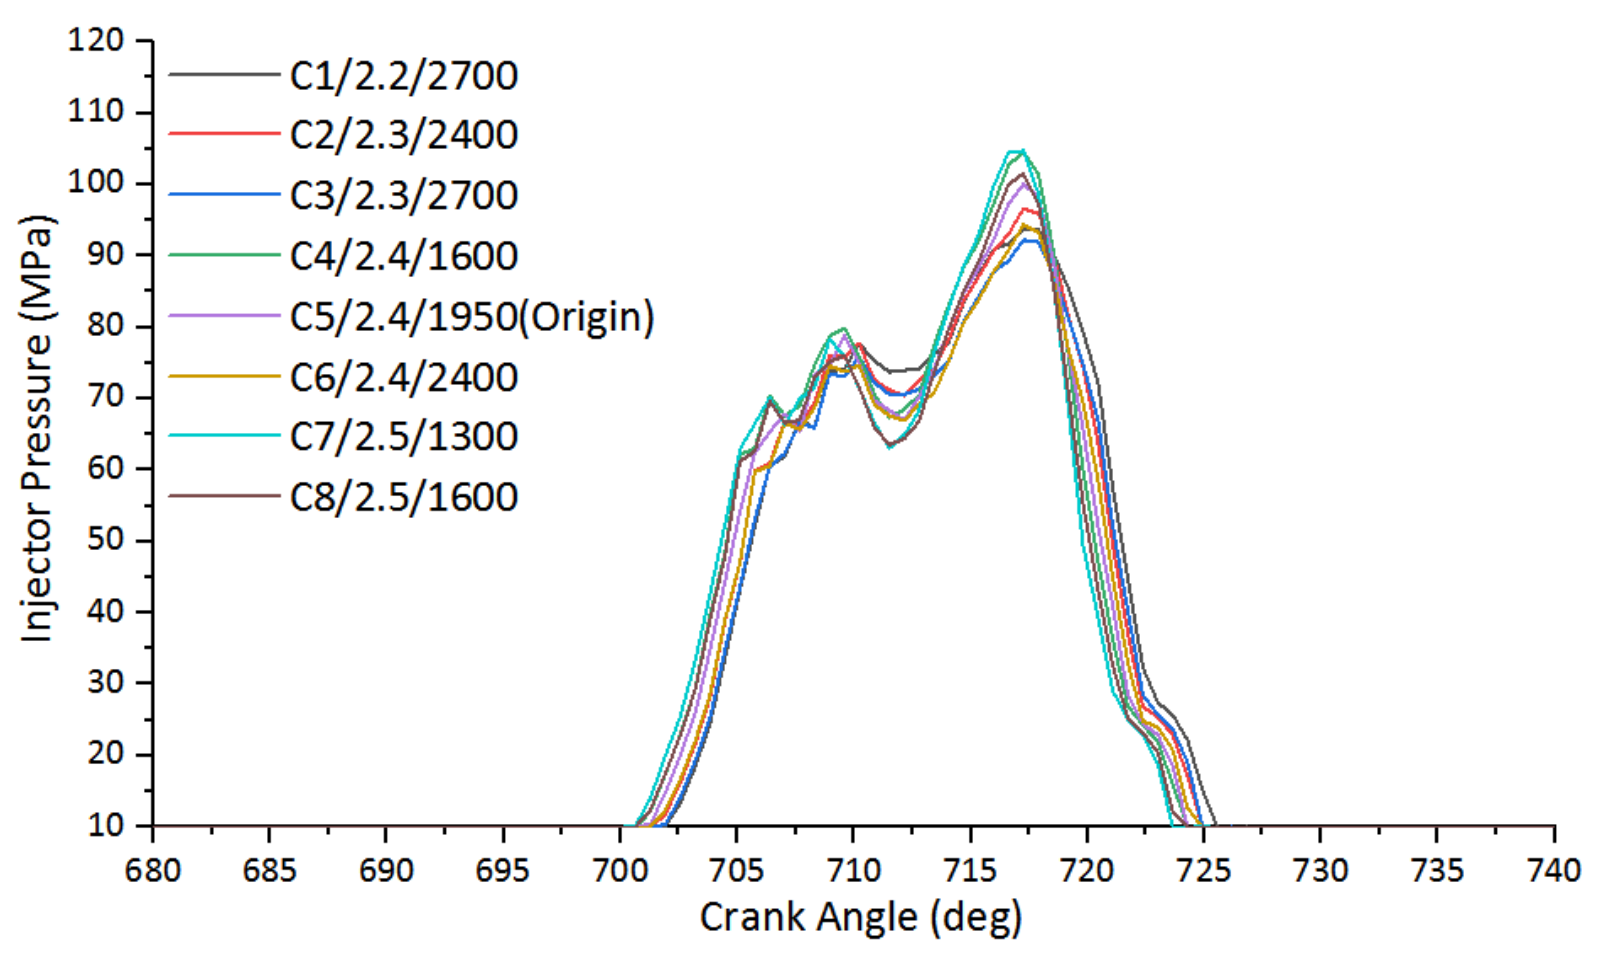
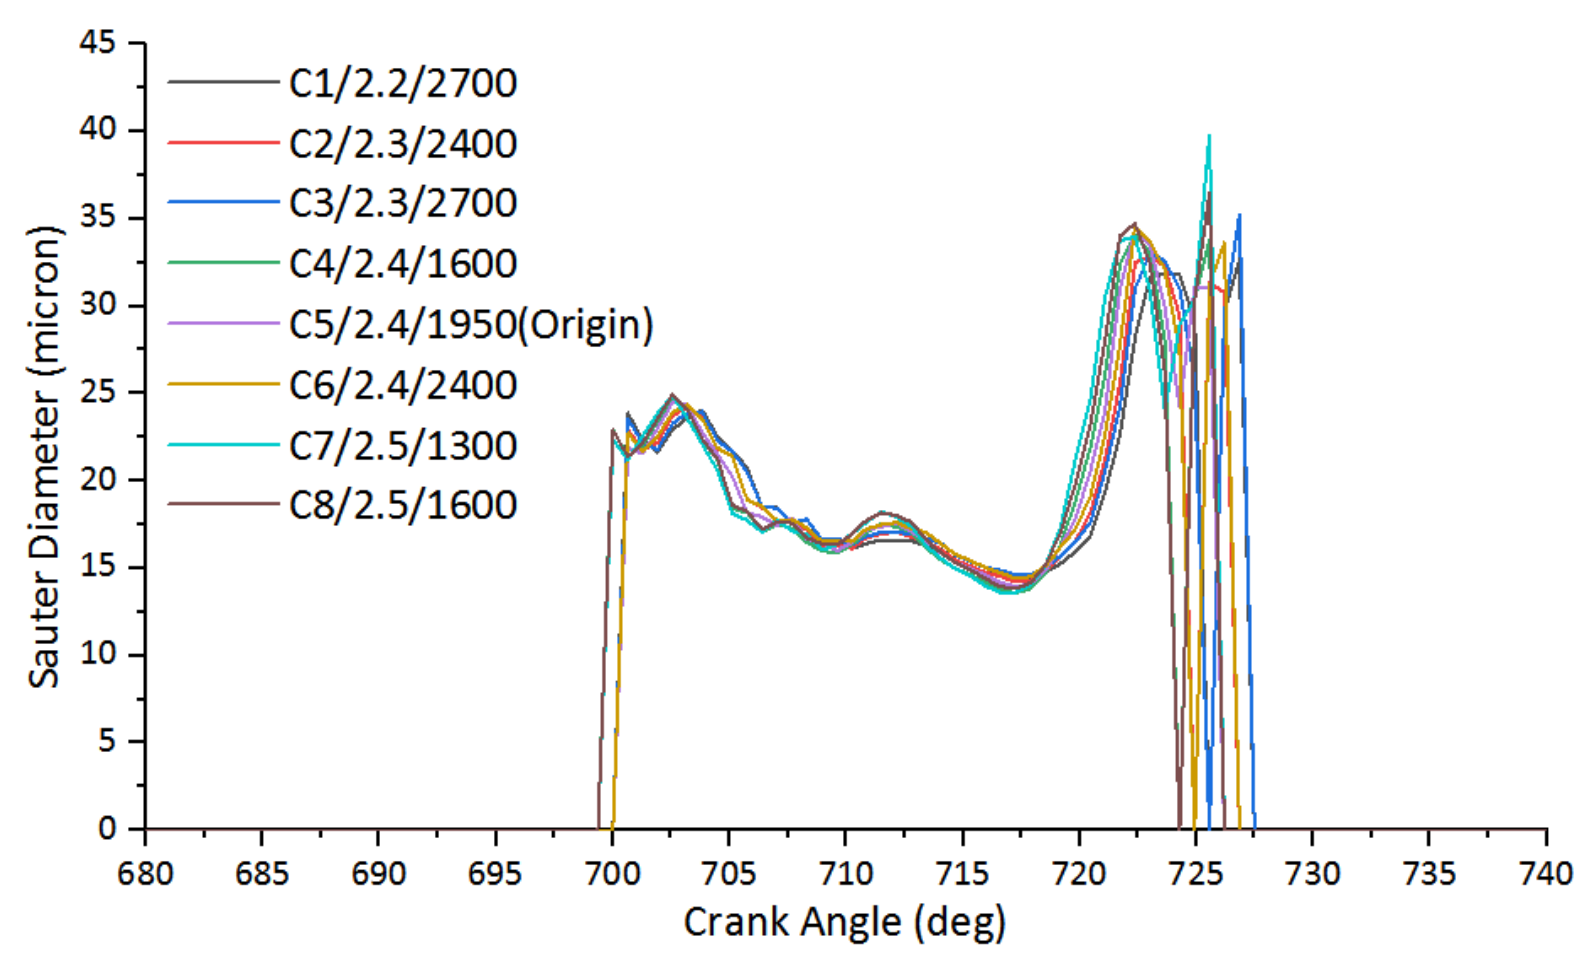
2.2.2. Orthogonal Optimization of Diameters of High-Pressure Oil Pipe and Volume of Fuel Outlet Valve on Spray Characteristics
2.2.3. Orthogonal Optimization of Injector Positions and Spray Angles on Spray Characteristics
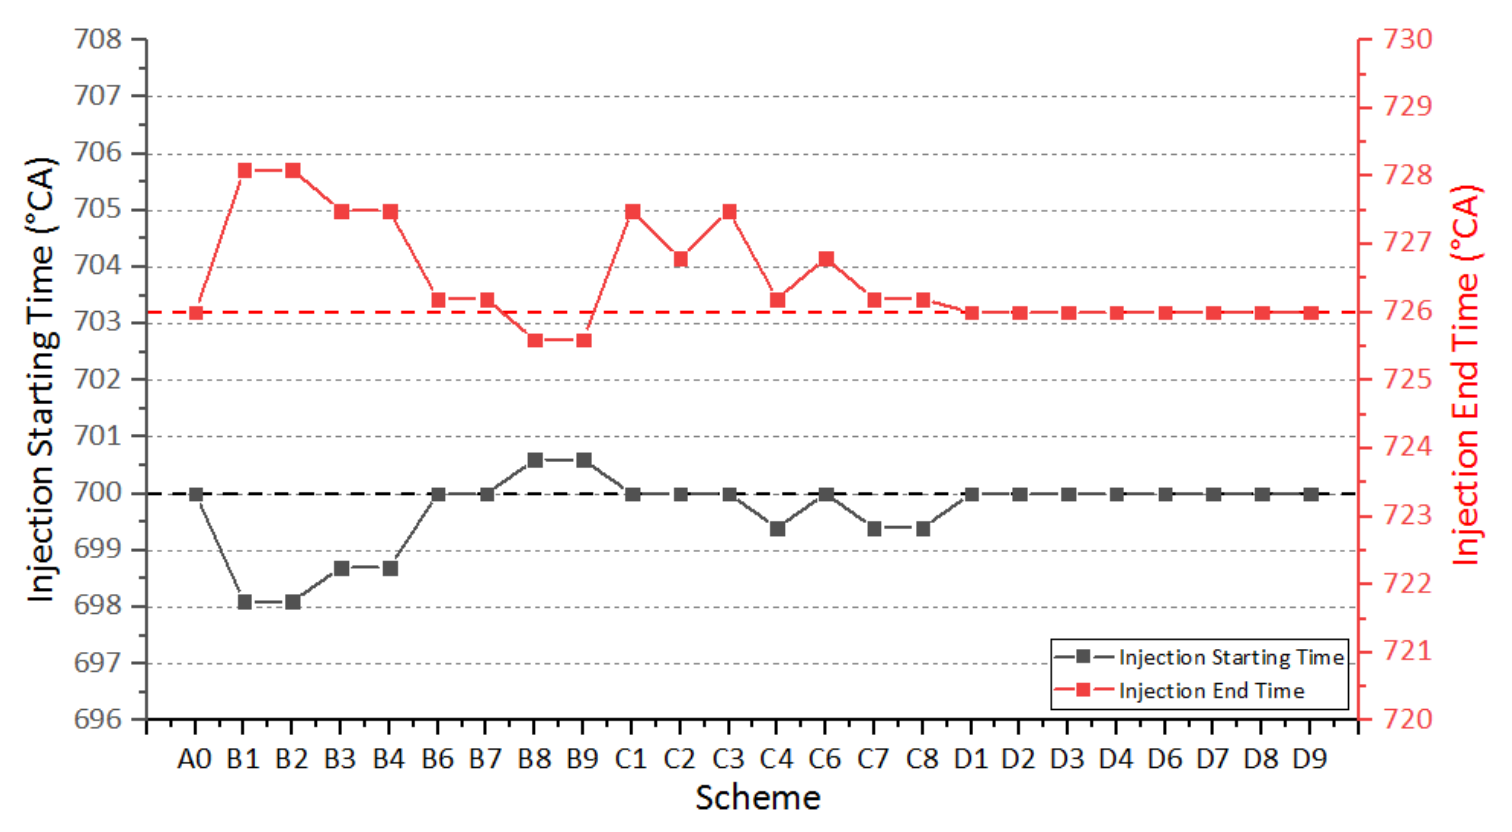
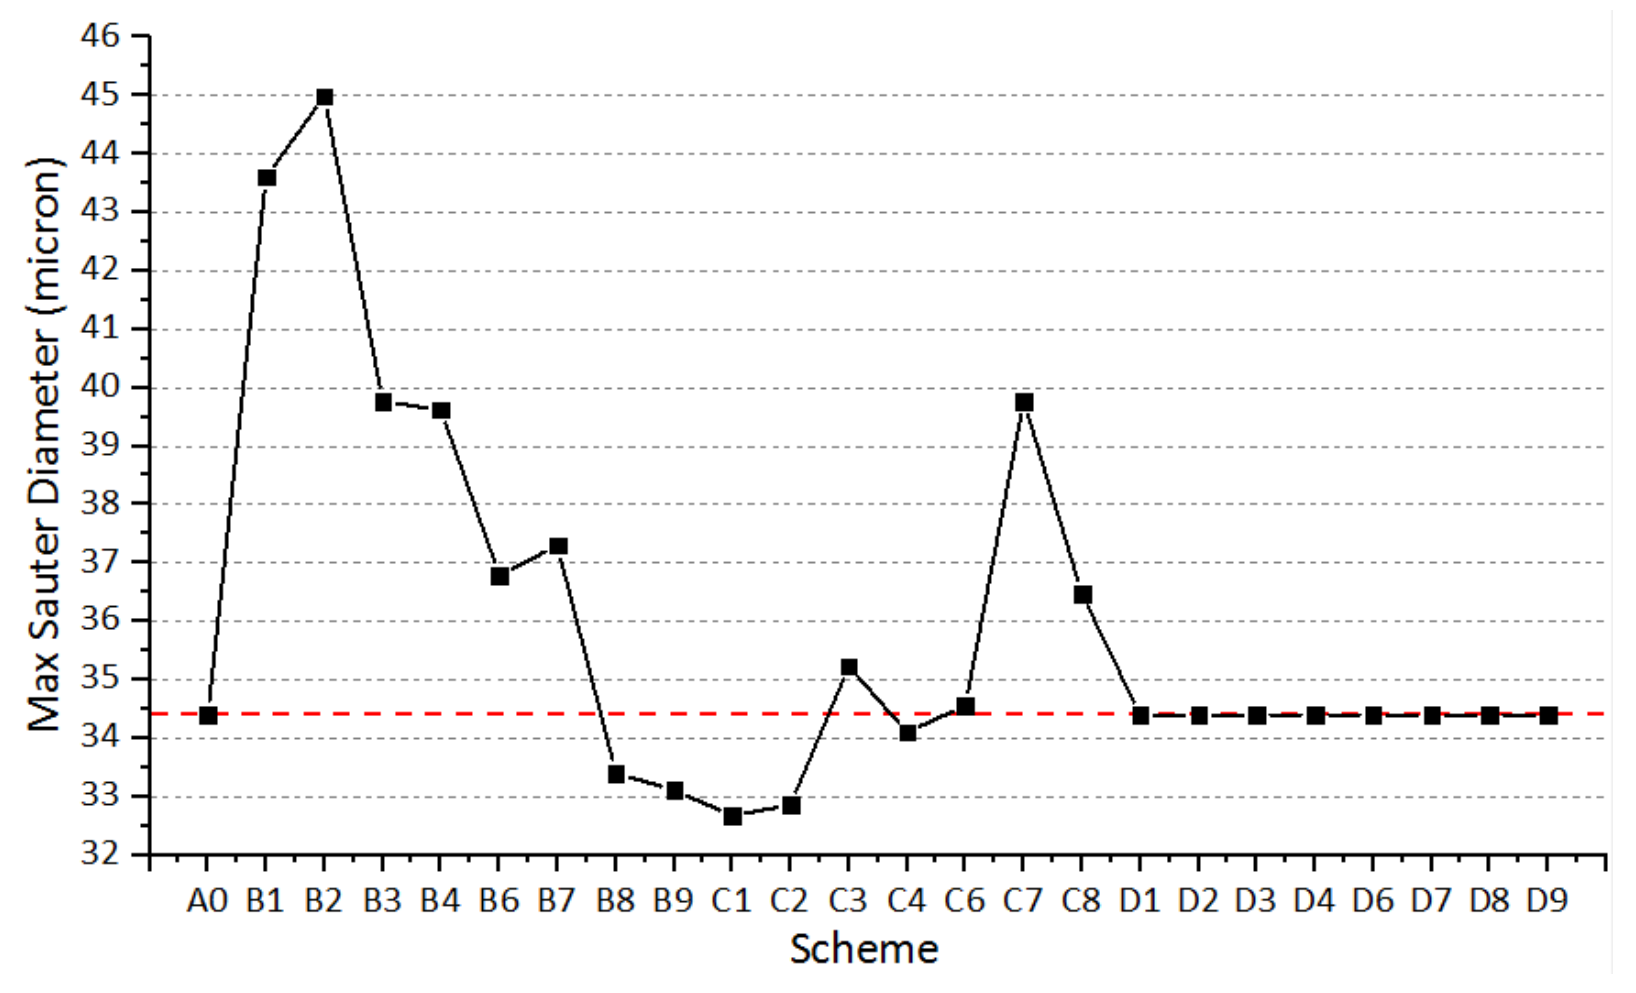
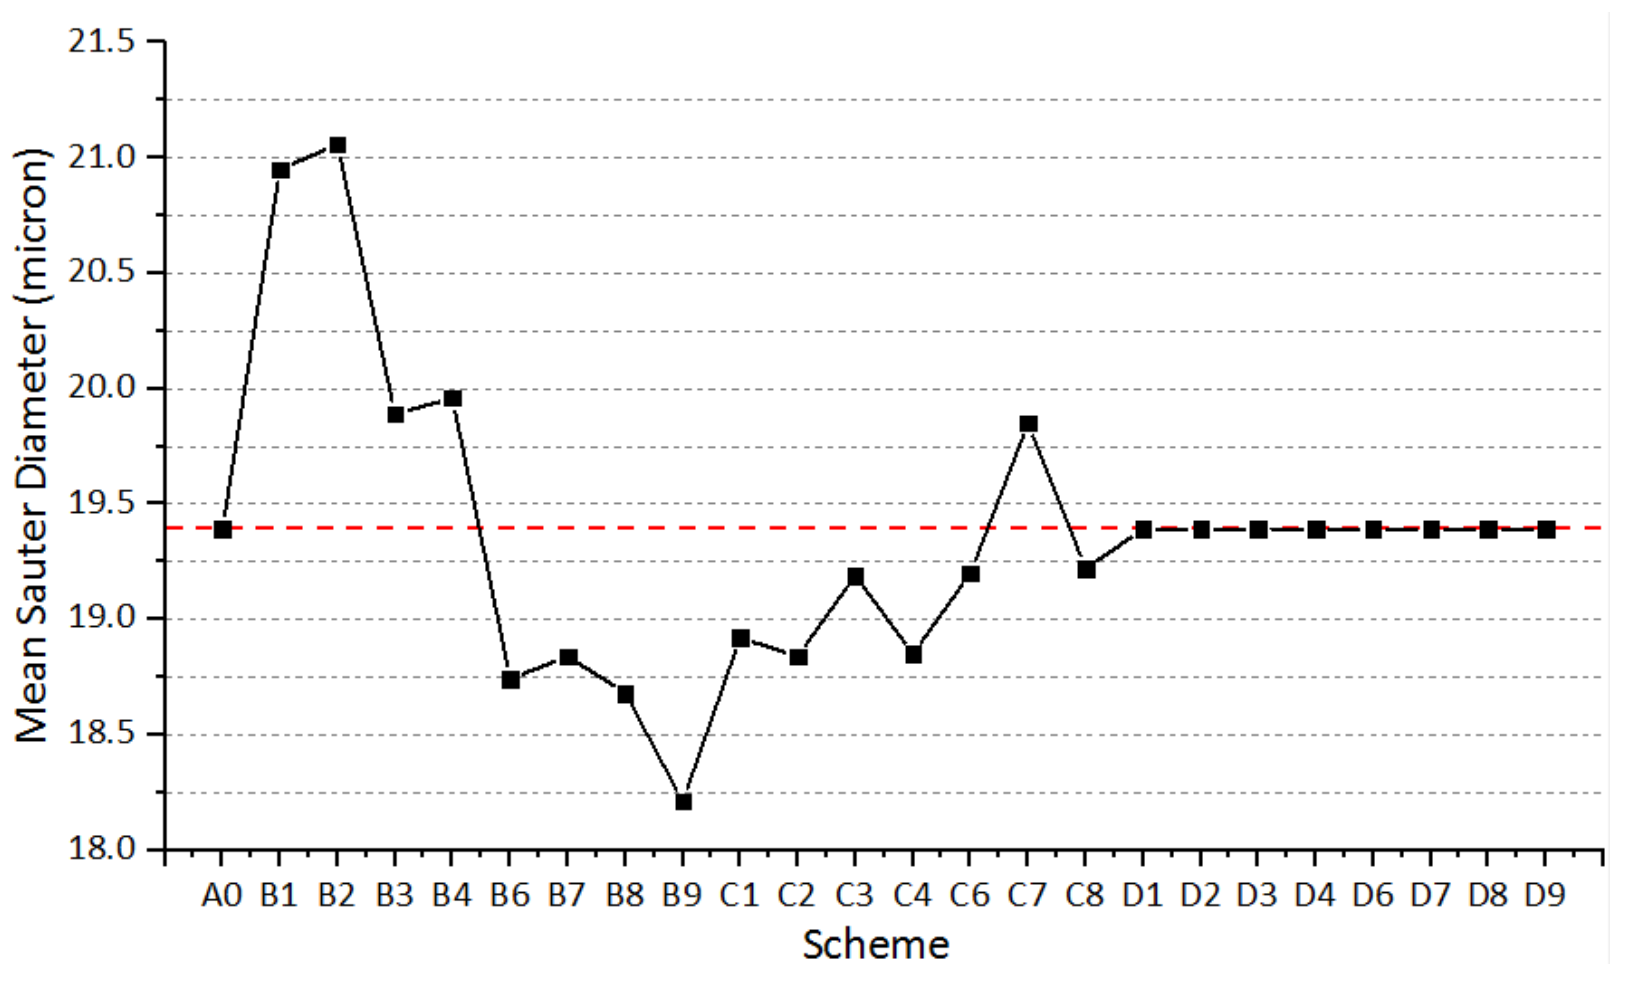
2.2.4. Comparison of the Start of Injection Angle on Emissions and All Pre-Selected Schemes on Fuel Spray Characteristics
2.3. Numerical CFD Simulation Results
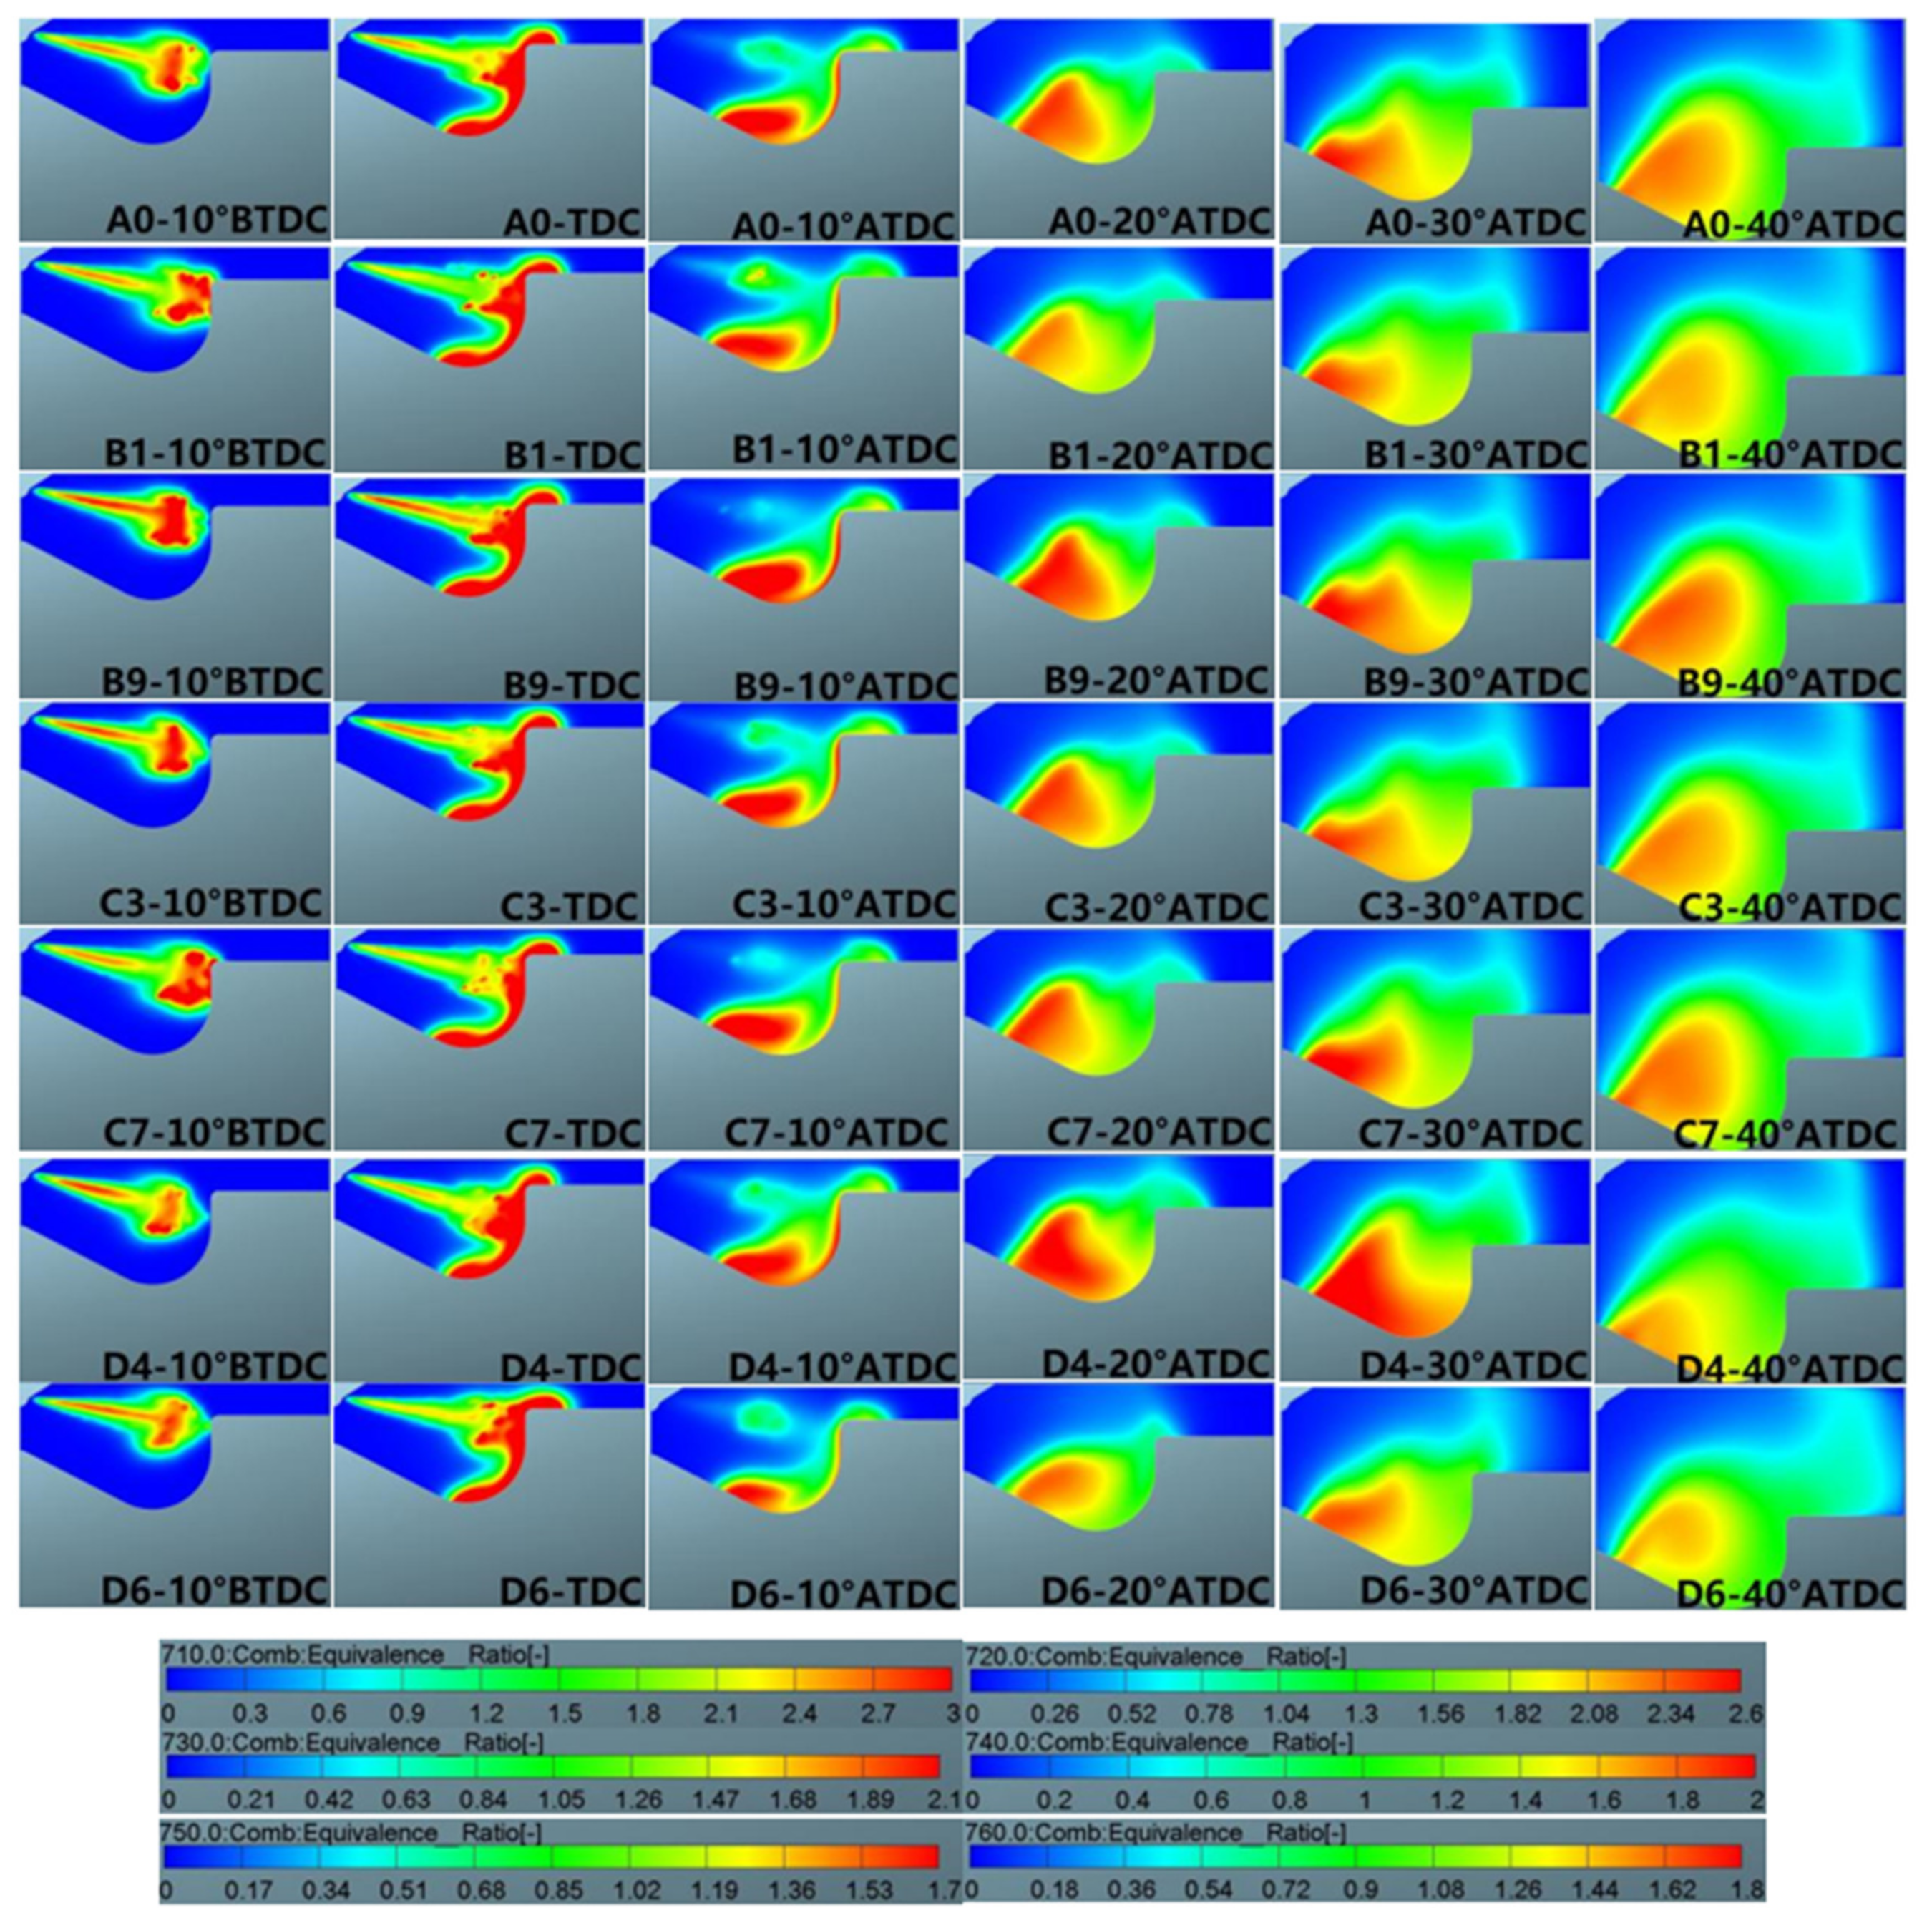
2.3.1. Distributions of Equivalence Ratio
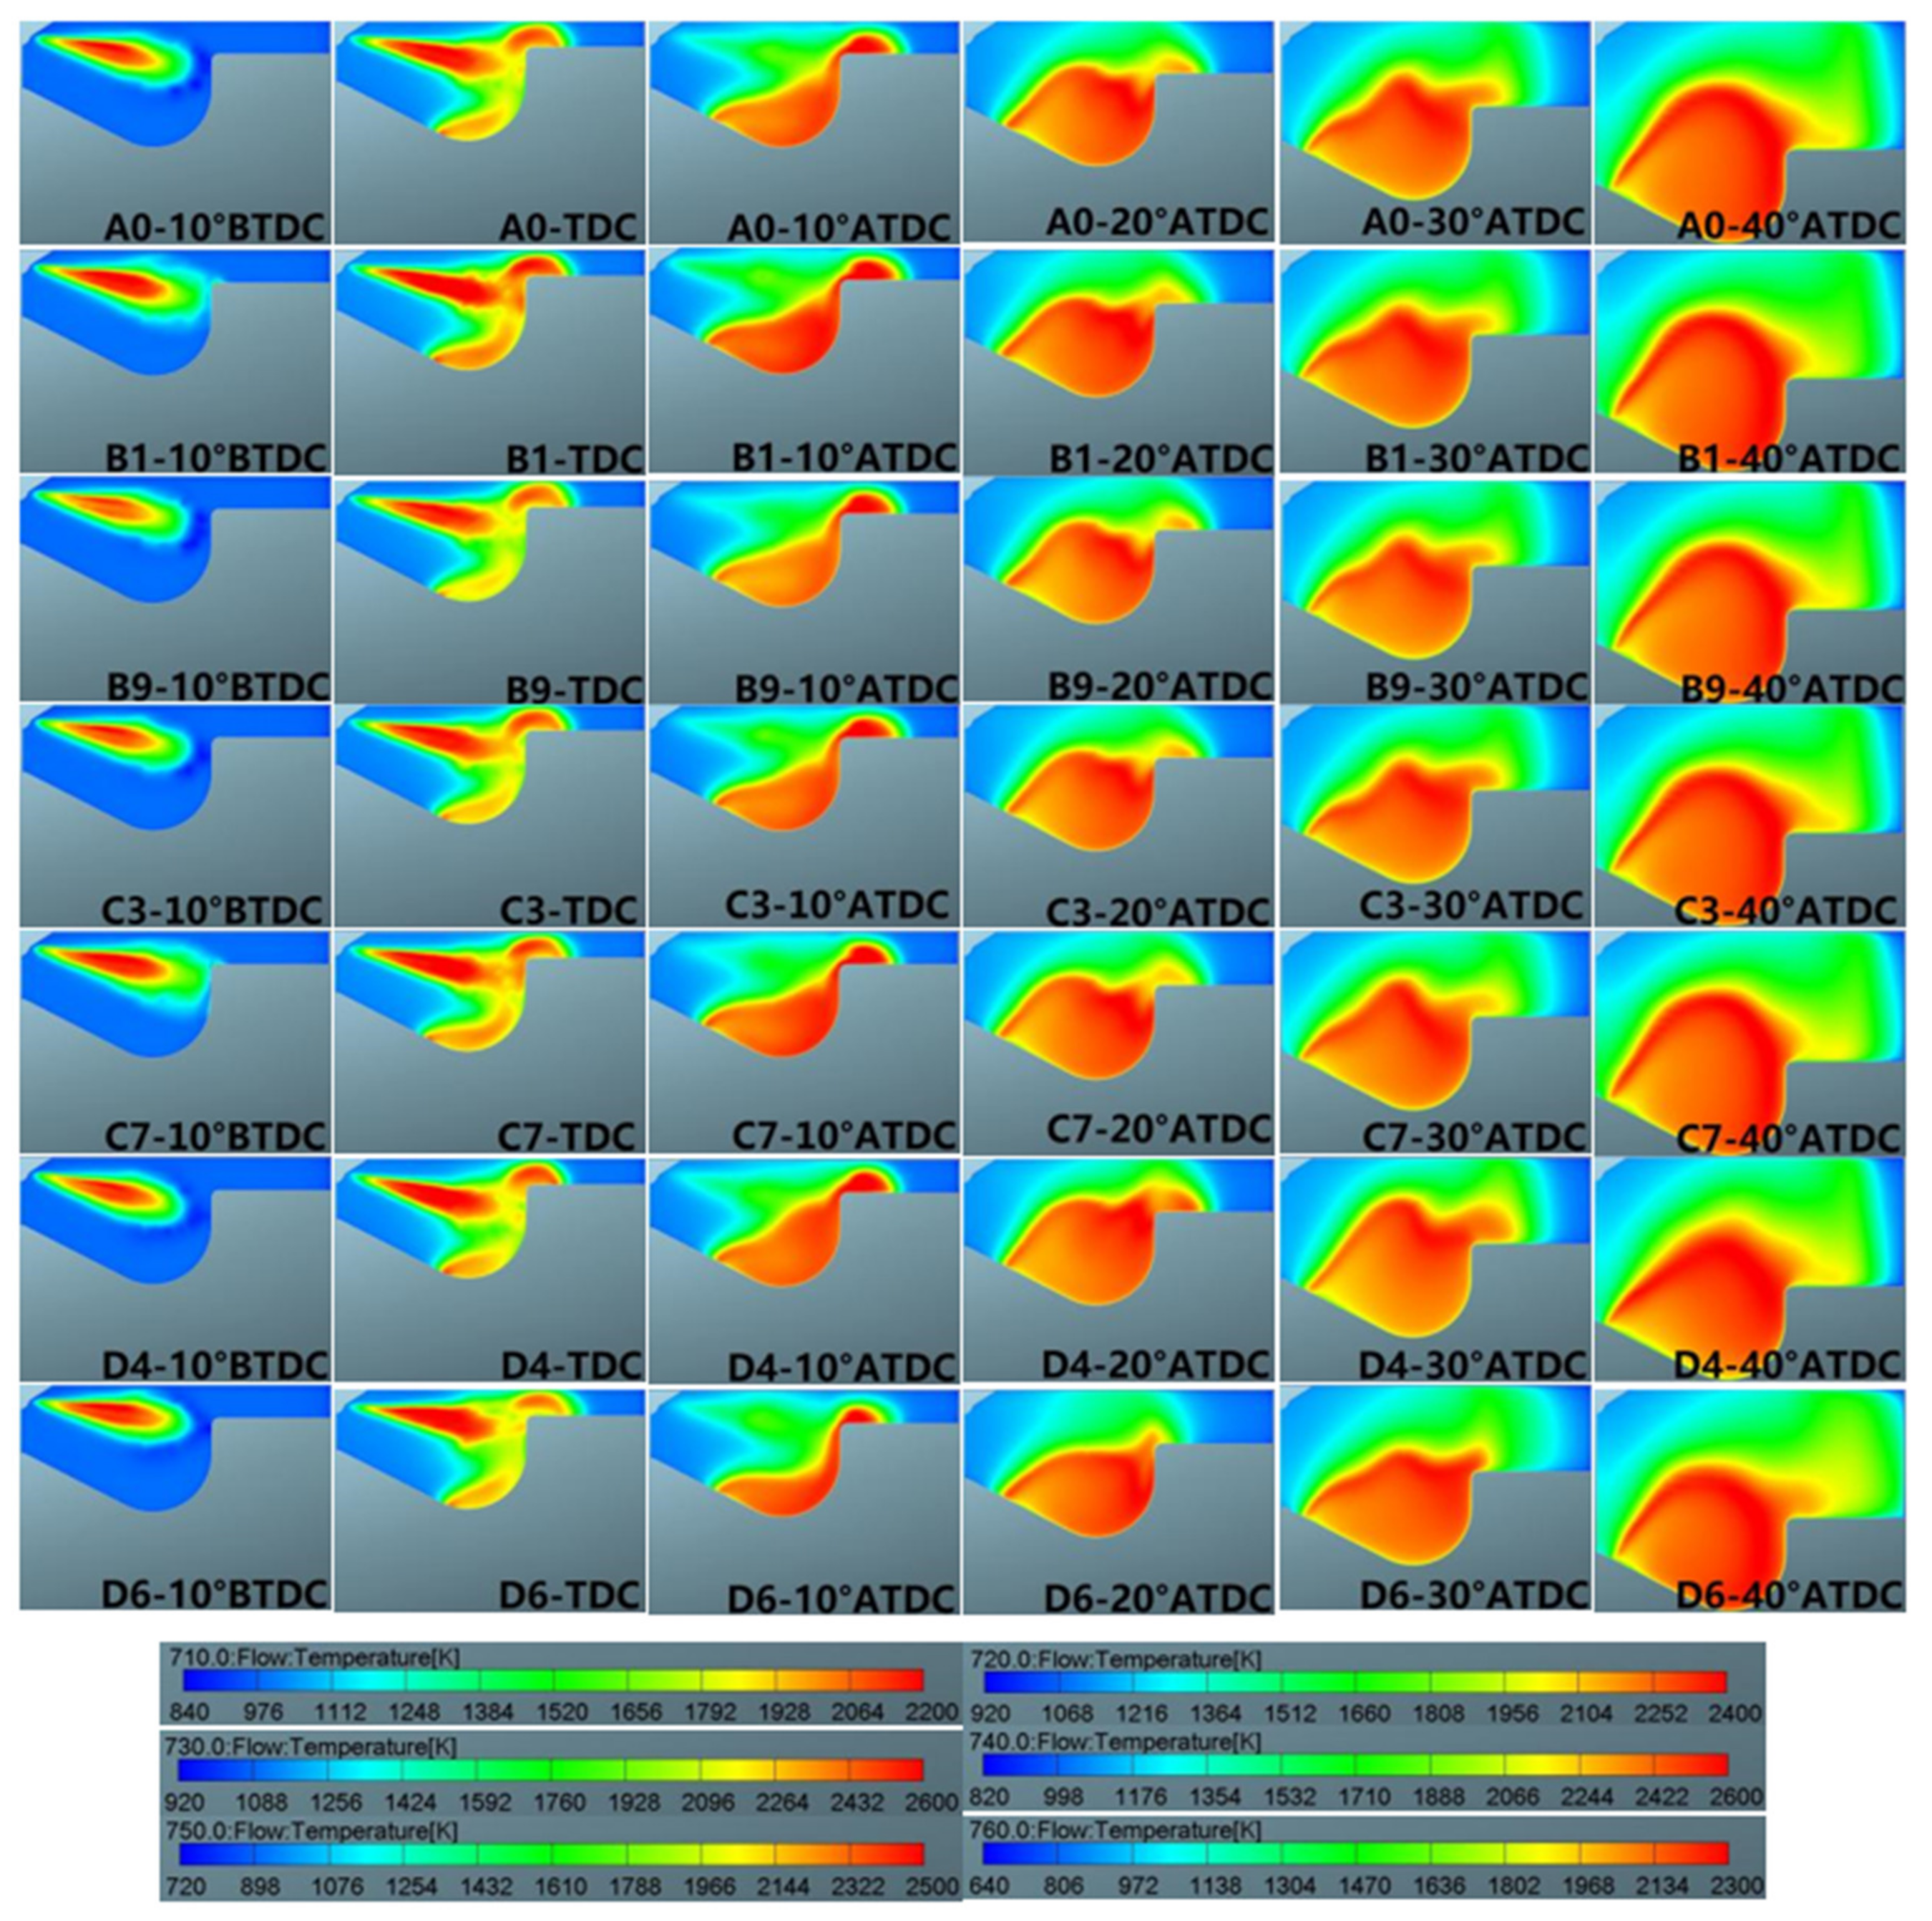
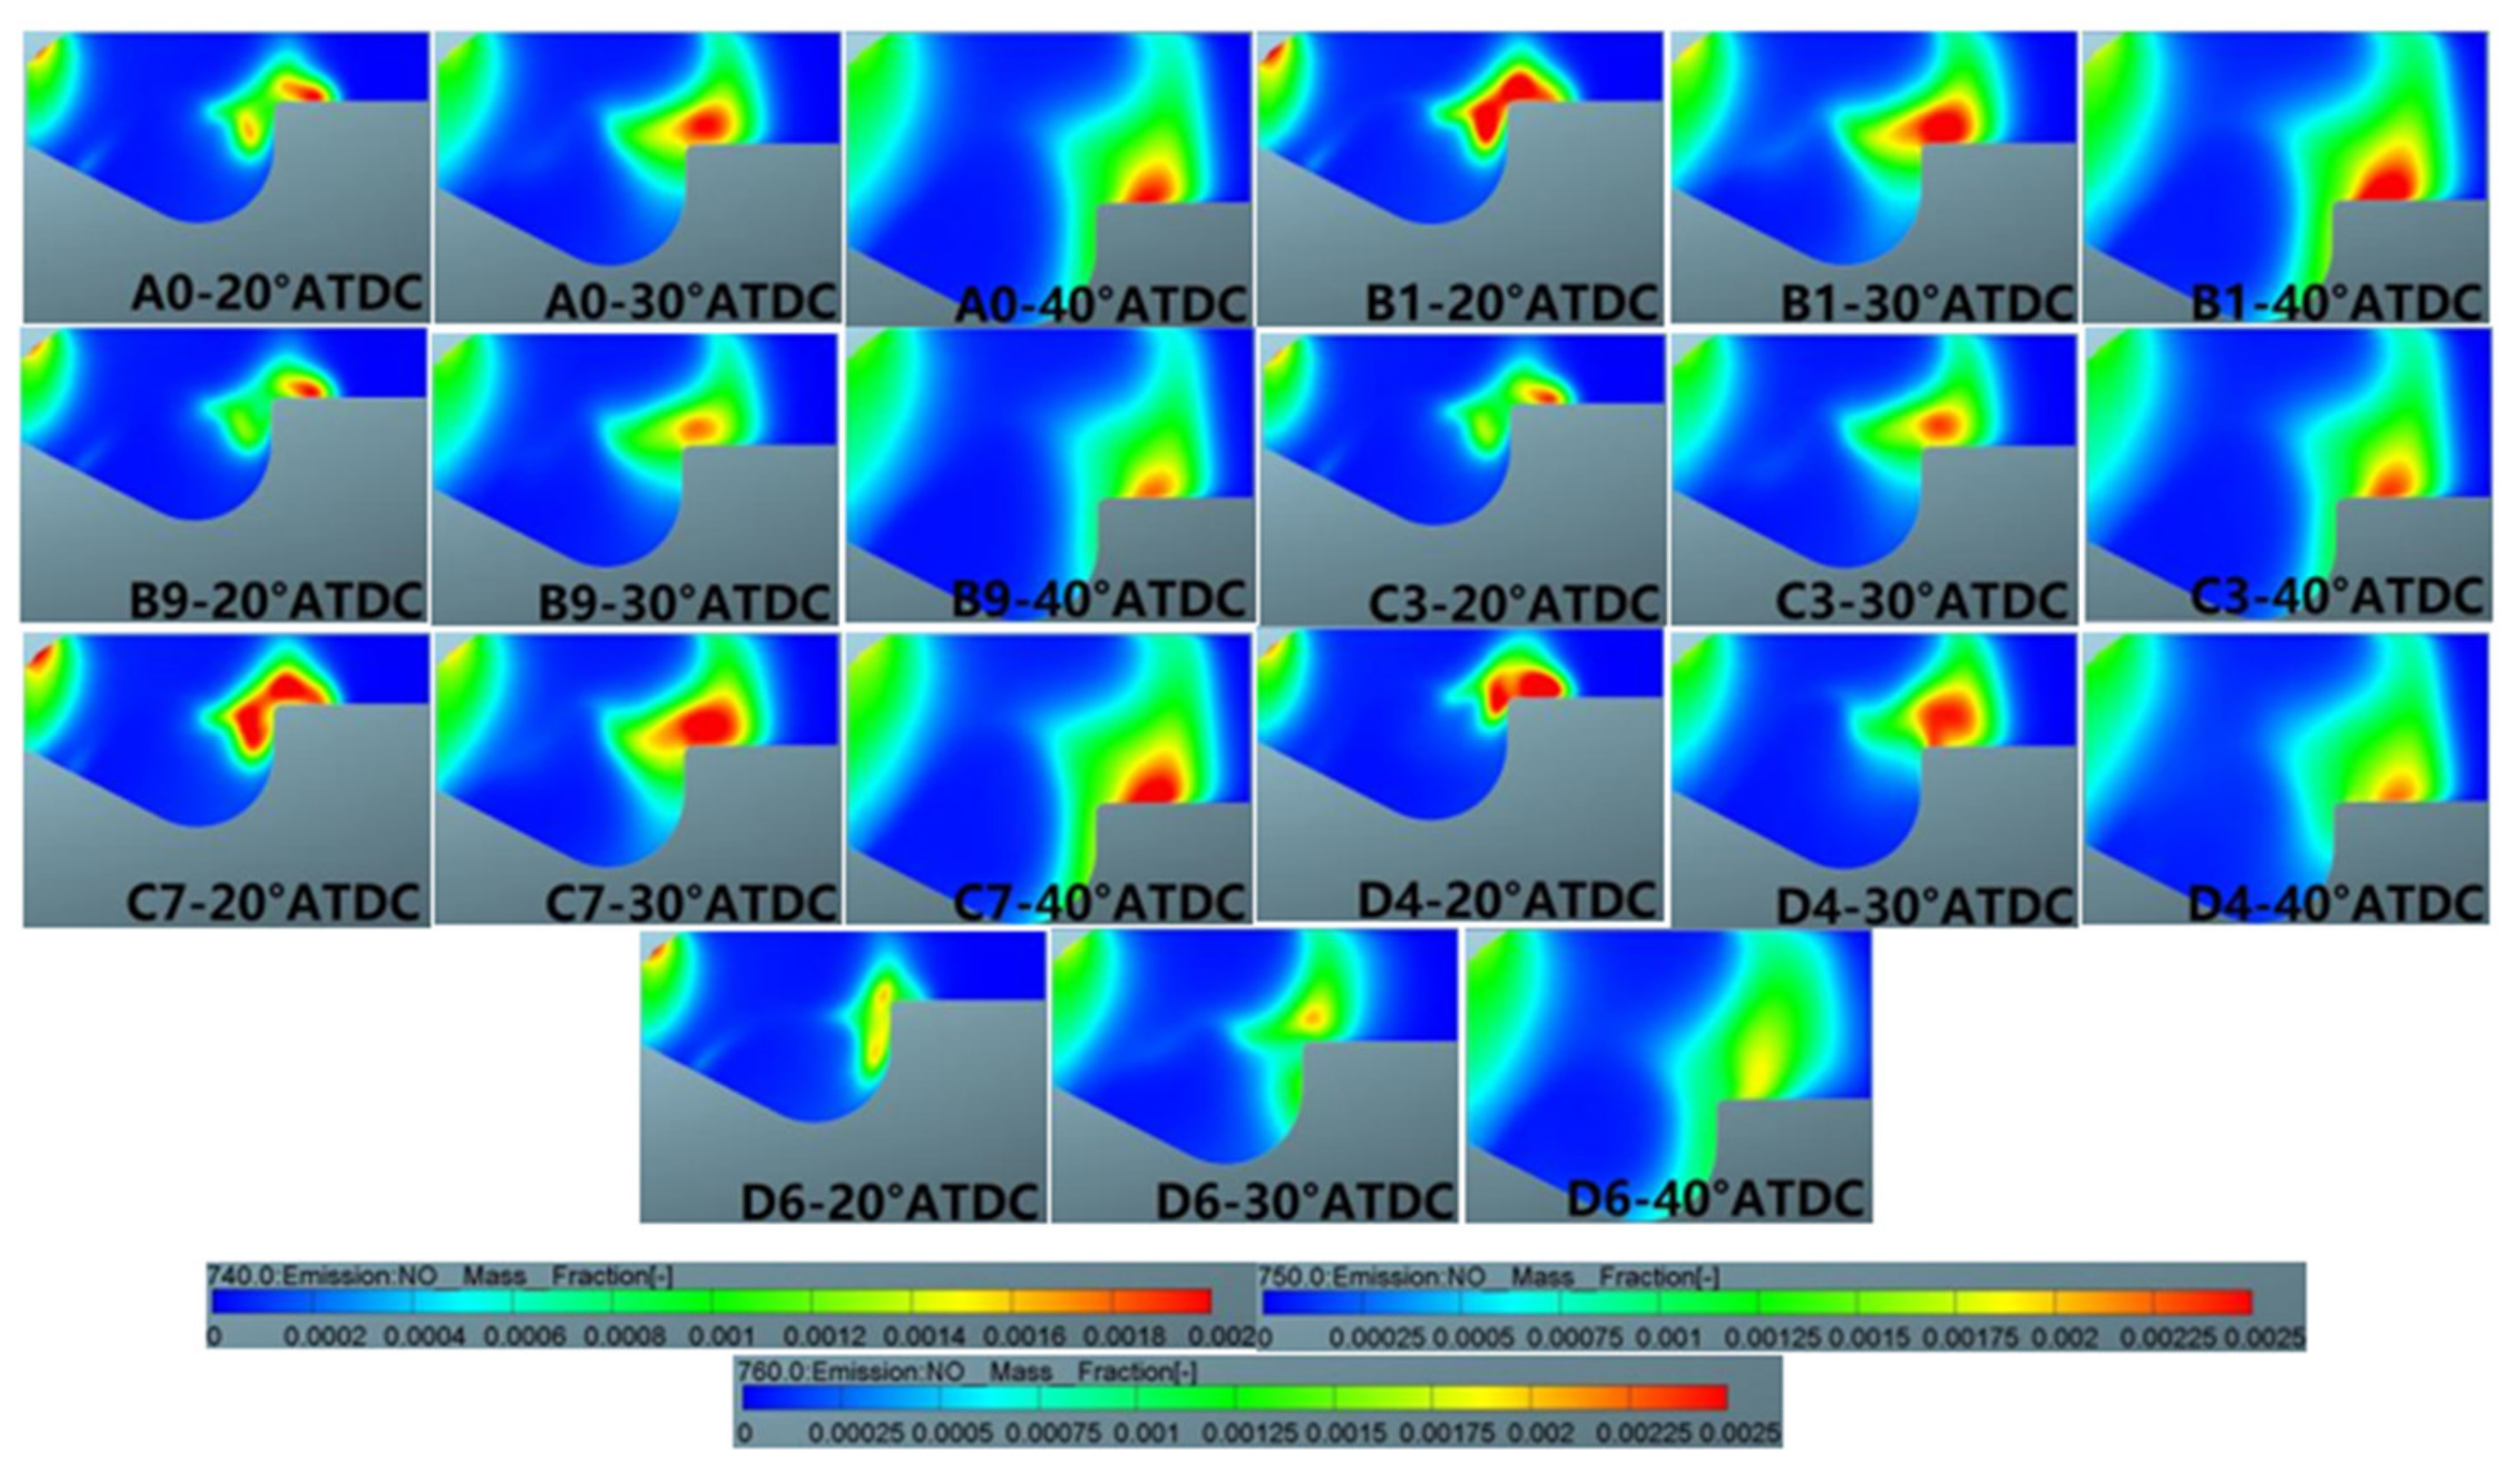
2.3.2. Distributions of Combustion Temperature and Emissions
2.4. Performance of Dynamic, Economy and Emission for Optimized Fuel Injection System
2.4.1. Performance of Dynamic, Economy and Emission
2.4.2. Performance between Injection Characteristics and Emissions
3. Conclusions
- (1)
- Moderate reduction of the discharge valve chamber volume and high-pressure tubing diameter would reduce SMD. Compared with discharge valve chamber volume, high-pressure tubing diameter shows more influence on injection mass and SMD but equal effect on injection pressure.
- (2)
- In the orthogonal design scheme, the volume of the oil outlet valve cavity and the diameter of the high-pressure tubing are adjusted simultaneously. Case C3 performs best with both NO and soot decreased by 4.79% and 2.87, respectively.
- (3)
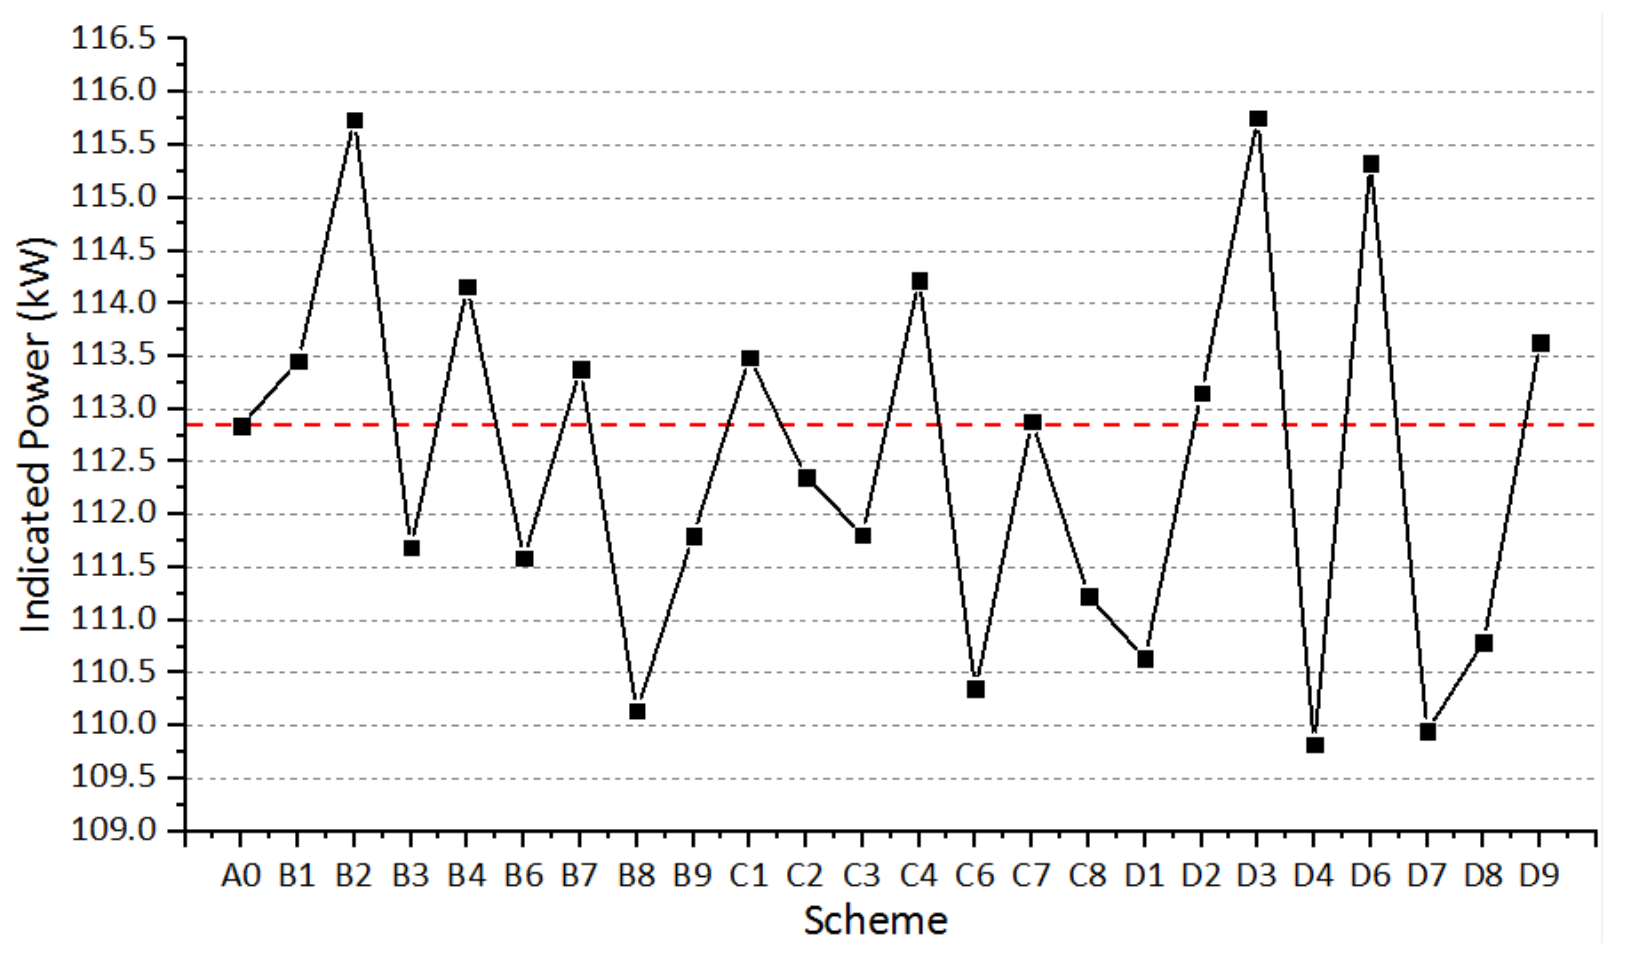
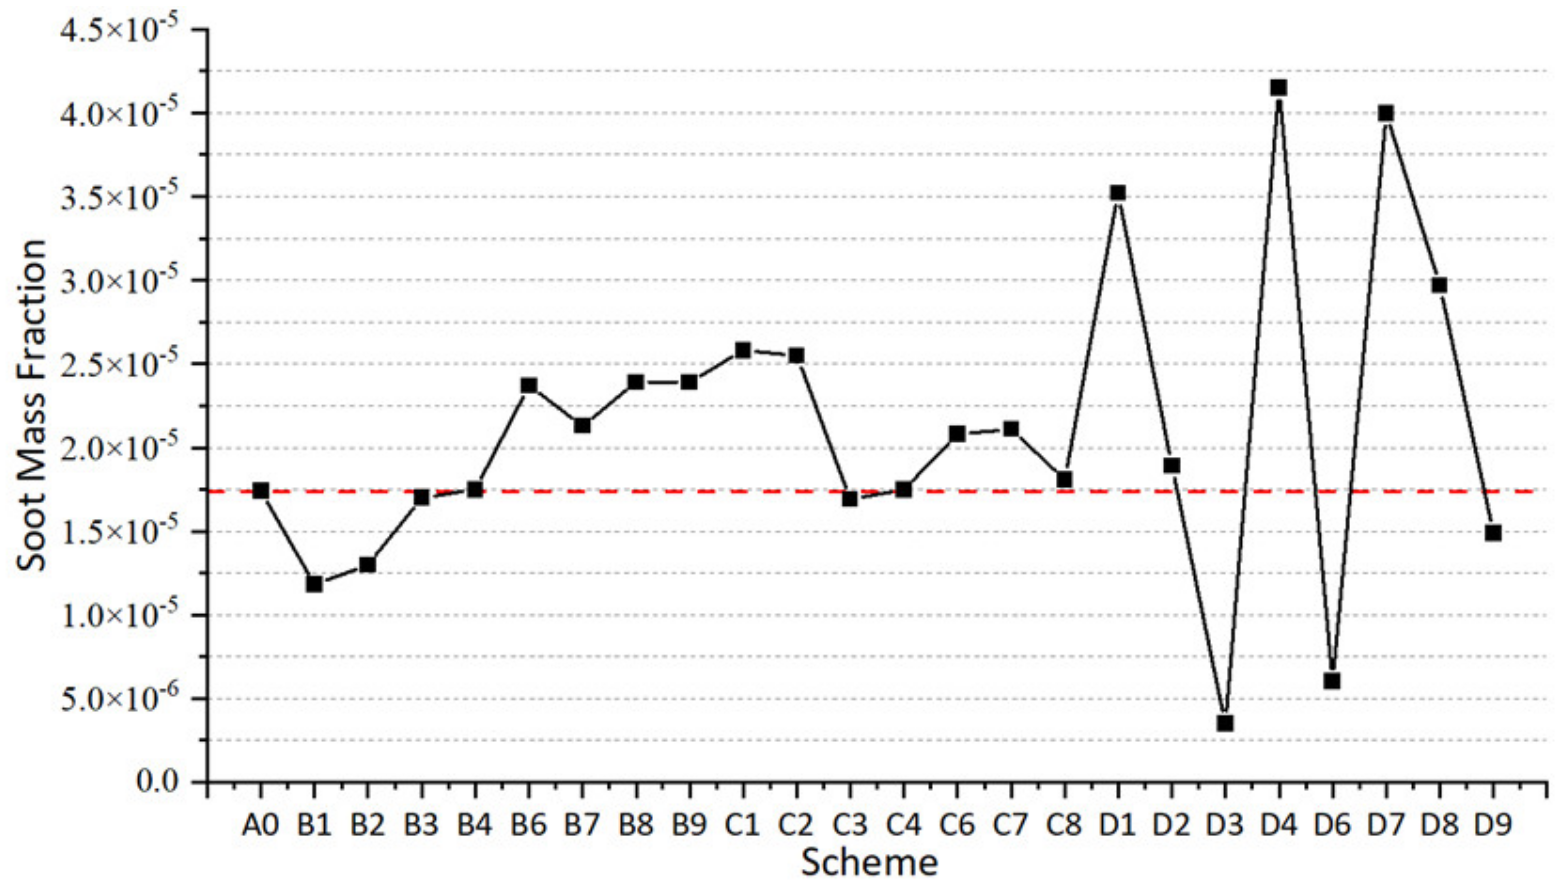
- Comprehensively comparing the performance of each fuel injection system’s structural optimization scheme, considering pollutant emission characteristics as well as economic and dynamic indicators, case D6 with spray angle enlarged to 5° showed the best performance. Compared with original conditions, there were no NO deteriorations and a large reduction of soot emission, by 65.4%, along with lower fuel consumption, by 2.18%, and more indicated power, by 2.21%.
Author Contributions
Funding
Institutional Review Board Statement
Informed Consent Statement
Data Availability Statement
Acknowledgments
Conflicts of Interest
References
- Adnan, P.; Yasar, I.; Halit, Y.; Aysun, E. Application of artificial neural network to predict specific fuel consumption and exhaust temperature for a Diesel engine. Appl. Therm. Eng. 2005, 26, 824–828. [Google Scholar]
- Godiño, J.A.V.; García, M.T.; Aguilar, F.J.J.E. Experimental analysis of late direct injection combustion mode in a compression-ignition engine fuelled with biodiesel/diesel blends. Energy 2021, 239, 624–637. [Google Scholar]
- Shi, Z.; Wu, H.; Li, H.; Zhang, L.; Li, X.; Lee, C. Effect of injection pressure and fuel mass on wall-impinging ignition and combustion characteristics of heavy-duty diesel engine at low temperatures. Fuel 2021, 299, 236–247. [Google Scholar] [CrossRef]
- Wu, T.; Yao, A.; Yao, C.; Pan, W.; Wei, H.; Chen, C.; Gao, J. Effect of diesel late-injection on combustion and emissions characteristics of diesel/methanol dual fuel engine. Fuel 2018, 233, 217–327. [Google Scholar] [CrossRef]
- Khatamnejad, H.; Khalilarya, S.; Jafarmadar, S.; Mirsalim, M. The effect of high-reactivity fuel injection parameters on combustion features and exhaust emission characteristics in a natural gas-diesel RCCI engine at part load condition. Int. J. Green Energ. 2018, 15, 874–888. [Google Scholar] [CrossRef]
- Srivastava, A.K.; Soni, S.L.; Sharma, D.; Jain, N.L. Effect of injection pressure on performance, emission, and combustion characteristics of diesel-acetylene-fuelled single cylinder stationary CI engine. Environ. Sci. Pollut. Res. 2018, 25, 7767–7775. [Google Scholar] [CrossRef]
- Stan, L.C.; Memet, F.; Buzbuchi, N. Combustion simulation for naval diesel engine. Adv. Marit. Nav. Sci. Eng. 2010, 3, 57–60. [Google Scholar]
- Najafi, G. Diesel engine combustion characteristics using nano-particles in biodiesel-diesel blends. Fuel 2018, 212, 668–678. [Google Scholar] [CrossRef]
- Dev, S.; Divekar, P.; Xie, K.; Han, X.Y.; Chen, X.; Zheng, M. A Study of Combustion Inefficiency in Diesel Low Temperature Combustion and Gasoline-Diesel RCCI Via Detailed Emission Measurement. J. Eng. Gas. Turb. Power 2015, 137, 121501. [Google Scholar] [CrossRef]
- Asuda, K.; Yamasaki, Y.; Kaneko, S.; Nakamura, Y.; Lida, N.; Hasegawa, R. Diesel combustion model for on-board application. Int. J. Engine Res. 2016, 17, 748–765. [Google Scholar] [CrossRef]
- Kapitza, L.; Imberdis, O.; Bensler, H.P.; Willand, J.; Theveni, D. An experimental analysis of the turbulent structures generated by the intake port of a DISI-engine. Exp. Fluids. 2010, 48, 265–279. [Google Scholar] [CrossRef]
- Genzale, C.L.; Reitz, R.D.; Musculus, M.P.B. Effects of Piston Bowl Geometry on Mixture Development and Late-Injection Low-Temperature Combustion in a Heavy-Duty diesel engine. SAE 2008, 1, 913–937. [Google Scholar] [CrossRef]
- Wang, G.; Yu, W.; Li, X.; Su, Y.; Yang, R.; Wu, W. Experimental and numerical study on the influence of intake swirl on fuel spray and in-cylinder combustion characteristics on large bore diesel engine. Fuel 2019, 237, 209–221. [Google Scholar] [CrossRef]
- Ilker, Y. Effect of swirl number on combustion characteristics in a natural gas diffusion flame. J. Energe. Resour. 2013, 135, 42–47. [Google Scholar]
- Wang, T.; Liu, D.; Wang, G.; Tan, B.; Peng, Z. Effects of Variable Valve Lift on In-Cylinder Air Motion. Energies 2015, 8, 13779–13781. [Google Scholar] [CrossRef]
- Kim, S.; Nouri, J.M.; Yan, Y.; Arcoumanis, C. Effects of intake swirl and coolant temperature on spray structure of a high pressure multi-hole injector in a direct-injection gasoline engine. J. Phys. 2005, 85, 45–53. [Google Scholar] [CrossRef]
- Miles, P.C.; Megerle, M.; Nagel, Z.; Liu, Y.; Reitz, R.D.; Lai, M.C.; Sick, V. The Influence of Swirl and Injection Pressure on Post-Combustion Turbulence in a HSDI Diesel Engine. In Thermo- and Fluid Dynamic Processes in Diesel Engines 2; Springer: Berlin/Heidelberg, Germany, 2004; pp. 134–137. [Google Scholar]
- Basha, S.A.; Gopal, K.R. In-cylinder fluid flow, turbulence and spray models. Renew Sust. Energ. Rev. 2009, 13, 1620–1624. [Google Scholar] [CrossRef]
- Jayashankara, B.; Ganesan, V. Effect of fuel injection timing and intake pressure on the performance of a DI diesel engine-A parametric study using CFD. Energ. Convers. Manage. 2010, 51, 1838–1844. [Google Scholar] [CrossRef]
- Maroteaux, F.; Saad, C. Diesel engine combustion modeling for hardware in the loop applications: Effects of ignition delay time model. Energy 2013, 57, 641–650. [Google Scholar] [CrossRef]
- Kook, S.; Bae, C.; Miles, P.C.; Choi, D. The effect of swirl ratio and fuel injection parameters on CO emission and fuel conversion efficiency for high-dilution, low-temperature combustion in an automotive diesel engine. SAE 2006, 80, 2261–2267. [Google Scholar]
- David, J.R.; Thathapudi, K.N.M. Studies on variable swirl intake system for DI diesel engine using computational fluid dynamics. Therm. Sci. 2008, 12, 25–32. [Google Scholar]
- Micklow, G.J.; Gong, W.D. Intake and in-cylinder flow field modelling of a four-valve diesel engine. Proc. Inat. Mech. Eng. Part D J. Automob. Eng. 2007, 221, 1426–1435. [Google Scholar]
- Wang, S.; Zhang, J.; Yao, L. Effect of Combustion Boundary Conditions and n-Butanol on Surrogate Diesel Fuel HCCI Combustion and Emission Based on Two-Stroke Diesel Engine. Atmosphere 2022, 13, 303. [Google Scholar] [CrossRef]
- Selleri, T.; Melas, A.; Ferrarese, C.; Franzetti, J.; Giechaskiel, B.; Suarez-Bertoa, R. Emissions from a Modern Euro 6d Diesel Plug-In Hybrid. Atmosphere 2022, 13, 1175. [Google Scholar] [CrossRef]
- Dembinski, H.W.R. The effects of injection pressure and swirl on in-cylinder flow pattern and combustion in a compression-Ignition engine. Int. J. Engine Res. 2014, 15, 444–459. [Google Scholar] [CrossRef]
- Wang, F.; Xie, X.; Jiang, Q.; Zhou, L. Effect of turbulence on NO formation in swirling combustion. Chinese J. Aeronaut. 2014, 27, 797–804. [Google Scholar] [CrossRef]
- Cheung, C.S.; Zhang, Z.H.; Chan, T.L.; Yao, C. Investigation on the effect of port-injected methanol on the performance and emissions of a diesel engine at different engine speeds. Energe. Fuel. 2009, 23, 5684–5694. [Google Scholar] [CrossRef]
- He, X.; Tan, Q.; Wu, Y.; Wei, C. Optimization of Marine Two-Stroke Diesel Engine Based on Air Intake Composition and Temperature Control. Atmosphere. 2022, 13, 355. [Google Scholar] [CrossRef]
- Zhu, Y.; Zhou, W.; Xia, C.; Hou, Q. Application and Development of Selective Catalytic Reduction Technology for Marine Low-Speed Diesel Engine: Trade-Off among High Sulfur Fuel, High Thermal Efficiency, and Low Pollution Emission. Atmosphere 2022, 13, 731. [Google Scholar] [CrossRef]


| Performance Index | Simulation Results | Experimental Results | Relative Error |
|---|---|---|---|
| Max in-cylinder pressure | 17.46 MPa | 17.26 MPa | 1.16% |
| Crank angle @ max in-cylinder pressure | 6° ATDC | 11° ATDC | - |
| Max in-cylinder temperature | 1803.48 K | 1850.53 K | 2.54% |
| Crank angle @ max in-cylinder temperature | 16° ATDC | 20° ATDC | - |
| Max in-cylinder temperature before the exhaust valve is opened | 1156.79 K | 1201.86 K | 3.75% |
| Performance Index | Pump Pressure | Injector Pressure | Injection Mass |
|---|---|---|---|
| Calculated value | 98.07 MPa | 109.82 MPa | 0.44 g |
| Test value | 93.31 MPa | 104.11 MPa | 0.418 g |
| Relative error | 5.1% | 5.48% | 5.26% |
| Name | Data Input | Parameters | Name | Data Input | Parameters |
|---|---|---|---|---|---|
| Cam | Base circle diameter | 40 mm | Return valve | Return valve lift | 4.1 mm |
| Roller diameter | 28 mm | Ball valve diameter | 3.5 mm | ||
| Young’s modulus | 210 GPa | High-pressure pipe | Pipeline inner diameter | 2.4 mm | |
| Plunger | Moving parts weight | 423 g | Pipe length | 700 mm | |
| Plunger diameter | 15 mm | Injector | Needle valve lift | 0.4 mm | |
| Cam chamber pressure | 0.1 MPa | Number of nozzles | 5 | ||
| Full stroke | 13 mm | Nozzle diameter | 0.48 mm | ||
| Plunger spring preload | 300 N | Nozzle length | 1.6 mm | ||
| Delivery valve | Delivery valve lift | 5.8 mm | Moving parts weight | 24.7 g | |
| Valve seat diameter | 8.5 mm | Nozzle spring preload | 1000 N |
| Scheme Code | B1 | B2 | B3 | B4 | B5 Original Scheme |
|---|---|---|---|---|---|
| Nozzle diameter (mm) | 0.45 | 0.46 | 0.46 | 0.47 | 0.48 |
| Nozzle valve opening force (N) | 800 | 800 | 900 | 900 | 1000 |
| Injection starting time (° CA) | 698.1 | 698.1 | 698.7 | 698.7 | 700 |
| Injection end time (° CA) | 728.1 | 728.1 | 727.5 | 727.5 | 726.2 |
| Injection mass (g) | 0.438 | 0.449 | 0.434 | 0.444 | 0.440 |
| Scheme code | B6 | B7 | B8 | B9 | |
| Nozzle diameter (mm) | 0.49 | 0.50 | 0.50 | 0.51 | |
| Nozzle valve opening force (N) | 1100 | 1100 | 1200 | 1200 | |
| Injection starting time (° CA) | 700 | 700 | 700.6 | 700.6 | |
| Injection end time (° CA) | 726.2 | 726.2 | 725.6 | 725.6 | |
| Injection mass (g) | 0.438 | 0.447 | 0.436 | 0.445 |
| Scheme Code | C1 | C2 | C3 | C4 |
|---|---|---|---|---|
| High-pressure pipe diameter (mm) | 2.2 | 2.3 | 2.3 | 2.4 |
| Initial volume of oil outlet valve chamber (mm3) | 2700 | 2400 | 2700 | 1600 |
| Injection starting time (° CA) | 700 | 700 | 700 | 699.4 |
| Injection end time (° CA) | 727.5 | 726.8 | 727.5 | 726.2 |
| Injection mass (g) | 0.447 | 0.443 | 0.437 | 0.447 |
| Scheme code | C5 (Origin) | C6 | C7 | C8 |
| High-pressure pipe diameter (mm) | 2.4 | 2.4 | 2.5 | 2.5 |
| Initial volume of oil outlet valve chamber (mm3) | 1950 | 2400 | 1300 | 1600 |
| Injection starting time (° CA) | 700 | 700 | 699.4 | 699.4 |
| Injection end time (° CA) | 726 | 726.8 | 726.2 | 726.2 |
| Injection mass (g) | 0.440 | 0.432 | 0.440 | 0.435 |
| Scheme Code | Start of Injection Angle (° CA) | Injection Time (° CA) | Injection Mass (g) | Notes |
|---|---|---|---|---|
| A1 | 702 | 26 | 0.44 | |
| A2 | 700 | 26 | 0.44 | Original scheme |
| A3 | 698 | 26 | 0.44 | |
| A4 | 696 | 26 | 0.44 | |
| A5 | 694 | 26 | 0.44 | |
| A6 | 692 | 26 | 0.44 |
Publisher’s Note: MDPI stays neutral with regard to jurisdictional claims in published maps and institutional affiliations. |
© 2022 by the authors. Licensee MDPI, Basel, Switzerland. This article is an open access article distributed under the terms and conditions of the Creative Commons Attribution (CC BY) license (https://creativecommons.org/licenses/by/4.0/).
Share and Cite
Wang, G.; Yu, W.; Yu, Z.; Li, X. Study on Characteristics Optimization of Combustion and Fuel Injection of Marine Diesel Engine. Atmosphere 2022, 13, 1301. https://doi.org/10.3390/atmos13081301
Wang G, Yu W, Yu Z, Li X. Study on Characteristics Optimization of Combustion and Fuel Injection of Marine Diesel Engine. Atmosphere. 2022; 13(8):1301. https://doi.org/10.3390/atmos13081301
Chicago/Turabian StyleWang, Guixin, Wenbin Yu, Zining Yu, and Xiaobo Li. 2022. "Study on Characteristics Optimization of Combustion and Fuel Injection of Marine Diesel Engine" Atmosphere 13, no. 8: 1301. https://doi.org/10.3390/atmos13081301
APA StyleWang, G., Yu, W., Yu, Z., & Li, X. (2022). Study on Characteristics Optimization of Combustion and Fuel Injection of Marine Diesel Engine. Atmosphere, 13(8), 1301. https://doi.org/10.3390/atmos13081301