Abstract
The accurate determination of the annual lightning flash number to a wind turbine is essential for designing proper lightning protection measures. However, the method to assess the lightning risk of wind turbines recommended by the IEC is not associated with the actual lightning attachment process. Additionally, there is little research on positive cloud-to-ground (+CG) lightning. In this study, a lightning risk assessment method correlated with wind turbines on the basis of an improved stochastic lightning model is proposed. Based on the model, the influence of the lightning current amplitude, wind turbine heights and blade rotations on lightning strike risk are quantitatively analyzed. Moreover, the development and distribution characteristics of negative cloud-to-ground (−CG) lightning and +CG lightning are discussed. Finally, a more accurate calculation method of lightning strike risk is proposed considering the polarity effect. The results show that the effect of blade rotations on lightning risk cannot be ignored when the lightning current is large or when the wind turbine is tall. The −CG lightning has more bifurcation, but the dispersity of its development path and the lightning strike point are both small. The +CG lightning has scattered lightning strike points, and the development paths are tortuous, and. According to the verification calculation, the results calculated in this paper are in better agreement with the observation data than the results calculated by the IEC (International Electrotechnical Commission) recommended method.
1. Introduction
Wind energy accounts for a large part of clean energy and has become an indispensable way to solve the global climate change problem [1]. In past studies, lightning strikes have caused serious damage to buildings. A lightning strike can cause partial damage or complete failure of structures. The lightning current that passes through the structure may cause heating of the roof system rapidly, and even fire [2]. Natural hazards such as lightning can cause major accidents in chemical and process installations [3]. And wind turbines are usually constructed on the top or the ridge of hills in hilly or offshore regions, and due to its geographical location effects, lightning strikes have also become the main causes of wind turbine damages. For a wind turbine, the major parts that are exposed to the environment are the tower, the nacelle and the rotor. And the composite rotor blade is the most susceptible to direct lightning strikes, as it is higher off the ground than the other components. Note that blades usually are made of a strong and stiff shell as the skin and a stiffener web or lightweight core material. This structure reduces weight while preserving strength, and a rotor blade failure can have a significant impact on turbine downtime and safety [4,5]. However, the vigorous development of the wind power industry and the expansion of its capacity and scale are accompanied by the higher risk of wind turbines being struck by lightning [6]. The huge economic losses and severe social impact caused by lightning strikes seriously affect the safety and reliability of wind farms. Therefore, to avoid a blade failure, there is a hot need for research on lightning exposure assessment of wind turbines. As key parameters, it is of great significance to properly analyze the lightning strike distance, equivalent mine-collecting area and the number of lightning strikes of wind turbines per year.
At present, many scholars such as Love, Eriksson et al. [7,8] have conducted lightning protection research on structures based on the improved classical electro-geometric model (EGM), which has been widely used. However, due to the lack of universality in EGM geometric model, which does not consider the influence of object height and upward connection wire (UCL), the calculated results of EGM are quite different from the actual results. Therefore, it is doubtful whether the traditional EGM method is accurate in evaluating the lightning performance of wind turbine blades. Based on the self-consistent Leader Inception and propagation Model (SILM), Cooray et al. [9], derived the striking distance equations of buildings with different heights under the condition of connecting the Leader. However, the randomness of lightning adhesion phenomenon is often ignored by the existing lightning interception analysis and shielding failure estimation, and the inherent randomness of propagation plays a significant role in the background potential configuration and the final lightning attachment process [10]. In addition, the lightning research cannot neglect the competitive effect of multiple upward leaders (MULs) and stochastic nature [11,12].
The annual number of downward lightning flashes attaching to a wind turbine can be estimated by the annual average CG flash density. While the annual lightning flash number corresponds to upward, lightning is difficult to assess in advance calculation. It can be only acquired by the observation data [13]. At present, the empirical formula recommended by IEC61400-24 [14] is widely used to calculate the annual lightning flash number to wind turbines. Since the method assumes a proportional relationship between the equivalent collection area and the three times of the height associated with a wind turbine, which does not consider the significant effects of wind turbines geometric shape and polarity effect. Therefore, the accuracy of the method recommended by IEC needs to be further studied and verified.
Lightning in the atmosphere is an intense, transient, long-distance electrical discharge phenomenon. It is necessary to have a thorough understanding of the physical process and mechanism of lightning in order to prevent lightning disasters scientifically [15]. And the influence of large wind turbines on the development of lightning in the atmosphere cannot be ignored. Currently, numerical simulation has progressively captured scholars’ attention as a substantial means to explore the characteristics of lightning strike in that it is economical and efficient, which can control the parameters of the study and conduct a host of simulation tests. And there are two main types of lightning leader models, the physical model and the stochastic model. The physical factors, such as an electric charge in the corona region, is considered in the physical models [9]. But these properties are difficult to obtain, and the results derived from the physical model are quite different from the real lightning channel because they do not consider the actual development shape of the leader. In contrast, the stochastic model has fewer factors to be considered and is easier to implement. Moreover, it is more in agreement with the leader branching and tortuous characteristics often observed with lightning. And the stochastic model was used for analyzing the lightning attachment process in [15,16,17]. However, the above research does not consider the polarity effect and the lightning current amplitude. So, there are many regrets in the model.
In this paper, an improved Stochastic Lightning Model (SLM) is proposed to provide the guidance to the lightning protection for the wind turbine, which focuses on the interaction of downward and multiple upward leaders, the stochastic nature of the lightning attachment phenomenon and the lightning discharge branched and tortuous behavior. Based on the model, the relationship among the striking distance, the wind turbine height and the lightning current amplitude is quantitatively characterized. Then, the effect of the wind turbine geometry shape on lightning strike risk is analyzed. Moreover, the development path of both +CG lightning and −CG lightning and the distribution characteristics of lightning strikes points are discussed. The conclusions can provide a reference for lightning protection design under different polarity lightning. Finally, considering the polarity effect, the annual lightning flash number of wind turbines is accurately evaluated, and the calculated results are in good agreement with the actual observation data.
2. Simulation Model
Based on the research of Jiang R [15] and Tan [18], this work further adjusts the simulation area and discharge parameters, so as to realize the simulation of the −CG lightning and +CG lightning. Meanwhile, comparing with the single leader model, the initiation of MULs and the electric field algorithm are optimized in the model of multiple leaders used in this study.
2.1. Two-Dimensional Stochastic Leader Model
In this study, to achieve the initiation of MULs, as long as the grid point meets the trigger threshold, it can incept upward leader (UL). Thereby, during the descent of the downward leader (DL), it is imperative to update the spatial potential distribution and search again for the initial point of the UL in the simulation area at each new step of the DL. Diverse MULs can be initiated at different development steps of DL, or simultaneously be initiated at a certain step. When multiple grid points reach the criterion of initiating UL at the same time, the grid point of maximum electric field is selected to start the UL first.
Given the optical observations, it has been found that negative leader can produce multitudes of branches, but positive leader rarely bifurcate [19]. During the propagation of leaders, each developed grid point of negative leader can extend to the surrounding undeveloped points, while for the positive leader, only the grid points on the head can extend to the surrounding undeveloped points, as illustrated in Figure 1. In addition, under the condition of multiple leaders, the upward leader and downward leader develop cyclically and contemporaneously. At the end of each cycle, the electric field value between the head point of the downward leader and all channel points of the upward leader is calculated to determine whether the final jump will occur.
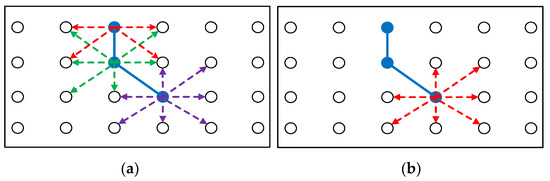
Figure 1.
Schematic diagram of the development possibilities (The solid dots are the developed steps, the hollow dots are the undeveloped steps, and the arrows are the possible development paths): (a) The negative leader; (b)The positive leader.
The next jump of the leader after each step is almost chosen randomly in the space among all possible new extensions for which electric field values reach the given thresholds beneath the leader tip. Using Equation (1), each possible breakdown probability can be calculated. All potentially new discharge points can be chosen, but the probability is different. The certainty of the leader development is reflected in that the greater the field intensity of the potential breakdown points exceeds the threshold, the greater the probability that it will be broken down by the next step to form the leader channel. The randomness of leader development is reflected in that the point with the highest breakdown probability may not necessarily develop into a breakdown point, but the probability of all the ac-cumulated potential development points will be normalized into a probability interval [0, 1] according to the calculated breakdown probability. The next breakdown point of the leader will be chosen by the random number generated by the random function. The probability of determining the subsequent channel point is given as follows [20]:
where is the leader tip point, is the potentially new discharge points near , is the probability of potential point to be selected as the next jump, is the total number of potential points, the electric field intensity in the space from to , (kV/m) is the critical electric field required for discharge propagation, is the developing probability index whose value is 1 in the subsequent simulation.
The electric field spatial distribution around the lightning channel will influence the charges in lightning channel. After each new extension, the electric potentials at grid points not on the channel must be updated by solving Poisson’s equation, which is shown as the Equation (2). The electric potential at every point of the two-dimensional domain is computed by iteratively solving the Laplace’s equation adopting the finite difference method (FDM) by combining with the successive overrelaxation technique (SOR) utilizing MATLAB. Then, the iterative formula of the potential at any discrete point in the model area is shown in Equation (3):
where is the electric potential; is the net charge density at points not on the channel; is the dielectric constant of air; is the overrelaxation parameter, is 1.975 in this study.
2.2. Main Parameters
In this paper, to minimize the effects of air boundaries, a 5000 × 1500 m two-dimensional simulation domain near-surface ground is constructed. Moreover, the environmental electric field is evenly distributed, the downward leader is the negative leader, and the upward leader is the positive leader. Then the spatial background electric field intensity increases from bottom to top within the range of 1500 m above the ground. Besides, in the simulation of downward negative lightning, Given the corona produced by the tips of wind turbines, the electric field intensity of the lower boundary is −5 kV/m, and the upper boundary is −90 kV/m [15]. In the simulation of downward positive lightning, the background field intensity has the same value but opposite polarity.
Assuming that the ground, the downward leader (DL) and wind turbines are set at zero potential (Dirichlet boundary condition). The potential of the ground and the wind turbines are set at 0 V. The air boundary of the simulation domain satisfies Neumann boundary conditions (). Meanwhile, the leader channel is assumed to be completely ionized and there is an initial downward leader which has a length of 40 m. The initial position of downward leader is fixed at the uppermost of the simulation area. The electric potential at the downward leader is set with a certain lightning peak current.
As this work only simulates the near-ground part of downward leader, so the initiation of downward leader is not involved. In general, the initiation threshold of leader is larger than its propagation threshold [21]. This model set the propagation threshold of the downward leader and upward leader as 220 kV/m, which adopts trigger threshold for upward positive leader (UPL) of 400 kV/m. The upward negative leader (UNL) is more difficult to start and the trigger threshold for UNL is set as 750 kV/m. The critical breakdown electric field between the UL and DL is thought of as 500 kV/m [22,23] In according with previous studies, the speed ratio of upward leader and downward leader is confirmed as 1:4 according to the observation [24]. In practice, the choice of discharge parameters is somewhat subjective, in view of the uncertainty of the charge distribution in the channel and space and other factors in the actual discharge process. Whereas the values above are reasonable in accordance with the previous research.
The selected key model parameters are concluded in Table 1 and Figure 2 is the flow diagram of the model for multiple leader development.

Table 1.
Model parameters.
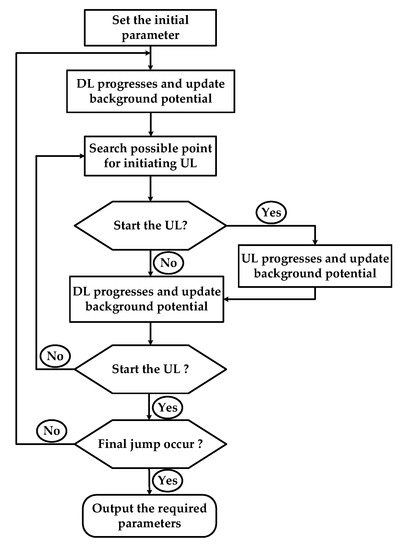
Figure 2.
Flow diagram of the model for multiple leaders’ development.
2.3. Designs of Simulation
Figure 3 is a schematic diagram of the simulation area. Previous research results indicated that the blade is relatively still during the attachment process [25]. To simplify the description below, the blade in the first quadrant is named as No. 1 blade, the other two as No. 2 and No. 3 blade in the clockwise direction, respectively. The wind turbines are conducted under three basic states according to the rotation angle of the No. 1 blade, which are 0°, 30° and 60°, as shown in Figure 3. The blade angle θ is the angle between the No.1 blade and the vertical direction with the clockwise direction being positive. The wind turbine is fixed on the site of the abscissa of 0 with diverse heights, and rectangles in various colors represent different initial positions of downward leader. The abscissa of the downward leader initial position is regarded as the lateral distance which ranges from −1500 m to 1500 m (The negative value indicates that the initial position of the downward leader is on the left of the wind turbine, and the positive value indicates that it is on the right, also with an interval of 100 m).
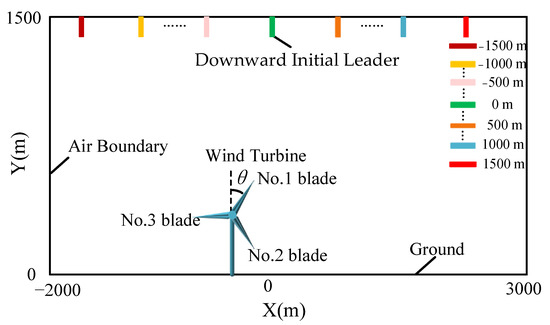
Figure 3.
Spatial schematic diagram of the simulations.
The actual process of lightning striking a wind turbine is not the process of lightning directly attachment to the wind turbine, but the connection of UL and DL initiated from the wind turbine. That is, the accuracy of evaluating the lightning striking performance with the traditional concept of striking distance is questionable. In this research, based on the SLM, the distance between the point of the wind turbine, where a connecting leader is initiated, and the heads of DL when the final jump condition is established between the connecting leader and the DL, is defined as striking distance (as shown in Figure 4). The striking distance changes with different blade angles and tower heights, and it not only can clarify the physical meaning of the striking distance but can also adapt to the complex mechanical structure and rotating characteristics of turbine blades. According to the Monte Carlo idea, the striking distance should be derived from a large number of simulation tests. Therefore, the cases of lightning flashes with various lightning current striking to the different heights of wind turbines are simulated. In diverse cases, 400 simulation tests are performed for each lateral distance (from −1500 m to 1500 m). There is a total of 8000 simulation results for each case. The value of the striking distance for each case is the arithmetic mean of the simulation results when the lightning strikes to the wind turbine blade.
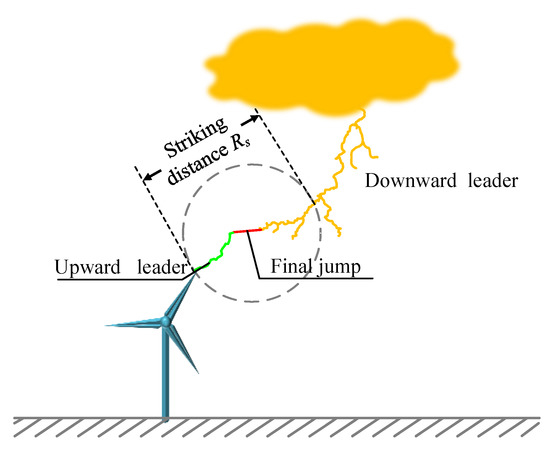
Figure 4.
Schematic diagram of the striking distance.
3. Modified Calculation Methods of the Annual Lightning Flash Number Considering Polarity Effect
3.1. Characteristics of the Lightning Striking Distance
The simulation results of a typical wind turbine of 150 m are analyzed, where the height of the tower and length of the blade are, respectively, 95 m and 55 m. The lightning exposure arcs of the blade tip under the different lightning current with the rotor orientations from 0° to 60° are illustrated in Figure 5a–c. As shown in Figure 5a,b, the striking distances of No.1 blade and No.3 blade are roughly the same at blade angles of 0° and 60°, which are in symmetrical states. Then, it can be seen from Figure 5c that the striking distance of No. 3 blade is much smaller than that of No. 1 blade at a blade angle of 30° due to shielding effect among the blades. Additionally, for the reason that the effective height of the wind turbine decreases as the blade angle increases, and the distortion effect on the background electric field will be weakened which leads to a smaller electric field value, the DNL needs to be closer to the wind turbine to trigger the UPL. Thus, when , the striking distance of No. 1 blade is the largest, followed by and .
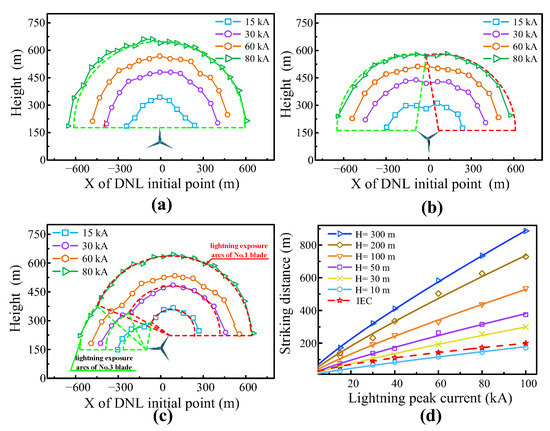
Figure 5.
Simulation Results: (a) Lightning exposure arc of the wind turbine blade when , (b) , (c) , (d) The relationship among the striking distance, the wind turbine height and the lightning current amplitude.
Then, when the wind turbine is higher than 100 m, it will experience a higher electric field enhancement during a thunderstorm that may cause longer upward connecting leaders (UCL). Its length increases with the rising height of the wind turbine, and the actual striking distance also enlarges as the height of the wind turbine is increased. However, the striking distance assumed in IEC 62305-1 [26] only considers the lightning current amplitude as an influencing factor. Therefore, in Figure 5d, when the wind turbine is relatively small, the calculation results of the striking distance from IEC equation is close to the striking distance obtained in this study. But when the wind turbine is high, there will be a significant difference between them, and the difference increases with the rise of the wind turbine height.
The equation of the striking distance defined in IEC 62305-1 has been widely used in lightning protection of buildings and lightning rods. When the blade angle of the wind turbine is 0°, the vertical upward state of No. 1 blade is the closest to the lightning rod. Thus, in this section, the striking distance of No. 1 blade when can be analyzed according to the IEC equation. As shown in Figure 5d, the relationship among the striking distance (), wind turbine height () and lightning current amplitude () obtained in this paper can be fitted as follows:
where is the effective height of the wind turbine when , the coefficient of determination of Equation (5) is 0.994 (.
Saba et al. [27] observed that a 52 m high lightning rod with a of 21 corresponds to a striking distance of 120 m. It is noted that the obtained by the local lightning location system has an error of 10. The calculated striking distances by means of this paper are 102 m and 143 m of 21and 31 respectively, which are in good agreement with the observed results. However, the calculation results obtained by the equation defined in IEC 62305-1 would vary from a minimum of 72 m to a maximum of 94 m for this event. There is a certain error between the IEC equation of the striking distance and the observed data. So, it is inappropriate to apply it in the complex rotating structure of wind turbines. The new Equation (4) for striking distance derived from this paper is in good agreement with actual situation compared with the IEC equation, which could provide a more physically realistic basis for lightning protection analysis.
3.2. Striking Distance to the Ground in the Presence of Wind Turbines
Given that the UPL initiated from the wind turbine will distort the electric field on the ground, and it further affects the lightning striking distance to the ground . The traditional equation of the is not applicable to the lightning protection calculation of the wind turbine. Therefore, it is necessary to discuss the in the presence of wind turbines.
Under the same lightning current amplitude, the lateral distance (from −1500 m to 1500 m) is changed employing the model presented in this paper, and then each lateral distance is simulated 400 times. At a certain lateral distance, there are about 50% of the simulation results that the final attachment is taken place between the DNL and the wind turbine. The lateral distance can be regarded as the point, where the probabilities of the lightning discharge to the ground and to the wind turbine are equal under the given case. After that, the arithmetic mean value of the lightning striking distance to the ground at this lateral distance is calculated, and the arithmetic mean value is under the given lightning current amplitude and the given wind turbine.
In the EGM, the striking distance coefficient (the ratio of the lightning striking distance to the ground and striking distance to the conductor) is proposed to describe the difference of striking electric intensity between lightning leader to phase conductor and the ground. The ratio of striking distance to the ground and striking distance to the wind turbine blade derived from this paper can correspond to , namely .
From the data in Table 2, it can be seen that and increase with the rising lightning current, but it basically has no effect on ; The , and will gradually decrease with the increase in , which means that as is risen, the difference of striking electric intensity between the lightning leader to the ground and the wind turbine will progressively increase. The striking distance coefficient of transmission lines calculated by the given equation in the IEEE (Institute of Electrical and Electronic Engineers) Std 1243-1997 [28] is 0.55 when the height is greater than 40 m, which is larger than the results derived from this paper. Compared with the transmission lines, the wind turbine has a greater impact on the striking electric intensity for the ground. And referring to the previous research results [29], the equation of the from this paper are fitted:
where is the lightning striking distance to the ground, is the lightning current amplitude.
Table 2.
Lightning striking distance to the ground and the striking distance coefficients.
3.3. The Calculation Method of the Annual Lightning Flash Number under the −CG Lightning
3.3.1. The Structural Model of a Wind Turbine
As shown in Figure 6, the three blades of the wind turbine are constantly rotating during its operation, and the effective height and width of the wind turbine changes as it rotates in the wind. So, the widthand the height for the first width variation cycle between and can be expressed as:
where is the length of the wind turbine blade and is the angle between No.1 blade and the Y-axis, is the height of the wind turbine hub.
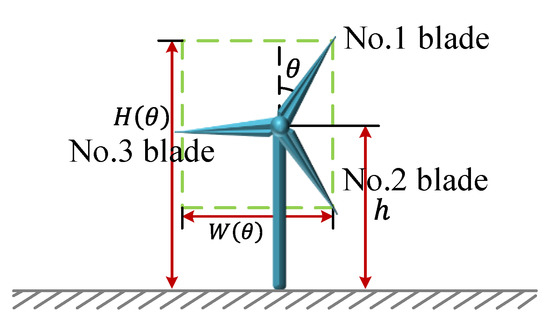
Figure 6.
The structural model of a wind turbine.
3.3.2. The Calculation Method
The calculation equation of the attractive radius by the EGM can be expressed as:
where is the striking distance of different wind turbine blades calculated in Section 3.1, is the striking distance to the ground calculated in Section 3.2.
Substituting (5) in (8) yields:
where is the boundary current and is given by:
Then, the equivalent lightning collection area demonstrates that the number of lightning strikes in a certain area is the same as the number of lightning strikes intercepted by objects. As represented in Figure 7a, the equivalent collection area of the wind turbine with symmetrical wind turbine blades can be expressed as:
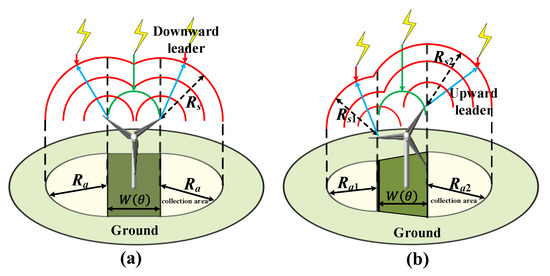
Figure 7.
The lightning collection area of a wind turbine: (a) symmetrical state, (b) asymmetrical state.
As illustrated in Figure 7b, in the case of asymmetry, the collection area is:
where and are the attractive radius obtained from the striking distance of No. 1 blade and No. 3 blade, respectively.
Therefore, the annual flash number of −CG lightning strikes to a wind turbine, , can be expressed as:
where, represents the ground flash density at the location of a wind turbine, is the lightning collection area of a wind turbine under the and the . In this study, the average value of the collection area under the three conditions of blade angles of 0°, 30° and 60° is chosen as the collection area of a wind turbine for a given lightning current (). is the probability density function of , and observe that the blade rotates at a uniform speed and may assume any value between 0 and 2 with equal probability when a lightning strike occurs, the angle probability density function is given by:
where is the probability density function of . According to IEC 62305-1 [26], the probability density of the stroke current can be expressed as a lognormal distribution function of mean value and standard deviation :
where is 33.3 and is 0.263 in terms of IEC 62305 standard. So, the equivalent collection area of a given wind turbine is:
Substituting (14), (15) and (16) in (13) simplifies:
3.4. The Calculation Method of the Annual Lightning Flash Number under the +CG Lightning
Due to the characteristics of the UNL, the striking distance of +CG lightning cannot be collected, and the mentioned calculation method of the annual lightning flash number is not applicable. The lightning strike probabilities (The number of lightning strikes to the wind turbine versus the number of simulations) of wind turbines at different heights when the initial point of DPL ranges from 0 m to 1500 m are calculated in order to analyze the comprehensive cases of lightning strikes to the wind turbine. As the DPL initial point is 1.5 km away, wind turbines of all heights will not be struck. Five curves of lightning strike probability with the location of the DPL initial point are fitted, as shown in Figure 8.

Figure 8.
The +CG lightning strikes probability of wind turbines at five heights with the lateral distance of the DPL initial point.
When the DPL initiates directly above the wind turbine, the strike probability for 100-300 m tall wind turbine is 25%, 32.8%, 41%, 48.3% and 56.4%, respectively. As the horizontal distance between the DPL and wind turbines increases, the lightning strike probability decreases approximately linearly, and the spacing of the curve becomes smaller. To analyze the annual lightning flash number to the wind turbine of +CG lightning, we integrate the lightning strike probability within a radius of 1.5 km around the wind turbine adopting Formula (18) based on the fitted results with the stochastic model, the average lightning density of the +CG lightning is assumed to 1 km2. Formula (18) is as follows:
where (km) is the distance between the DPL initial position and the wind turbine, is the lightning strike probability for the wind turbine when the offset distance is , and is the annual lightning flash number to the wind turbine of +CG lightning.
4. Results and Analyses
4.1. Researches on the Characteristics of the Lightning Attachment Process
The occurrence frequency of +CG lightning is much less than that of −CG lightning and the probability of wind turbines struck by +CG lightning is also low, so it is difficult to accumulate much observation data. In order to investigate the characteristics of +CG lightning, a two-dimension SLM of +CG lightning is preliminary established based on the SLM of −CG lightning in this study. The development and attachment process of the DPL and UNL is simulated with the stochastic model. The simulation methods are detailed in Section 2.
Figure 9a,b are the simulation results of −CG lightning and +CG lightning when the initial position of the downward leader is 600 m. Seen in the Figure 9b, the length of UNL striking to the ground is very short. When striking the blade of wind turbines, the UNL is slightly longer, sometimes creating a branch. As the UNL is difficult to initial and develop, in most cases, there is no other upward unconnected leaders.
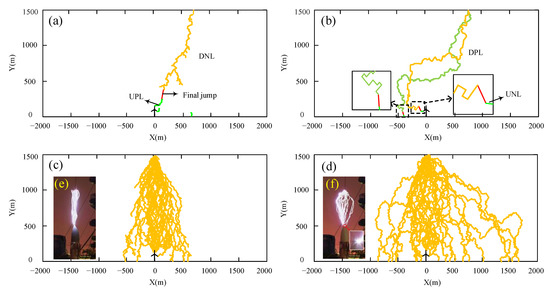
Figure 9.
The development of lightning downward leaders: (a) A −CG flash strikes the No. 1 blade, (b) A +CG flash strikes the No. 3 blade (yellow line) and a +CG flash strikes the ground (green line), (c) 30 paths of the −CG flash (d) 30 paths of the +CG flash (e) Experimental result for paths of 20 negative discharges (f) Experimental result for paths of 20 positive discharge.
Then, it is observed that the channel of DPL is prone to be tilted and has large turns. However, the DNL has less bending, more branches, and multiple upward leaders can often be seen in the simulations. When the initial position of DL is 600 m, most of the downward negative −CG lightning strikes to the No. 1 blade and a few strikes to the No. 2 blade. While the +CG lightning will bypass the No. 1 blade and No.2 blade with the largest field strength and strike to the No.3 blade or ground with weak field strength.
Figure 10a–c is the optical image of +CG lightning by the Tall-Object Lightning Observatory in Guangzhou (TOLOG). Figure 10a is obtained by the high-speed cameras (20000 fps) and Figure 10b,c is from the Lightning Channel Imager (LCI) with the frame rates of 50 fps. Figure 10d is the three-dimensional (3-D) channel reconstruction of lightning. The downward positive flash bypassed several high buildings at a near distance (about 100 m), but did not strike to these buildings, and hit the side of the east tower. This is consistent with the circumvention phenomenon simulated in Figure 9b. Note that, it can be seen that the lightning attachment process and lightning development morphology of the actual +CG lightning observed in Figure 10 is very close to the simulated results, which verifies the effectiveness of the model.
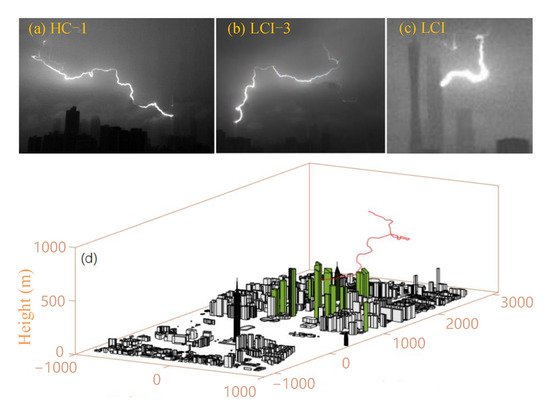
Figure 10.
(a–c) Optical images (d) The 3D channel of a +CG lightning return stroke striking the side of the CTF Finance Center.
Additionally, as illustrated in Figure 9c,d, 30 development paths of the −CG lightning and +CG lightning simulated by the model in this paper is drew, respectively. For the convenience of statistical analysis, when drawing the simulation path, only the main channel path of the leader development is made, and the branch part is hidden. Obviously, the dispersity of the leader development path associated with −CG lightning is small, and the lightning strike points of 30 −CG lightnings are concentrated at the blade tip. Nevertheless, the development path of −CG lightning is zigzag and scattered, and the lightning strike points are in a wide range. Meanwhile, the experimental researches of lightning strike attachments on a 5m blade specimen with tip receptors from 1.5 MW wind turbine blades under 3 m air gap were conducted by Guo et al. [11] are shown in Figure 9e,f. Although the length of the blade and the size of the wind turbine used in the experimental research are different from those used in our simulation, the experimental results provide some qualitative insight into the paths of leader development and therefore are used to check the effectiveness of our numerical model. Obviously, the simulation conclusion is consistent with the difference of lightning strike paths with different polarity obtained in the long-gap discharge experiment of wind turbine blades when the blade angle is 0°.
All in all, in the case of −CG lightning, the UPL is easy to initial and develop, and has a strong attraction to the DNL. The DNL and UPL attract each other and develop toward each other under the influence of the UPL, thus, the dispersity of the −CG lightning is small. In the case of +CG lightning, the UNL is difficult to initiate and develop, and has little attraction to the DPL. The DPL is less affected by the UNL, the randomness of the DPL is large, and the development path is tortuous and curved. Therefore, the +CG lightning has large dispersity and scattered lightning strike points. The existing lightning protection system, which is designed according to the research of −CG lightning, may have insufficient protection margin and can possibly lead to the interception failure of the receptor when it is subjected to +CG lightning.
4.2. Discussion of the Downward −CG Lightning Risk
4.2.1. Influence of Blade Angles on Lightning Risk
According to the literature, the for negative ground flash measured by iron tower on Mont San Salvatore at an altitude of 915 m is 30, and only 5% of the exceeds [30]. Meanwhile, some other studies also pointed out that the first return stroke has an average peak current of 30 kA [13]. Therefore, based on these observations, the value of in the simulation is set as , and 60, respectively.
Compared with the traditional targets on ground such as transmission lines and towers, the wind turbine is generally in a rotating state. In various blade angles, the geometric shape of the wind turbine and the equivalent collection area are different, which leads to the different lightning strike risk. In other words, the lightning strike risk of the wind turbine changing with the blade rotation. The following is mainly based on the downward negative lightning risk calculation model of the wind turbine established in this paper, to analyze the difference of lightning strike risk under different wind turbine states. The schematic diagram of the equivalent collection area calculated by this paper and EGM are compared as shown in Figure 11. The of the nacelle is neglected, since it can be determined that its net contribution to the overall equivalent area is insignificant.
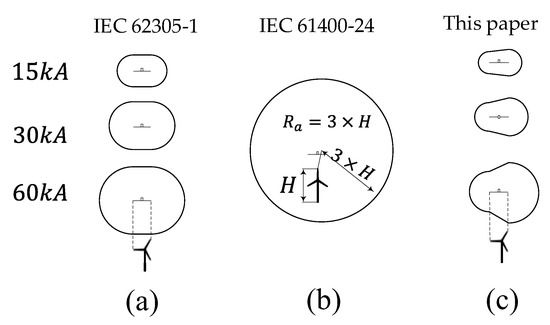
Figure 11.
The schematic diagram of evaluated from the various models (a) IEC 62305-1, (b) IEC 61400-24, (c) In this study.
The shapes of the equivalent collection area under different blade angles are shown in Figure 11. And Table 3 presents the results of derived from the calculation method in this paper. When the lightning current amplitude is 30 (average lightning current amplitude) and the wind turbine is 150m high, the shape of the equivalent collection area is circular with the value of , as the . When the , the shape is like a butterfly with the value of . When the , the shape is like an egg with the value of . Observe that, as the, the striking distance for the wind turbine at the blade angle of 60° is lower than that of 0°, and the corresponding should also be smaller. However, due to the change of the shape, the shape of the equivalent collection area is changed from round to butterfly shape, and the of the wind turbine is slightly increased compared with that when . But the difference among the value of the under different blade angles is small.
Table 3.
The equivalent collection area predicted by the method in this study.
When the is great or when the wind turbine is tall, the increased by the change of the shape for wind turbine blades is not enough to compensate the difference of the changed by the striking distance of the blade angle, and the striking distance plays a leading role in the calculation of the . Consequently, the of a wind turbine as is larger than that of 60°, as shown in Table 3 (200 m). And when is small the of the wind turbine at a blade angle of 30° has no significant difference with the at other angles. However, with the increase in lightning current, the competition effect of the MULs among blades will become stronger when , which leads to an extremely small striking distance of No. 3 blade, so that the decreases correspondingly. And it will be significantly different from the of the wind turbine at other blade angles.
The probability of lightning damage on wind turbine depends on the lightning strike risk and the efficiency of the lightning protection system (LPS). In terms of the above analysis, when the is low or the wind turbine is small, there is little difference among the under different blade angles, and the difference in the probability of lighting strike accident is mainly relevant to the efficiency of LPS. Conversely, when the is large or the wind turbine is tall, the effect of the blade rotation on the cannot be neglected.
According to Table 3, the value calculated from IEC 61400-24 remain the same no matter what state it is in, as it assumes the attractive radius is three times the without consideration for and . The effective height of a wind turbine is 150 m when at of 95 m and of 55 m, and the calculated by IEC 61400-24 is , which is 1.12 times that of (). This difference rises as the overall height of the wind turbine is increased. Moreover, the calculated by IEC 62305-1 [26] does not vary with the structure height, and evidently, the evaluated by it does not conform to the objective fact.
4.2.2. Model Verification
Due to the symmetrical arrangement structure of three wind turbine blades, the varies periodically six times per revolution of the wind turbine. Therefore, the average value can be calculated according to the of the different blade angles obtained above. Then, the and can be evaluated based on the corresponding equation in the Section 3.3.
According to Equation (16), it is noted that owing to the various in different regions, the is also different. Generally speaking, the average intensity of the lightning current at sea is usually greater than that on land. Therefore, under the same conditions, the of the offshore wind turbine is also greater than that of the onshore. On the other hand, due to the stochastic nature and branched behavior of the lightning attachment phenomenon, it is of positive significance for evaluating the lightning risk of the wind turbines to increase appropriately from the perspective of safety protection.
Taking the statistical analysis of wind turbines in the wind farm located in Kansas from Garolera [13] as an example, the is about 0.5956 and the is 2.98.Then, as shown in Table 4, the estimated by the improved method in this study, is 0.57, 0.79 and 0.93 for 100 m, 150 m and 200 m high wind turbines, correspondingly, which is closed to the observed data. However, using the method recommended by IEC 61400-24 and Erikson model [8], the calculation results of the is far beyond the actual value. In addition, the equivalent collection area calculated by the striking distance equation assumed in IEC 62305-1 will underestimate the because it does not consider the influence of wind turbine height and upward leaders.
Table 4.
The difference of the among the observed statistics and different calculation schemes.
4.3. Quantitative Analysis of Downward Lightning Strike Risk for the Wind Turbine Considering Polarity Effect
The calculated of wind turbines by Equation (18) with different heights are 0.2233, 0.344, 0.5094, 0.6634 and 0.8088 , respectively. The higher the building, the greater the is and it shows an almost linear upward trend. After considering the +CG lightning, the total annual lightning flash number of downward lightning can be calculated as follows:
where() is the annual lightning flash number to the wind turbine of +CG lightning, is the annual lightning flash number of −CG lightning, is the annual lightning flash number of all the downward lightning.
The three curves of the , and of wind turbines with different heights is given in Figure 12. It can be seen that the lightning strike probability of −CG is significantly higher than that of +CG. In fact, the occurrence probability of +CG is also far less than that of −CG in the actual situation. The change trend of the three curves shows that the annual lightning flash number is positively correlated with the height of the wind turbine. The can be seen as a linear positive correlation. However, the and , is not a simple linear trend, but with an increase in wind turbine height, the rate of change of the curve increases. The three red stars in the Figure 12 represent the observation data from Garolera [13]. The values for , and from the observations in the wind farm are 0.5956, 0.182 and 0.778 , respectively. Note that, seen in Figure 12, the calculated values in this paper are 0.65, 0.28 and 0.92 , respectively, when the height of the wind turbine is 125 m, which are in good agreement with the observed values.
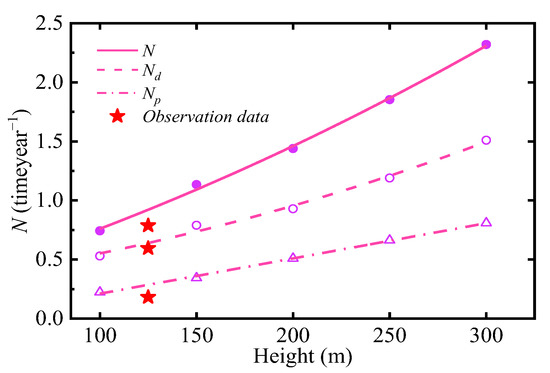
Figure 12.
The annual lightning flash number for the wind turbines at different heights by +CG (dashdot line), −CG (dash line) and all the downward lightning (solid line).
The calculation results from the IEC 61400-24 [14], the Eriksson model [8], the IEC (EGM) model [26], the Rizk model [31,32] and the method presented in this paper are compared in Figure 13. Based on the method proposed in this paper, the quantitative relationship between the wind turbine height and the is obtained. The of 200 m high wind turbine is 1.94 times that of 100 m high wind turbine. To ensure that the number of lightning strike accidents for 200 m high wind turbine is not higher than that for 100 m high wind turbine, the 200 m high wind turbine should be equipped with a more efficient lightning protection system.
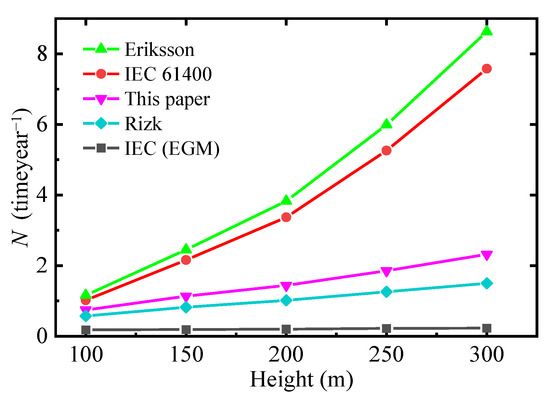
Figure 13.
The value of the total annual lightning flash number of downward lightning calculated by the different models.
It can be observed from the Figure 13 that the calculated from IEC 6140024 standard and the Eriksson model is excessively large when the wind turbine is tall, which badly overstate the value of the . While the evaluated by the striking distance equation from the IEC 623051 based on EGM, underestimates the value of the , which has the disappointment of insufficient protection margin. These three methods are apparently different from the objective fact. By contrast, the value estimated by the Rizk model, and the method proposed in this study is similar. That is, the results obtained in this paper can better reflect the downward lightning risk of the wind turbine, which not only has a great protection margin, but also does not overstate the lightning protection level.
5. Conclusions
In this paper, based on an improved stochastic lighting model, a modified calculation method for the annual lightning flash number of −CG lightning is put forward. This method can reflect the influence of wind turbine height, blade rotation and lightning current amplitude on equivalent collection area, which is more consistent with the actual lightning attachment process. And then, preliminary simulation results on the +CG lightning can deepen the scientific understanding of the effect of the wind turbine on the development of CG lightning of different polarities and reveal the differences in the distribution characteristics of +CG/−CG lightning. The following conclusions are exhibited:
Firstly, considering the competition effect among the multiple leaders, the statistical results show that the striking distance of No.3 blade is much smaller than that of No.1 blade at a blade angle of 30° due to the shielding effect among the blades. And the striking distance of wind turbine blade increases with the increase in lightning current amplitude and wind turbine height. Moreover, when the is low or the wind turbine is small, there is little difference among the under different blade angles. Conversely, when the is large or the wind turbine is tall, the effect of the blade rotation on the cannot be neglected.
Secondly, preliminary simulation results indicate that, under the influence of UPL, the DNL and UPL attract each other and develop toward each other. So, the −CG lightning has more bifurcation but small dispersity. While the UNL has little attraction to the DPL. The randomness of the DPL is large, and the development path is tortuous and curved. Therefore, the +CG lightning has less bifurcation, large dispersity and scattered lightning strike points. The existing lightning protection system, which is designed according to the research of −CG lightning, may have insufficient protection margin and can possibly lead to the interception failure of the receptor when it is subjected to +CG lightning.
Compared with the observed data, the calculated in this paper are in good agreement with the observed values, which verifies the accuracy and reliability of the method associated with the downward lightning strike risk assessment proposed in this paper. By contrast, the results obtained by other traditional methods are quite different from the objective facts. The calculation model and these quantitative research results in this paper can provide guidance for the design and optimization of the LPS associated with wind turbine.
Author Contributions
Conceptualization, Y.W.; methodology, Y.W., L.C., Q.Q. and R.J.; software, Y.W.; validation, Y.W., Q.Z. and W.L.; formal analysis, Y.W., X.B. and Q.Z.; investigation, Y.W., X.B. and Q.Z.; resources, Y.W., X.B. and Q.Z.; data curation, Y.W.; writing—original draft preparation, Y.W.; writing—review and editing, Y.W., X.B. and Q.Z.; visualization, Y.W. and Y.Z.; supervision, X.B. and Q.Z.; project administration, Q.Z., X.B. and W.L.; funding acquisition, Q.Z., X.B. and W.L. All authors have read and agreed to the published version of the manuscript.
Funding
This research was funded by the National Key Research and Development Program of China (Grant 2017YFC1501504) and the Open Grants of the State Key Laboratory of Severe Weather (No.2021LASW-B06).
Data Availability Statement
All data can be provided by the corresponding authors upon request.
Conflicts of Interest
The authors declare no conflict of interest.
References
- Marugán, A.P.; Márquez, F.P.G.; Perez, J.M.P.; Ruiz-Hernández, D. A survey of artificial neural network in wind energy systems. Appl. Energy 2018, 228, 1822–1836. [Google Scholar] [CrossRef]
- Tüfekci, M.; Tüfekci, E.; Dikicioğlu, A. Numerical investigation of the collapse of a steel truss roof and a probable reason of failure. Appl. Sci. 2020, 10, 7769. [Google Scholar] [CrossRef]
- Krausmann, E.; Renni, E.; Campedel, M.; Cozzani, V. Industrial accidents triggered by earthquakes, floods and lightning: Lessons learned from a database analysis. Nat. Hazards 2011, 59, 285–300. [Google Scholar] [CrossRef]
- Tüfekci, M.; Genel, Ö.E.; Tatar, A.; Tüfekci, E. Dynamic analysis of composite wind turbine blades as beams: An analytical and numerical study. Vibration 2020, 4, 1–15. [Google Scholar] [CrossRef]
- Ozyildiz, M.; Muyan, C.; Coker, D. Strength analysis of a composite turbine blade using puck failure criteria. In Journal of Physics: Conference Series; IOP Publishing: Bristol, UK, 2018; Volume 1037, p. 042027. [Google Scholar]
- Wang, Y.; Deng, Y.; Liu, Y.; Qu, L.; Wen, X.; Lan, L.; Wang, J. Influence of blade rotation on the lightning stroke characteristic of a wind turbine. Wind Energy 2019, 22, 1071–1085. [Google Scholar] [CrossRef]
- Love, E.R. Improvement on Lightning Stroke Modelling and Applications to Design of EHV and UHV Transmission Lines. Master’s Thesis, University of Colorado Boulder, Boulder, CO, USA, 1973. [Google Scholar]
- Eriksson, A.J. The incidence of lightning strikes to power lines. IEEE Trans. Power Deliv. 1987, 2, 859–870. [Google Scholar] [CrossRef]
- Cooray, V.; Kumar, U.; Rachidi, F.; Nucci, C.A. On the possible variation of the lightning striking distance as assumed in the IEC lightning protection standard as a function of structure height. Electr. Power Syst. Res. 2014, 113, 79–87. [Google Scholar] [CrossRef]
- Petrov, N.I.; Petrova, G.N.; D’alessandro, F. Quantification of the probability of lightning strikes to structures using a fractal approach. IEEE Trans. Dielectr. Electr. Insul. 2003, 10, 641–654. [Google Scholar] [CrossRef]
- Guo, Z.; Li, Q.; Ma, Y.; Ren, H.; Fang, Z.; Chen, C.; Siew, W.H. Experimental study on lightning attachment manner to wind turbine blades with lightning protection system. IEEE Trans. Plasma Sci. 2018, 47, 635–646. [Google Scholar] [CrossRef]
- Ioannidis, A.I.; Tsovilis, T.E. Shielding Failure of High-Voltage Substations: A Fractal-Based Approach for Negative and Positive Lightning. IEEE Trans. Ind. Appl. 2021, 57, 2317–2325. [Google Scholar] [CrossRef]
- Garolera, A.C. Lightning Protection of Flap System for Wind Turbine Blades; Technical University of Denmark: Kongens Lyngby, Denmark, 2014. [Google Scholar]
- IEC 61400-24:2019; Wind Energy Generation Systems-Part 24: Lightning Protection. International Standard; International Electrotechnical Commission: Geneva, Switzerland, 2019.
- Jiang, R.; Lyu, W.; Wu, B.; Qi, Q.; Ma, Y.; Su, Z.; Tan, Y. Simulation of cloud-to-ground lightning strikes to structures based on an improved stochastic lightning model. J. Atmos. Sol.-Terr. Phys. 2020, 203, 105274. [Google Scholar] [CrossRef]
- Datsios, Z.G.; Ioannidis, A.I.; Papadopoulos, T.A.; Tsovilis, T.E. A stochastic model for evaluating the lightning performance of a− 400 kV HVDC overhead line. IEEE Trans. Electromagn. Compat. 2021, 63, 1433–1443. [Google Scholar] [CrossRef]
- Guo, J.; Zhang, X.; Wang, B.; Hao, X.; Zheng, S.; Xie, Y.Z. A three-dimensional direct lightning strike model for lightning protection of the substation. IET Gener. Transm. Distrib. 2021, 15, 2760–2772. [Google Scholar] [CrossRef]
- Tan, Y.; Guo, X.; Zhu, J.; Shi, Z.; Zhang, D. Influence on simulation accuracy of atmospheric electric field around a building by space resolution. Atmos. Res. 2014, 138, 301–307. [Google Scholar] [CrossRef]
- Qi, Q.; Lyu, W.; Wu, B.; Ma, Y.; Chen, L.; Liu, H. Three-dimensional optical observations of an upward lightning triggered by positive cloud-to-ground lightning. Atmos. Res. 2018, 214, 275–283. [Google Scholar] [CrossRef]
- Ioannidis, A.I.; Mikropoulos, P.N.; Tsovilis, T.E.; Karanikiotis, N. Fractal-Based Approach for Modelling Electric Breakdown of Air Gaps: An Application to a 75 cm Positive Rod-Plane Gap. In The International Symposium on High Voltage Engineering; Springer: Cham, Switzerland, 2019; pp. 1295–1305. [Google Scholar]
- Iudin, D.I.; Rakov, V.A.; Mareev, E.A.; Iudin, F.D.; Syssoev, A.A.; Davydenko, S.S. Advanced numerical model of lightning development: Application to studying the role of LPCR in determining lightning type. J. Geophys. Res. Atmos. 2017, 122, 6416–6430. [Google Scholar] [CrossRef]
- Mansell, E.R.; MacGorman, D.R.; Ziegler, C.L.; Straka, J.M. Charge structure and lightning sensitivity in a simulated multicell thunderstorm. J. Geophys. Res. Atmos. 2005, 110, D12101. [Google Scholar] [CrossRef]
- Becerra, M.; Cooray, V. On the velocity of positive connecting leaders associated with negative downward lightning leaders. Geophys. Res. Lett. 2008, 35, L02801. [Google Scholar] [CrossRef]
- Saba, M.M.F.; Paiva, A.R.; Schumann, C.; Ferro, M.A.S.; Naccarato, K.P.; Silva, J.C.O.; Custódio, D.M. Lightning attachment process to common buildings. Geophys. Res. Lett. 2017, 44, 4368–4375. [Google Scholar] [CrossRef]
- Guo, Z.; Li, Q.; Yu, W.; Arif, W.; Ma, Y.; Siew, W.H. Experimental study on lightning attachment manner to rotation wind turbine blade. In Proceedings of the 2018 34th International Conference on Lightning Protection (ICLP), Rzeszow, Poland, 2–7 September 2018; IEEE: Piscataway, NJ, USA, 2018; pp. 1–5. [Google Scholar]
- IEC 62305-1: 2010; Protection against Lightning-Part 1: General Principles. International Electrotechnical Commission: Geneva, Switzerland, 2010.
- Saba, M.M.; De Paiva, A.R.; Silva, J.C.O.; Silva, L.D.; Noveline, C.; Schumann, K.P.; Naccarato, K.P. Upward connecting leaders from buildings. In Proceedings of the International Symposium on Lightning Protection (XIII SIPDA), Balneario Camboriu, Brazil, 28 September–2 October 2015; IEEE: Piscataway, NJ, USA, 2015. [Google Scholar]
- IEEE Std 1243-1997; IEEE Guide for Improving the Lightning Performance of Transmission Lines. Institute of Electrical and Electronics Engineers: New York, NY, USA, 1997.
- Cooray, V.; Rakov, V.; Theethayi, N. The lightning striking distance—Revisited. J. Electrost. 2007, 65, 296–306. [Google Scholar] [CrossRef]
- Peesapati, V.; Cotton, I. Lightning protection of wind turbines-A comparison of lightning data & IEC 61400-24. In Proceedings of the 2009 International Conference on Sustainable Power Generation and Supply, Nanjing, China, 6–7 April 2009; IEEE: Piscataway, NJ, USA, 2009; pp. 1–7. [Google Scholar]
- Rizk, F.M. Modeling of lightning incidence to tall structures. I: Theory. Discussion. Author’reply. IEEE Trans. Power Deliv. 1994, 9, 162–171. [Google Scholar] [CrossRef]
- Rizk, F.A. Modeling of lightning incidence to tall structures. II. Application. IEEE Trans. Power Deliv. 1994, 9, 172–193. [Google Scholar] [CrossRef]


Disclaimer/Publisher’s Note: The statements, opinions and data contained in all publications are solely those of the individual author(s) and contributor(s) and not of MDPI and/or the editor(s). MDPI and/or the editor(s) disclaim responsibility for any injury to people or property resulting from any ideas, methods, instructions or products referred to in the content. |
© 2023 by the authors. Licensee MDPI, Basel, Switzerland. This article is an open access article distributed under the terms and conditions of the Creative Commons Attribution (CC BY) license (https://creativecommons.org/licenses/by/4.0/).