Article

An Empirical Relationship among Characteristics of Severe Convective Storms, Their Cloud-Top Properties and Environmental Parameters in Northern Eurasia

by
Alexander Chernokulsky
1,2,*,
Andrey Shikhov
3,
Yulia Yarinich
1,4,5 and
Alexander Sprygin
6
1
A.M. Obukhov Institute of Atmospheric Physics, Russian Academy of Sciences, 119017 Moscow, Russia
2
Institute of Geography, Russian Academy of Sciences, 119017 Moscow, Russia
3
Faculty of Geography, Perm State University, 614068 Perm, Russia
4
Research Computing Center, Lomonosov Moscow State University, 119991 Moscow, Russia
5
Faculty of Geography, Lomonosov Moscow State University, 119991 Moscow, Russia
6
Scientific and Production Association “Typhoon”, 249038 Obninsk, Russia
*
Author to whom correspondence should be addressed.
Atmosphere 2023, 14(1), 174; https://doi.org/10.3390/atmos14010174
Submission received: 21 November 2022 / Revised: 9 January 2023 / Accepted: 10 January 2023 / Published: 13 January 2023
(This article belongs to the Special Issue Extreme Weather Events in Siberia)

Abstract

:
Severe convective storms that produce tornadoes and straight-line winds usually develop under particular environmental conditions and have specific signatures on the cloud tops associated with intense updrafts. In this study, we performed a comparative analysis of satellite-derived characteristics, with a focus on cloud-top properties, and ERA5-based environmental parameters of convective storms in forested regions of the western part of Northern Eurasia in 2006–2021. The analyzed sample includes 128 different convective storms that produced 138 tornadoes and 143 linear windstorms. We found most tornadoes and linear windstorms are generated by quasi-linear convective storms or supercells. Such supercells form under lower convective instability and precipitable water content compared to those for other types of storms. We found a significant negative correlation of minimum temperature on the storm cloud top with instability parameters. In turn, the longevity of convective storms significantly correlates with wind shear and storm-relative helicity. About half of the tornadoes and 2/3 of linear windstorms are associated with the presence of cloud-top signatures, such as overshooting tops, cold-ring or cold U/V features. The events associated with such signatures are formed under high values of instability parameters. Our results can be used for further analysis of peculiarities of tornado and linear windstorm formation and to enhance the predictability of such severe events, especially in regions with a lack of weather radar coverage.

1. Introduction

Tornadoes and convective straight-line winds, induced by mesoscale convective systems (MCSs) and supercells, regularly cause high economic losses and fatalities worldwide, including in Northern Eurasia [1,2,3,4]. In the United States and Europe, the features of convective storms generating severe winds and tornadoes are usually identified based on the data from weather radar [5,6]. However, a substantial part of Northern Eurasia lacks radar observations. In that case, observations of cloud-top features from geostationary satellites remain an important data source to identify severe convective events, which may help forecasters to separate potentially hazardous storms (generating severe wind or tornadoes) from ordinary ones [7,8,9].
Identification of cloud-top features in satellite imagery has been used for severe weather detection since the late 1970s [10,11]. Intense convective updrafts often force cloud tops to penetrate through the surrounding cirrus anvil into the lower stratosphere and form well-detected signatures such as overshooting tops (OTs) [12,13,14], U- or V-shaped patterns in cloud-top temperature [15,16,17], cold-rings [18], and above-anvil cirrus plumes [19,20]. Convective storms with these signatures frequently produce severe weather such as heavy rainfalls [13], damaging winds [21], hailstorms [12], and tornadoes [8,22,23]. In particular, about 45% of severe storms over the eastern United States and Europe from 2004 to 2009 were associated with overshooting top (OT) signatures [7,24]. The same ratio for Northern Eurasia remains unknown.
Together with storm cloud-top features, the convective parameters of the atmosphere during convection initiation are also widely used to forecast and analyze the convective storms that can induce severe wind and tornadoes [1,3,25,26,27]. In particular, high convective available potential energy (CAPE) is important for the formation of a strong updraft, while strong vertical wind shear is crucial for the formation of long-lived updrafts, resulting in supercells and bow echoes [25,26,27]. Recently, multiple studies considered a large set of convective variables (such as instability indices, wind shear, storm-relative helicity, and composite parameters) associated with straight-line winds and tornadoes both in Europe [3,26,27,28,29,30,31] and in Northern Eurasia [32,33,34]. Most of these are based on the new-generation ERA5 reanalysis data [35], which substantially improves the quality of the convective parameters’ computation, especially those for parcel indices [27] and near-surface wind profiles [36].
A coupled analysis of satellite-derived characteristics of convective storms and the signatures of updrafts on the cloud tops with convective environments is presented in only a few studies. Moreover, these studies used only CAPE and wind shear, while other environmental variables were not taken into account. Thus, Bedka [7] noted that OT signatures are related to high CAPE, which explains their strong correlation with hail events and weak correlation with tornadoes. In line with this, Punge et al. [37] used a hail-specific threshold for CAPE and deep layer shear (DLS) based on the ERA-Interim reanalysis data along with satellite-derived OTs, to estimate the frequency of hail events across Europe. Bedka et al. [20] found that the formation of above-anvil cirrus plumes observed in satellite imagery is also associated with high CAPE and high shear.
Over Northern Eurasia, satellite-based studies of convective storms producing severe weather have been limited for a long time due to the lack of enhanced images from geostationary satellites such as MSG2 (Meteosat Second Generation) for most of the region. Researchers focused on the development of threshold-based algorithms for detecting areas with heavy rainfalls, thunderstorms, and hailstorms [38,39]. After 2016, when the Meteosat-8 satellite was relocated to 41.5° E [40], images with sufficient spatial resolution became available for the entire European Russia (ER) region, the Urals, and partly for Western Siberia. Since then, the cloud-top structure has been studied only for several tornadoes and straight-line wind events [32,34,41,42,43]. Features of cloud-top structures associated with severe weather events have not been analyzed previously for a relatively large sample due to a lack of information about tornadoes and straight-line winds in Northern Eurasia. Recent publications of the databases for tornadoes [2,44], and windthrow events [45,46] provide the possibility of performing such analysis.
In this study, we estimate the features of convective storms generating severe wind gusts and tornadoes in Northern Eurasia, specifically in the forest zones of ER, the Urals and a part of Western Siberia for the 2006–2021 period, and identify the environmental parameters that have substantially influenced the storms’ characteristics and cloud-top structure. We perform analyses for three datasets, namely (1) the presence of straight-line wind and tornado events that caused forest damage, (2) satellite-derived characteristics of convective storms that generated these wind-related events, and (3) environmental parameters calculated from the ERA5 data. We focus on the characteristics of convective storms that may be determined with satellite data and analyze relationships of these characteristics with event types (tornadic or non-tornadic events) and the values of convective parameters.
We describe the process of storm events sampling, the determination of convective storm characteristics from the MSG2 images, and the ERA5-based dataset of convective indices in Section 2. We present the main results of the study including the characteristics of convective storms themselves, signatures of the cloud tops, and statistical relationships between storm event types, cloud top features, and convective environments in Section 3. We discuss and summarize the obtained results in Section 4.

2. Data and Methods

2.1. Specification of the Sample for Storm Events

In this study, the databases for windthrow events in ER [45] and Western Siberia [46], were used as data sources for storm events. These databases contain the stand-replacing (total) windthrow events in the forest zones of European Russia (for the 1986–2021 period) and Western Siberia (for the 2001–2021 period). Windthrow areas were delineated based on Landsat and Sentinel-2 satellite images with a spatial resolution of 30 m and 10 m, respectively, and the Landsat-based Global Forest Change dataset [47]. Each windthrow was attributed to a specific type of event, including tornadoes, convective straight-line winds, and non-convective straight-line winds. The databases include stand-replacing windthrow events only with an area > 0.05 km2 and > 0.25 km2 for the events caused by tornadoes and straight-line winds, respectively. The date of an event (or a range of possible dates) and geometrical characteristics (i.e., path length, width, and damaged area) were determined for each windthrow.
We selected the windthrow databases as the main data source, since we focused on tornadoes and straight-line winds that can be classified as ≥F1 intensity, according to the Enhanced Fujita Scale [48] and the International Fujita Scale [49]. Indeed, the presence of a stand-replacing windthrow (with the total canopy removal) covering an area of at least 0.05 km2 for tornadic events and 0.25 km2 for non-tornadic ones clearly indicates the storm severity. Unlike other data sources (the ESWD database [50] or the reports from weather stations), long-term satellite data on windthrow allowed us to identify hundreds of previously unknown cases of straight-line winds and tornadoes and substantially increased the sample size [45]. Moreover, based on windthrow data, the coordinates of the start and end of the damage track are defined with sufficient accuracy, which is important when overlapping severe weather reports with the images from meteorological satellites. Both databases used for windthrow events cover the period of the availability of the MSG2 images (from 2006 to the present) [45,46].
The sample of windthrow events was compiled in several steps. Firstly, both windthrow databases (for the ER and Western Siberia) were unified and updated to 2021, based on the Global Forest Change dataset [47], Landsat, and Sentinel-2 images, according to our method [45]. Windthrow events associated with non-convective storms were excluded. Then, we selected only the events potentially covered by the MSG2/SEVIRI (Spinning Enhanced Visible and InfraRed Imager) satellite images. For the period 2006–2016 in particular, the MSG2 images have sufficient quality to identify signatures of intense updrafts on the cloud tops only in the western part of the ER. For this period, we selected 165 windthrow events that occurred in this region (Figure 1). In turn for the period 2017−2021, the area covered with MSG2 images expanded to 80° E due to the relocation of the Meteosat-8 satellite to 41.5° E [40]. For this period, we selected additional 254 windthrow events for further analysis.
For the next step, we excluded the windthrow events with unknown dates of occurrence. For each date when windthrow events occurred, we downloaded MSG2 images from the Eumetsat Earth Observation portal [51]. Convective storms that generated straight-line winds or tornadoes causing forest damage were identified based on the time series of MSG2 images (HRV and IRW bands, see Section 2.2 for details). In addition, independent information on the time of storm occurrence was also analyzed, for example, based on weather stations reports and/or ESWD. Windthrow events with known dates but unknown times (when it could not be determined which particular convective storm generated a linear windstorm or tornado) were also excluded from the subsequent analysis. As a result, the initial sample of 419 windthrow events induced by tornadoes or straight-line winds was reduced to 281 events (Figure 1).
The compiled sample contains an almost equal number of linear windstorms (143 events) and tornadoes (138 events). It also consists of two subsamples for the period 2006–2016 (82 events) and 2017–2021 (199 events) due to the relocation of the Meteosat-8 satellite in 2016.

2.2. Determination of the Convective Storms Characteristics and Cloud Top Features

We downloaded the MSG2/SEVIRI images for each date when windthrow events induced by straight-line winds or tornadoes occurred (on 98 different days in 2006–2021). According to the previous studies [18,20], we selected only the 0.7-µm high-resolution visible (HRV) 10.8-µm infrared (IR) bands, which are the most informative, to identify the signatures of intense updrafts on the cloud top. Their spatial resolution for the study area is about 1.2 km and 3.5 km, respectively, while the temporal resolution is 15 min.
The preprocessing of the MSG data, in particular extraction for the study area, calculation of brightness temperature and albedo, and further conversion to the Geotiff format were performed using the MSG Data Retriever software package. Next, the images (IRW 10.8 channel, and RGB-combination of the HRV and IRW 10.8 channels known as HRV cloud [52]) were overlapped with previously-selected windthrow areas in the ArcGIS software package. It is of note, that for the nighttime images, only the IRW 10.8 band was used.
As the next step, we determined the particular convective storm that induced each windthrow, based on the time series of the MSG2 images and the previously known time of occurrence of this storm event. Moreover, the time of occurrence of about 100 windthrow events was clarified according to the MSG2 images, in particular for straight-line winds that were reported by the weather stations according to standard three-hours observations.
For further assigning storm cloud-top signatures to windthrow, it is important to consider the parallax effect [53], which results in the displacement of cloud location in satellite imagery with regard to the Earth’s surface. We implemented no algorithms to correct the parallax shift effect, but we took this effect into account by looking for signatures as the cloud tops passed both over the windthrow area itself and at a distance of up to 40 km north of it (or northwest of it, for the images obtained in 2006–2016). We found the largest distance between the windthrow area and an OT or CRCUV signature on the MSG2 image was 45 km. It is of note that this distance depends on the parallax effect but also on mid- and upper-tropospheric wind speeds.
In the absence of weather radar data, we were able to determine only several characteristics of convective storms based on satellite data. Thus, the storm diameter (along the major and minor axis) was estimated as the diameter of its cirrus anvil by using the IRW images corresponding to the center of windthrow occurrence time interval (Figure 2). Next, all storms were classified into meso-α and meso-β scales, according to the 200-km threshold value of their diameters along the major axis (DMA) [54]. We also subdivided all storms into quasi-circular and quasi-linear types, according to the ratio of diameters along the major and minor axes. The threshold value was taken to be 1.5, which is close to the one suggested by [55].
According to [55], quasi-circular storms of meso-α scale are classified as mesoscale convective complexes (MCC), while quasi-linear ones are as squall lines. Following the classification [56], we also identified low-organized multi-cell clusters. In addition, we attempted to identify supercell storms, i.e., storms with deep and persistent rotating updrafts [57]. The use of satellite images did not allow us to detect the rotating updraft [58], which prevents the detection of supercells, at least according to their classical definition. However, previous satellite-based studies e.g., refs. [9,59,60] showed that isolated supercells are easily detected on the images from geostationary satellites. They are characterized by a cirrus anvil plume strongly elongated along the direction of the upper tropospheric flow, and often have a long-lived OT, cold U/V or cold-ring signature on the cloud top, except for the storms formed under low CAPE conditions [7]. We should emphasize that the use of satellite data only (without radar information) did not allow us to identify supercells embedded into larger convective systems. Such supercells (if any) were not separated in this study.
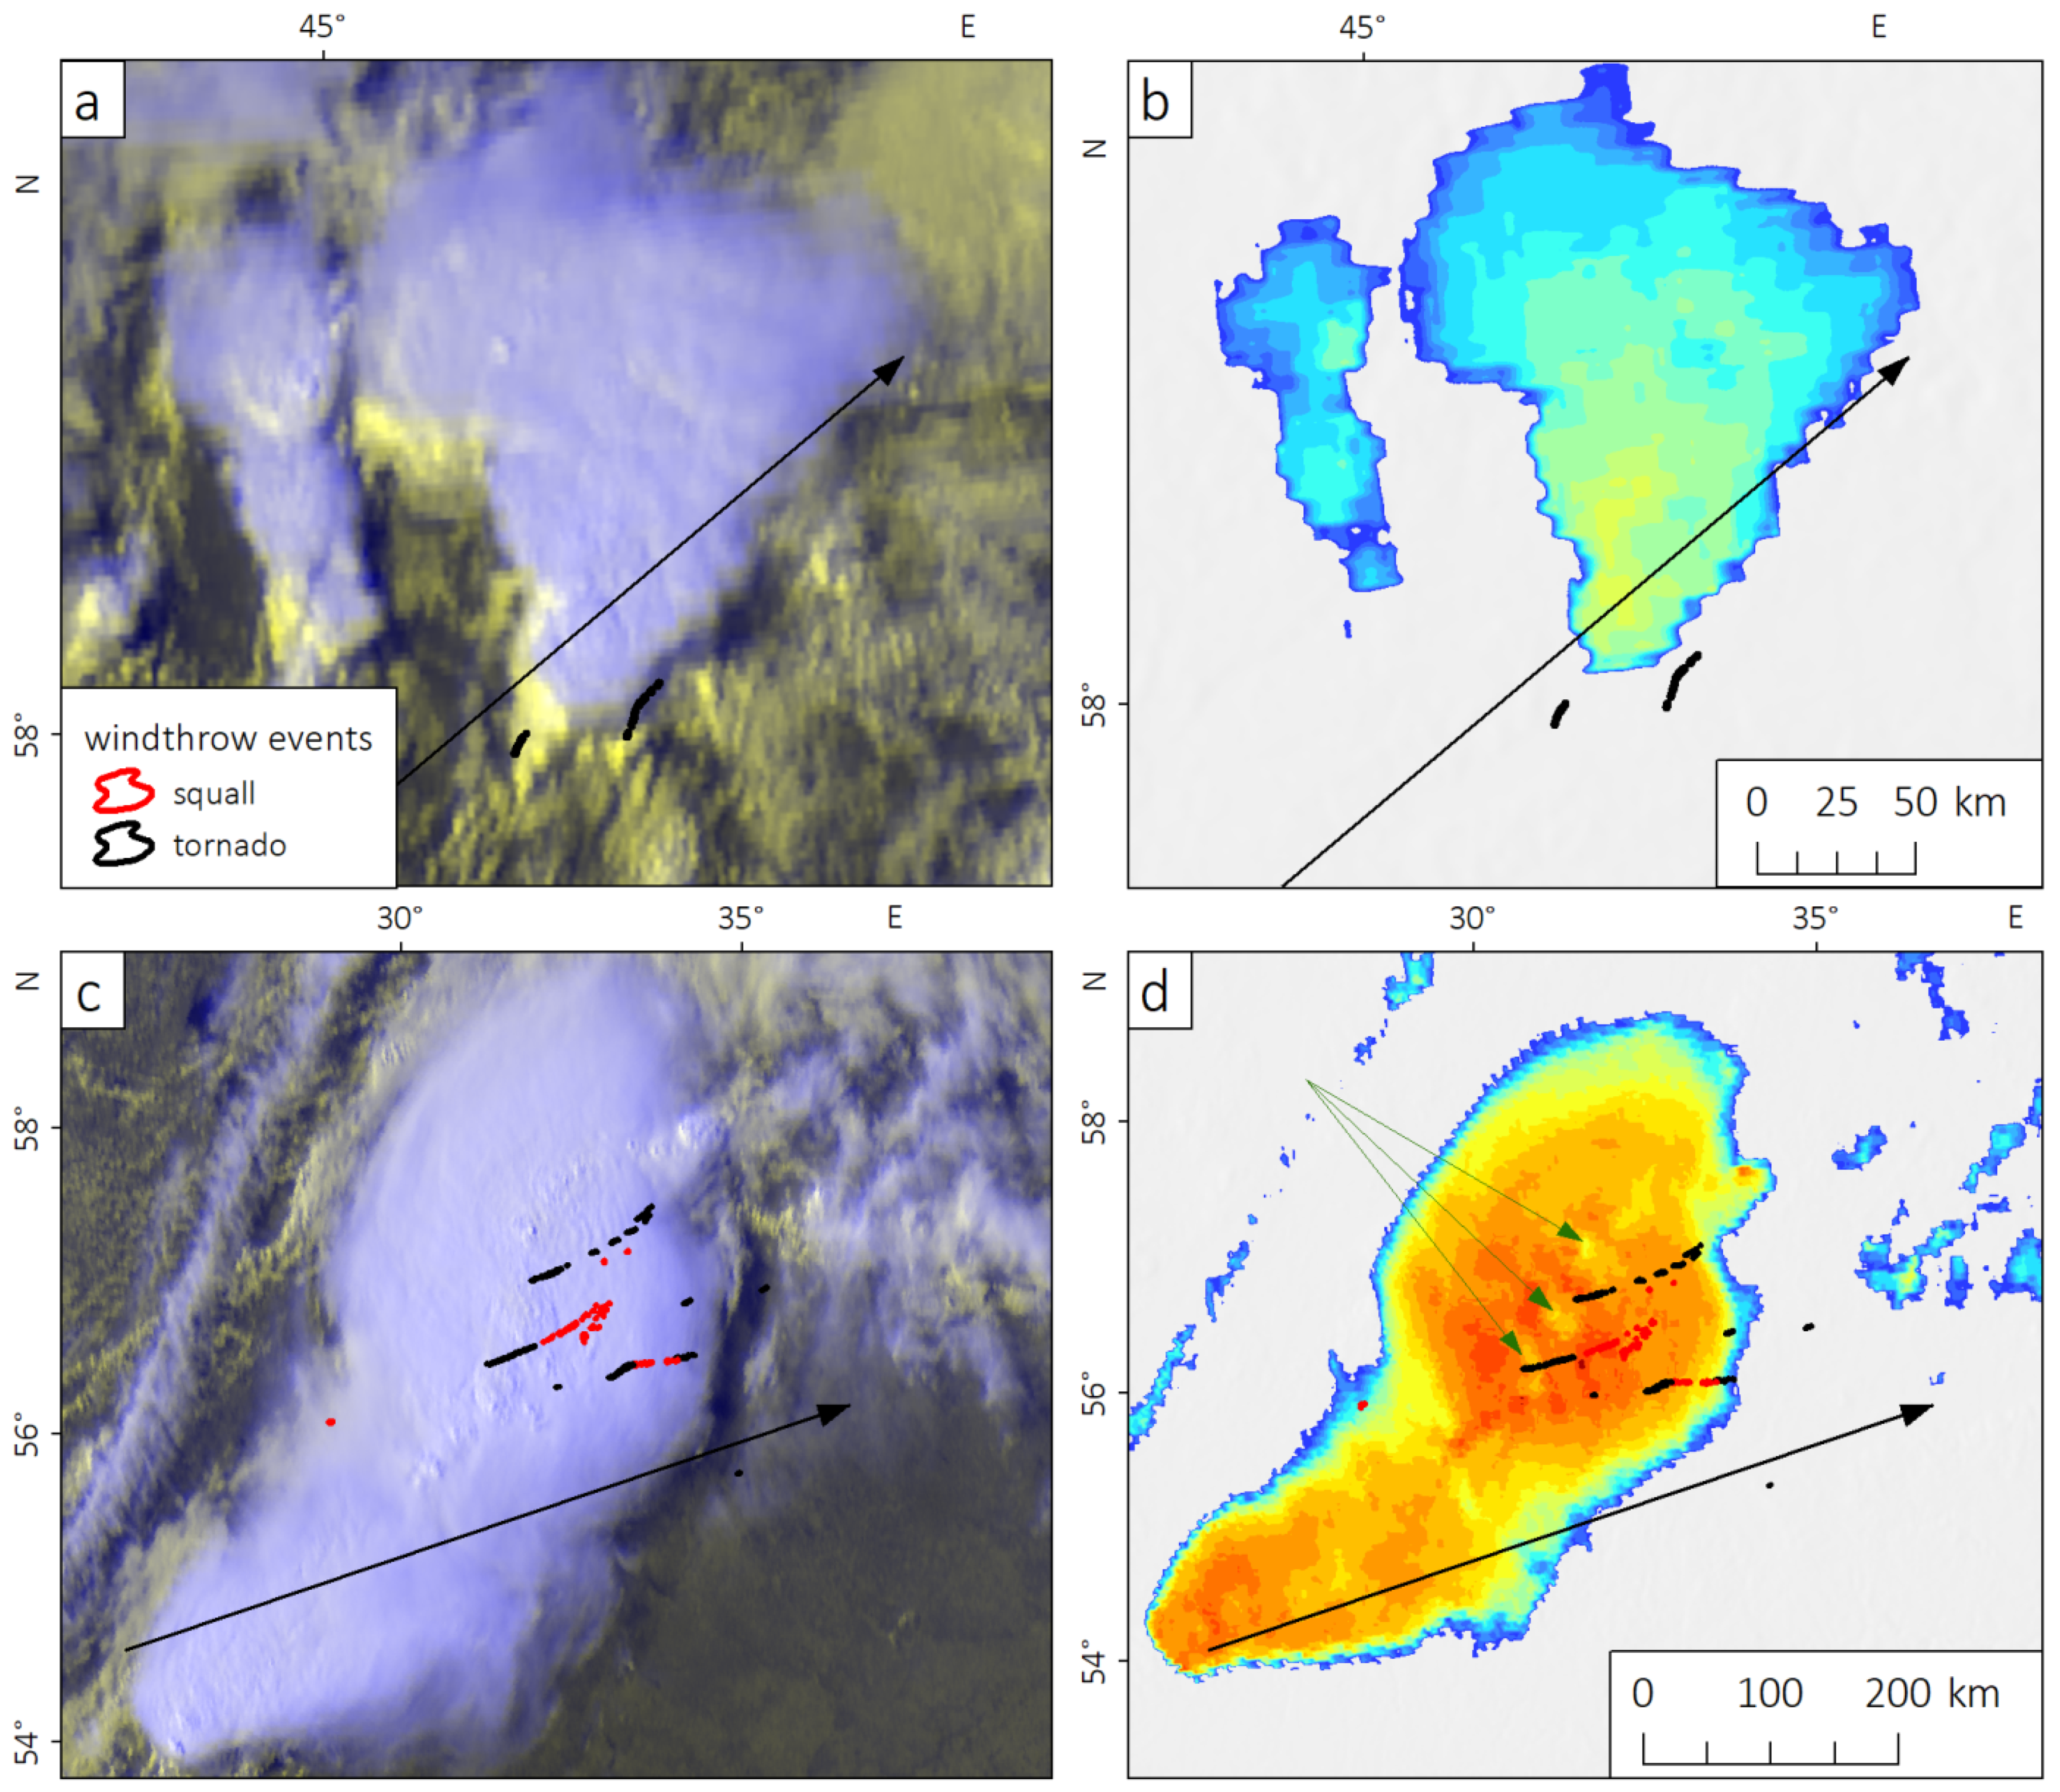
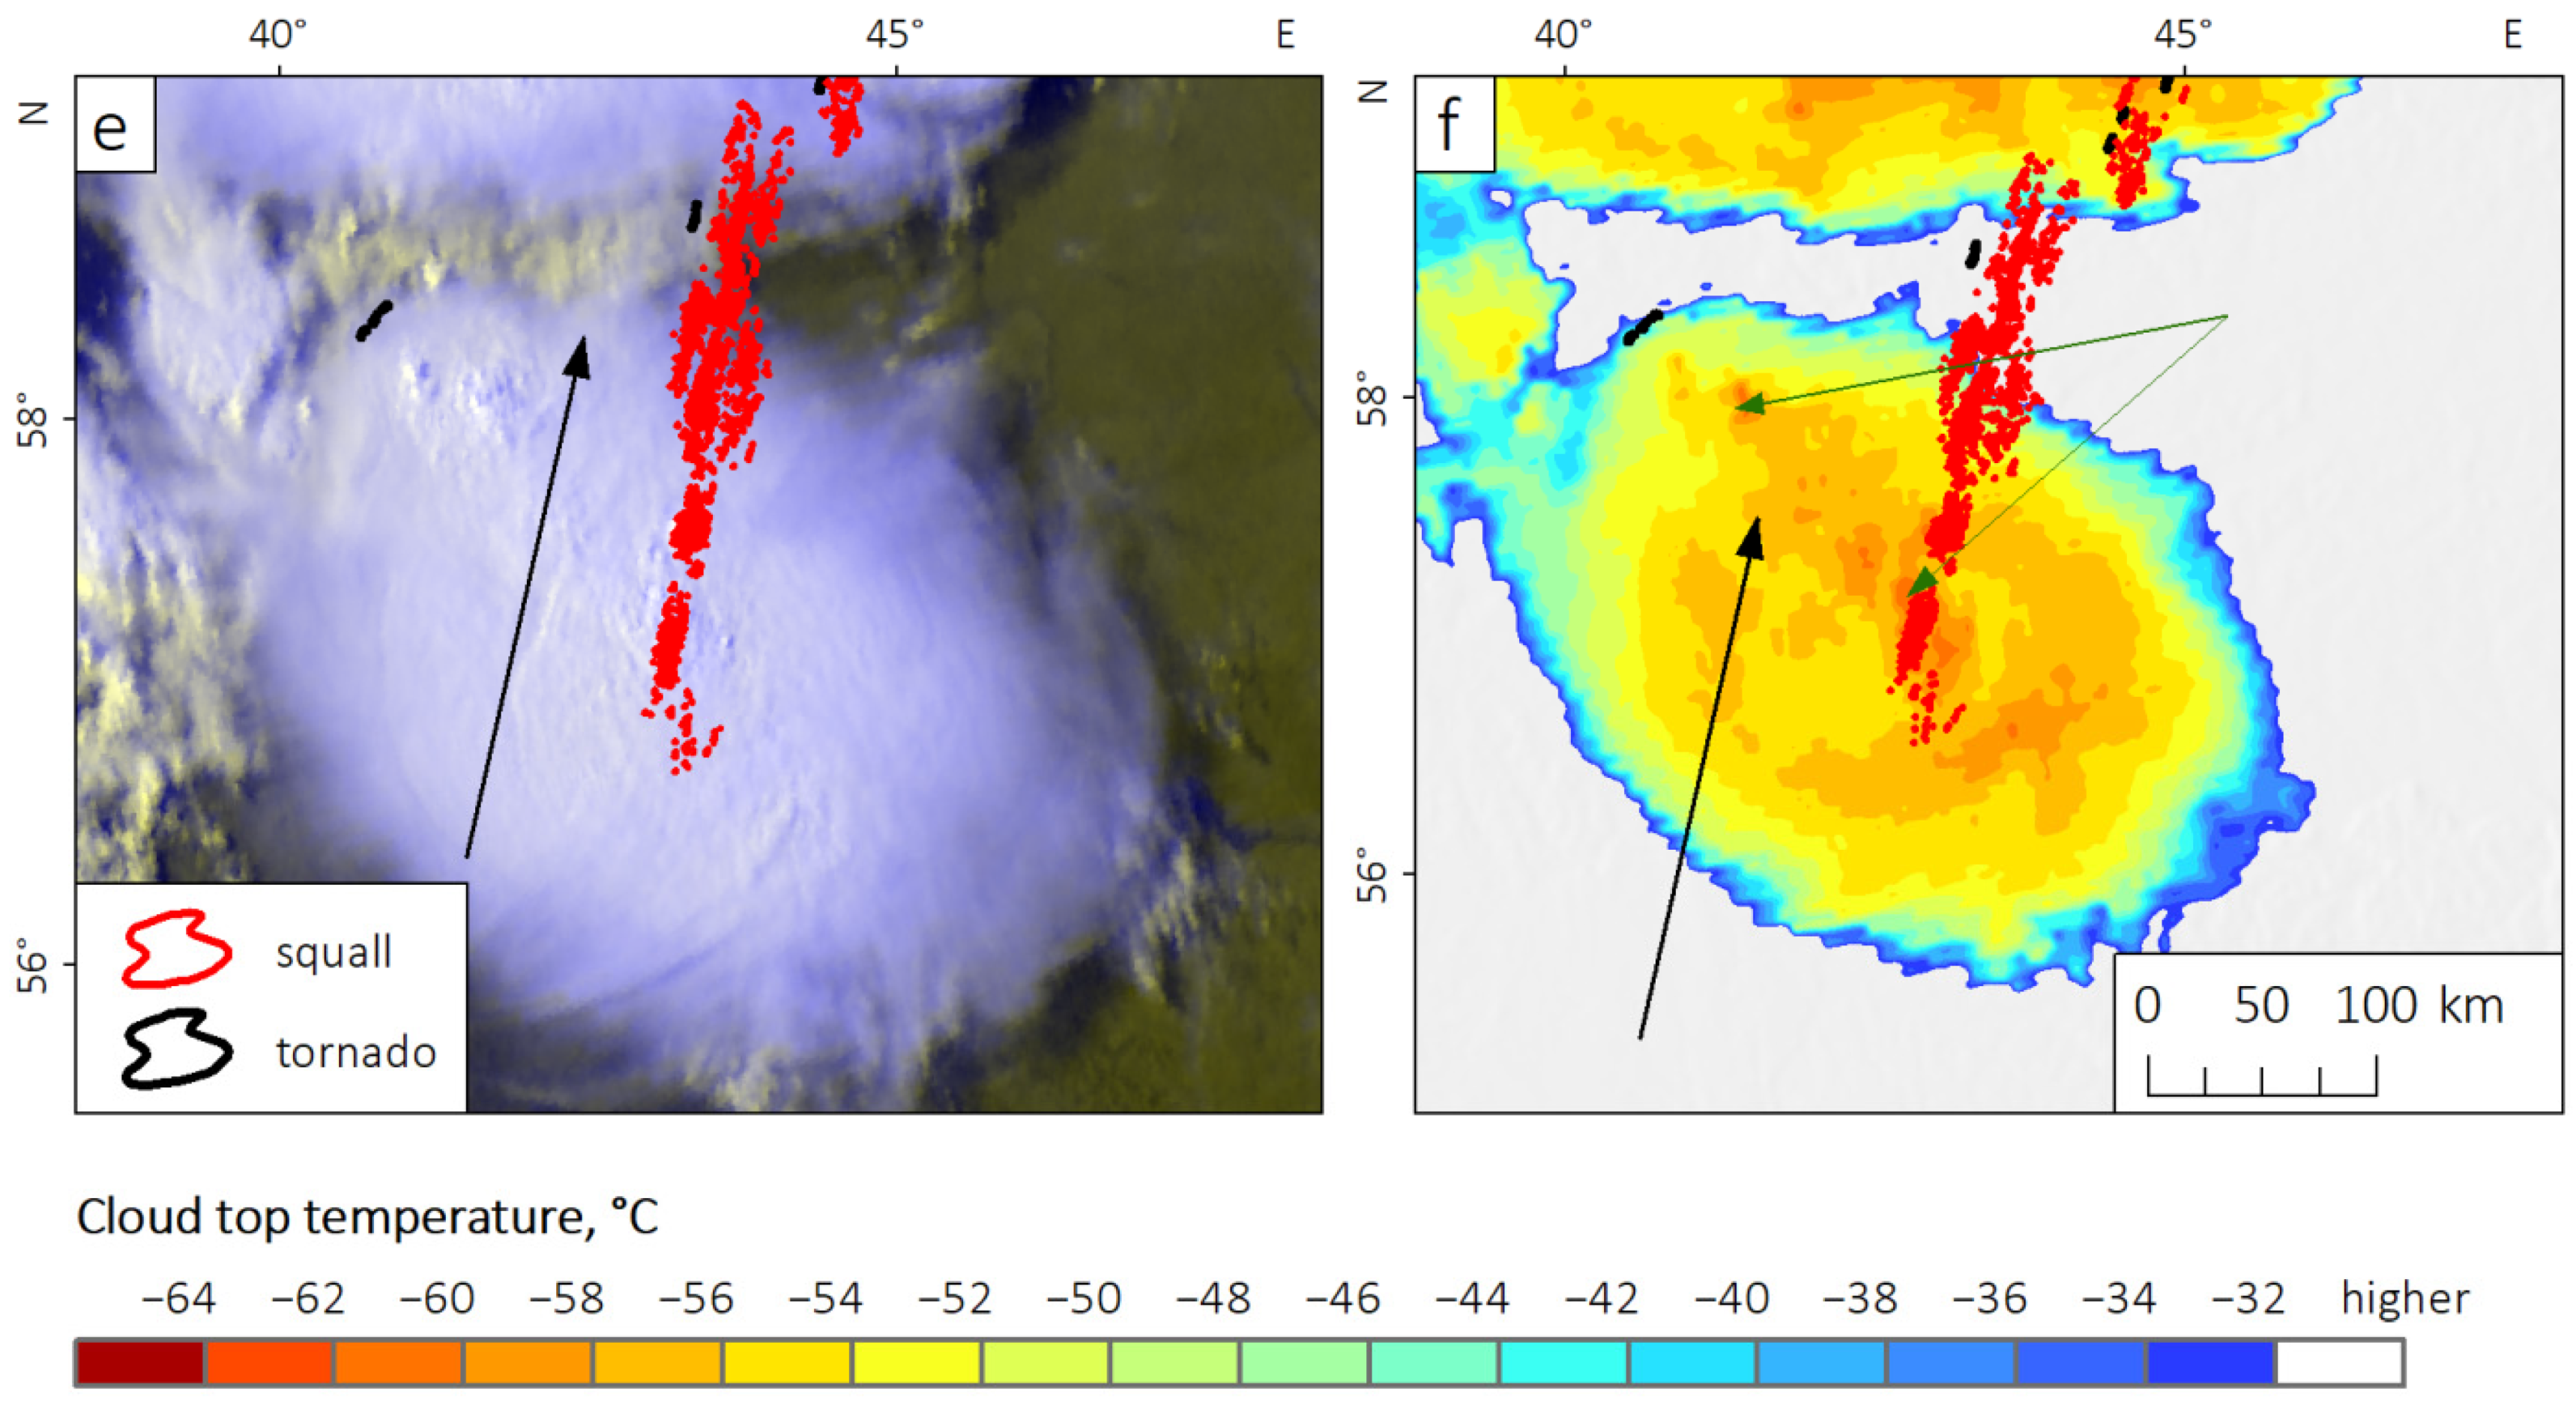
We classified all convective storms into six types: a supercell (Figure 3a,b), a squall line (Figure 3c,d), a quasi-circular or a quasi-linear storm of meso-β scale, a low-organized cluster, and an MCC (Figure 3e,f). Storm types were determined for the time interval when each windthrow occurred. It is noteworthy that supercells often transform into other storm types (into MCC in most cases), and these transformations were also taken into account.
The lifetime of convective storms was estimated based on IRW 10.8 images. According to [55], we considered the time of the beginning of the development of convective cells with brightness temperatures ≤ −32 °C as the storm start time. For re-generating storms (i.e., a squall line), the lifetime was estimated from the start of the regeneration process. The end of the storm’s lifetime was determined as the time when the dissipation of its spatial structure was clearly identified on a satellite image. If a convective cell causing a linear windstorm or tornado subsequently merged with another storm (e.g., a supercell merged with a quasi-linear system), then the end of the lifetime of each storm was estimated as the end of the lifetime of the merged storm.
In the next stage, we identified the signatures on the cloud tops associated with each windthrow event (Figure 4). Signatures of intense updrafts can be detected on multispectral weather satellite imagery both through visual inspection of the contextual information of pixels (i.e., dome-like shape) and with the use of various automated techniques. Thus, in the HRV channel, OTs are easily identified as having a lumpy texture (cauliflower-like appearance) [61]. In the IRW channel, OTs most often appear as isolated regions of cold brightness temperature (BT) relative to the warmer surrounding anvil cloud, which has temperatures at or near that of the tropopause level [62]. OTs are also characterized by a high difference between BT in the 6.5-µm WV channel and IRW channel (about 6–8 K), associated with stratospheric water vapor injection [63]. One of the well-known algorithms of automated OT detection focuses on the identification of small and distinct IRW BT minima within anvil clouds that are colder than the tropopause [64]. Alternative approaches are based on machine learning [65,66,67,68,69]. Automated algorithms are mainly used to compile long-term data series on OTs [7,37,70,71], while other signatures such as cold-U and above-anvil cirrus plumes are often detected manually [69]. It is also important, that OT signature has a quantitative definition [64], while cold-ring and cold U/V ones have no such definitions [18].
In line with Bedka et al. [64], we classified as OTs the small clusters of pixels (≤15 km diameter) that were significantly colder (≥7 °C) than the surrounding anvil cloud, and the minimum brightness temperature within the OT was −58 °C or colder. These threshold values were applied for the coldest pixel within the potential OT signature. Cold-ring and cold U/V signatures (CRCUV) were identified according to [17,18] based on the difference between the minimum temperature in the parent OT and the maximum in a central warm spot that typically ranges from several degrees up to 10–13 °C. We took into consideration only those well-detected CRCUV signatures that had such temperature difference of at least 6 °C and observed at least on two consecutive satellite images (Figure 2 and Figure 3).
For each signature object, we estimated its lifetime, the time lag between the formation of a storm and a signature (with ±15 min accuracy), minimum cloud-top temperature (minCTT), the temperature of surrounding anvil clouds (Tanvil) and their difference (TDIFF). These characteristics were calculated separately for each tornado or linear windstorm (in case the signatures were observed). Characteristics of convective storms (their types, DMA, lifetime, minCTT), and signatures on the cloud tops were analyzed separately for tornadoes and linear windstorms. The statistical significance of the differences between these two samples was estimated with the Kolmogorov–Smirnov (K–S) test at the 0.05 significance level.
We should highlight that our approach is associated with some subjectivity in the determination of both characteristics of convective storms (in particular, storm types) and cloud-top signatures. Because of our small sample (281 known events), we did not use any machine-learning models. The second limitation is that radar data are needed to properly identify supercell storms embedded in larger convective systems and satellite data alone are insufficient. Therefore, only isolated supercells were analyzed. The third limitation of our approach is associated with insufficient accuracy of the data on the start time of a tornado or linear windstorm, which prevented us from accurately estimating the time interval between the appearance of a signature on the cloud top and the beginning of a particular wind event.

2.3. Calculation of Environmental Variables

The values of environmental variables (indices), associated with windthrow events, were extracted from the previously-developed ERA5-based dataset of these variables for Northern Eurasia, covering the period 1979–2021 [33], which consists of 50 variables including parcel indices, wind shear, and helicity parameters, composite indices, calculated based on surface data and 20 standard vertical levels from 1000 to 300 hPa. The fields of convective parameters have 0.25° spatial resolution and 1-h time steps as the initial ERA5 data [35]. The ERA5 has the highest spatial and vertical resolution among other reanalyses, which allows obtaining plausible estimates of most convective variables. A comparison of the ERA5 data with a large set of sounding measurements in Europe showed that this reanalysis tended to slightly underestimate several boundary-layer-dependent parameters, such as CAPE, CIN, SRH, and related composite indices [72]. In this study, we analyzed the reduced list of environmental variables, which consisted of 19 indices: parcel indices calculated for mixed layer through 0–1000 m above ground level (AGL), total precipitable water content (PW), wind shear for 0–1 km (LLS), 0–3 km (MLS) and 0–6 km (DLS) layers, storm-relative helicity for 0–1 km (SRH1) and 0–3 km (SRH3) layers, and 6 composite parameters such as the supercell composite parameter (SCP), significant hail parameter (SHIP), significant tornado parameter (STP), SWEAT index, energy-helicity index (EHI) and ML WMAXSHEAR (a product of DLS and the square root of doubled ML CAPE [28]). The list of used variables (Supplementary Materials Table S1) is basically the same as in [27].
We obtained a dataset of convective parameters associated with each windthrow event. Convective parameters derived from the ERA5 data were extracted from the nearest grid cell to the starting point of each windthrow event. To estimate pre-convective environments, we used values of indices obtained one hour before the storm event formation. In addition, the maximum values of convective indices (minimum for lifted condensation level) were extracted within a 100-km radius around the starting points of each windthrow event (as in previous studies [32,34]). Sometimes, wider spatiotemporal criteria were applied (see e.g., [31,73]) that were more convenient when using radiosonde data with a rare observational network and 12-h gaps between observations. Using the ERA5 data allowed us to avoid wide spatiotemporal criteria. Presumably, too broad criteria could fail in rapidly developing storms, but one cannot say a priori which criterion is optimal. Additional sensitivity studies in the future may be carried out to clarify this issue.
At the next stage, we assigned the values of environmental variables for each convective storm identified from the MSG2 images. If a storm generated only one windthrow event, the values of indices associated with this event were assigned to the entire convective storm. For the storms that generated two or more windthrow events, the maximum values of indices among these events were assigned to these storms.
To determine the differences in environmental variables contributing to the formation of various types of events, various types of storms, and various types of cloud-top signatures, we grouped them into corresponding categories and estimated their distribution. The statistical differences (at the 0.05 level) of distributions were calculated based on the Kolmogorov–Smirnov test.
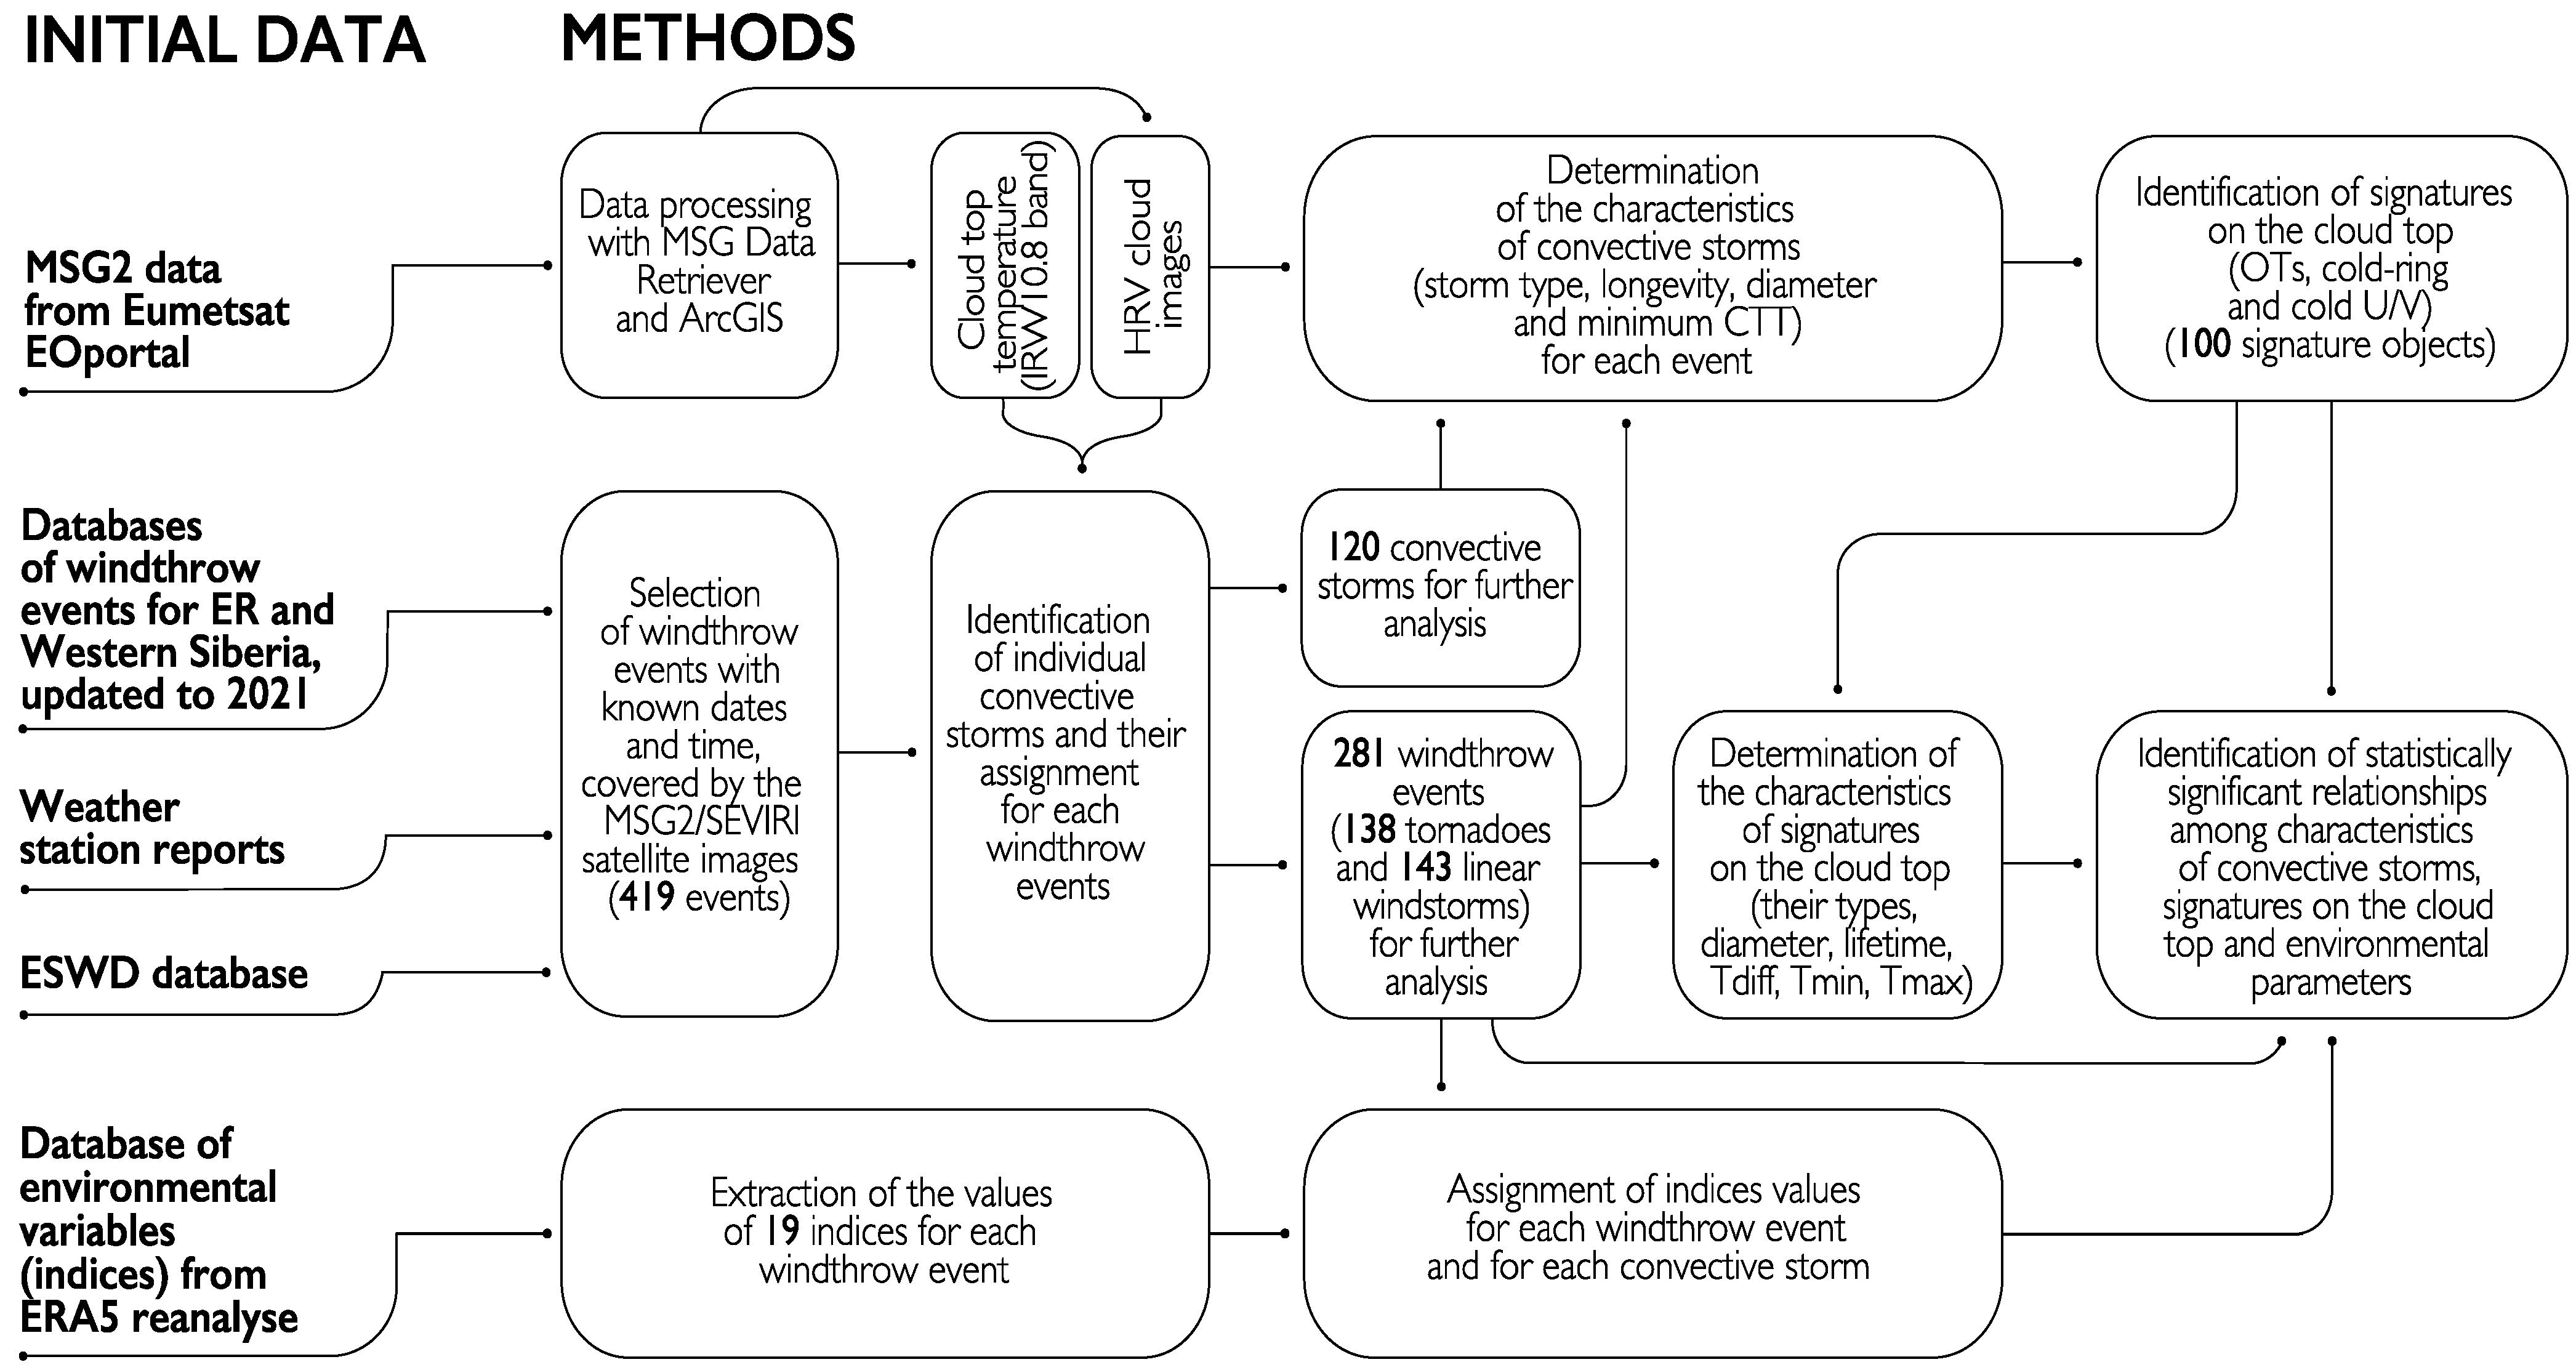
A general workflow used in this study for analyses of windthrow events, satellite-derived characteristics of convective storms, and environmental variables from the ERA5 is presented in Figure 4.

3. Results

3.1. Features of Convective Storms Generating Tornadoes and Straight-Line Winds

3.1.1. Satellite-Derived Characteristics of Convective Storms

We analyzed 281 windthrow events (138 tornadoes and 143 linear windstorms) that were associated with 128 different convective storms.
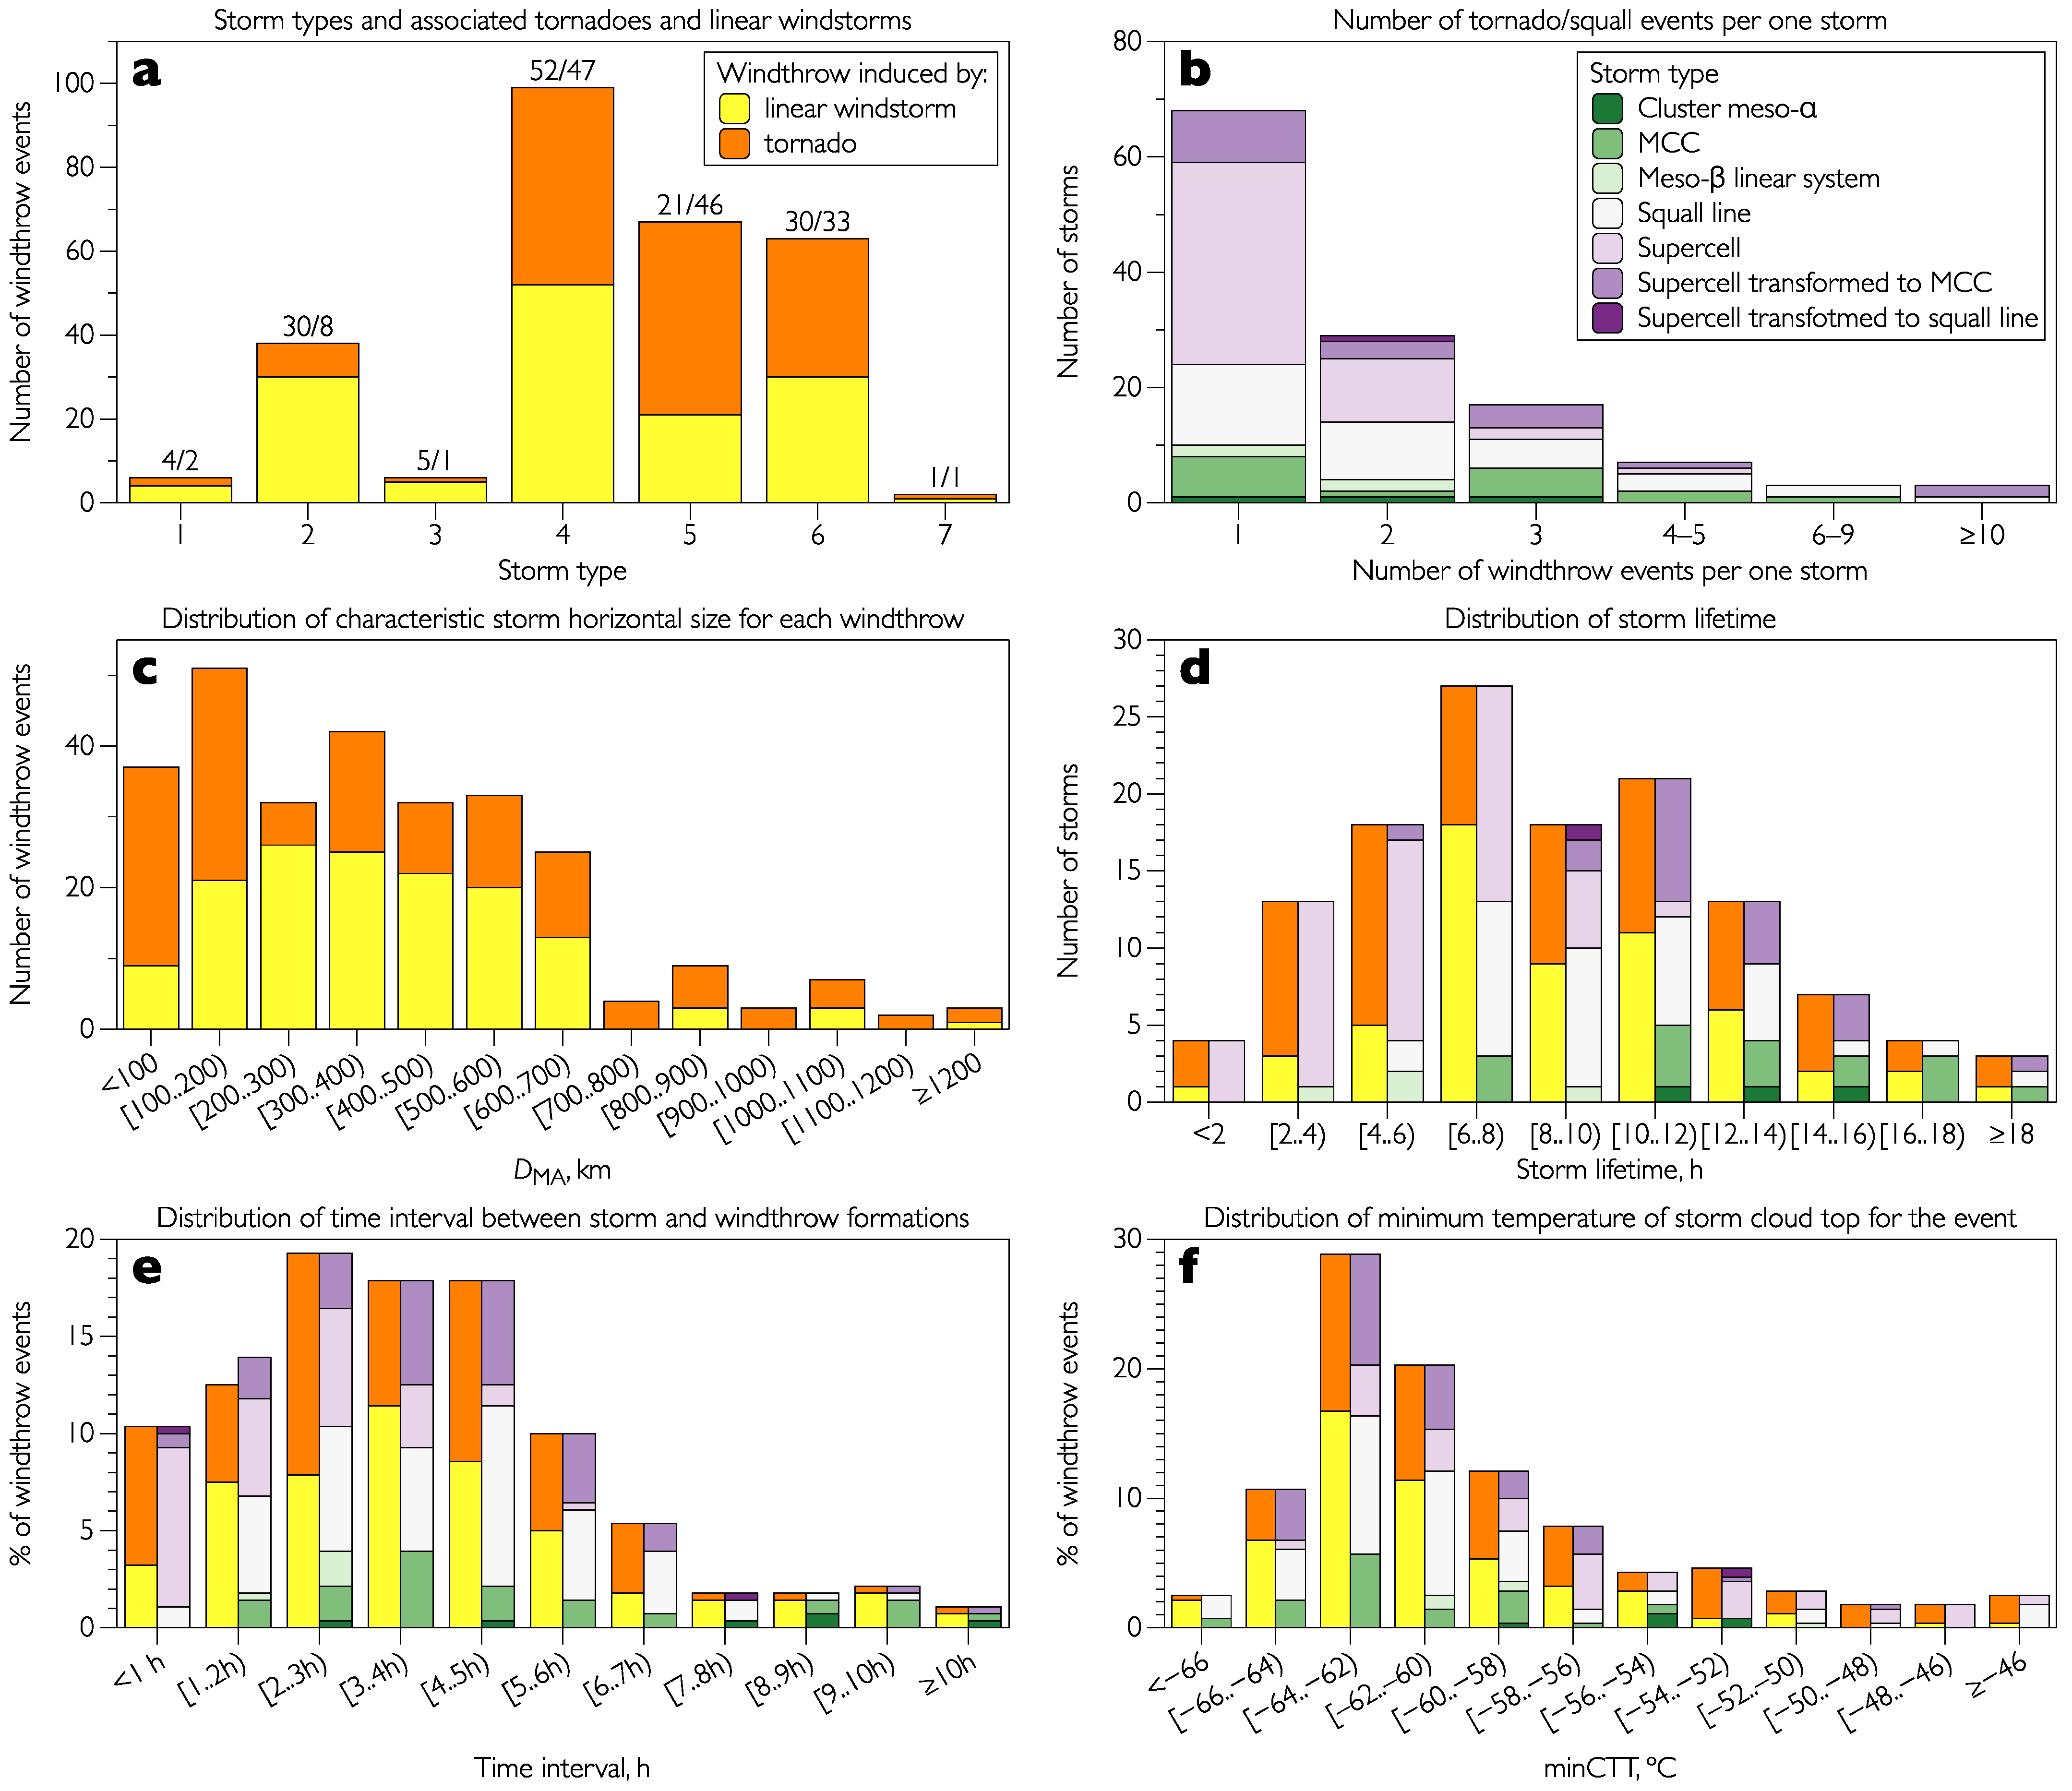
More than a third of both tornadoes and linear windstorms were generated by quasi-linear convective systems (QLCS) of the meso-α scale (squall lines in Figure 5a). For comparison, in the United States, QLCSs generate about 21% of tornadoes [74]. Tornado-generating QLCSs have embedded mesocyclones, which are in most cases clearly visible on satellite images as long-lived OT and CRCUV signatures (see Figure 3c,d for example). A substantial part of non-tornadic events is associated with MCCs (21.0%) and with supercells transformed into MCCs (21.7%), while supercells that were not transformed into MCC generated only 14.0% of non-tornadic events (Figure 5a). In turn, tornadoes are more often generated by local convective storms; about a third of tornadoes are associated with supercells, while MCCs generate only 5.8% of all tornadoes.
We found several seasonal patterns in the frequency of occurrence of various types of storms. In July, 29% of linear windstorms and tornadoes were associated with MCCs, while in May and September, the contribution from MCCs was only 11%. In general, this was associated with higher CAPE in the cases with MCCs (see Section 3.2 for details). In May and September, the proportion of the events caused by QLCSs reached 38% compared to 29% in mid-summer.
Most convective storms generated only one (53.2%) or two (22.6%) tornado or straight-line wind events (Figure 5b). However, three long-lived storms (MCCs or squall lines) that occurred on 12 June 2010, 2 August 2017, and 27 June 2020, generated more than 10 windthrow events induced by tornadoes or linear windstorms (17, 18, and 14, respectively). In these cases, several cold-ring or OT signatures moving quasi-parallel to each other were clearly visible on satellite images (see e.g., Figure 3c,d). Tracks of these signatures somewhat coincided with the damage tracks, which likely indicates that several parallel mesocyclones were embedded in these MCSs. It is of note also, that these MCSs generated damaging wind gusts or tornadoes for at least five hours.
We found DMA of convective storms varied from 35–40 km to 1250 km (Figure 5c). The smallest DMA (≤50 km) typically belonged to short-lived supercells that formed under low-CAPE and high-shear environments [75]. Such supercells generated several significant tornadoes in the studied region, such as the outbreak on 4 June 2018 [76]. In turn, squall lines were found to be the most extended (DMA ≥ 1000 km) compared to other storm types. Most windthrow events (62.2%) were generated by convective storms of the meso-α scale (with DMA ≥ 200 km). Only 31.3% of events were generated by storms of the meso-β scale, while in 6.5% of cases, the storms transformed from the meso-β to the meso-α. The contribution of meso-α storms for non-tornadic events (70.0%) was higher than for tornadic ones (54.3%).
The lifetime of convective storms ranged from 1 h to 26 h (Figure 5d). Ten of the most short-lived storms (with a lifetime of less than 3 h) were supercells that generated one or more tornadoes. We found only one linear windstorm associated with such a short-lived supercell. All other non-tornadic events were generated by storms with lifetimes of ≥ 3 h. We found the most long-lived storm lasted 26 h. This was a squall line on 25–26 May 2020, which passed about 2000 km through Western Siberia, supported by extremely strong wind shear and substantial instability (see Section 3.2 for details).
We estimated the time interval between the formation of a convective storm and the starting time of a straight-line wind or a tornado event (Figure 5e). In most cases, windthrow events occur 2–6 h after the start of the formation of a convective storm. The median interval was 3.0 h for tornadoes and 3.5 h for non-tornadic events (this difference is statistically significant). About 15% of tornadoes and 7% of linear windstorms occurred during the first hour after the formation of corresponding convective storms, which indicates the presence of explosive convection in these cases. It also points to better predictability of straight-line winds compared to tornadoes.
The minimum CTT, associated with straight-line wind and tornado events, ranged from –32 °C to –70 °C (with a mean value of –60.1 °C, and a median of –62.0 °C) (Figure 5e). It is of note that the difference between distributions of minCTT for tornadic (median value of –61 °C) and non-tornadic events (median value of –63 °C) is statistically significant. The warmest minCTT (–50 °C and even warmer) was typical for short-lived storms (with a 1–5 h lifetime) that formed under low CAPE and high shear environments. As noted above, such storms were mainly tornado-generating supercells. A substantial part of these occurred in May and in September when the frequency of high-shear, low-CAPE environments over Northern Eurasia is higher than in summer months see e.g., [76]. In turn, storms with low minCTT (–60 °C and below) occurred more often in summer months. The average values of minCTT for the events in May/September and in July were –56.1 °C and –59.9 °C, respectively; however, the difference is not significant.
We should stress that the temporal homogeneity of the data on the minCTT could be affected by the relocation of the Meteosat-8 satellite in 2017. The images obtained in 2006–2016 have lower spatial resolution and stronger parallax effect compared with those for 2017–2021. We compared two sub-samples of minCTT values for 2006–2016 and 2017–2021 and found that they were statistically different (according to the K-S test) with mean values of minCTT equal to −60.9 °C and −59.8 °C for the periods 2006–2016 and 2017–2021, respectively.

3.1.2. Signatures on the Cloud Tops

We found 100 signature objects on storm cloud tops. Most windthrow events (61%) were accompanied by the formation of signatures on the cloud tops, including both OTs and CRCUVs. Windthrow events induced by straight-line winds were more frequently associated with signatures (67.1%) than tornado-induced ones (53.6%) (Figure 6a); however, we failed to find significant differences between signatures that accompanied tornadoes or straight-line winds. Neither OTs nor CRCUVs were reliable indications of a tornado or a linear windstorm alone; moreover, since our analysis was initially windthrow-based we cannot properly estimate a false alarm ratio for signatures as a predictor of a tornado or straight-line wind formation.
An OT signature was the most common type of signature, accompanying 24% of tornadoes and 31.5% of linear windstorms, while cold U/V or cold-rings were observed for 19.6% of tornadic and 23.8% of non-tornadic events. Moreover, for most of these cases, CRCUVs were accompanied by OT-like signatures, since the so-called ‘parent’ OT is an essential component of most of cold-ring [18] and cold U/V [17] signatures, but we did not assign such OT-like signatures to an OT type. The exception includes cases with the transformation of OTs into CRCUVs that were observed in 11.9% of straight-line wind cases and 10.1% of tornado cases. For such cases, both OT and CRCUV signatures were assigned.
For comparison, in Europe, about 53% of large hail, and 52% of severe wind but only 14% of tornado events (according to the ESWD database) were associated with OT signatures [7]. In our sample, the proportion of the events associated with signatures on the cloud tops was higher, but the direct comparison of our results with those from [7] is limited since we evaluated several types of signatures (not just OTs). The proportion of summertime events (which usually formed under higher CAPE) in Russia is substantially higher than in other parts of Europe [77]; however, we did not find any seasonal patterns for the proportion of the signature-associated events with the season. In particular, both in May/September and in July, this proportion was about 55%.
We evaluated how the frequency of occurrence of the signatures on the cloud tops was related to the storm type, size, and lifetime. We found that half (50.9%) of meso-β scale storms but 2/3 (66.3%) of meso-α scale storms were associated with such signatures (Figure 6a). Only 20% of short-lived storms (lifetime ≤ 5 h) had the signatures on the cloud top, while for long-lived storms (lifetime ≥ 10 h) this proportion reached 68.7%.
The lifetime of signatures ranged from 15 min (that is, a signature observed on two consecutive MSG2 images) to 4.5 h (Figure 6b). The most long-lived signatures included both CRCUVs (6 of 11 cases with a lifetime exceeding 2 h) and OTs (5 cases). Several destructive linear windstorms that caused large-scale forest damage on 3 June 2017, 27 June 2020, and 15 May 2021 (see Figure 1) were accompanied by such long-lived signatures. In most cases, signatures formed within 2–5 h after the formation of a convective storm (with an average time lag is about 3.3 h). However, 10% of signatures appeared during the first hour after the formation of an MCS or supercell, which may indicate explosive convection during these cases.
The time interval between the appearance of a signature on the cloud top and the start of a straight-line wind or tornado event is a critical parameter of the usefulness of the information on cloud-top signatures in severe event nowcasting. For 115 (67.6%) of the analyzed tornado and straight-line wind events with signatures, we were not able to estimate this time interval with sufficient accuracy, since we clarified the time of occurrence of these events from the MSG2 images. Among the rest of the 54 events with signatures, in nine cases, a signature on the cloud top appeared after the start time of a linear windstorm or tornado. Only in 15 cases (28%), was the time interval between the formation of a signature on the cloud top and the occurrence of the event itself ≥1 h. Thus, for such events, satellite-derived information on signatures could be successfully used for their short-term forecast.
Most signatures (65%) were associated with only one straight-line wind or tornado event. In other cases, one signature was associated with more than one extreme event; moreover, in three cases (2 August 2017, 27 June 2020, and 2 August 2021), one signature was associated with 8 different straight-line wind or tornado events.
We also analyzed the parameter TDIFF that shows the difference between the minimum CTT associated with OT or CRCUV, and those of surrounding anvil clouds (for OTs), or central warm spots (for CRCUVs). TDIFF indicates the readability of a signature on a satellite image and is significantly correlated with the spatial resolution of satellite images [17]. We compared TDIFF for two sub-samples obtained for the 2006–2016 and 2017–2021 periods. We found a statistically significant difference in TDIFF between the two sub-samples (with the mean TDIFF value of 7.6 °C and 8.6 °C for two periods, respectively), which indicates the substantial influence of the Meteosat-8 relocation on the obtained characteristics of cloud-top signatures. The proportion of windthrow events accompanied by these signatures was close for two subperiods, i.e., 63.4% in 2006–2016 and 59.2% in 2017–2021, which presumably indicates the lack of critical differences in the data on signatures, obtained before and after the relocation of Meteosat-8 satellite.

3.2. Analysis of Environmental Variables Differences for Various Events, Types of Storms, and Types of Signatures

3.2.1. Differences in Convective Environmental Variables Associated with Linear Windstorms and Tornadoes

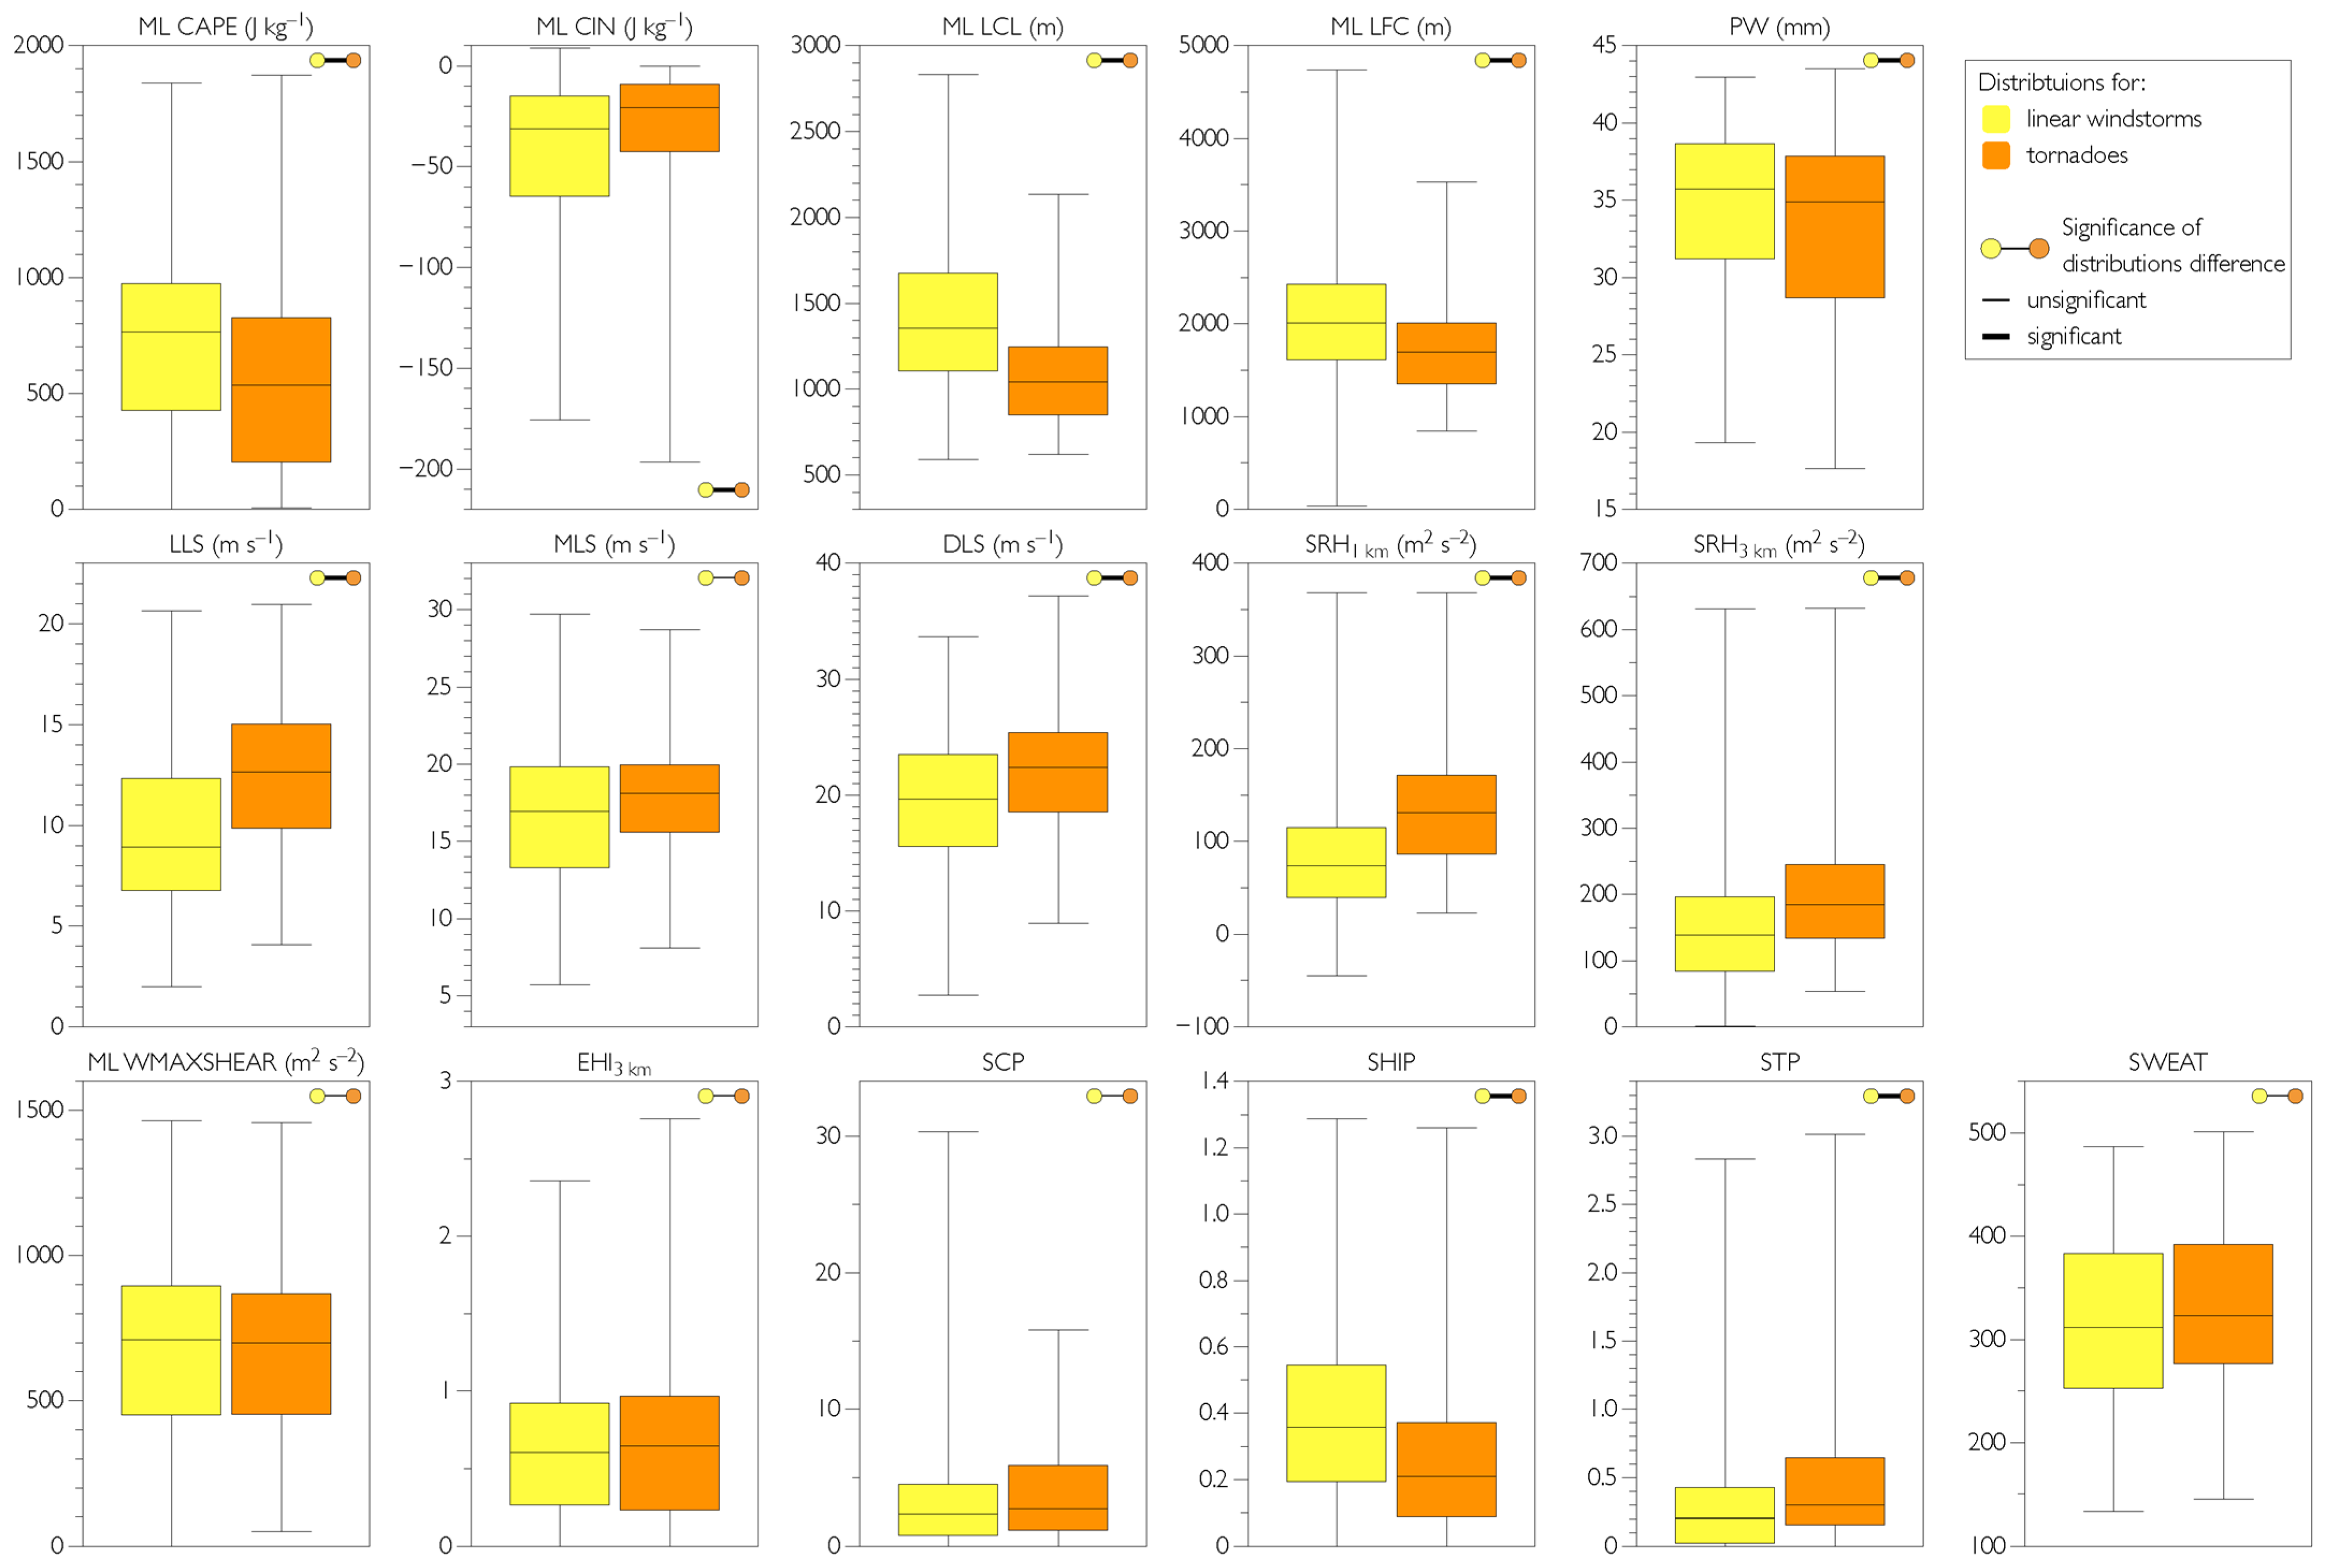
We identified differences in environmental variables for tornadic and non-tornadic events that are in line with previous studies for both Europe and North America [27] and for Northern Eurasia [78]. The significance of differences in convective indices mostly does not differ when it is calculated for the starting point of a linear windstorm (tornado), and for a 100-km radius around it. We found tornadoes formed under significantly lower ML CAPE, PW, and LFC, in comparison with linear windstorms (Figure 7). Several outbreaks of significant tornadoes occurred in relatively cold air masses, under low-CAPE and high-shear environments, see e.g., [76]. At the same time, most composite parameters related to CAPE did not show statistically significant differences between linear storms and tornadoes. In general, tornadoes were associated with lower ML CIN than non-tornadic events, which is also in line with [27]. Another critical factor for the formation of a tornado is a low cloud base associated with a lifted condensation level (LCL), which is substantially lower for tornadoes than for non-tornadic events. In turn, tornadoes formed under stronger wind shear (DLS and LLS), storm-relative helicity, and STP in comparison with non-tornadic events (Figure 7). The important role of strong DLS and high values of composite parameters in the formation of significant tornadoes was previously shown for all of Europe [29] and also for the Mediterranean region [30,31].
We found that the highest observed value of CAPE (1962 J kg−1) was associated with the outbreak of linear windstorms on 30 July 2017, under an intense advection of warm and moist air mass from the Caspian and Black seas. In turn, the strongest DLS (42.5 m s−1) and LLS (21.2 m s−1) contributed to the formation of the tornado outbreaks of 13 September 2018 and 12 June 2010, respectively. In both cases, extremely strong wind shear was formed by latitudinal-oriented low-level and midlevel jet streams. The highest values of composite parameters ML WMAXSHEAR (1736 m2 s–2) and STP (3.8) were associated with the severe weather outbreak of 12–13 June 2010 [79], when both significant tornadoes and linear windstorms caused substantial damage. The strongest SRH0–3 km (764 m s−1) was associated with the non-tornadic event of 25 May 2020, which occurred east of the Ural Mountains. The four highest values of LCL (≥2000 m) in our sample were associated with linear windstorms, which were observed during intense heat waves in July 2010 and 2020, when 2 m air temperatures reached +34 to +36 °C (including two derecho events of 27 June 2010 and 29 July 2010 [32]). On these dates, near-surface heating led to a decrease in relative humidity and an increase in LCL. Moderate-to-high CAPE along with the presence of a trigger (frontal zone) and strong wind shear contributed these days to the formation of destructive straight-line winds.

3.2.2. Dependence of Environmental Variables Associated with Types of Storms and Storm Characteristics

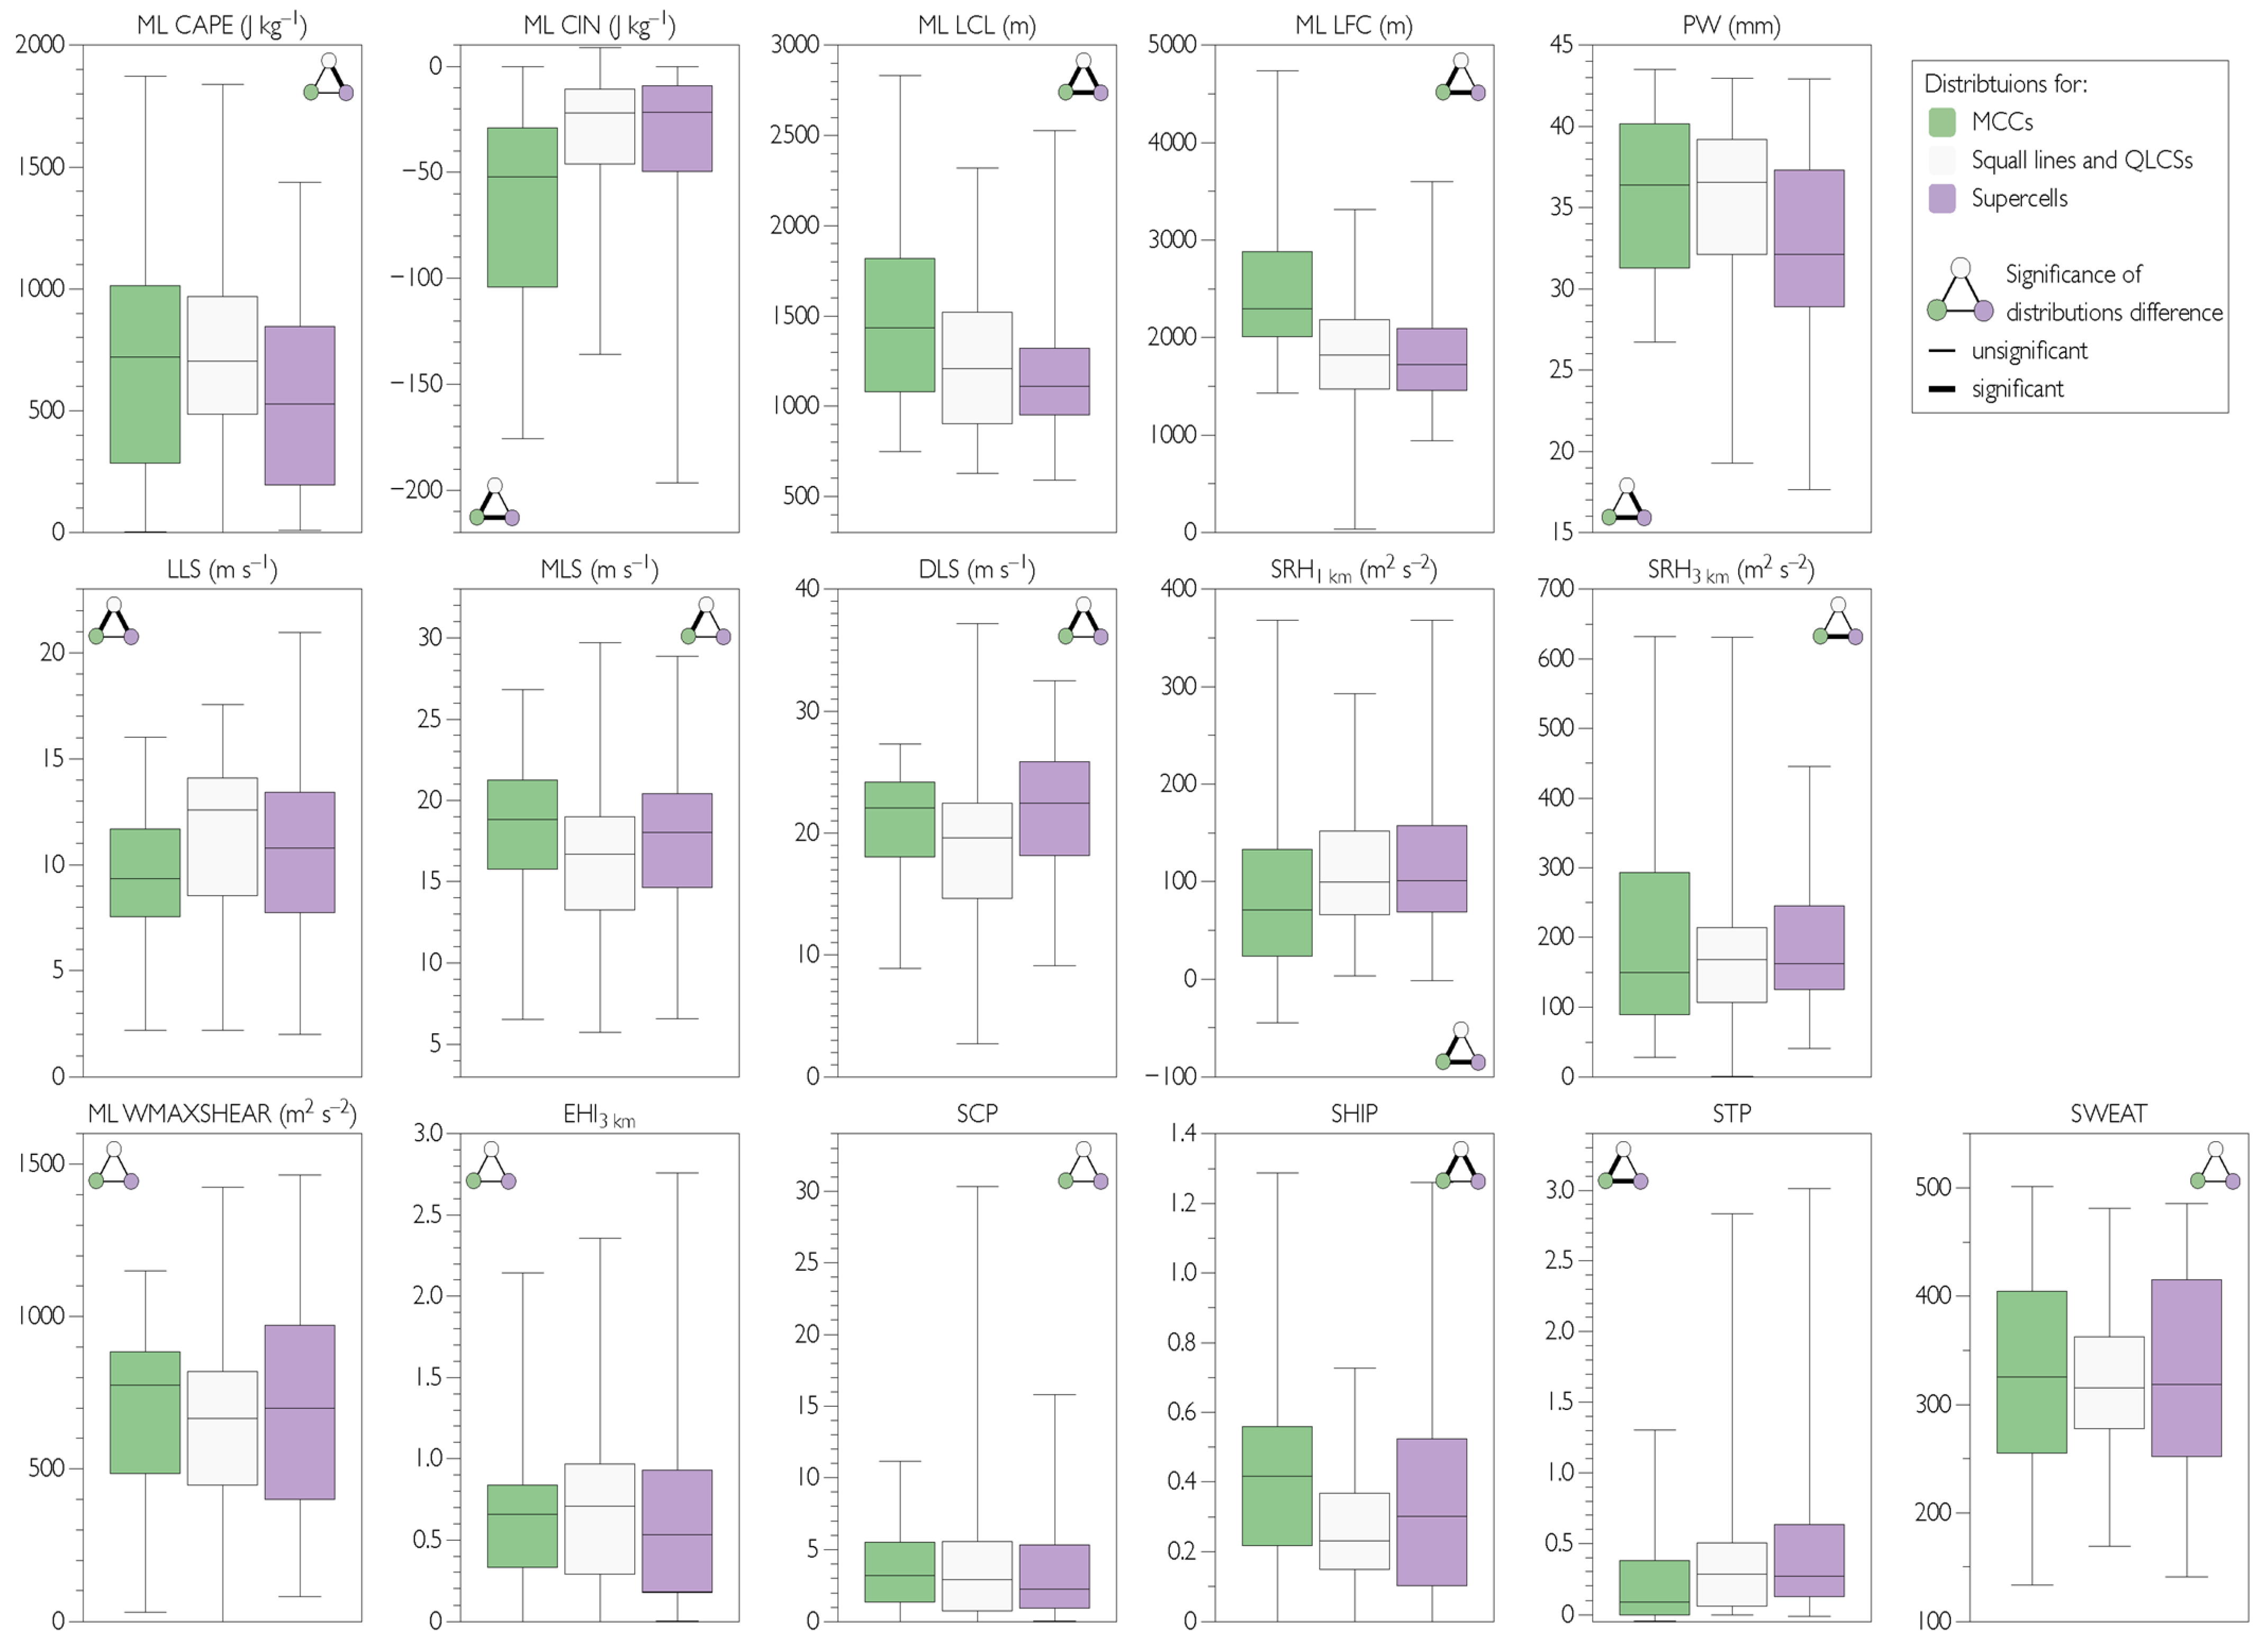
Figure 8 shows the distribution of environmental variables differentiated for types of storms. In general, supercells formed under lower LFC, CAPE, and PW, in comparison with other types of storms. Since supercells often generated tornadoes, this is partially in line with the distributions shown in Figure 7. We found QLCS formed under lower values of DLS but higher values of LLS than supercell storms and MCSs. It can be noted that under low CAPE (less than 500 J Kg−1) mainly supercells and QLCSs were observed, with only one case of a nighttime MCC. In turn, under low DLS (less than 12 m s−1) there was not a single case associated with a supercell.
The differences in storm-relative helicity and composite parameters among the three storm types were mostly not significant. Based on our analysis, we have to stress that SCP is not an informative index for identifying the environments favorable for the formation of supercell storms over Northern Eurasia. We found the highest values of SCP were associated mainly with quasi-linear storms. At the same time, nine out of ten storms with the highest STP (>2) were supercells. However, the best discriminators for supercells are the PW and LCL indices, at least according to our sample. We found that the statistical significance of the differences between indices distribution for various pairs of storm types is sensitive to the technique of their calculation, in particular, whether indices were calculated for the starting point of a linear windstorm (or tornado), or for a 100-km radius around it. Thus, only five indices (ML LFC, PW, DLS, LLS, and SCP) have the same estimates of significance for all pairs of storm types, regardless of the calculation technique.
To estimate the dependence of environmental variables on storm characteristics (such as DMA, lifetime, minCTT), we calculated the Spearman rank correlation coefficient between these characteristics and the values of environmental variables, both for the starting point of straight-line winds or tornado tracks and the maximum (minimum for LCL) in a 100-km buffer (Table 1). For convective storms that caused more than one tornado or linear windstorm, we used the averaged values of convective indices for these events.
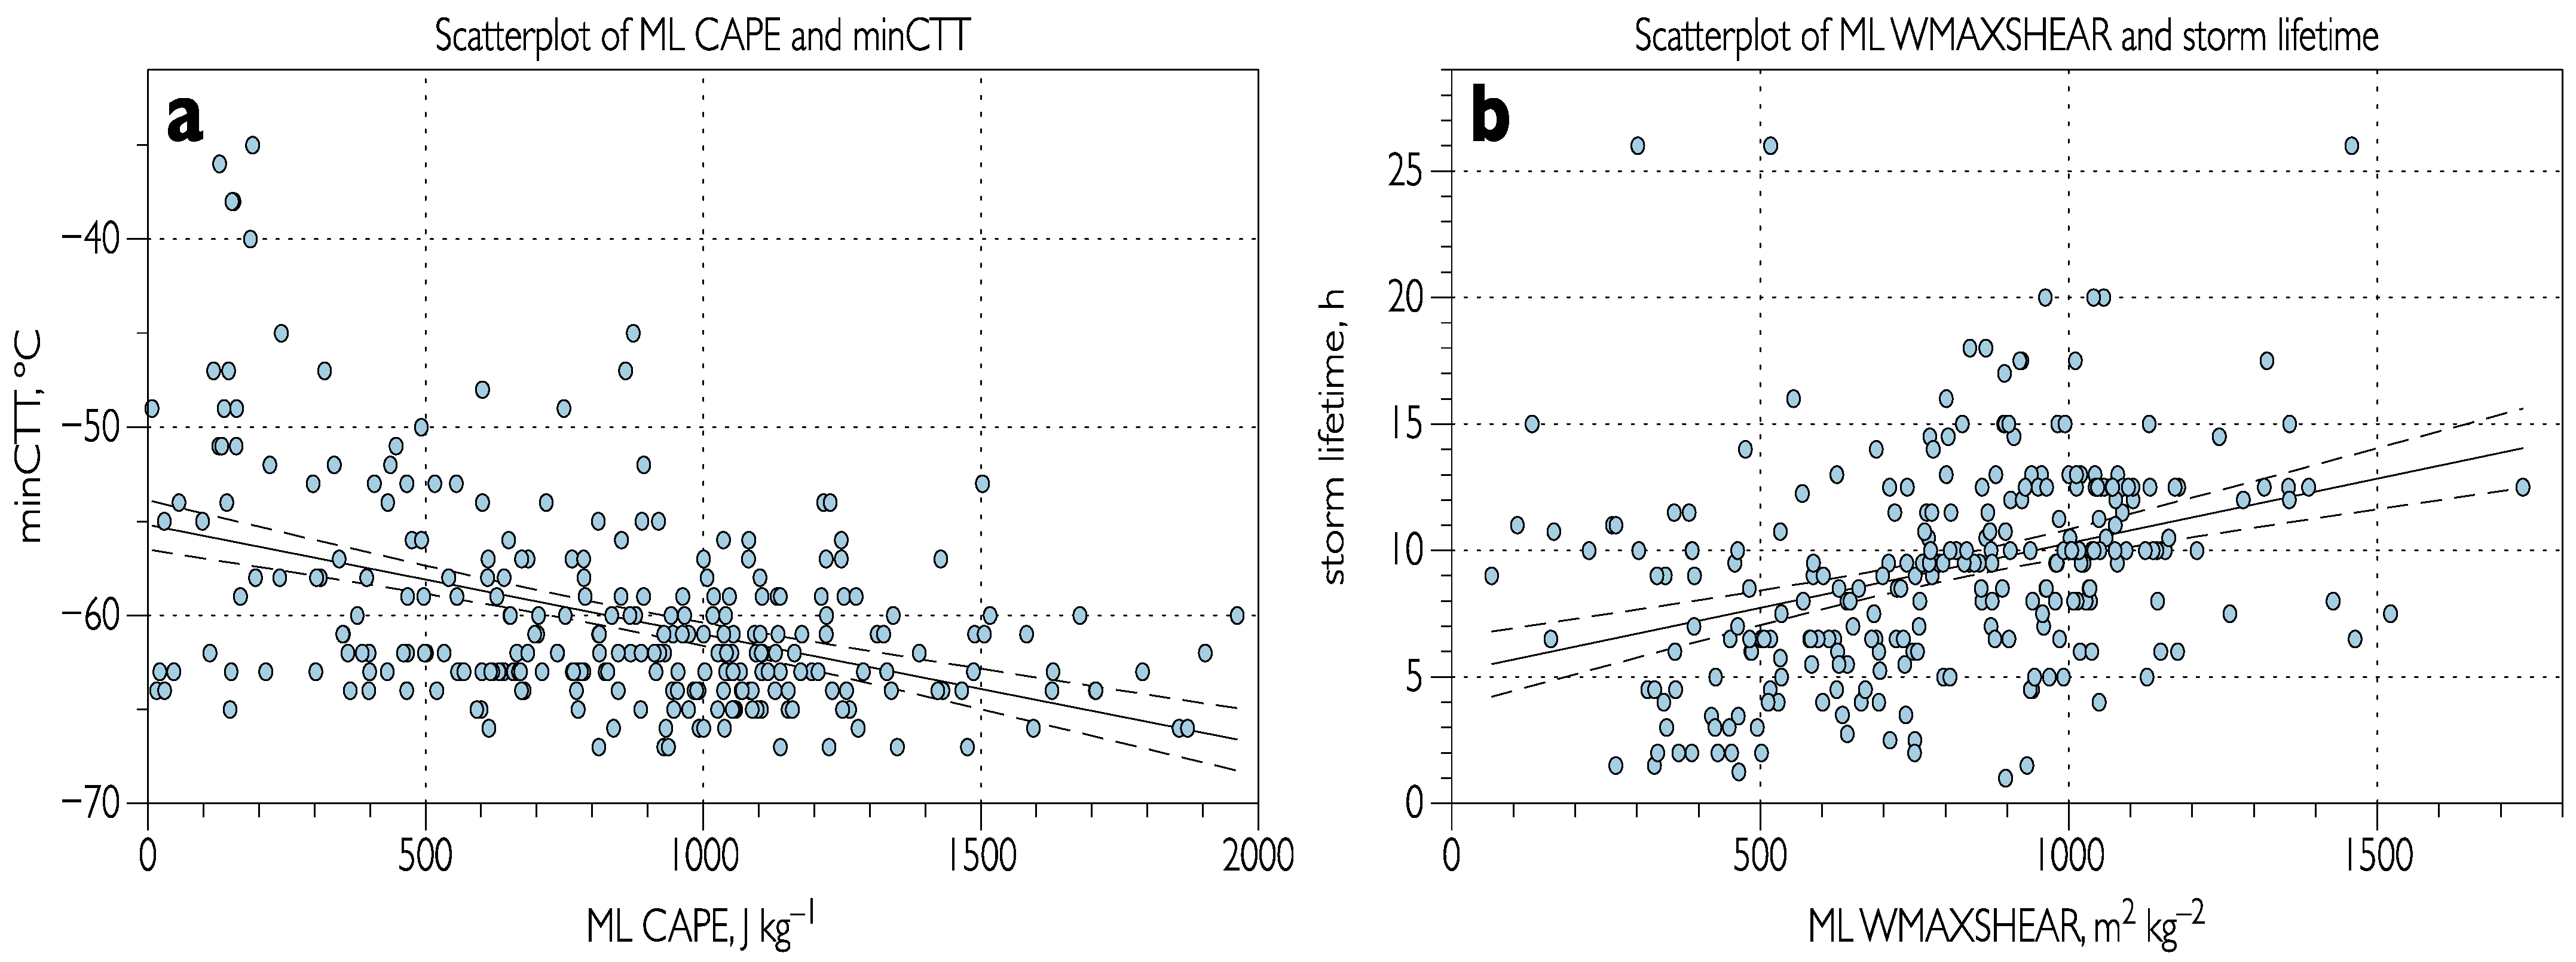
Most correlation coefficients are statistically significant. Thus, DMA has the strongest correlation with the composite parameters SWEAT and 0–3 km EHI. Correlation coefficients for ML CAPE and PW are also statistically significant, which means that large-scale MCSs formed mostly in environments favorable for deep moist convection. The significant correlation of DMA with LLS presumably can be explained by the importance of strong LLS in the formation of long-lived, extended squall lines (see e.g., [80]). MinCTT was significantly negatively correlated with variables characterizing the potential intensity of updrafts, namely ML CAPE (Figure 9a), PW, composite parameters ML EHI, WMAXSHEAR, and especially SWEAT. That means the lowest values of minCTT were associated with the events that formed in warm and moist unstable air masses [7]. It is of note that extremely low minCTT in most of the cases was associated with the formation of cloud-top signatures. In its turn, the convective storm lifetime was determined by the combination of sufficient instability and a favorable wind profile. As a result, WMAXSHEAR, which is a product of CAPE and DLS, is a simple and rather efficient predictor of the formation of long-lived convective storms [27]. We found it significantly correlated with the storm lifetime (Figure 9b); as well as other composite indices (EHI, SWEAT, SHIP).

3.2.3. Links of Environmental Variables with Cloud-Top Signatures

We estimated the differences in environmental variables among the groups of events associated with different types of cloud-top signatures (or their absence) (Figure 10). In line with the previous studies [7,18,20], we found that ML CAPE is the best discriminator between the events accompanied and not accompanied by cloud-top signatures. The values of parameters related to CAPE (ML EHI, ML WMAXSHEAR, SCP, and SHIP) were also significantly higher for the cases with signatures compared to those with none. Some other peculiarities should be highlighted as well. Thus, the events with CRCUV signatures had higher values of SWEAT and ML WMAXSHEAR compared to the events with OTs. Since WMAXSHEAR is a product of CAPE and DLS [28], we can assume that CRCUV signatures are more closely related to both high CAPE and high shear environments. It is of note that in the environments with low DLS (<12 m s−1) and high CAPE (over 1500 J kg−1), the events with OT dominated. Events with no signatures were more often associated with weak or moderate instability (CAPE < 1000 J kg−1). However, under extremely strong DLS over 33 m s−1, the events with no signatures dominated as well.
We also calculated the Spearman rank correlation between environmental variables and the lifetime of signatures (not shown). Most of the correlation coefficients are weak (≤0.20) and not significant, which indicates the overall independence of signature lifetime on convective instability, wind profile, and storm-relative helicity. A statistically significant correlation coefficient was found only for the SHIP parameter (0.26), which indicates high CAPE and high shear environments.

4. Discussion and Concluding Remarks

In this study, we presented estimates of the empirical relationship among characteristics of the tornado- and squall-producing convective storms producing tornadoes and straight-line winds, their satellite-derived cloud-top properties, and environmental parameters calculated based on the ERA5 reanalysis data. The analysis was performed for forested regions in the western part of Russia for the 2006–2021 period. The analyzed sample includes 138 tornadoes and 143 linear windstorms, associated with 128 different convective storms, which occurred in 2006–2021.
Previous similar studies in Russia have been performed only for single cases, or have been based on substantially smaller samples. Thus, the features of convective storms that cause severe straight-line winds or tornadoes in Russia remained largely understudied. In contrast, in Europe and the United States, satellite-derived characteristics of convective storms producing severe events have been studied over the past 40 years. In Europe, such studies have mostly been focused on hailstorms [37,71,81], while analyses of environmental variables have primarily concentrated on CAPE and DLS indices. Therefore, the study region and a large set of environmental variables calculated based on the next-generation ERA5 reanalysis data distinguish our paper from the previously published studies [7,8,18,37,71].
We found that most of both straight-line wind and tornado events from the analyzed sample were generated by supercells or QLCSs. The ratio of tornado events associated with QLCSs reached 34%, which is substantially higher than those for the United States (21% [74]). Most convective storms that generated straight-line wind and tornado events were long-lived (with a median lifetime of 9.5 h), except for several tornadoes generated by short-lived supercells, which formed under low CAPE environments. About 15% of tornadoes and 7% of linear windstorms occurred during the first hour after the start of the formation of a convective storm, which may indicate the presence of explosive convection during those cases.
In three cases, long-lived storms generated more than 10 straight-line wind- and tornado-induced windthrow events. These storms were characterized by several cold-ring or OT signatures moving quasi-parallel to each other, which clearly indicated embedded mesocyclones. In line with the previous studies [7,41], we found that cloud-top minimum temperatures in the cases with tornadoes were higher than those for non-tornadic cases, which indicates weaker updrafts associated with tornadoes.
About 61% of windthrow events (53.6% of tornado-induced and 67.1% induced by linear windstorms) were associated with signatures on the cloud tops, wherein overshooting top was the most frequent signature type. We found that ratio of the events associated with signatures in the western part of Northern Eurasia is higher than in Europe, especially for tornadoes [7]. The frequency of occurrence of these signatures was higher for large-scale and long-lived storms (MCCs and squall lines), while short-lived storms of the meso-β scale were accompanied by the signatures only in 20% of cases. The lifetime of signatures ranged from 15 min to 4.5 h. Long-lived signatures were associated with several linear windstorms that caused large-scale windthrow.
We found that supercells in the study region formed under lower CAPE, PW, and LCL compared to the other types of storms. In addition, under low DLS (less than 12 m s−1) there was not a single supercell-associated windthrow event. This agrees with existing knowledge on tornadoes formed under high-shear, low-CAPE environments in the United States [75], which are often generated by supercells. We also found that MCCs were formed under significantly higher ML WMAXSHEAR, SCP, and SHIP compared with supercells and QLCSs. In general, large-scale MCSs were associated with high CAPE, high PW, and strong storm-relative helicity, that is, their formation environments were especially favorable for deep moist convection.
The minimum temperature on the cloud top is associated with updraft intensity and the tropopause height [7,64]. We found based on our sample that it indeed had a strong negative correlation with ML CAPE, PW, and some composite parameters, such as the SWEAT index. In turn, the lifetime of convective storms was determined by both ML CAPE and DLS, and their product, namely the ML WMAXSHEAR. This parameter has a strong positive correlation with the lifetime of storms, as well as other composite indices. The product of CAPE and storm relative helicity, EHI, also significantly correlated with storm lifetime. This confirms a substantial effect of storm-relative helicity on the lifetime of convective storms, previously identified based on numerical simulations [82].
The events associated with OTs, cold-rings, and cold U/V on the cloud top were formed under higher values of CAPE and composite indices related to CAPE (ML EHI, ML WMAXSHEAR, SCP and SHIP) compared to non-signature events, which is generally in line with previous studies on OTs in Europe [7,18,37]. We also found that the events with CRCUV signatures had higher values of SWEAT and ML WMAXSHEAR parameters compared to the events with OT signatures.
It is important to note, that our sample included convective storms that caused the most impactful squalls and tornadoes in Russia in the last 15 years. These were, in particular, two derecho events in the summer of 2010 [32], destructive straight-line winds and tornadoes on 12–13 June 2010 [79], a severe windstorm on 15 May 2021 [34]; an extreme tornado outbreak on 2 August 2017, which included 56 tornadoes [44], as well as F4 tornado on 18 June 2017 [43]. All these events were generated by the long-lived meso-α storms (QLCSs and MCCs, or supercells that transformed into MCCs). Most of these events were accompanied by the cold-ring or cold U/V signatures, although the F4 tornado on 18 June 2017 was associated only with the OT signature. All these events formed under moderate to strong instability (CAPE > 500 J kg−1) combined with strong shear (with DLS of 20–32 m s−1 and LLS of 11–21 m s−1). Such environments contributed to the formation of long-lived storms and strong updrafts that resulted in the signatures on the cloud tops. Only one of the most destructive events, namely the deadly Moscow windstorm on 29 May 2017 [83], formed under relatively low values of CAPE (<500 J kg−1), and the corresponding MCS had no signatures on the cloud top.
Our results add new information on the quantitative relationship among the characteristics of severe convective storms, the hazardous phenomena they cause, cloud-top features, and environmental conditions for this previously understudied region. This information can be used for further analysis of the peculiarities of the formation of tornadoes and linear windstorms. In addition, it may enhance the predictability of these severe events. For example, the implementation of the information on the cloud top signatures into the nowcasting could be rather important due to the lack of weather radar coverage for a substantial part of Northern Eurasia. Along with the development of automated algorithms to identify various types of convective storms and signatures on the cloud tops, future work can be directed toward the development of a satellite-derived climatology of the convective storms and the signatures on the cloud tops for all of Northern Eurasia. This information can be further used for risk assessment studies and implementation into climate change adaptation plans.

Supplementary Materials

The following supporting information can be downloaded at: https://www.mdpi.com/article/10.3390/atmos14010174/s1, Table S1: List of calculated convective variables calculated from the ERA5 data [28,84].

Author Contributions

Conceptualization, A.C. and A.S. (Andrey Shikhov); methodology, A.C., A.S. (Alexander Sprygin), A.S. (Andrey Shikhov) and Y.Y.; data curation, A.S. (Andrey Shikhov) and Y.Y.; validation, A.S. (Andrey Shikhov) and A.C.; visualization, A.S. (Andrey Shikhov) and A.C.; writing—original draft preparation, A.S. (Andrey Shikhov); writing—review and editing, A.C.; supervision, A.C.; project administration, A.C.; funding acquisition, A.C. All authors have read and agreed to the published version of the manuscript.

Funding

The study was funded by the Ministry of Science and Higher Education of the Russian Federation under the agreement No 075-15-2020-776.

Institutional Review Board Statement

Not applicable.

Informed Consent Statement

Not applicable.

Data Availability Statement

Not applicable.

Acknowledgments

Authors appreciate anonymous reviewers for their constructive and efficient comments on the manuscript.

Conflicts of Interest

The authors declare no conflict of interest.

References

  1. Brooks, H.E.; Doswell, C.A., III; Zhang, X.; Chernokulsky, A.; Tochimoto, E.; Hanstrum, B.; Nascimento, E.; Sills, D.; Antonescu, B.; Barrett, B. A century of progress in severe convective storm research and forecasting. Meteorol. Monographs 2018, 59, 18.1–18.41. [Google Scholar] [CrossRef]
  2. Chernokulsky, A.; Kurgansky, M.; Mokhov, I.; Shikhov, A.; Azhigov, I.; Selezneva, E.; Zakharchenko, D.; Antonescu, B.; Kühne, T. Tornadoes in Northern Eurasia: From the Middle Age to the Information Era. Mon. Weather Rev. 2020, 148, 3081–3111. [Google Scholar] [CrossRef] [Green Version]
  3. Pacey, G.P.; Schultz, D.M.; Garcia-Carreras, L. Severe convective windstorms in Europe: Climatology, preconvective environments, and convective mode. Weather Forecast. 2021, 36, 237–252. [Google Scholar] [CrossRef]
  4. Chernokulsky, A.V.; Shikhov, A.N. 1984 Ivanovo tornado outbreak: Determination of actual tornado tracks with satellite data. Atmos. Res. 2018, 207, 111–121. [Google Scholar] [CrossRef]
  5. Blanchard, D.O. Mesoscale convective patterns of the southern High Plains. Bull. Am. Meteorol. Soc. 1990, 71, 994–1005. [Google Scholar] [CrossRef]
  6. Surowiecki, A.; Taszarek, M. A 10-Year Radar-Based Climatology of Mesoscale Convective System Archetypes and Derechos in Poland. Mon. Weather Rev. 2020, 148, 3471–3487. [Google Scholar] [CrossRef]
  7. Bedka, K. Overshooting cloud-top detections using MSG SEVIRI infrared brightness temperatures and their relationship to severe weather over Europe. Atmos. Res. 2011, 99, 175–189. [Google Scholar] [CrossRef]
  8. Marion, G.R.; Trapp, R.J.; Nesbitt, S.W. Using Overshooting Top Area to Discriminate Potential for Large, Intense Tornadoes. Geophys. Res. Lett. 2019, 46, 12520–12526. [Google Scholar] [CrossRef]
  9. Putsay, M.; Simon, A.; Szenyán, I.; Kerkmann, J.; Horváth, G. Case study of the 20 May 2008 tornadic storm in Hungary-Remote sensing features and NWP simulation. Atmos. Res. 2011, 100, 657–679. [Google Scholar] [CrossRef]
  10. Purdom, J. Some uses of high-resolution GOES imagery in mesoscale forecasting of convection and its behavior. Mon. Weather Rev. 1976, 104, 1474–1483. [Google Scholar] [CrossRef]
  11. Mills, P.; Astling, E. Detection of tropopause penetrations by intense convection with GOES enhanced infrared imagery. In Proceedings of the 10th Conference on Severe Local Storms, Omaha, NE, USA, 18–21 October 1977; pp. 61–64. [Google Scholar]
  12. Reynolds, D.W. Observations of damaging hailstorms from geosynchronous satellite digital data. Mon. Weather Rev. 1980, 108, 337–348. [Google Scholar] [CrossRef]
  13. Negri, A.J.; Adler, R.F. Relation of satellite-based thunderstorm intensity to radar-estimated rainfall. J. Appl. Meteorol. 1981, 20, 288–300. [Google Scholar] [CrossRef]
  14. Glickman, T. (Ed.) Gloss. Meteorology, 2nd ed.; American Meteorological Society: Boston, MA, USA, 2000; p. 855. [Google Scholar]
  15. Negri, A.J. Cloud-top structure of tornado storms on 10 April 1979 from rapid scan and stereo satellite observations. Bull. Am. Meteorol. Soc. 1982, 63, 1851–1859. [Google Scholar] [CrossRef] [Green Version]
  16. McCann, D.W. The enhanced-V: A satellite observable severe storm signature. Mon. Weather Rev. 1983, 111, 887–894. [Google Scholar] [CrossRef]
  17. Brunner, J.C.; Ackerman, S.A.; Bachmeier, A.S.; Rabin, R.M. A quantitative analysis of the enhanced-V feature in relation to severe weather. Weather Forecast. 2007, 22, 853–872. [Google Scholar] [CrossRef]
  18. Setvák, M.; Lindsey, D.T.; Novák, P.; Wang, P.K.; Radová, M.; Kerkmann, J.; Grasso, L.; Su, S.-H.; Rabin, R.M.; Šťástka, J.; et al. Satellite observed cold-ring-shaped features atop deep convective clouds. Atmos. Res. 2010, 97, 80–96. [Google Scholar] [CrossRef]
  19. Homeyer, C.R.; McAuliffe, J.D.; Bedka, K.M. On the development of above-anvil cirrus plumes in extratropical convection. J. Atmos. Sci. 2017, 74, 1617–1633. [Google Scholar] [CrossRef]
  20. Bedka, K.; Murillo, E.M.; Homeyer, C.R.; Scarino, B.; Mersiovsky, H. The above-anvil cirrus plume: An important severe weather indicator in visible and infrared satellite imagery. Weather Forecast. 2018, 33, 1159–1181. [Google Scholar] [CrossRef]
  21. Heymsfield, G.M.; Fulton, R.; Spinhirne, J.D. Aircraft overflight measurements of Midwest severe storms: Implications on geosynchronous satellite interpretations. Mon. Weather Rev. 1991, 119, 436–456. [Google Scholar] [CrossRef]
  22. Heymsfield, G.M.; Blackmer, R.H., Jr. Satellite-observed characteristics of Midwest severe thunderstorm anvils. Mon. Weather Rev. 1988, 116, 2200–2224. [Google Scholar] [CrossRef]
  23. Fujita, T.T. The Teton–Yellowstone tornado of 21 July 1987. Mon. Weather Rev. 1989, 117, 1913–1940. [Google Scholar] [CrossRef]
  24. Dworak, R.; Bedka, K.M.; Brunner, J.; Feltz, W. Comparison between GOES-12 overshooting top detections, WSR-88D radar reflectivity, and severe storm reports. Weather Forecast. 2012, 27, 684–699. [Google Scholar] [CrossRef] [Green Version]
  25. Brooks, H.E.; Lee, J.W.; Craven, J.P. The spatial distribution of severe thunderstorm and tornado environments from global reanalysis data. Atmos. Res. 2003, 67, 73–94. [Google Scholar] [CrossRef]
  26. Kunz, M. The skill of convective parameters and indices to predict isolated and severe thunderstorms. Nat. Hazards Earth Syst. Sci. 2007, 7, 327–342. [Google Scholar] [CrossRef] [Green Version]
  27. Taszarek, M.; Allen, J.T.; Púcik, T.; Hoogewind, K.A.; Brooks, H.E. Severe convective storms across Europe and the United States. Part II: ERA5 environments associated with lightning, large hail, severe wind, and tornadoes. J. Clim. 2020, 33, 10263–10286. [Google Scholar] [CrossRef]
  28. Taszarek, M.; Brooks, H.E.; Czernecki, B. Sounding-derived parameters associated with convective hazards in Europe. Mon. Weather Rev. 2017, 145, 1511–1528. [Google Scholar] [CrossRef]
  29. Pilguj, N.; Taszarek, M.; Kryza, M.; Brooks, H.E. Reconstruction of Violent Tornado Environments in Europe: High-Resolution Dynamical Downscaling of ERA5. Geophys. Res. Lett. 2022, 49, e2022GL098242. [Google Scholar] [CrossRef]
  30. Rodríguez, O.; Bech, J. Tornadic environments in the Iberian Peninsula and the Balearic Islands based on ERA5 reanalysis. Int. J. Climatol. 2021, 41, E1959–E1979. [Google Scholar] [CrossRef]
  31. Avolio, E.; Miglietta, M.M. Tornadoes in the Tyrrhenian regions of the Italian peninsula: The case study of 28 July 2019. Atmos. Res. 2022, 278, 106285. [Google Scholar] [CrossRef]
  32. Chernokulsky, A.; Shikhov, A.; Bykov, A.; Kalinin, N.; Kurgansky, M.; Sherstyukov, B.; Yarinich, Y. Diagnosis and modelling of two destructive derecho events in European Russia in the summer of 2010. Atmos. Res. 2022, 267, 105928. [Google Scholar] [CrossRef]
  33. Chernokulsky, A.V.; Eliseev, A.V.; Kozlov, F.A.; Korshunova, N.N.; Kurgansky, M.V.; Mokhov, I.I.; Semenov, V.A.; Shvets’, N.V.; Shikhov, A.N.; Yarinich, Y.I. Atmospheric severe convective events in Russia: Changes observed from different data. Russ. Meteorol. Hydrol. 2022, 47, 343–354. [Google Scholar] [CrossRef]
  34. Chernokulsky, A.V.; Shikhov, A.N.; Azhigov, I.O.; Eroshkina, N.A.; Korenev, D.P.; Bykov, A.V.; Kalinin, N.A.; Kurgansky, M.V.; Pavlyukov, Y.B.; Sprygin, A.A.; et al. Squalls and Tornadoes in the European Part of Russia on 15 May 2021: Diagnostics and Modeling. Russ. Meteorol. Hydrol. 2022, in press. [Google Scholar]
  35. Hersbach, H.; Bell, B.; Berrisford, P.; Hirahara, S.; Horányi, A.; Muñoz-Sabater, J.; Nicolas, J.; Peubey, C.; Radu, R.; Schepers, D.; et al. The ERA5 global reanalysis. Q. J. R. Meteorol. Soc. 2020, 146, 1999–2049. [Google Scholar] [CrossRef]
  36. Coffer, B.E.; Taszarek, M.; Parker, M.D. Near-ground wind profiles of tornadic and nontornadic environments in the United States and Europe from ERA5 reanalyses. Weather Forecast. 2020, 35, 2621–2638. [Google Scholar] [CrossRef]
  37. Punge, H.J.; Bedka, K.M.; Kunz, M.; Reinbold, A. Hail frequency estimation across Europe based on a combination of overshooting top detections and the ERA-INTERIM reanalysis. Atmos. Res. 2017, 198, 34–43. [Google Scholar] [CrossRef]
  38. Bukharov, M.V.; Kukharskii, A.V.; Misnik, L.A. Automated work place “Planeta-Meteoobzor” for monitoring hazardous weather associated with convective clouds. Russ. Meteorol. Hydrol. 2008, 33, 102–105. [Google Scholar] [CrossRef]
  39. Volkova, E.V.; Uspensky, A.B.; Kukharsky, A.V. Specialized complex of programs for retrieving and validating satellite estimates of cloud and precipitation. Sovrem. Probl. Distantsionnogo Zondirovaniya Zemli Iz Kosm. 2015, 12, 7–26. (In Russian) [Google Scholar]
  40. Klaes, K.D.; Holmlund, K. An update on EUMETSAT programmes and plans. In Proceedings of the SPIE Optical Engineering + Applications, San Diego, CA, USA, 9–13 August 2015. [Google Scholar] [CrossRef]
  41. Shikhov, A.N.; Chernokulsky, A.V.; Sprygin, A.A.; Azhigov, I.O. Identification of mesoscale convective cloud systems with tornadoes using satellite data. Sovrem. Probl. Distantsionnogo Zondirovaniya Zemli Iz Kosm. 2019, 16, 223–236. (In Russian) [Google Scholar] [CrossRef]
  42. Sprygin, A.A. Parameters of long-lived severe convective structures in the European part of Russia and neighboring territories and the possibility to unify their forecast. Hydrometeorol. Stud. Forecast. 2020, 375, 21–47. (In Russian) [Google Scholar] [CrossRef]
  43. Chernokulsky, A.; Shikhov, A.; Bykov, A.; Azhigov, I. Satellite-based Study and Numerical Forecasting of Two Tornado Outbreaks in the Ural Region in June 2017. Atmosphere 2020, 11, 1146. [Google Scholar] [CrossRef]
  44. Chernokulsky, A.V.; Kurgansky, M.V.; Mokhov, I.I.; Shikhov, A.N.; Azhigov, I.O.; Selezneva, E.V.; Zakharchenko, D.I.; Antonescu, B.; Kuhne, T. Tornadoes in the Russian Regions. Russ. Meteorol. Hydrol. 2021, 46, 69–82. [Google Scholar] [CrossRef]
  45. Shikhov, A.N.; Chernokulsky, A.V.; Azhigov, I.O.; Semakina, A.V. A satellite-derived database for stand-replacing windthrow events in boreal forests of European Russia in 1986–2017. Earth Syst. Sci. Data 2020, 12, 3489–3513. [Google Scholar] [CrossRef]
  46. Shikhov, A.N.; Chernokulsky, A.V.; Azhigov, I.O. Spatio-temporal distribution and origins of windthrow events in the forest zone of Western Siberia in 2001–2020. Sovrem. Probl. Distantsionnogo Zondirovaniya Zemli Iz Kosm. 2022, 19, 186–202. (In Russian) [Google Scholar] [CrossRef]
  47. Hansen, M.C.; Potapov, P.V.; Moore, R.; Hancher, M.; Turubanova, S.A.; Tyukavina, A.; Thau, D.; Stehman, S.V.; Goetz, S.J.; Loveland, T.R.; et al. High-Resolution Global Maps of 21st-Century Forest Cover Change. Science 2013, 342, 850–853. [Google Scholar] [CrossRef] [PubMed] [Green Version]
  48. Wind Science and Engineering Center (WSEC). A Recommendation for an Enhanced Fujita Scale (EFscale). 2006. Available online: https://www.spc.noaa.gov/faq/tornado/EFScale.pdf (accessed on 31 August 2022).
  49. The International Fujita (IF) Scale. Tornado and Wind Damage Assessment Guide. Draft Version 0.1 of 15 October 2018. Available online: https://www.essl.org/media/publications/IF-scale_v0.10.pdf (accessed on 31 August 2022).
  50. Groenemeijer, P.; Púčik, T.; Holzer, A.M.; Antonescu, B.; Riemann-Campe, K.; Schultz, D.M.; Kühne, T.; Feuerstein, B.; Brooks, H.E.; Doswell, C.A.; et al. Severe convective storms in Europe: Ten years of research and education at the European Severe Storms Laboratory. Bull Am. Meteorol. Soc. 2017, 98, 2641–2651. [Google Scholar] [CrossRef]
  51. EUMETSAT Earth Observation Portal. Available online: https://eoportal.eumetsat.int/userMgmt/login.faces (accessed on 31 August 2022).
  52. SEVIRI HRV Cloud RGB Quick Guide. Available online: https://www-cdn.eumetsat.int/files/2020-04/pdf_rgb_quick_guide_hrv_cloud.pdf (accessed on 31 August 2022).
  53. Radová, M.; Seidl, J. Parallax applications when comparing radar and satellite data. In Proceedings of the 2008 EUMETSAT Meteorological Satellite Conference, Darmstadt, Germany, 8–12 September 2008; p. 52, ISBN 978-92-9110-082-8. [Google Scholar]
  54. Orlanski, I. A rational subdivision of scales for atmospheric processes. Bull. Am. Meteorol. Soc. 1975, 56, 527–530. [Google Scholar]
  55. Maddox, R.A. Mesoscale convective complexes. Bull. Am. Meteorol. Soc. 1980, 61, 1374–1387. [Google Scholar] [CrossRef]
  56. National Severe Storms Laboratory. Thunderstorm Types. Available online: https://www.nssl.noaa.gov/education/svrwx101/thunderstorms/types/ (accessed on 7 July 2021).
  57. NWS. National Weather Service. What Is a Supercell? 2021. Available online: https://www.weather.gov/ama/supercell. (accessed on 31 August 2022).
  58. Apke, J.M.; Mecikalski, J.R.; Jewett, C.P. Analysis of Mesoscale Atmospheric Flows above Mature Deep Convection Using Super Rapid Scan Geostationary Satellite Data. J. Appl. Meteorol. Climatol. 2016, 55, 1859–1887. [Google Scholar] [CrossRef]
  59. Levizzani, V.; Setvák, M. Multispectral, High-Resolution Satellite Observations of Plumes on Top of Convective Storms. J. Atmos. Sci. 1996, 53, 361–369. [Google Scholar] [CrossRef]
  60. Weaver, J.; Knaff, J.; Bikos, D.; Wade, G.; Daniels, J. Satellite Observations of a Severe Supercell Thunderstorm on 24 July 2000 Made during the GOES-11 Science Test. Weather Forecast. 2002, 17, 124–138. [Google Scholar] [CrossRef]
  61. Mikuš, P.; Strelec Mahović, N. Satellite-based overshooting top detection methods and an analysis of correlated weather conditions. Atmos. Res. 2013, 123, 268–280. [Google Scholar] [CrossRef]
  62. Adler, R.F.; Markus, M.M.; Fenn, D.D. Detection of severe Midwest thunderstorms using geosynchronous satellite data. Mon. Weather Rev. 1985, 113, 769–781. [Google Scholar] [CrossRef]
  63. Schmetz, J.; Tjemkes, S.A.; Gube, M.; van de Berg, L. Monitoring deep convection and convective overshooting with METEOSAT. Adv. Space Res. 1997, 19, 433–441. [Google Scholar] [CrossRef]
  64. Bedka, K.M.; Brunner, J.; Dworak, R.; Feltz, W.; Otkin, J.; Greenwald, T. Objective satellite-based overshooting top detection using infrared window channel brightness temperature gradients. J. Appl. Meteorol. Climatol. 2010, 49, 181–202. [Google Scholar] [CrossRef]
  65. Kim, M.; Im, J.; Park, H.; Park, S.; Lee, M.-I.; Ahn, M.-H. Detection of tropical overshooting cloud tops using himawari-8 imagery. Remote Sens. 2017, 9, 685. [Google Scholar] [CrossRef] [Green Version]
  66. Lee, J.; Kim, M.; Im, J.; Han, H.; Han, D. Pre-trained feature aggregated deep learning-based monitoring of overshooting tops using multi-spectral channels of GeoKompsat-2A advanced meteorological imagery. GIScience Remote Sens. 2021, 58, 1052–1071. [Google Scholar] [CrossRef]
  67. Wang, G.; Wang, H.; Zhuang, Y.; Wu, Q.; Chen, S.; Kang, H. Tropical overshooting cloud-top height retrieval from himawari-8 imagery based on random forest model. Atmosphere 2021, 12, 173. [Google Scholar] [CrossRef]
  68. Kim, M.; Lee, J.; Im, J. Deep learning-based monitoring of overshooting cloud tops from geostationary satellite data. GIScience Remote Sens. 2018, 55, 763–792. [Google Scholar] [CrossRef]
  69. Cintineo, J.L.; Pavolonis, M.J.; Sieglaff, J.M.; Wimmers, A.; Brunner, J.; Bellon, W. A deep-learning model for automated detection of intense midlatitude convection using geostationary satellite images. Weather Forecast. 2020, 35, 2567–2588. [Google Scholar] [CrossRef]
  70. Proud, S.R. Analysis of overshooting top detections by Meteosat Second Generation: A 5-year dataset. Q. J. R. Meteorol. Soc. 2015, 141, 909–915. [Google Scholar] [CrossRef]
  71. Punge, H.; Bedka, K.; Kunz, M.; Werner, A. A new physically based stochastic event catalog for hail in Europe. Nat. Hazards 2014, 73, 1625–1645. [Google Scholar] [CrossRef]
  72. Taszarek, M.; Pilguj, N.; Allen, J.T.; Gensini, V.; Brooks, H.E.; Szuster, P. Comparison of Convective Parameters Derived from ERA5 and MERRA-2 with Rawinsonde Data over Europe and North America. J. Clim. 2021, 34, 3211–3237. [Google Scholar] [CrossRef]
  73. Potvin, C.K.; Elmore, K.L.; Weiss, S.J. Assessing the impacts of proximity sounding criteria on the climatology of significant tornado environments. Weather Forecast. 2010, 25, 921–930. [Google Scholar] [CrossRef]
  74. Marion, G.R.; Trapp, R.J. Controls of Quasi-Linear Convective System Tornado Intensity. J. Atmos. Sci. 2021, 78, 1189–1205. [Google Scholar] [CrossRef]
  75. Sherburn, K.D.; Parker, M.D.; King, J.R.; Lackmann, G.M. Composite environments of severe and nonsevere high-shear, low-CAPE convective events. Weather Forecast. 2016, 31, 1899–1927. [Google Scholar] [CrossRef]
  76. Shikhov, A.N.; Kalinin, N.A.; Bykov, A.V.; Azhigov, I.O.; Shumikhina, A.V. Tornadoes in the environments of weak convective instability: Analysis of two cases in the eastern part of the European Russia. Sovrem. Probl. Distantsionnogo Zondirovaniya Zemli Iz Kosm. 2020, 17, 255–268. (In Russian) [Google Scholar] [CrossRef]
  77. Taszarek, M.; Groenemeijer, P.; Allen, J.T.; Edwards, R.; Brooks, H.E.; Chmielewski, V.; Enno, S.E. Severe convective storms across Europe and the United States. Part I: Climatology of lightning, large hail, severe wind, and tornadoes. J. Clim. 2020, 33, 10239–10261. [Google Scholar] [CrossRef]
  78. Kalinin, N.A.; Shikhov, A.N.; Chernokulsky, A.V.; Kostarev, S.V.; Bykov, A.V. Environments of Formation of Severe Squalls and Tornadoes Causing Large-scale Windthrows in the Forest Zone of European Russia and the Ural. Russ. Meteorol. Hydrol. 2021, 46, 83–93. [Google Scholar] [CrossRef]
  79. Dmitrieva, T.G.; Peskov, B.E. Numerical forecast with the mesosynoptic specification of extremely severe squalls in the European part of Russia (Case study for 13 June and 29 July 2010). Russ. Meteorol. Hydrol. 2013, 38, 71–79. [Google Scholar] [CrossRef]
  80. Rotunno, R.; Klemp, J.B.; Weisman, M.L. A Theory for strong, Long-Lived Squall Lines. J. Atmos. Sci. 1988, 45, 463–485. [Google Scholar] [CrossRef]
  81. Jurković, P.M.; Mahović, N.S.; Počakal, D. Lightning, overshooting top and hail characteristics for strong convective storms in central Europe. Atmos. Res. 2015, 161, 153–168. [Google Scholar] [CrossRef]
  82. Droegemeier, K.K.; Lazarus, S.M.; Davies-Jones, R. The influence of helicity on numerically simulated convective storms. Mon. Weather Rev. 1993, 121, 2005–2029. [Google Scholar] [CrossRef]
  83. Moscow Storm Kills 16, Injures Nearly 170. Available online: https://edition.cnn.com/2017/05/30/europe/moscow-storm/index.html (accessed on 31 August 2022).
  84. Grieser, J. Convection Parameters. 2012. Available online: http://www.juergen-grieser.de/CovectionParameters/ConvectionParameters.pdf (accessed on 11 October 2022).
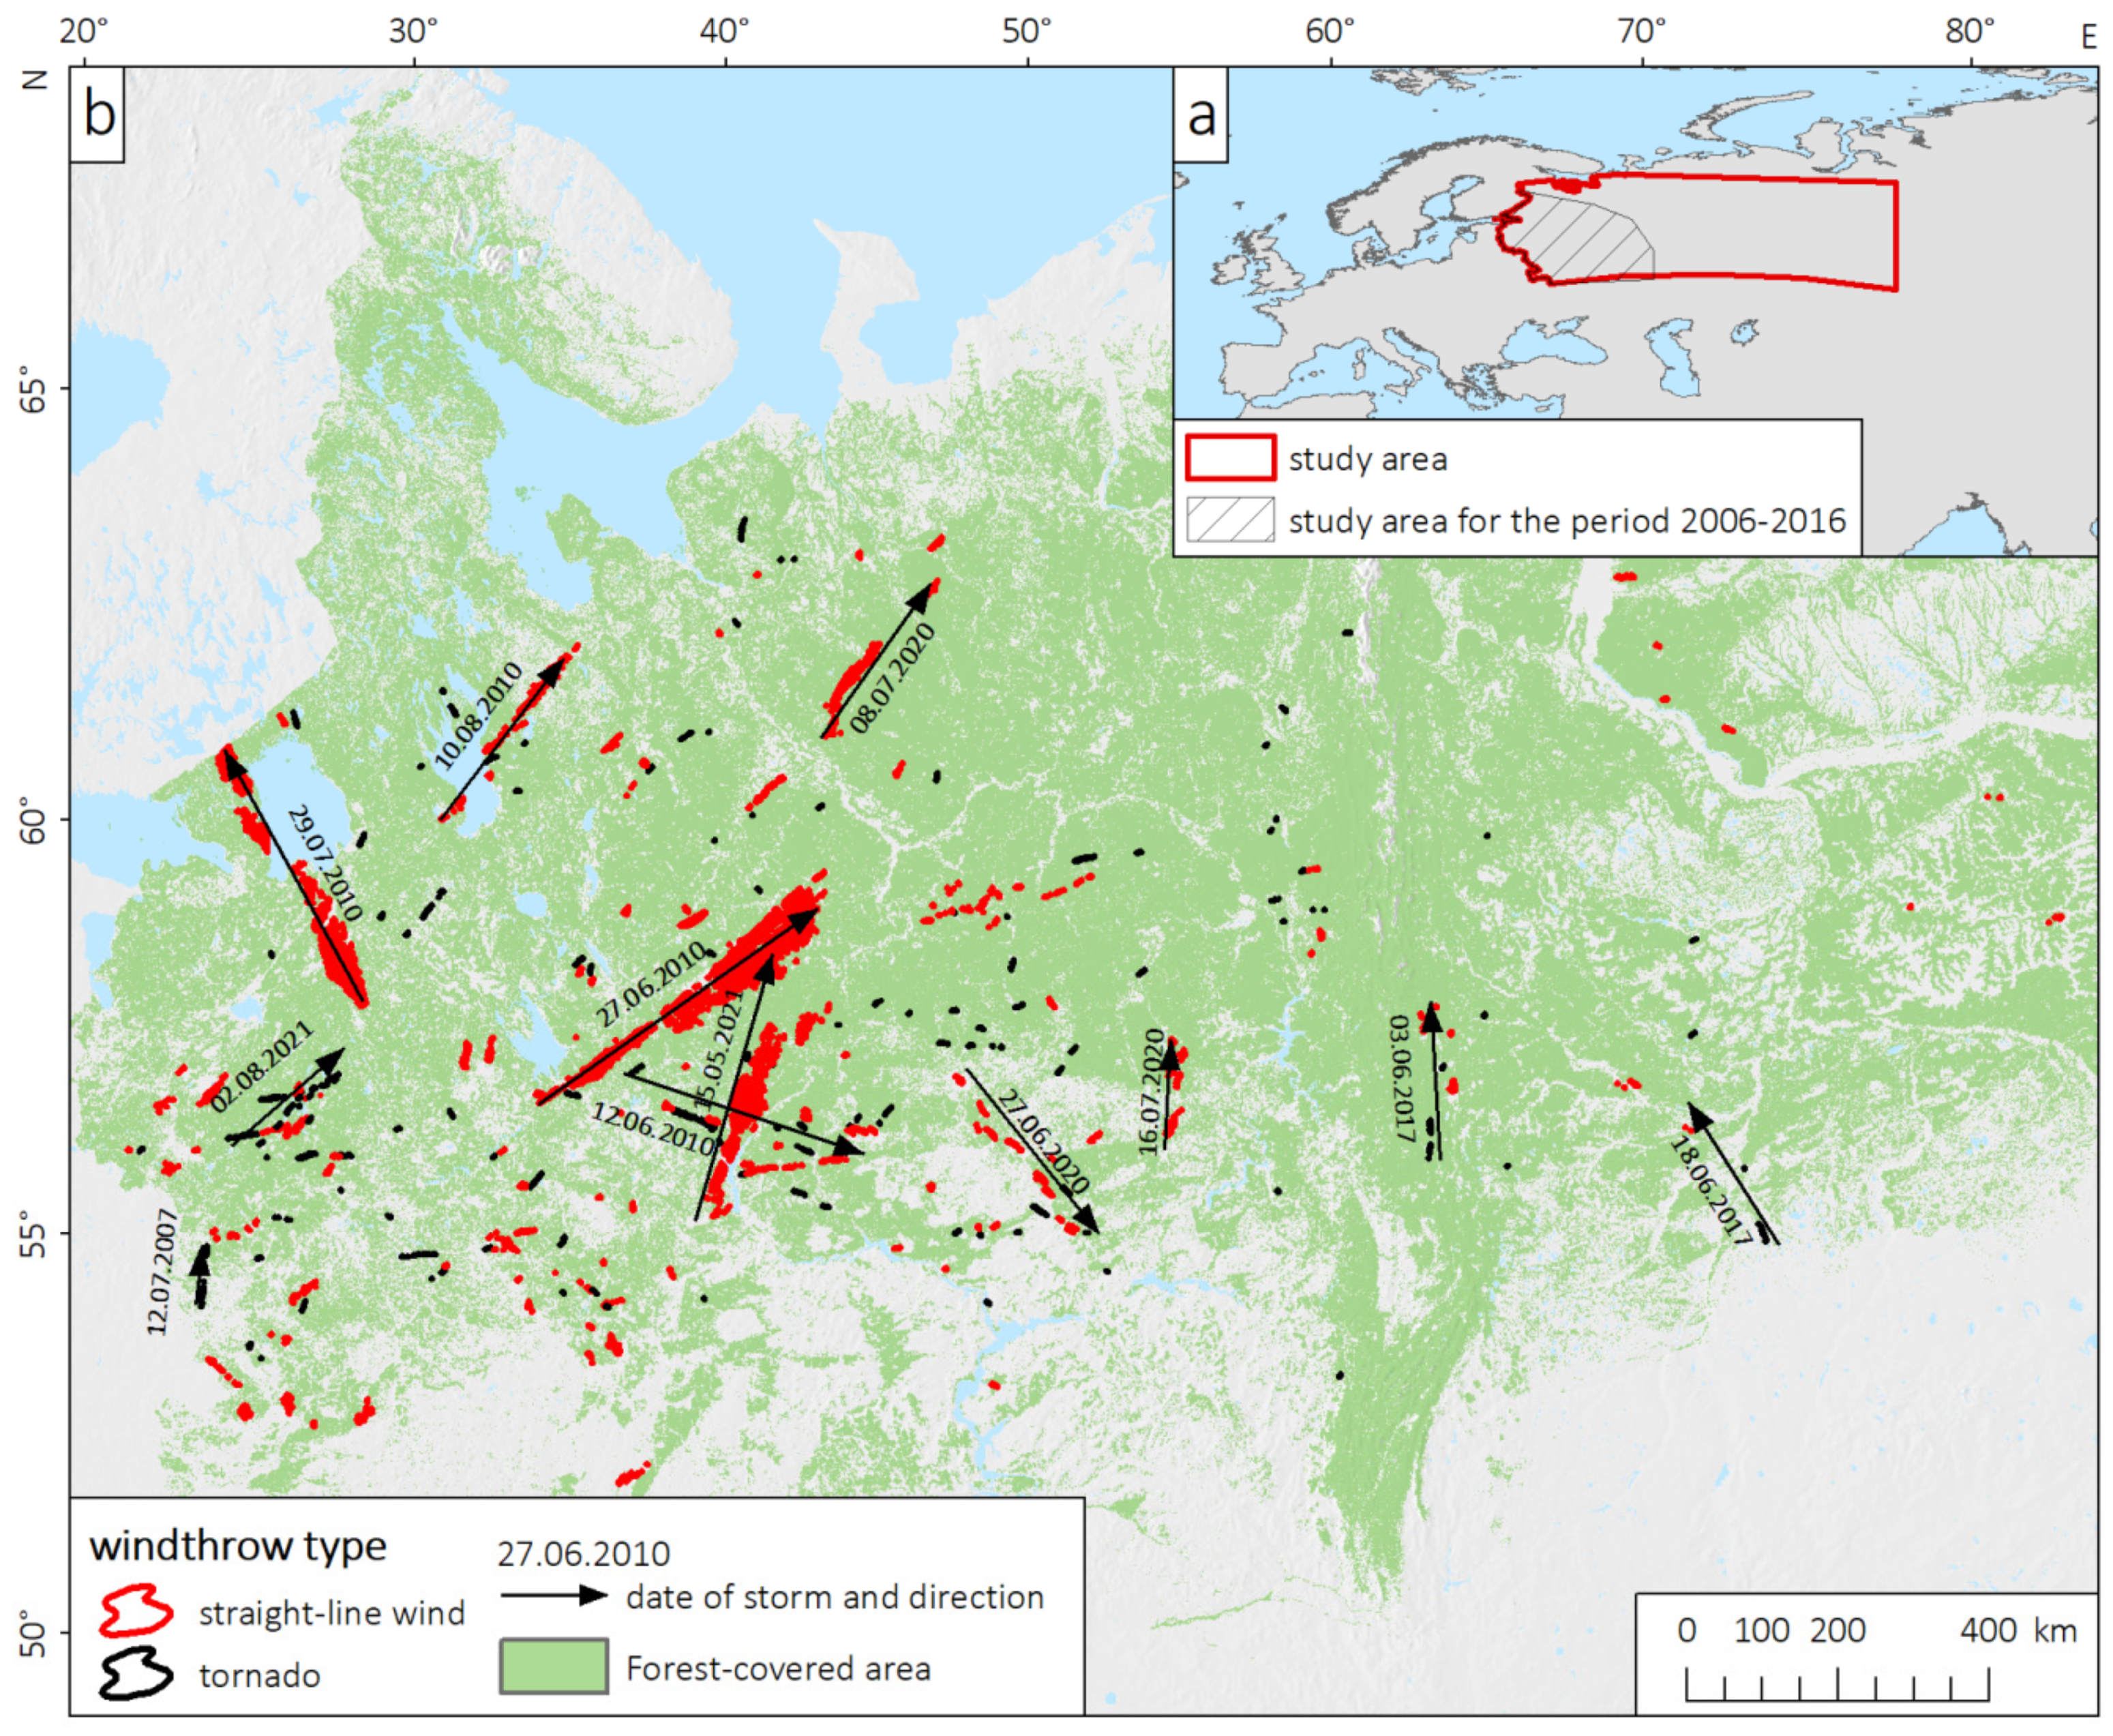
Figure 1. (a)—Geographical location of the study area, and (b)—the analyzed sample of windthrow events (shown with red for straight-line winds and black for tornadoes). The dates and propagation direction of the most severe storms are also shown.
Atmosphere 14 00174 g001
Figure 2. An example of estimation of the characteristics of an isolated supercell storm which caused forest damage (black areas), based on the MSG2 image (IRW 10.8 µm channel, 4 August 2021, 12.00 UTC): (a)—characteristics of the storm itself, (b)—characteristics of its cold-U signature.
Atmosphere 14 00174 g002
Figure 3. Examples of the MSG2 images (HRVcloud RGB composite—left column, IRW10.8 channel—right column) of the convective storms that induced windthrow events: (a,b)—supercell on 19 August 2019, 12.00 UTC; (c,d)—squall line on August 2, 2017, 14.30 UTC; (e,f)—MCC on 15 May 2021 (14.00 UTC). Black arrows show the direction of storm movement, green arrows indicate (d)—cold-ring signatures, and (f)—OT signatures.
Atmosphere 14 00174 g003aAtmosphere 14 00174 g003b
Figure 4. The workflow used in this study for mutual analysis of windthrow events, satellite-derived characteristics of convective storms, and environmental variables from the ERA5.
Atmosphere 14 00174 g004
Figure 5. Characteristics of convective storms and related windthrow events: (a) a number of windthrow events (induced by linear windstorms or tornadoes; shown as bars and also as numbers over each bar) associated with different types of convective storms: 1—low-organized cluster, 2—MCC, 3—quasi-linear storm (Meso-β), 4—squall line (quasi-linear storm of meso-α scale), 5—supercell, 6—supercell transformed to MCC, 7—supercell transformed into quasi-linear system; (b) a number of windthrow events per storm; (c) distribution of windthrow events depending on characteristic horizontal size of corresponding convective storm (major axis diameter, DMA); (d) distribution of convective storms depending on their lifetime (orange and yellow colors stand here for storms with and without tornadoes, respectively); (e) distribution of windthrow events depending on the time interval between the formation of the corresponding convective storm and the starting time of the event itself; (f) distribution of minimum temperature on the cloud top associated with windthrow events. The sample size equals 281 for windthrow events and 128 for storms.
Atmosphere 14 00174 g005
Figure 6. (a) Number of the tornado and straight-line winds events formed within a storm of different types associated with various signatures on storm cloud tops, (b) distribution of the signatures depending on their lifetime.
Atmosphere 14 00174 g006
Figure 7. Distribution of various environmental variables separately for tornadoes (138 events) and linear windstorms (141 events). The statistically significant difference between distributions associated with tornadoes or linear windstorms is highlighted.
Atmosphere 14 00174 g007
Figure 8. Distribution of various environmental variables separately for supercells (132 events), quasilinear convective storms (105 events), and mesoscale convective complexes (44 events). The statistically significant difference is highlighted.
Atmosphere 14 00174 g008
Figure 9. (a) Relationships between (a) ML CAPE and minCTT, and (b)—ML WMAXSHEAR and lifetime of convective storms.
Atmosphere 14 00174 g009
Figure 10. Distribution of various environmental variables separately for cloud top signatures including overshooting tops (88 events), cold-ring and cold-U/V signatures (61 events), OTs transformed to CRCUVs (31 events), and cases without signatures (111 events). The statistically significant difference is highlighted.
Atmosphere 14 00174 g010
Table 1. The Spearman rank correlation coefficients between the characteristics of convective storms and the values of environmental variables. Statistically significant (at the 0.05 level) correlations are shown in bold font.
ML LCL, mML LFC. mMLCAPE, J kg−1ML CIN, J kg−1PW, mmDLS, m s−1MLS, m s−1LLS, m s−1ML EHI0–3 kmML WMSSRH1, m2 s−2SRH3, m2 s−2SCPSHIPSTPSWEAT
Values for starting point of a windthrow
DMA0.080.090.23−0.130.310.000.010.330.310.190.220.170.200.060.080.30
minCTT−0.11−0.14−0.380.16−0.36−0.02−0.080.02−0.37−0.33−0.07−0.16−0.21−0.32−0.16−0.44
Storm lifetime0.150.350.44−0.260.290.170.200.010.500.470.150.260.430.520.300.35
Maximum values for 100 km radius around the starting point of a windthrow
DMA0.10−0.030.20 0.21−0.06−0.010.310.280.170.180.120.18−0.010.090.36
minCTT−0.070.01−0.36 −0.240.05−0.060.00−0.34−0.30−0.05−0.11−0.19−0.25−0.11−0.48
Storm lifetime0.180.160.52 0.340.080.170.060.530.480.130.250.390.570.320.41
Disclaimer/Publisher’s Note: The statements, opinions and data contained in all publications are solely those of the individual author(s) and contributor(s) and not of MDPI and/or the editor(s). MDPI and/or the editor(s) disclaim responsibility for any injury to people or property resulting from any ideas, methods, instructions or products referred to in the content.