Article

Intraseasonal Oscillation Features of the Two Types of Persistent High Temperature Events over Jiangnan Region

1
Key Laboratory of Meteorology Disaster, Ministry of Education (KLME), Joint International Research Laboratory of Climate and Environment Change (ILCEC), Collaborative Innovation Center on Forecast and Evaluation of Meteorological Disasters (CIC-FEMD), Nanjing University of Information Science & Technology, Nanjing 210044, China
2
HeBei Meteorological Service Centre, Shijiazhuang 050021, China
3
Taibai County Meteorological Bureau, Baoji 721600, China
*
Author to whom correspondence should be addressed.
Atmosphere 2023, 14(1), 185; https://doi.org/10.3390/atmos14010185
Submission received: 19 December 2022 / Revised: 10 January 2023 / Accepted: 13 January 2023 / Published: 15 January 2023
(This article belongs to the Special Issue Heat Waves: Perspectives from Observations, Reanalysis and Modeling)

Abstract

:
In order to find potential low-frequency signals and provide new ideas for extended-range forecasting, the intraseasonal oscillation (ISO) characteristics of persistent high temperature events (PHTEs) in the extended summer in Jiangnan area are explored by using daily maximum air temperature (Tmax) data from the China Meteorological Data Network and daily reanalysis data provided by NCEP/DOE. The results show that the low-frequency PHTEs can be classified into three types according to the position variation of the Western Pacific subtropical high (WPSH). For the first two types of PHTEs, a southwestward migrating mid-latitude wave train from the North American coast to the central and eastern China can be clearly seen in the whole troposphere. Whereas the two types of PHTEs show different features in the low-latitude. It is found that a significantly westward extension of the WPSH during the first type of PHTEs, with the low-frequency anticyclone moving westward in the mid-lower troposphere. For the second type of PHTEs, the WPSH is mainly located in the southeastern China with slightly movement. Analysis of the low-frequency vertical circulation and the thermodynamic equation further reveal that the increase of temperature in Jiangnan region is primarily attributed to the descending airflow.

1. Introduction

The recent two IPCC assessment reports concluded that in the case of global warming, the frequency and intensity of extreme hot events show an obvious increasing trend [1,2]. Persistent high temperature events (hereafter named PHTEs) occur more than before in many regions of the world (i.e., a series of PHTEs happened in 2010 summer in Europe and North America, in 2022 summer in central and eastern China) [3,4] and pose widespread risks as they not only affect people’s health and national economy but also damage societal infrastructure. Hence, it is crucial to understanding the underlying causes and improving the extended-range forecast skill of PHTEs.
Intraseasonal Oscillation (ISO) is the major predictability source for extended range forecast [5], which is first discovered by Madden and Julian. Studies indicated that the wind fields in Canton Island show an eastward propagation with a significant 40–50-day cycle [6]. The explorations about ISO’s propagation characteristics [7,8,9], initiation mechanism [10,11,12] and influences on weather and climate systems (i.e., global monsoons, tropical cyclones) [13,14,15,16] have become one of the important frontier topics in meteorological research.
Previous studies have emphasized that ISO is closely related to the precipitation and temperature anomalies. The precipitation in the middle and lower reaches of the Yangtze River (MLYR) basin has obvious features of ISO, and the active and break of rainfall are mainly influenced by the oscillation mode with a period of 15–30-day [17]. Meantime, the frequency of extreme precipitation over the MLYR increase and the duration is longer in strong ISO years [18]. Miao et al. [19] found that the low-frequency circulation in the mid-high latitudes and the quasi-biweekly oscillation from the tropical Indian Ocean jointly resulted in the low-frequency precipitation anomalies over South China. The precipitation anomalies increase in south China when the ISO is active in the Indian Ocean and decrease while the ISO active in the western Pacific [20,21].
In recent years, a number of studies have found the noticeable contribution of ISO to high temperature events (hereafter named HTEs). The low-level anticyclonic anomalies related to quasi-biweekly oscillation and the local strong subsidence movement are the main causes of heat waves in the Yangtze River Basin [22]. As for long-lived HTEs, Chen et al. [23] showed that the low-frequency component of 5–25-day plays an important role in triggering and ending HTEs, whereas the 30–90-day component contributed mostly to the sustainable development of high temperature. Hsu et al. [24] pointed out that two different boreal summer intraseasonal oscillation (BSISO) modes proposed by Lee at al. [25] have different contributions to the occurrence of heat waves in the monsoon region. In phase 8–1 of BSISO2, heat waves in the Yangtze River Basin increased when sensible heat fluxes caused by anticyclones and anomalous subsidence increased. Subsequently, Diao et al. [26] found that the frequency of extreme HTEs in the northern hemisphere is higher in phase 1–2 of BSISO1. Moreover, low-frequency wave trains are recognized to have an important impact on HTEs in recent studies. Mstsueda et al. [27] discussed the influence of Madden-Julian Oscillation (MJO) on the frequency of extreme temperature events, and found that the frequency of extreme temperature events in the extratropics is mainly affected by the mid-latitude wave train in response to tropical forcing and the anomalous low-level circulation related to MJO. Gao and You [28] found that the Silk Road pattern along the westerly jet may be related to the low-frequency extreme HTEs in the MLYR. Moreover, Li et al. [29] pointed out that the anticyclone formation during the extreme hot events in mid-eastern China is formed by downstream wave train propagation and westward movement of the WPSH. A case study also showed that the extreme high temperature event in the middle reaches of the Yangtze River is closely related to the westward extension of the WPSH [30].
As discussed above, many previous studies have focused on HTEs in the Yangtze River Basin and south China and achieved some valuable results, whereas little research have been studies in the Jiangnan region. Furthermore, it is not sure if there is influenced systems such as wave train can explain PHTEs in Jiangnan region, and more details are need to further analysis. Thus, the objective of this paper is to discuss the characteristics and evolution of low-frequency circulation during different type of PHTEs, which may deepen the understanding of intraseasonal variations of the Tmax over the Jiangnan region. The remainder of this paper is organized as follows. Section 2 describes the data and methods used in this paper. Section 3 reveals the low-frequency characteristics of the Tmax in Jiangnan region and selects the PHTEs related to the ISO. Section 4 analyzes the ISO characteristics and the evolution of circulation during two types of PHTEs. Evolution of vertical circulation and diagnosis of thermodynamic equation for two types of PHTEs are discussed in Section 5. Finally, a discussion and summary are given in Section 6.

2. Data and Methodology

2.1. Data

The daily maximum air temperature (Tmax) dataset used in this study are extracted from the China Meteorological Data Network, which were derived from gauge observations recorded at 2472 stations in China [31]. The spatial resolution is 0.5° × 0.5°. Daily meteorological fields are retrieved from National Centers for Environment Prediction/Department of Energy (NCEP/DOE) [32], including temperature, geopotential height, zonal wind, meridional wind and vertical p-velocity at 17 pressure levels (1000–10 hPa), with a horizontal resolution of 2.5° × 2.5°. The analysis period for current study spans 38-year from 1981 to 2018, and the extended summer is defined as the period from 1 May to 30 September.

2.2. Method

The core region in this paper is derived from the rotated empirical orthogonal function (REOF) of standardized Tmax minus threshold in the extended summer over China, which result can focus on some local information. Power spectrum analysis is used to extract the dominant period of daily variables in the core region, and then the Lanczos band-pass filter is applied for filtering (the first three harmonics of daily climatology are removed from the raw data before band filtering) to obtain the low-frequency signal.
To describe the structure and evolution of the low-frequency PHTEs, we separate each cycle of the selected ISO events into eight phases. Phase 1 (5) is valley (peak) phase. Phase 3 (7) represents the transition time from negative (positive) phase to positive (negative) phase, and the remaining phases represent the time when the cycle reaches the half of the corresponding peak or valley value [22]. Next, the phase composite analysis is employed to study the common features during the occurrence of PHTEs. Statistical significance for the composite fields based on ISO phases is judged using the student-t test.
To elucidate the influence of diabatic heating on the position change of the WPSH in each type of PHTEs, the complete form of vertical vorticity tendency equation is investigated. In the case of only considering the latent heating, under the maximum heating source the equation can be simplified as follows [33,34]:
β v f + ξ θ z Q 1 z
where left-hand side of Equation (1) denote the β-effect, right-hand side denote the diabatic heating term. In the northern hemisphere, the geostrophic parameter f increases with latitude and always greater than zero, f + ξ ≥ 0, θz is always positive.
Finally, the factors causing local change of temperature can be diagnosed according to the thermodynamic equation. The equation on the intraseasonal scale can be written as follows:
{ T t } = { ( u T x + v T y ) } + { ( Γ d Γ ) ω } + { 1 c p Q ˙ }
The left side of the Equation (2) is the local change of temperature, and the right side is the horizontal temperature advection, adiabatic change and diabatic change, respectively. All symbols follow convention in meteorology.

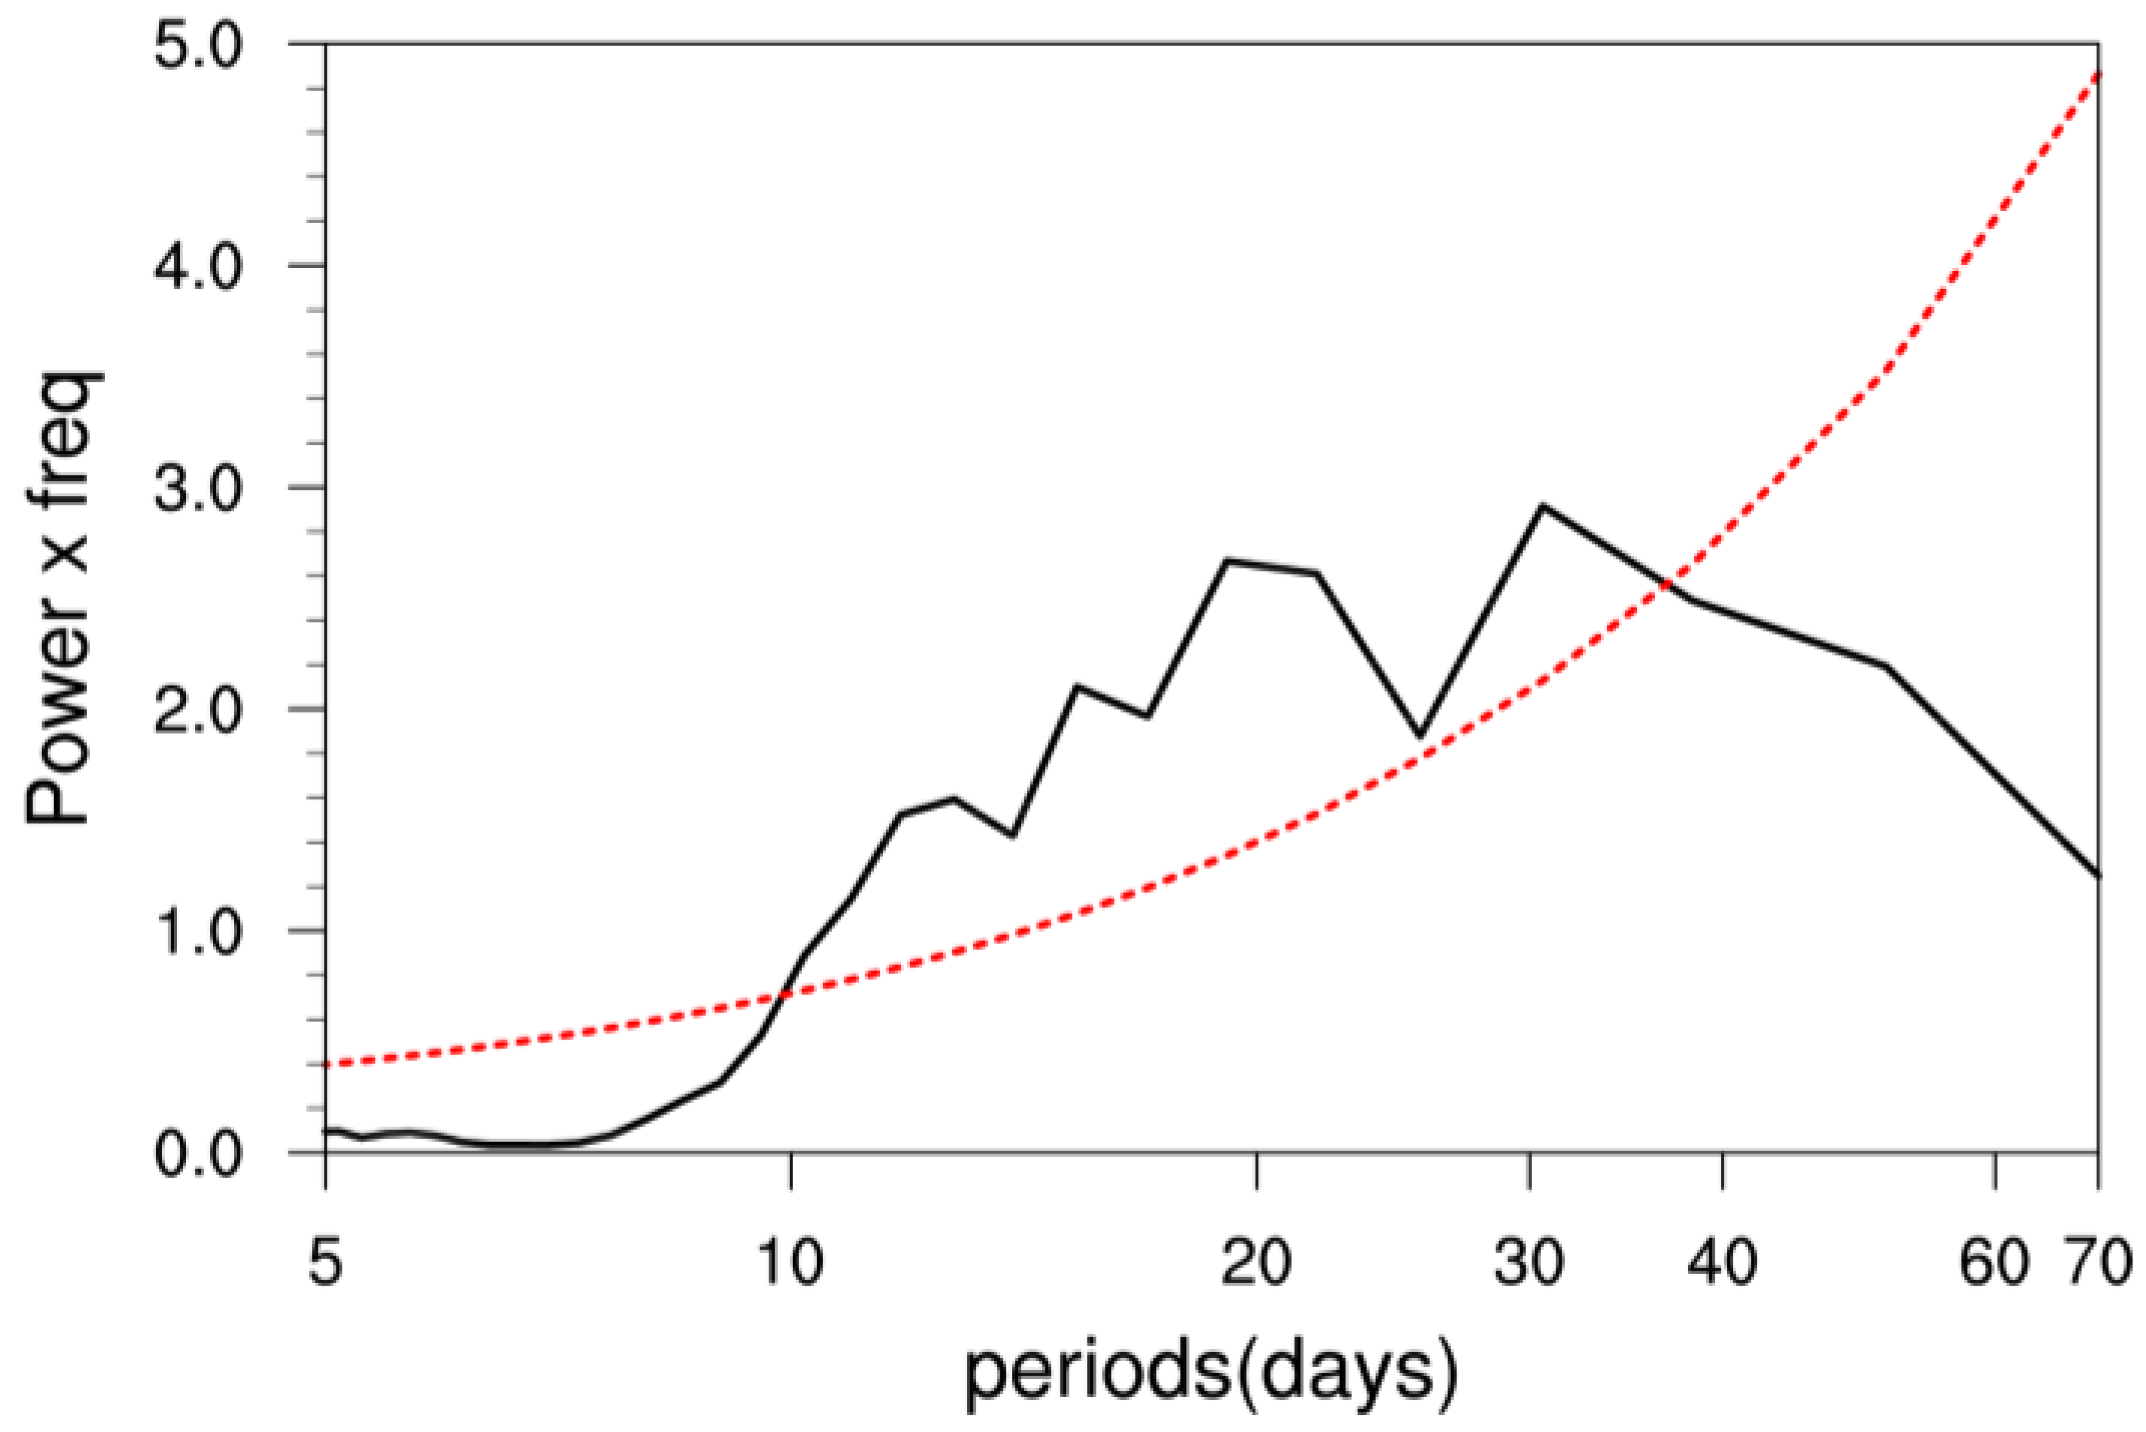
3. Intraseasonal Oscillation Characteristics of Tmax in Jiangnan Region

An empirical orthogonal function (EOF) analysis is performed on the standardized Tmax minus threshold in extended summer from 1981 to 2018, the spatial distribution is relatively complex, and cannot clearly represent the characteristics of different geographical regions. However, the limitations of EOF can be overcome when using the REOF method. Thus, the first seven EOF modes are found to be appropriate for rotation which accounting for more than 70% of total variance. The obtained REOF patterns are shown in Figure 1. Note that the entire China is naturally divided into seven subregions, which named the Xinjiang region, Northeast China, Qinghai-Tibet Plateau, Jiangnan region, North China, Qinghai-Gansu region and Yunnan-Guizhou Plateau, respectively. Consequently, the Jiangnan area (24.5°–31.5° N, 108°–122° E, marked by a black rectangle) is selected as the core region of this paper, and the core region mentioned below all refer to the Jiangnan region.
Referring to the definition of modest but long-lasting hot wave proposed by Hsu et al. [24], this paper uses the 85th percentile threshold to select the PHTEs. The Tmax from 1981 to 2018 is arranged in ascending order each year separately and then the 85th percentile of the Tmax is obtained as the high temperature threshold value of the grid point in the year. A PHTE is defined as equal or more than 5 consecutive days (maximum interruptions of one day are allowed) with averaged Tmax over Jiangnan region exceeding regional averaged threshold. Among the low-frequency fluctuations corresponding to a PHTE, the high temperature event with the maximum amplitude exceeding 0.5 standard deviation is defined as a PHTE related to ISO. To investigate the dominant intraseasonal periodicity of ISO, power spectrum analysis is applied to the time series of Tmax over the Jiangnan region. After removing the annual cycle and synoptic fluctuations, an area-averaged Tmax is then subject to a power spectrum analysis year by year. Finally, the averaged power spectrum result of 38 years from 1981 to 2018 is obtained, as portrayed in Figure 2. The result show that the Tmax in Jiangnan region mainly has an obvious period of 10–30-day (hereafter 10–30 d). Therefore, total 37 PHTEs related to ISO are identified according to the above method, and the PHTEs are mainly concentrated on July-August.
According to Gao et al. [30], the spatially nonuniform distribution of diabatic heating will affect the position of the Western Pacific subtropical high (WPSH). However, whether all PHTEs are influenced by diabatic heating which lead to the westward extension of the subtropical high need further analysis. Thus, 37 PHTEs associated to the ISO are classified into three categories using case-by-case method according to the position and movement of the WPSH. The first type of PHTEs (hereafter referred to as type I events) is mainly characterized by the apparent westward movement of WPSH during the high temperature processes, while the second type of the PHTEs (hereafter referred to as type II events) is characterized by weak WPSH activity which mainly locates in the southeastern China, with slightly northward or westward movement. Among 37 PHTEs, 23 specific high temperature cases belong to type I events and 9 cases belong to type II events. For the third type of PHTEs, owing to the main body of the WPSH locating over sea during the PHTEs and few cases, this paper mainly focuses on the first two types of PHTEs (Table 1). In Section 4, we will discuss the influence of diabatic heating on WPSH and then analyze how the ISO may exert influences on the first two types of PHTEs.

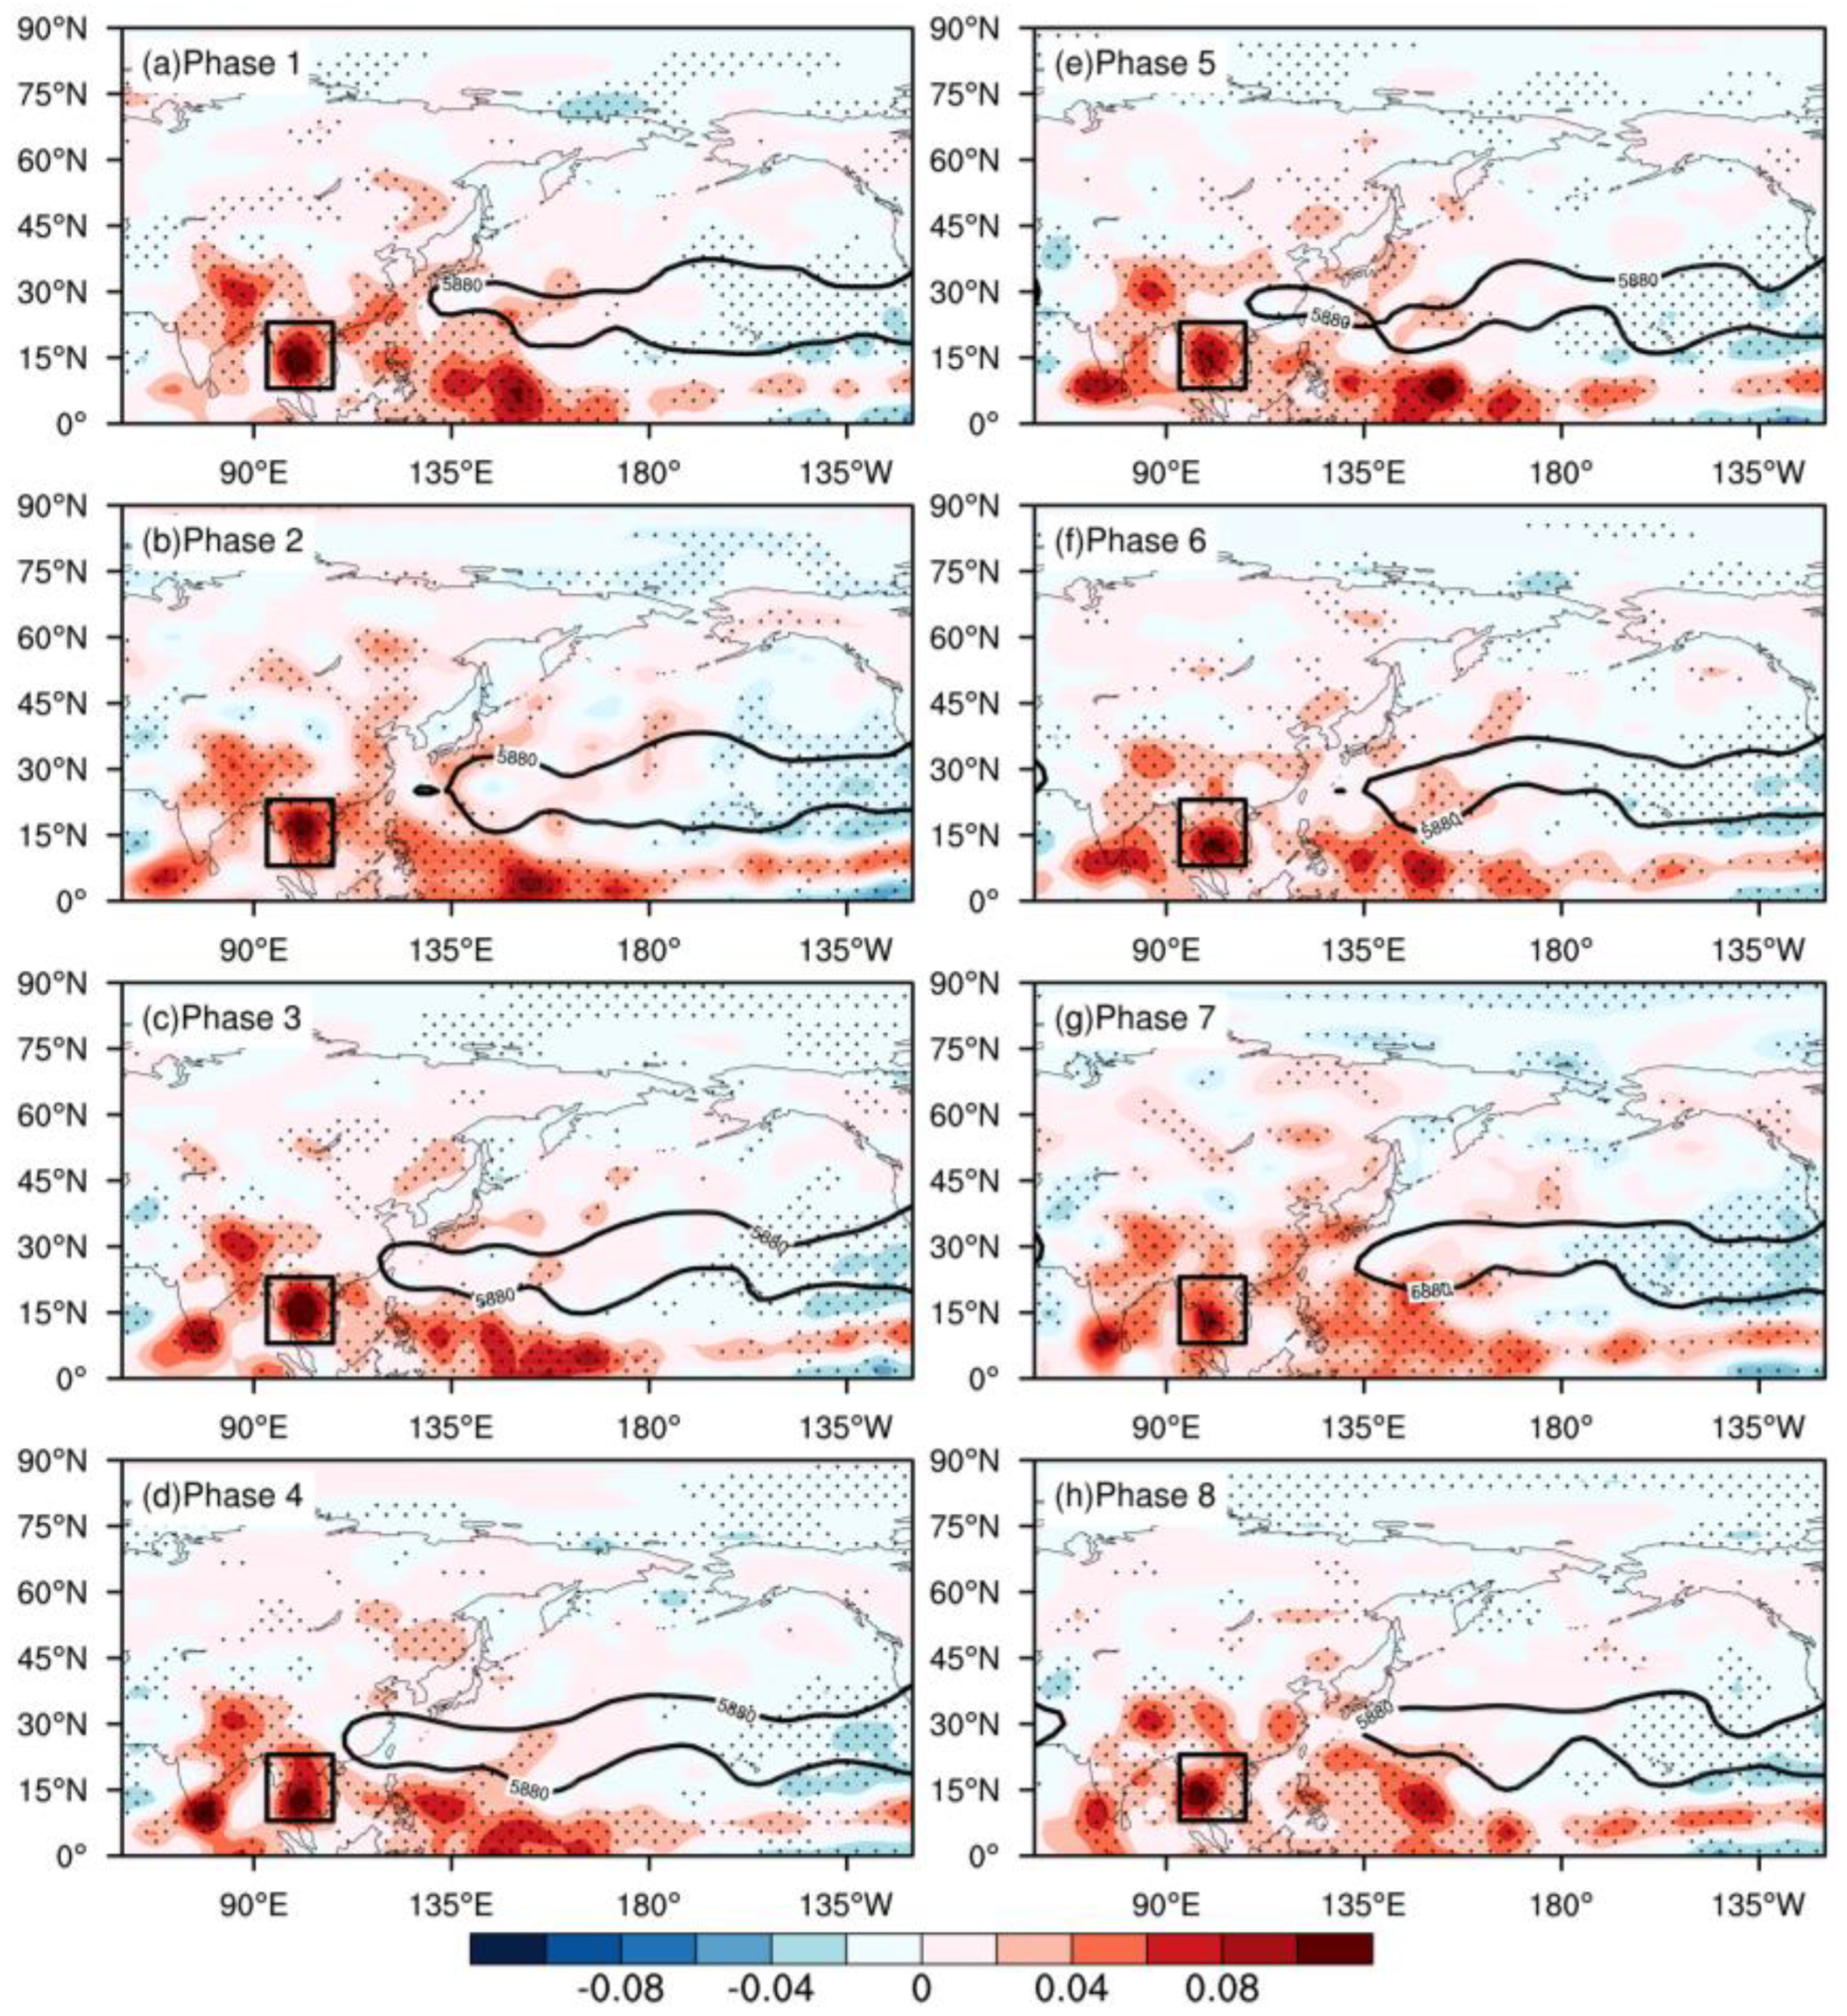
4. Spatio-Temporal Evolutions of Two Types of PHTEs

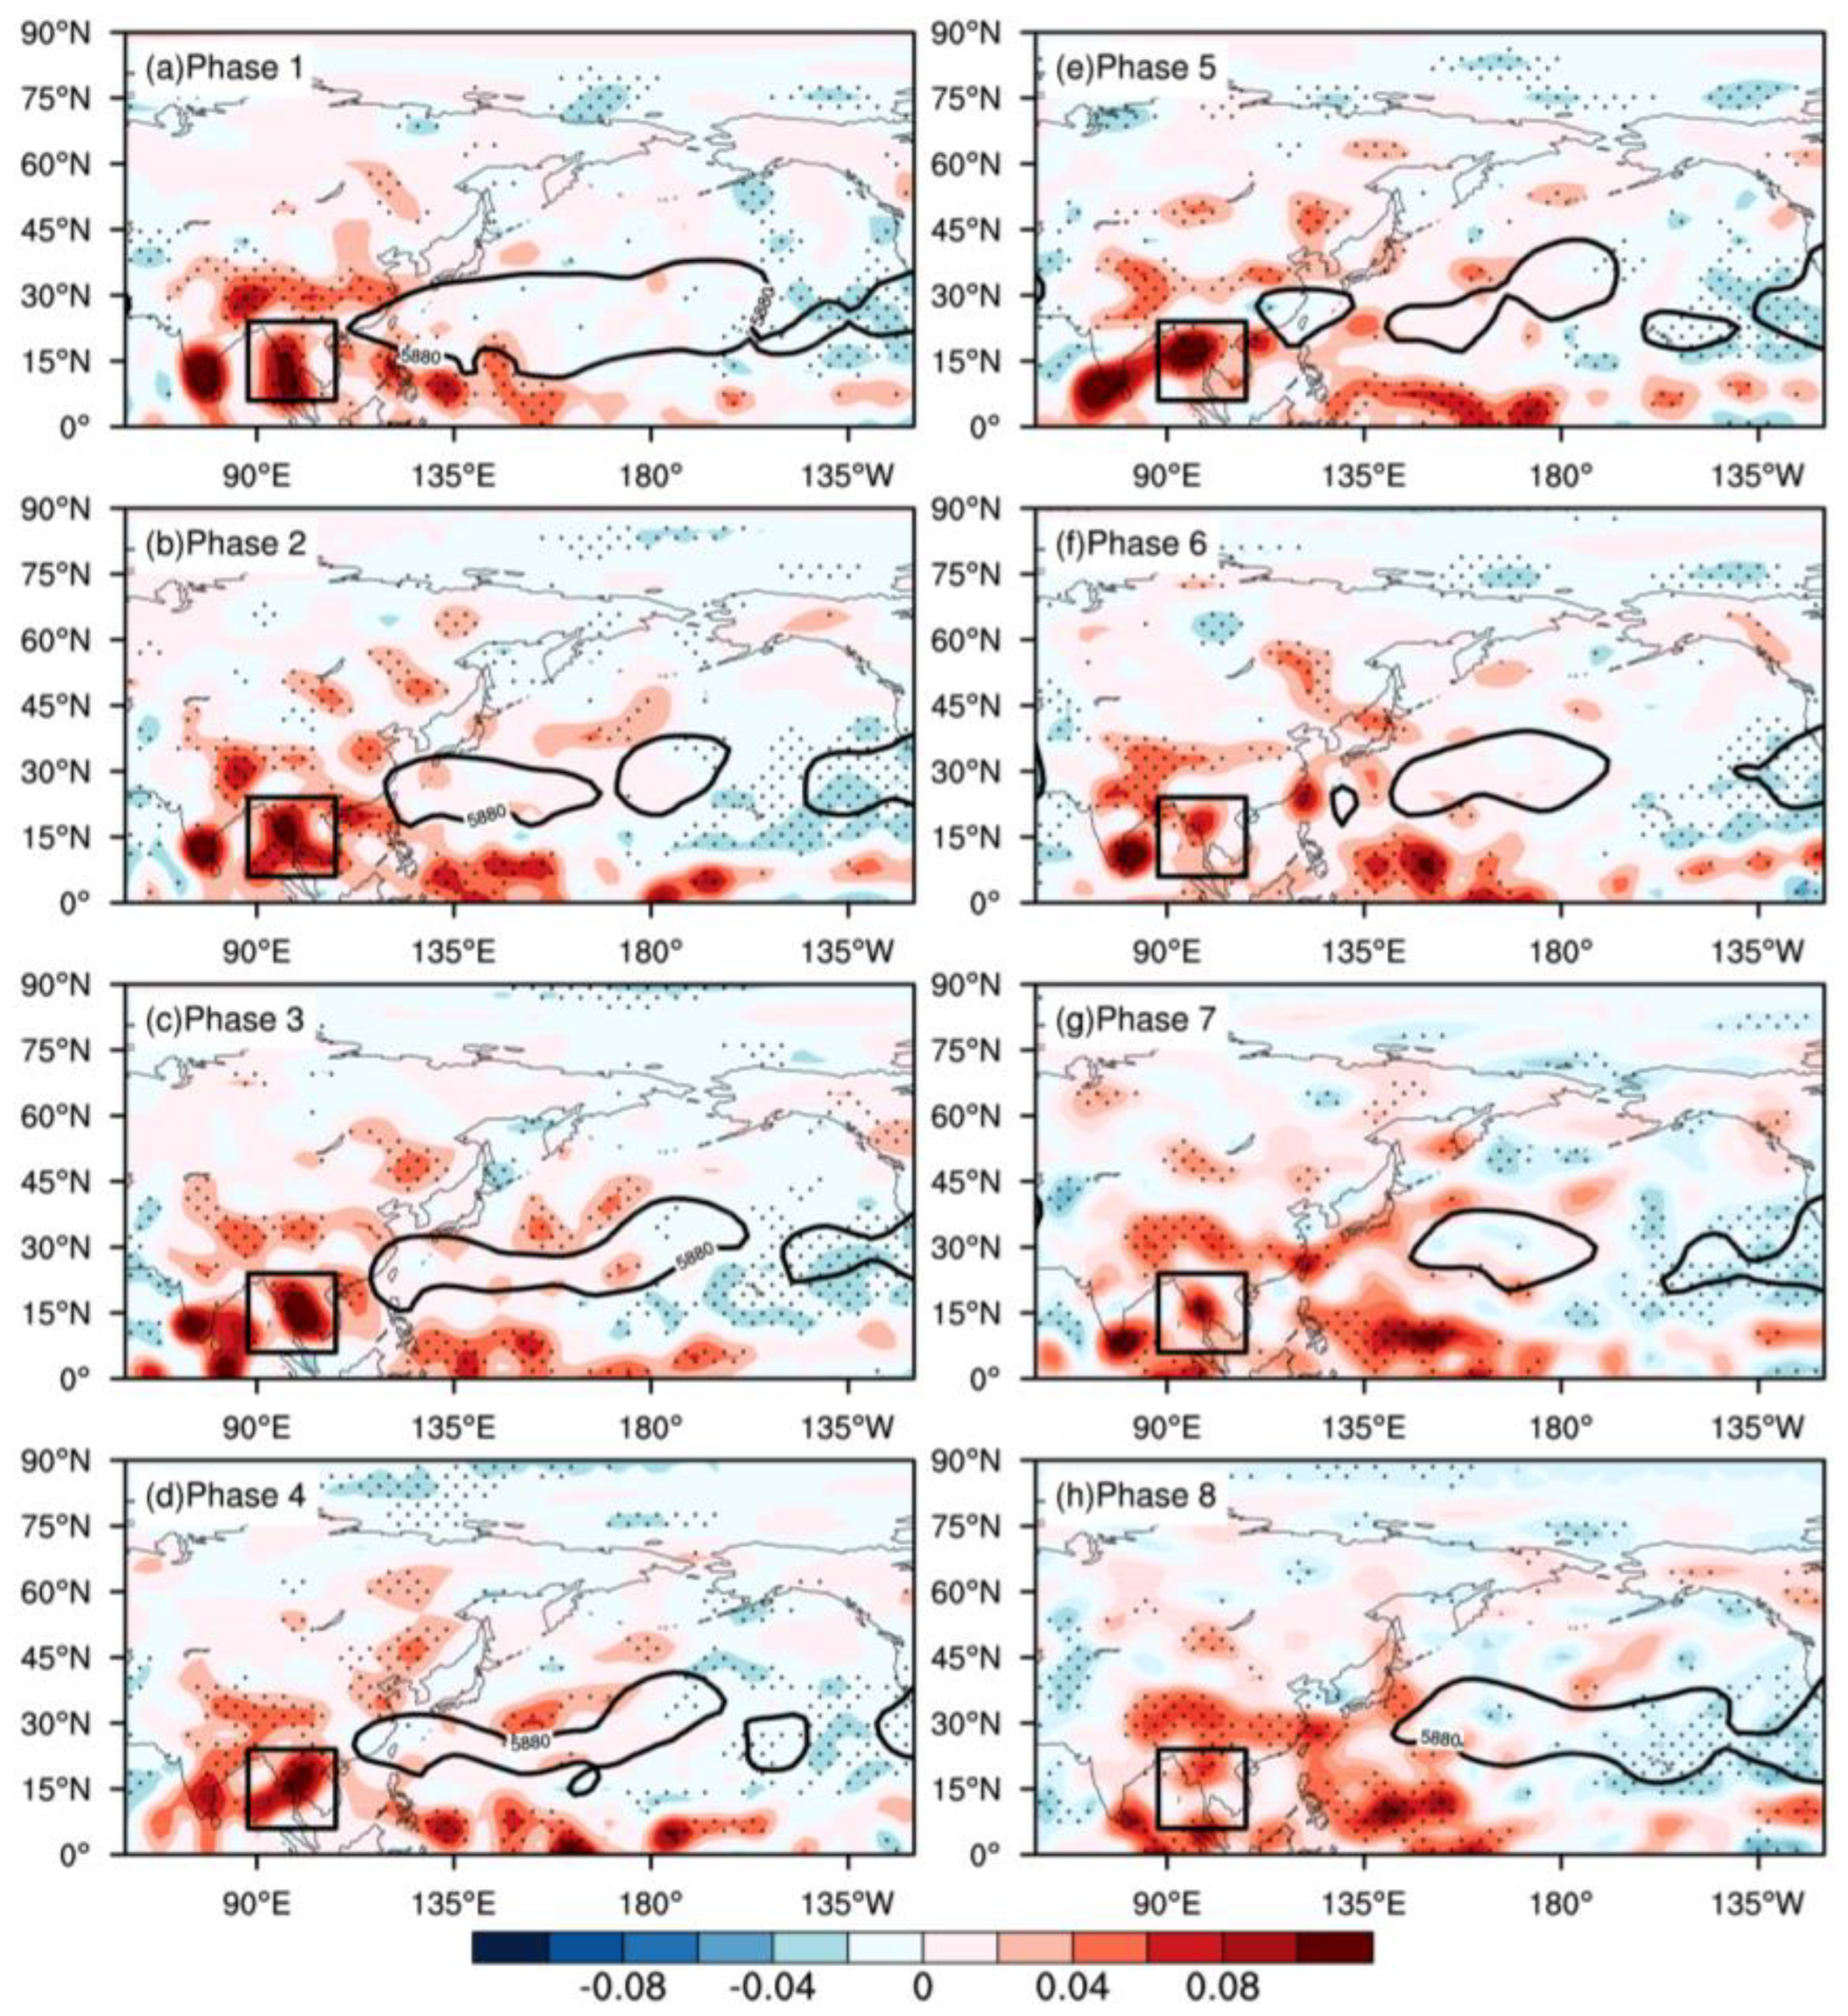
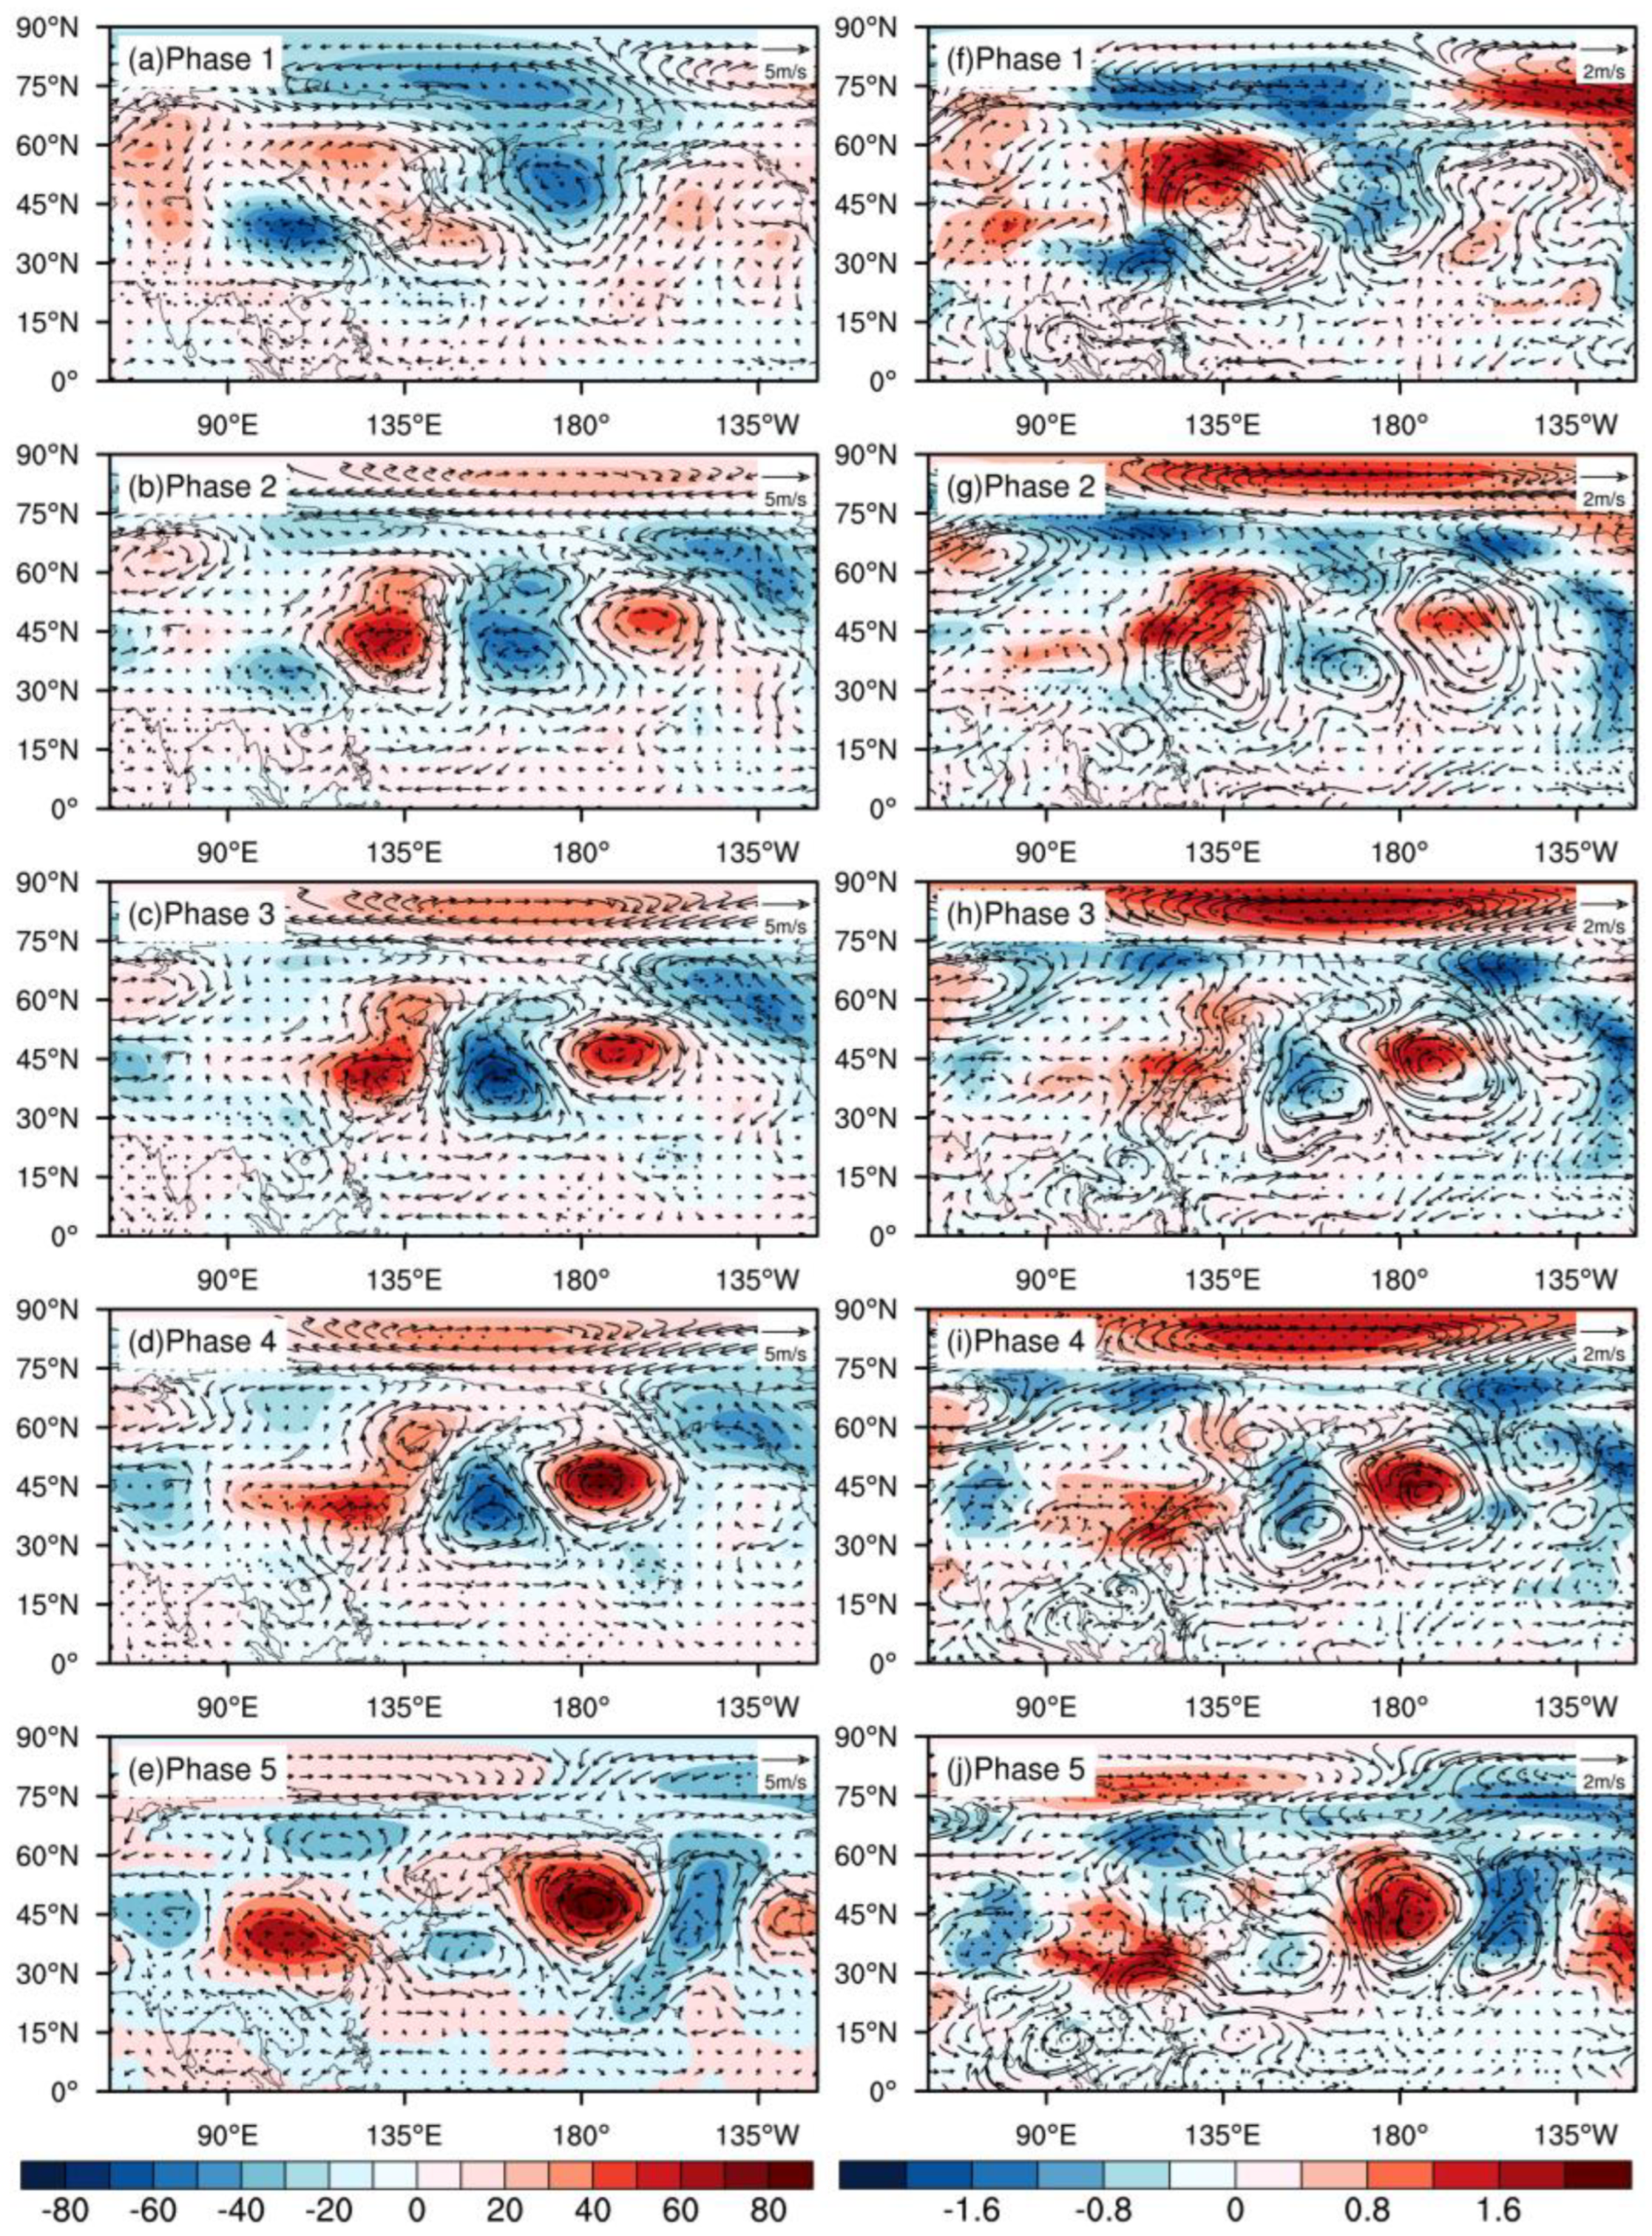
4.1. PHTEs Associated with the Westward Extension of WPSH (Type I Events)

How does the nonuniform distribution of diabatic heating affect the WPSH during the PHTEs? Figure 3 shows the distribution of 500 hPa atmospheric apparent heat source Q1 and the WPSH position (lines 5880 gpm) during the type I events. Note that the Q1 is diagnosed from the thermodynamic equation with the original daily data according to Yanai et al. [35]. It can be found that the shape and position of the WPSH have a good corresponding relationship with the distribution of Q1. In phase 1, the shape of the WPSH is distributed zonally, with relatively small diabatic heating in its main body and a zonal Q1 in its southern area. At this time, there is precipitation in the southeast coastal of China to the western side of the WPSH (figure omitted), releasing latent heat of condensation and resulting in diabatic heating of the atmosphere, which makes Q1 appear in this region. In addition, there is relatively strong Q1 in the Indo-China Peninsula. Since then, Q1 also weakens with the weakening and disappearance of precipitation in the southeast coast, the WPSH gradually extends westward and then occupies the Jiangnan region in phase 4. During the cooling process, the Q1 in the Indo-China Peninsula is significantly weakened, and the precipitation gradually moves southward from the JiangHuai River Basin to the southeast coast, corresponding to the weak Q1. At this time, the WPSH moves eastward.
In order to further analyze the possible causes for the variation of WPSH, taking the area of 8°–23° N, 93°–108° E (the box in Figure 3) as a key region (where the large Q1 center is located), the vertical distributions of Q1 in this area are portrayed in Figure 4. It can be seen that in phase 1–4, Q1 increases significantly with height, and reaches the maximum in the middle-upper troposphere. Therefore, under the term of β, the northerly (southerly) wind appears in the upper (lower) side of the heat source center, forming an anticyclonic (cyclonic) circulation in the west side of the heat source and a cyclonic (anticyclonic) circulation in the east side, thereby leading to the westward extension of the WPSH. In the cooling phase, although there is still an obvious distribution of Q1 in the Indo-China Peninsula, the intensity is weaker than that in the heating phase, and the WPSH gradually withdraws eastward at this time.
To clearly analyze how the ISO modulates the type I events, we will focus on the evolution features of tropospheric circulation on the intraseasonal scale. Figure 5a–e shows the composite low-frequency 200 hPa geopotential height field and 500 hPa wind field of the type I events. As we concentrated on the process of PHTEs development, only the half-life cycle from phase 1 to phase 5 are depicted. The most significant feature related to the ISO is a wave train spanning the entire Pacific in the middle latitude and extending from the North American coast to the central and eastern China. During phases 1–2, there is a negative geopotential height anomaly at 200 hPa and a cyclonic anomaly at 500 hPa over the Jiangnan region. With the evolution of the heating phase, the low-frequency wave train gradually moves to the southwest, the negative geopotential height anomaly and the cyclonic anomaly gradually weaken. In phase 4, the Jiangnan region is controlled by the positive geopotential height anomaly and the anticyclonic anomaly. In addition, during the heating process, the anticyclonic anomaly in the low latitude at 500 hPa gradually strengthens and moves westward, and then merges with the anticyclonic anomaly moving southward in phase 3. After that, the combined anticyclonic anomaly gradually strengthens and contracts to the Jiangnan region, so that the surface temperature in Jiangnan region reaches the maximum. As the wave train continues to move southwestward, the surface temperature in Jiangnan region gradually decreases (figure omitted), and the high temperature process tends to end.
We also examine the circulation features of the type I events in the lower troposphere (Figure 5f–j). There is an obvious low-frequency wave train with cyclonic-anticyclonic anomaly alternate distribution in the middle latitude, notably along the latitudes 30°–60° N. The cyclonic anomaly and cold anomaly locate over the Jiangnan region in phase 1, and its northern part is a strong anticyclonic anomaly. With the movement of the low-frequency wave train, the cold anomaly weakens significantly in phase 2, the cyclonic anomaly weakens and disappears while the anticyclonic anomaly in the north expands southward. At this time, there is a weak anticyclonic anomaly on the tropical ocean to the east of 135° E, and then gradually moves westward and merges with the anticyclonic anomaly shrinking southward. In phase 5, the warm anomaly strengthens southward to the Jiangnan region, and the intensity reaches the maximum, corresponding to the maximum surface temperature at this time. During the cooling process (figure omitted), the anticyclonic anomaly in the western Pacific splits and retreats eastward, the high temperature process tends to end with the weakening of the anticyclonic anomaly and warm anomaly in Jiangnan area.

4.2. PHTEs Associated with the Stable Maintenance of the WPSH (Type II Events)

Figure 6 shows the evolution of 500 hPa Q1 and the position of the WPSH. Affected by the distribution of Q1, the shape of the WPSH presents the characteristics of block distribution. During phases 1–3, the position of the WPSH is stable in the coastal areas of South China influenced by the Q1 to the east of the ocean continent and the Q1 in the MLYR. At this time, there is obvious precipitation (figure omitted) over the MLYR. The latent heat released by precipitation condensation is beneficial to the increasing of cyclonic vorticity and thus preventing the WPSH to moving northward. Since then, the precipitation in the MLYR gradually decreases, and the Q1 intensity is significantly weakens. In phase 4, the Q1 near the vicinity of Hainan weakens, leading to the WPSH moves slightly northwestward and controls the Jiangnan region. In this process, a strong Q1 is always maintained in the Indo-China Peninsula area on the west side of the WPSH, and is significantly weakened in the cooling phase, corresponding to the rapid eastward retreat of the WPSH.
Figure 7 shows the vertical distribution of Q1 in the Indo-China Peninsula (6°–24° N, 88°–108° E). During the heating process, Q1 increases with height and reaches the maximum in the middle and upper troposphere, but the intensity is significantly smaller than that of the type I events. In the first 15 days of phase 1 (figure omitted), Q1 is relatively weak in the Indo-China Peninsula. After that, it gradually strengthens, leading the WPSH to extend westward slowly. During phases 2–3, Q1 increases obviously with height, which changes the vorticity field on the east side of the maximum heating source, thus inducing the WPSH to extend westward and northward slightly in phase 4. Although Q1 increases with height up to the upper troposphere, the increase amplitude is significantly reduced in the cooling process, and the intensity is also significantly weakened compared with the heating process, so the corresponding WPSH retreats eastward.
For the purpose of describing the evolution of the intraseasonal signal, a composite analysis is performed for the type II events in the upper, middle, and lower troposphere, respectively, as shown in Figure 8. In the upper-middle troposphere (Figure 8a–e), a notable low-frequency wave train with positive-negative alternation in the middle latitude is clearly, showing the fluctuation characteristics of two waves. The wave train moves southwestward across middle latitude Pacific, and strengthens in phase 2. The negative geopotential height anomaly and the cyclonic anomaly in Jiangnan region are gradually weakened. In phase 3, a vertical baroclinic structure with negative geopotential height anomaly in upper-level and positive geopotential height anomaly in low-level (figure omitted) contributes to the local descending motion and the increase of surface temperature over the core region. With the movement of wave train, the Jiangnan region is gradually controlled by the positive geopotential height anomaly and the anticyclonic anomaly, and the surface temperature reaches the maximum in phase 5. During the type II events, since the WPSH is always located in the southeastern coastal areas of China, there is no obvious westward movement of the low latitude anticyclonic anomaly in the middle troposphere, which is remarkably different from the type I events.
In the lower troposphere (Figure 8f–j), it is worth mentioning that the above-mentioned low-frequency wave train can also be clearly seen in the lower troposphere. With the evolution of the heating phase, the low-frequency wave train moves southwestward, the anticyclonic anomaly and warm anomaly gradually moves into the core region and induces local subsidence. In phase 5, the warm anomaly in Jiangnan area reaches the maximum, and the corresponding surface temperature reaches the maximum. The distribution of temperature and wind are basically opposite to phase 1 at this moment. Afterwards, the distribution of cooling phase and heating phase is almost opposite.

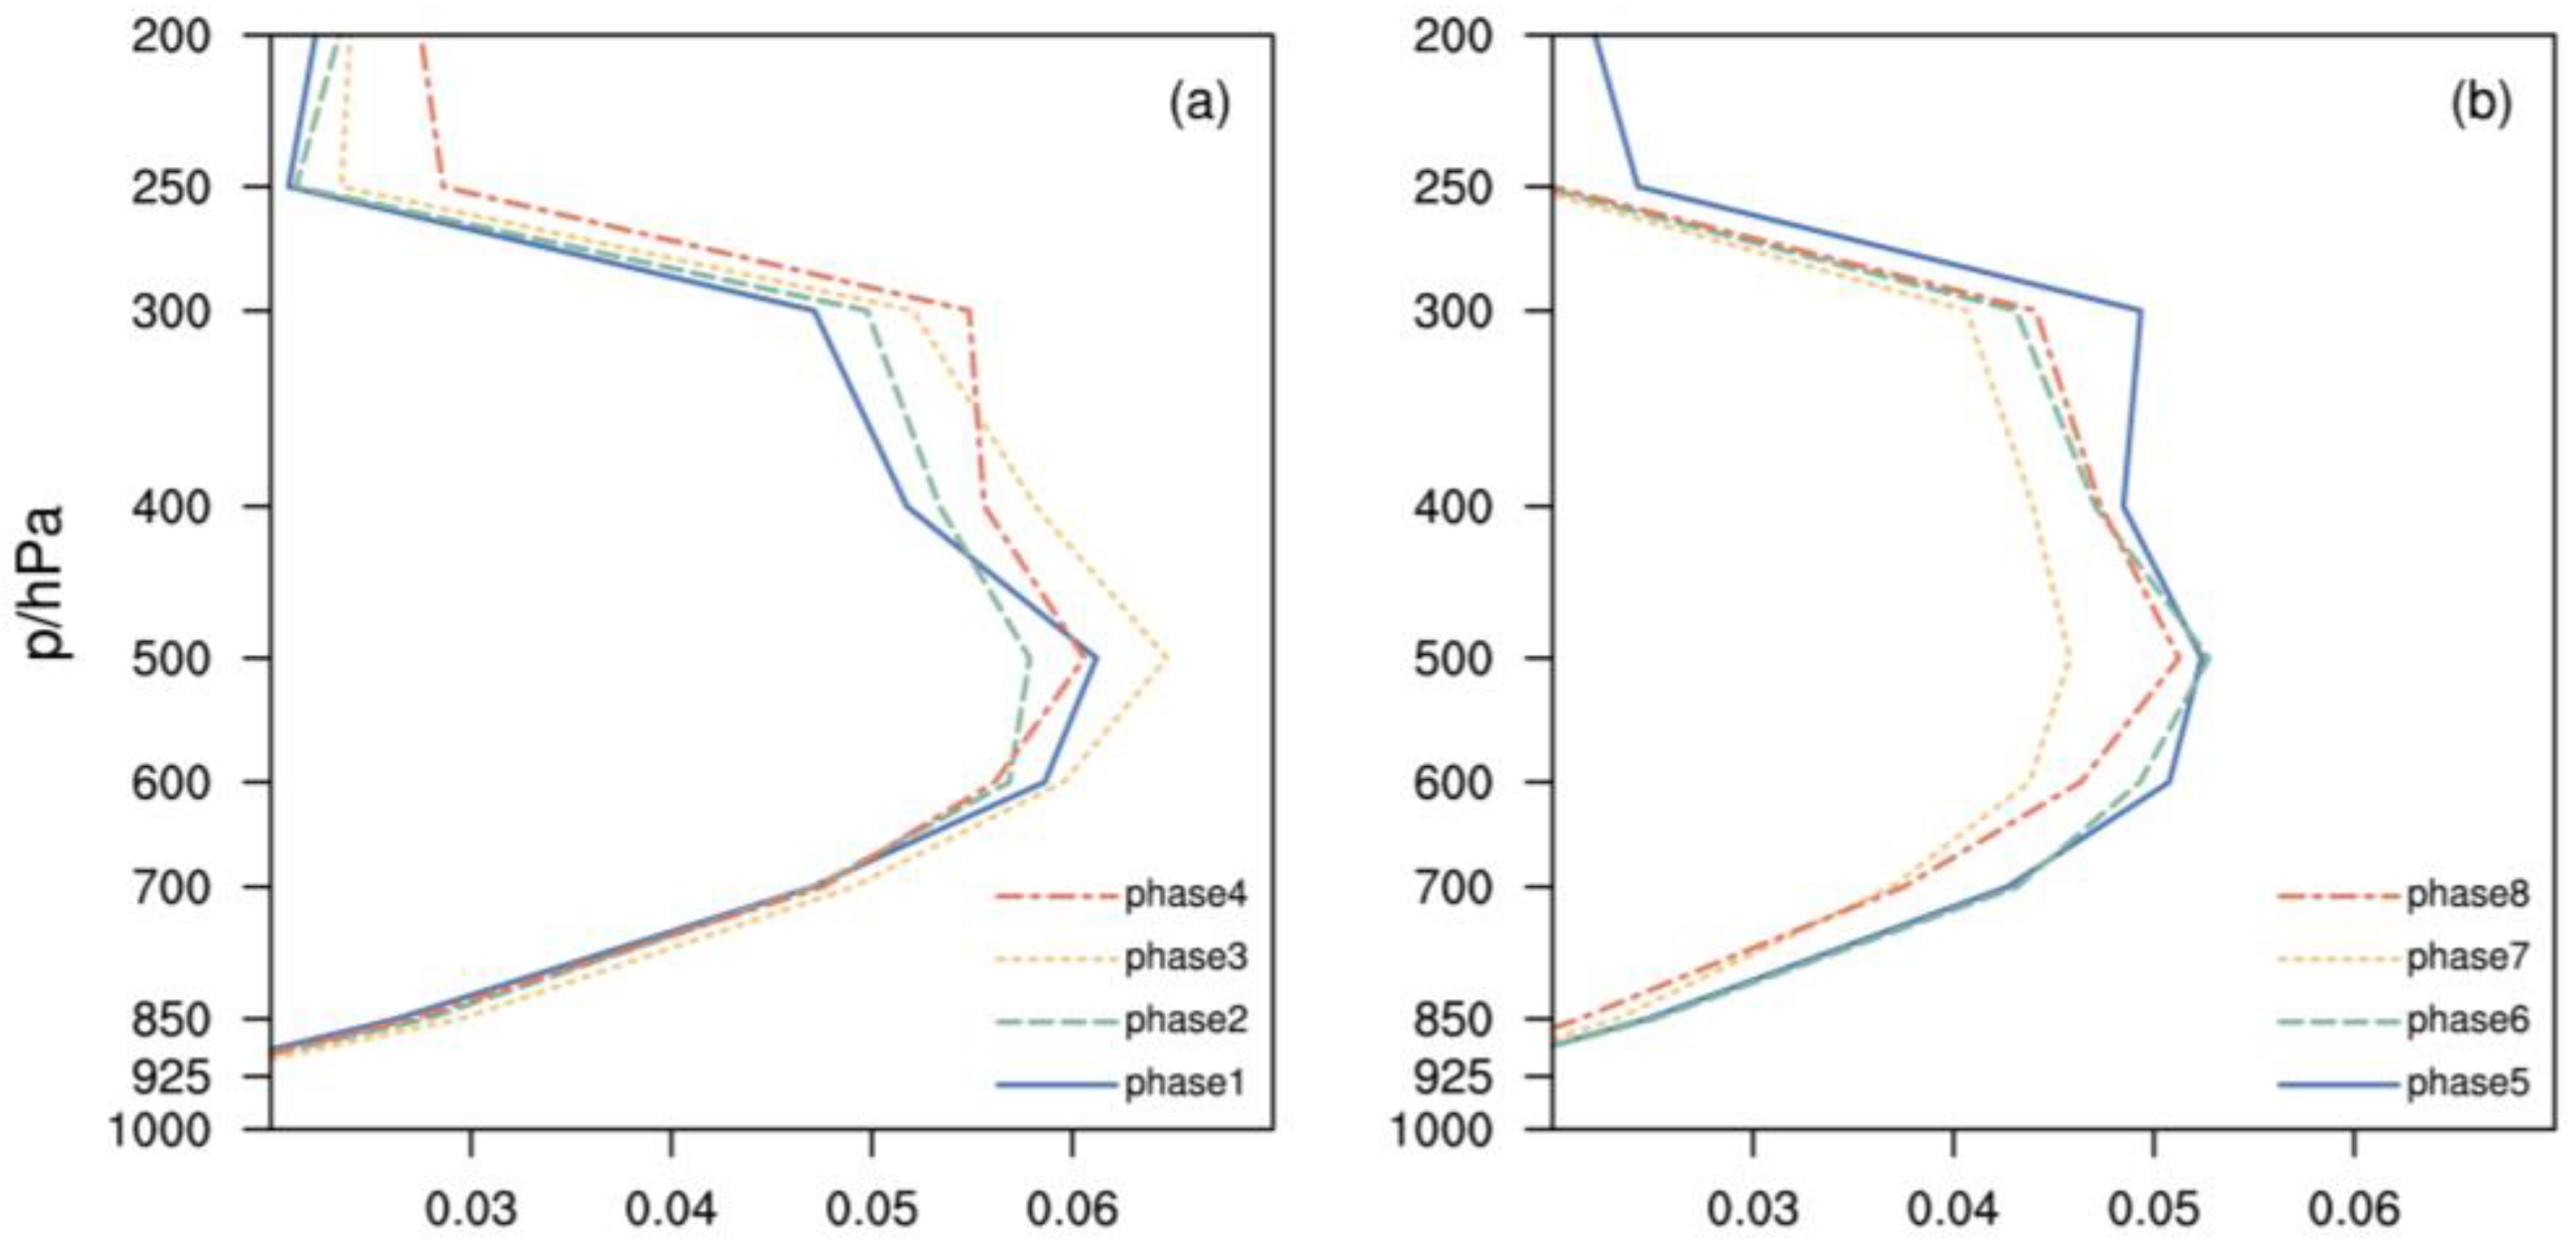
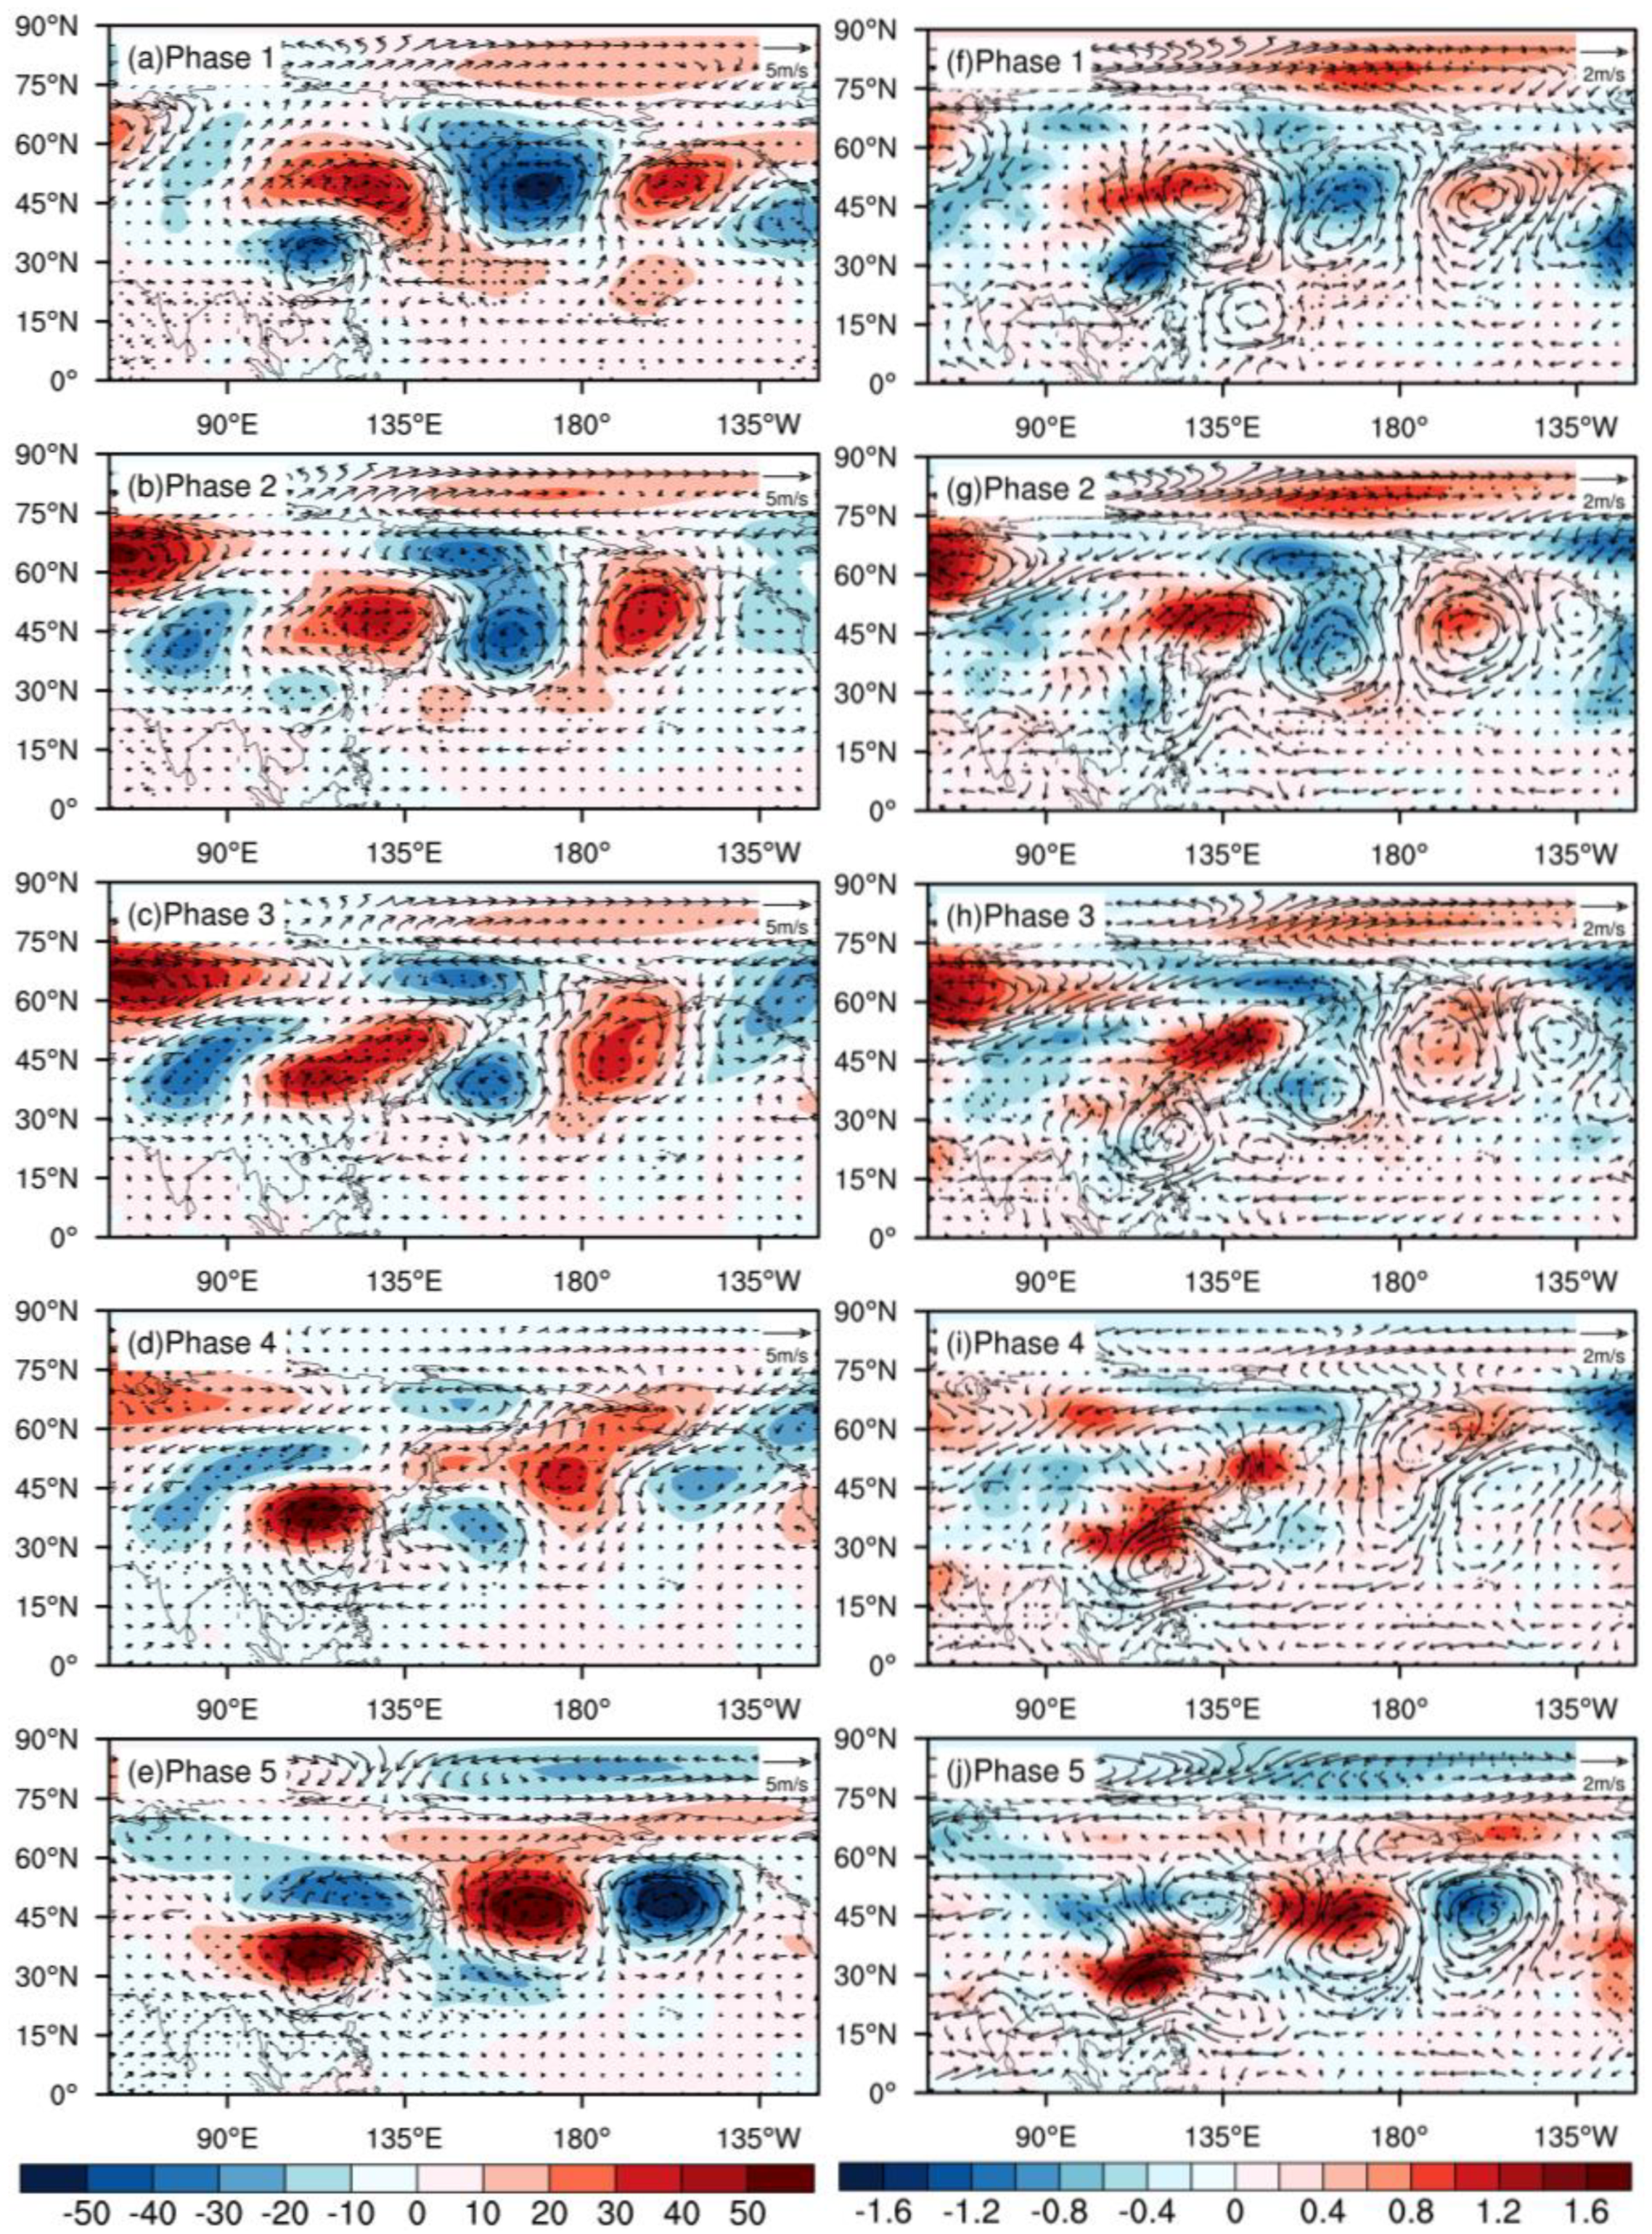
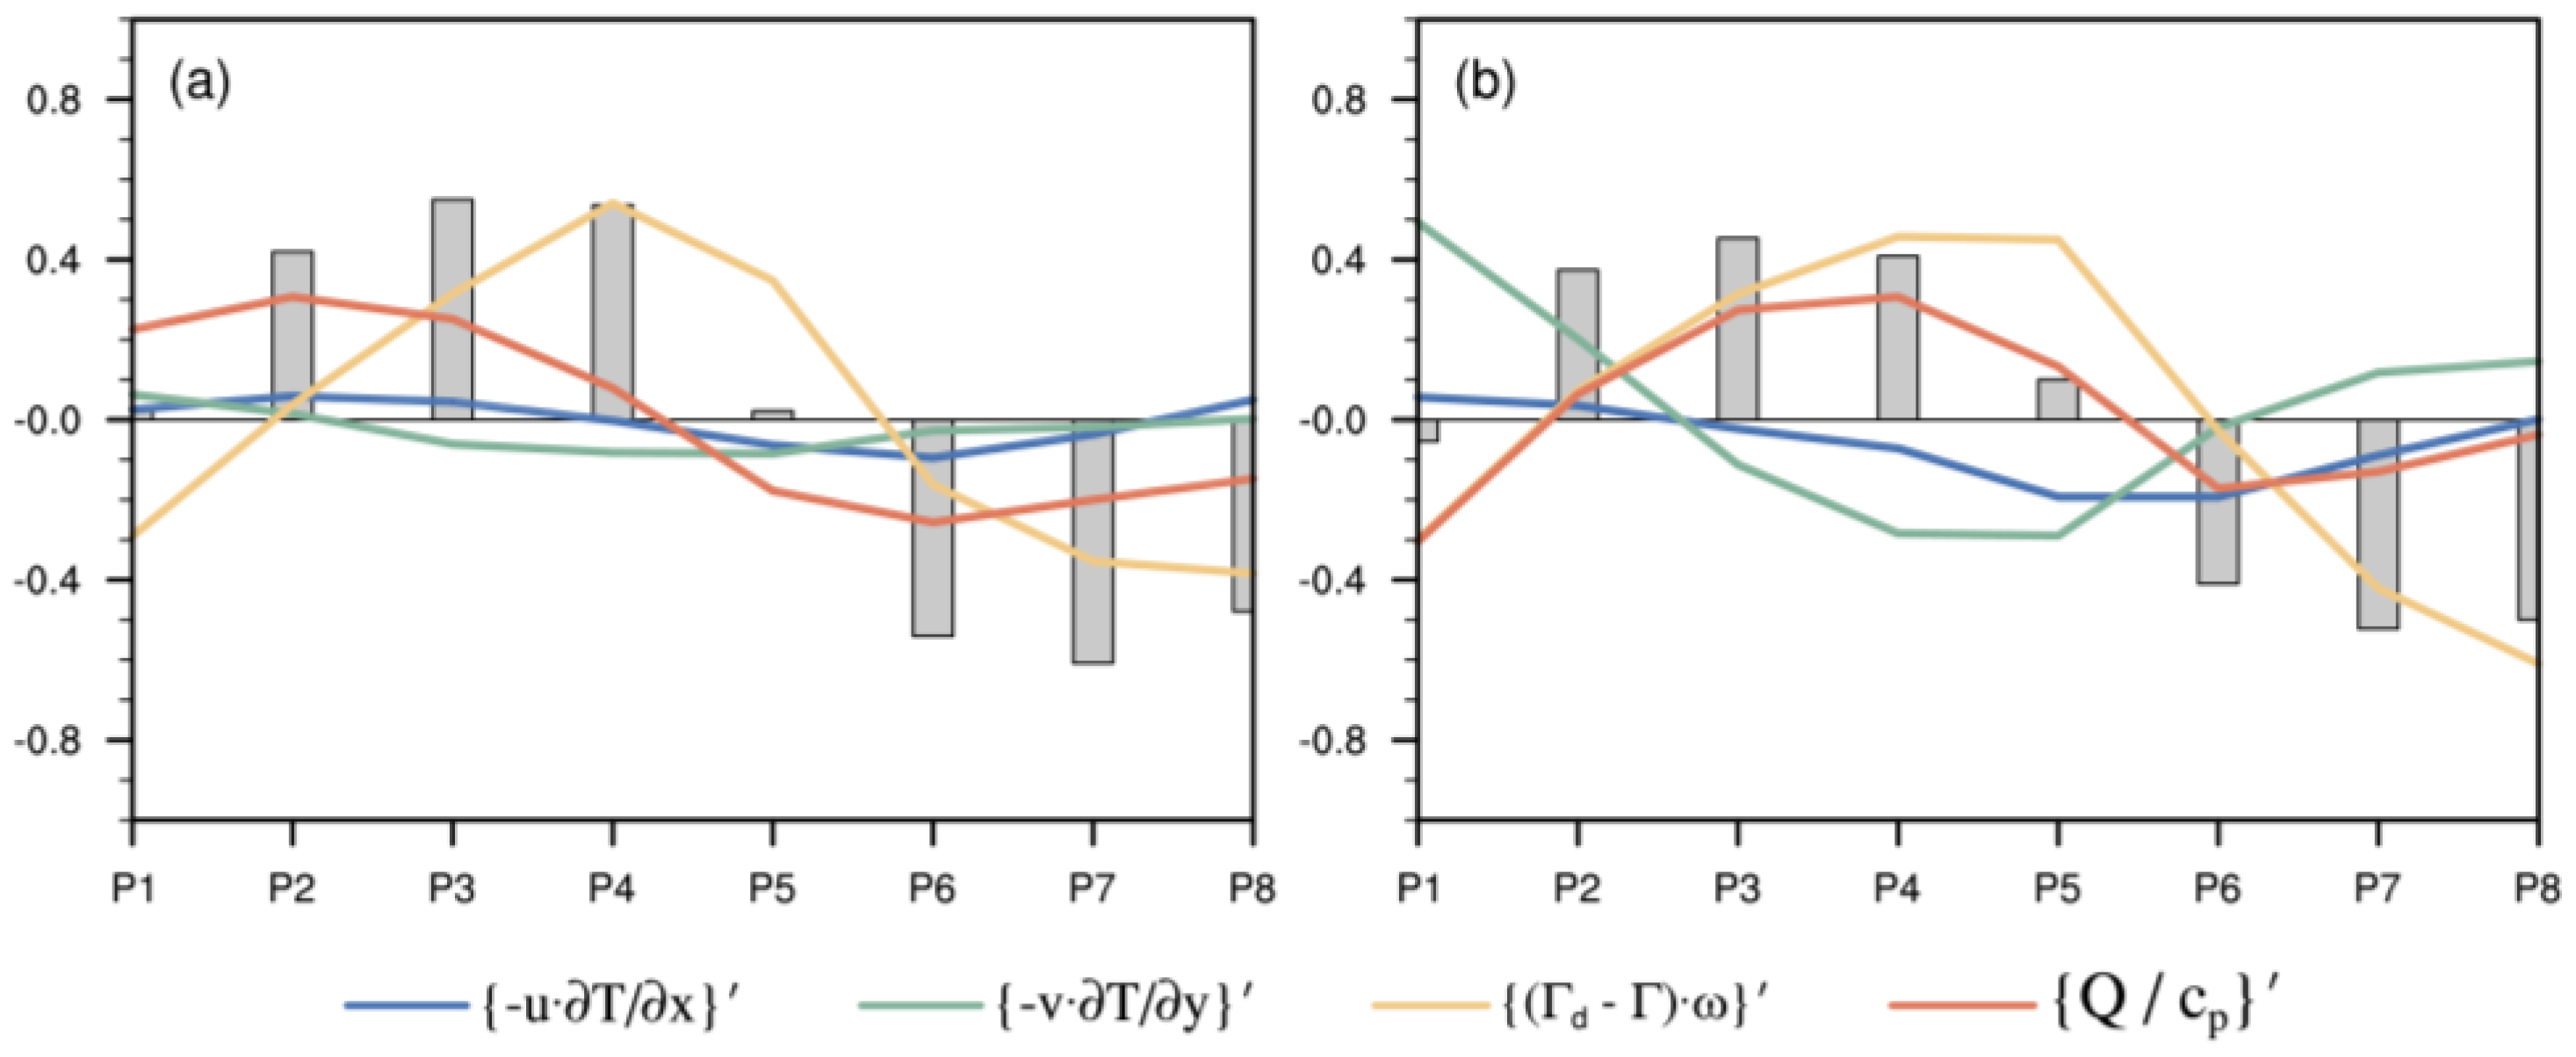
5. Physical Cause of the Two Types of PHTEs

Not only the upper-level circulation but also the low-level circulation shows similar southwestward movement in the middle latitude in both two types of PHTEs, in which the features of southward movement can clearly be seen from the vertical cross sections. Figure 9 depicts meridional-vertical cross sections of 10–30 d filtered wind, temperature and geopotential height fields averaged along the longitude of 108°–122° E. It is found that the local warming mechanism in Jiangnan region is the same for the two types of PHTEs. Cold and warm anomalies near the core region cause contraction or expansion of the air column, thus resulting in vertical motion. In the heating phase, the heating effect of the descending airflow and the warm anomaly moving southward in the north of core region jointly cause the increase of temperature. As the warm anomaly moves southward, the descending airflow gradually converts into the ascending airflow and the temperature in the core region gradually decreases.
The vertical circulation fields analysis above indicate that descending airflow plays an important role in both two types of PHTEs. In order to have a better understanding of the physical process contributing to the intraseasonal Tmax anomaly over the Jiangnan region, Figure 10 further displayed the diagnosis of the thermodynamic equation on the intraseasonal timescale in the lower troposphere for the two types of PHTEs. It can be seen that in the early stage (phase 1–2) of the warming process of the type I events, the intraseasonal component of the diabatic process is the main contribution term. While from phase 3 till 5, the intraseasonal component of the adiabatic process plays the key role. Furthermore, the low-frequency horizontal temperature advection is small in heating the atmosphere, which can be ignored. In the type II events, the low-frequency meridional temperature advection process has a positive contribution to local warming during the initiation period (phase 1–2). In the late stage of the heating process, the intraseasonal component of adiabatic and diabatic process play essential roles, but low-frequency adiabatic process contributes the most. The evolution of each item in the cooling process is roughly opposite to the heating phase.
In conclusion, the adiabatic heating in the lower troposphere in the two types of PHTEs have obvious positive contributions to the surface warming in the core region, which is associated with local subsidence caused by the atmospheric circulation.

6. Discussion and Conclusions

6.1. Discussion

In this paper, the PHTEs are classified according to the position change of WPSH during the high temperature processes. The obvious difference between the first two types of PHTEs is that there is no westward movement of the anticyclone anomaly in the lower latitude of the second type of PHTEs. Through further analysis of the second type of PHTEs, it is found that the PHTEs mostly occur in the heating phase with low-frequency fluctuations of 30–60 d, and the superposition of the two low-frequency scale fluctuations makes the PHTEs generally last longer. The composite 30–60 d filtered geopotential height fields and wind fields in the middle and lower troposphere for the second type of PHTEs are shown in Figure 11. It can be seen that in the heating phase, the anomalous anticyclone on the time scale of 10–30 d and 30–60 d combined together to strengthen the low-level divergence and subsidence movement, thus making the high temperature last longer. Considering the modulation effect of the 30–60 d low-frequency scale, the selected PHTEs can be reclassified in the future, and the evolution of the 10–30 d low-frequency PHTEs on the 30–60 d low-frequency scale heating phase and cooling phase are discussed, respectively.

6.2. Conclusions

Based on the daily surface maximum temperature data from 1981 to 2018 provided by China Meteorological Data Network and the daily circulation field data provided by NCEP/DOE, this study selects the Jiangnan region (24.5°–31.5° N, 108°–122° E) as the core region, and the ISO features of surface maximum temperature in the extended summer in Jiangnan area are explored. The main conclusions are as follows:
(1) The surface maximum temperature in the Jiangnan area exhibits a vigorous ISO of 10–30 days in the extended summer, and is largely regulated by intraseasonal signal. Total 37 PHTEs related to ISO are identified from 1981 to 2018 and then classified into three types according to the position variation of the WPSH during the occurrence of PHTEs.
(2) In the mid-latitude of the first two types of PHTEs, a southwestward migrating wave train from the North American coast to the central and eastern China can be clearly seen in the whole troposphere. Whereas the two types of PHTEs show different features in the low-latitude. It is found that a significantly westward extension of the WPSH during the first type of PHTEs. In the mid-lower troposphere, the most remarkable characteristic is a westward movement of anticyclonic anomaly in the east of Taiwan, which favors for the western extension of subtropical high. For the second type of PHTEs, the WPSH is mainly located in the southeastern China with weak activities.
(3) In the first type of PHTEs, the diagnosis of 925 hPa thermodynamic equation indicates that the ISO features of the Tmax in the core region is determined by the intraseasonal variation of the diabatic variation in the early stage of heating process, and the low-frequency adiabatic variation plays the major role in the later stage. In the second type of PHTEs, the low-frequency meridional temperature advection plays a positive role in the early stage of heating process, and the low-frequency adiabatic variation and diabatic variation contribute mainly in the later stage.
(4) The low-frequency vertical circulation analysis of the two types of PHTEs show that the increase of temperature in the core region is mainly caused by the combined effect of air column heating induced by descending airflow and southward movement of the warm anomaly in the north of core region.

Author Contributions

Conceptualization and methodology, Q.G.; data curation and visualization, Y.L. and Q.Y.; writing—original draft preparation, Y.L. and Y.Y.; writing—review and editing, Q.G. All authors have read and agreed to the published version of the manuscript.

Funding

This research was funded by the National Key Research and Development Program Funding of China, Grant Number: 2018YFC1505804, and the National Natural Science Foundation of China, Grant Number: 42075032.

Institutional Review Board Statement

Not applicable.

Informed Consent Statement

Not applicable.

Data Availability Statement

NCEP-DOE Reanalysis 2 data can be found here: https://psl.noaa.gov/data/gridded/data.ncep.reanalysis2.html (accessed on 10 January 2021); the daily maximum air temperature dataset can be obtained from the website of the China Meteorological Data Network: https://data.cma.cn/ (accessed on 10 January 2021).

Acknowledgments

We thank China Meteorological Data Network and NCEP-DOE for providing datasets.

Conflicts of Interest

The authors declare no conflict of interest.

References

  1. Shen, Y.P.; Wang, G.Y. Key findings and assessment results of IPCC WGI Fifth Assessment Report. J. Glaciol. Geocryol. 2013, 35, 1068–1076. (In Chinese) [Google Scholar]
  2. Zhou, B.T.; Qian, J. Changes of weather and climate extremes in the IPCC AR6. Adv. Clim. Chang. Res. 2021, 17, 713–718. (In Chinese) [Google Scholar]
  3. Blunden, J.; Arndt, D.S.; Baringer, M.O. State of the climate in 2010. Bull. Am. Meteorol. Soc. 2011, 92, S1–S236. [Google Scholar] [CrossRef]
  4. Lin, S.; Li, H.Y.; Huang, P.C.; Duan, X.Y. Characteristics of high temperature, drought and circulation situation in summer 2022 in China. J. Arid Meteorol. 2022, 40, 748–763. (In Chinese) [Google Scholar]
  5. Li, T.; Ling, J.; Hsu, P.C. Madden-Julian Oscillation: Its Discovery, Dynamics, and Impact on East Asia. J. Meteorol. Res. 2020, 34, 20–42. [Google Scholar] [CrossRef]
  6. Madden, R.A.; Julian, P.R. Detection of a 40–50 day oscillation in the zonal wind in the tropical Pacific. J. Atmos. Sci. 1971, 28, 702–708. [Google Scholar] [CrossRef]
  7. Jiang, X.A.; Li, T.; Wang, B. Structures and Mechanisms of the Northward Propagating Boreal Summer Intraseasonal Oscillation. J. Clim. 2004, 17, 1022–1039. [Google Scholar] [CrossRef]
  8. Matthews, A.J. Propagation mechanisms for the Madden-Julian Oscillation. Q. J. R. Meteorol. Soc. 2000, 126, 2637–2651. [Google Scholar] [CrossRef]
  9. Hsu, H.H.; Weng, C.H. Northwestward Propagation of the Intraseasonal Oscillation in the Western North Pacific during the Boreal Summer: Structure and Mechanism. J. Clim. 2001, 14, 3834–3850. [Google Scholar] [CrossRef]
  10. Jiang, X.A.; Li, T. Reinitiation of the boreal summer intraseasonal oscillation in the tropical Indian Ocean. J. Clim. 2005, 18, 3777–3795. [Google Scholar] [CrossRef] [Green Version]
  11. Li, T.; Zhao, C.B.; Hsu, P.C.; Nasuno, T. MJO Initiation Processes over the Tropical Indian Ocean during DYNAMO/CINDY2011. J. Climate 2015, 28, 2121–2135. [Google Scholar] [CrossRef]
  12. Feng, J.; Li, T. Initiation mechanisms for a successive MJO event and a primary MJO event during boreal winter of 2000–2001. J. Trop. Meteorol. 2016, 22, 479–496. [Google Scholar]
  13. Lin, H.; Brunet, G.; Mo, R. Impact of the Madden–Julian Oscillation on Wintertime Precipitation in Canada. Mon. Weather Rev. 2010, 138, 3822–3839. [Google Scholar] [CrossRef]
  14. Cui, J.; Yang, S.Y.; Li, T. The influence of the Madden-Julian oscillation on high-latitude surface air temperature during boreal winter. Dyn. Atmos. Oceans 2020, 90, 101141. [Google Scholar] [CrossRef]
  15. Zhu, L.J.; Lin, F.L.; Liang, C.J. Modulation of tropical cyclone activity over the Northwestern Pacific through the quasi-biweekly oscillation. J. Trop. Meteorol. 2021, 27, 125–135. [Google Scholar]
  16. Wang, H.; Liu, F.; Wang, B.; Li, T. Effect of intraseasonal oscillation on South China Sea summer monsoon onset. Clim. Dyn. 2018, 51, 2543–2558. [Google Scholar] [CrossRef]
  17. Mao, J.Y.; Wu, G.X. Intraseasonal variations of the Yangtze rainfall and its related atmospheric circulation features during the 1991 summer. Clim. Dyn. 2006, 27, 815–830. [Google Scholar] [CrossRef]
  18. Li, J.Y.; Mao, J.Y. Impact of the Boreal Summer 30–60-day Intraseasonal Oscillation over the Asian Summer Monsoon Region on Persistent Extreme Rainfall over Eastern China. Chin. J. Atmos. Sci. 2019, 43, 796–812. (In Chinese) [Google Scholar]
  19. Miao, R.; Wen, M.; Zhang, R.H. Persistent precipitation anomalies and quasi-biweekly oscillation during the annually first rainy season over south China in 2010. J. Trop. Meteorol. 2017, 33, 155–166. (In Chinese) [Google Scholar]
  20. Liu, Y.; Hsu, P.C. Long-term changes in wintertime persistent heavy rainfall over southern China contributed by the Madden–Julian Oscillation. Atmos. Ocean. Sci. Lett. 2019, 12, 1–8. [Google Scholar] [CrossRef] [Green Version]
  21. Zhang, L.N.; Lin, P.F.; Xiong, Z. Impact of the Madden-Julian oscillation on pre-flood season precipitation in south China. Chin. J. Atmos. Sci. 2011, 35, 560–570. (In Chinese) [Google Scholar]
  22. Gao, M.N.; Yang, J.; Wang, B.; Zhou, S.Y.; Gong, D.Y.; Kim, S.J. How are heat waves over Yangtze River valley associated with atmospheric quasi-biweekly oscillation? Clim. Dyn. 2018, 51, 4421–4437. [Google Scholar] [CrossRef]
  23. Chen, R.D.; Wen, Z.P.; Lu, R.Y. Large-scale circulation anomalies and intraseasonal oscillations associated with long-lived extreme heat events in south China. J. Clim. 2018, 31, 213–232. [Google Scholar] [CrossRef]
  24. Hsu, P.C.; Lee, J.Y.; Ha, K.J.; Tsou, C.H. Influences of boreal summer intraseasonal oscillation on heat waves in monsoon Asia. J. Clim. 2017, 30, 7191–7211. [Google Scholar] [CrossRef]
  25. Lee, J.Y.; Wang, B.; Wheeler, M.C.; Fu, X.H.; Waliser, D.E.; Kang, I.S. Real-time multivariate indices for the boreal summer intraseasonal oscillation over the Asian summer monsoon region. Clim. Dyn. 2013, 40, 493–509. [Google Scholar] [CrossRef] [Green Version]
  26. Diao, Y.F.; Li, T.; Hsu, P.C. Influence of the Boreal Summer Intraseasonal Oscillation on extreme temperature events in the northern hemisphere. J. Meteorol. Res. 2018, 32, 534–547. [Google Scholar] [CrossRef]
  27. Matsueda, S.; Takaya, Y. The global influence of the Madden-Julian Oscillation on extreme temperature events. J. Clim. 2015, 28, 4141–4151. [Google Scholar] [CrossRef]
  28. Gao, Q.J.; You, Q. Preliminary analysis of intraseasonal oscillation of summer extreme daily temperature in China. Resour. Environ. Yangtze Basin 2019, 28, 1682–1690. (In Chinese) [Google Scholar]
  29. Li, M.Y.; Luo, D.H.; Yao, Y.; Zhong, L.H. Large-scale atmospheric circulation control of summer extreme hot events over China. Int. J. Clim. 2020, 40, 1456–1476. [Google Scholar] [CrossRef]
  30. Gao, Q.J.; Li, Y.; Han, T.X. Intra-seasonal Features of an Extreme High Temperature Event in 2011 in Eastern China and Its Atmospheric Circulation. J. Trop. Meteorol. 2021, 27, 437–446. [Google Scholar] [CrossRef]
  31. Yuan, Z.; Yin, J.; Wei, M.; Yuan, Y. Spatio-Temporal Variations in the Temperature and Precipitation Extremes in Yangtze River Basin, China during 1961–2020. Atmosphere 2021, 12, 1423. [Google Scholar] [CrossRef]
  32. Kanamitsu, M.; Ebisuzaki, W.; Woollen, J.; Yang, S.K.; Hnilo, J.J.; Fiorino, M.; Potter, G.L. NCEP–DOE AMIP-II Reanalysis (R-2). Bull. Am. Meteorol. Soc. 2002, 83, 1631–1644. [Google Scholar] [CrossRef] [Green Version]
  33. Liu, Y.M.; Wu, G.X.; Liu, H.; Liu, P. The effect of spatially nonuniform heating on the formation and variation of subtropical high part III: Condensation heating and South Asia High and Western Pacific Subtropical High. Acta Meteorol. Sin. 1999, 57, 525–538. (In Chinese) [Google Scholar]
  34. Lin, J.; Bi, B.G.; He, J.H. Physical mechanism responsible for Western Pacific Subtropical High variation and hot wave in southern China in July 2003. Chin. J. Atmos. Sci. 2005, 29, 594–599. (In Chinese) [Google Scholar]
  35. Yanai, M.; Esbensen, S.; Chu, J.H. Determination of Bulk Properties of Tropical Cloud Clusters from Large-Scale Heat and Moisture Budgets. J. Atmos. Sci. 1973, 30, 611–627. [Google Scholar] [CrossRef]
Figure 1. The first 7 REOF modes of daily Tmax minus threshold in the extended summer (May–September) for 1981–2018. The boxes represent the seven subregions, respectively, of which the black box represents the Jiangnan region (24.5°–31.5° N, 108°–122° E).
Atmosphere 14 00185 g001
Figure 2. Extended Summer mean power spectra of daily Tmax over the Jiangnan region (black line) during 1981–2018, red line represents the 95% significant level of red noise spectrum.
Atmosphere 14 00185 g002
Figure 3. Temporal evolution of (ah) 500 hPa original apparent heat source Q1 field (shading; units: W/kg). The area shown in the black box is (8°–23° N, 93°–108° E), black contours in the panel are 500 hPa geopotential height by 5880 gpm that represent the WPSH location. Black dots represent values exceeding the 90% confidence level.
Atmosphere 14 00185 g003
Figure 4. Vertical distribution of apparent heat source Q1 (units: W/kg) in the (a) heating phase and (b) cooling phase in the Indo-China Peninsula (8°–23° N, 93°–108° E) during the first type of PHTEs.
Atmosphere 14 00185 g004
Figure 5. Temporal evolution of 10–30 d filtered (ae) 200 hPa geopotential height (shading; units: gpm) and 500 hPa winds (vector; units: m/s), (fj) 850 hPa temperature (shading; units: ℃) and winds (vector; units: m/s) for the first type of PHTEs. Black dots represent geopotential height anomalies and temperature anomalies exceeding the 90% confidence level, respectively.
Atmosphere 14 00185 g005
Figure 6. Temporal evolution of (ah) 500 hPa original apparent heat source Q1 field (shading; units: W/kg). The area shown in the black box is (6°–24° N, 88°–108° E), black contours in the panel are 500 hPa geopotential height by 5880 gpm that represent the WPSH location. Black dots represent values exceeding the 90% confidence level.
Atmosphere 14 00185 g006
Figure 7. Vertical distribution of apparent heat source Q1 (units: W/kg) in the (a) heating phase and (b) cooling phase in the Indo-China Peninsula (6°–24° N, 88°–108° E) during the second type of PHTEs.
Atmosphere 14 00185 g007
Figure 8. (aj) Same as Figure 5, expect for the second type of PHTEs.
Atmosphere 14 00185 g008
Figure 9. The vertical-meridional cross section of 10–30 d filtered temperature (shading; units: ℃), geopotential height (contour; units: gpm) and wind (vector; meridional wind units: m/s, vertical velocity units: −10−2 Pa/s) averaged along the longitudes 108°–122° E during the (ae) first and (fj) second type of PHTEs. Yellow lines indicate the latitude of the Jiangnan region. Black dots represent temperature anomalies exceeding the 90% confidence level, respectively.
Atmosphere 14 00185 g009
Figure 10. 10–30 d filtered thermodynamic equation budget terms (units: K/d) for the (a) first and (b) second type of PHTEs over Jiangnan region at 925 hPa. Terms include temperature tendency (gray bar), zonal temperature advection (blue line), meridional temperature advection (green line), adiabatic process (yellow line) and diabatic process (orange line).
Atmosphere 14 00185 g010
Figure 11. Composite 30–60 d filtered 500 hpa geopotential height fields (shading, units: gpm) and 850 hPa wind fields (vector, units: m/s) for (a) phase 4 and (b) phase 8 during the second type of PHTEs. Black dots represent geopotential height anomalies exceeding the 90% confidence level.
Atmosphere 14 00185 g011
Table 1. Begin and end dates (year-month-day) and duration of the two types of PHTEs.
First Type of PHTEs (Type I Events)Second Type of PHTEs (Type II Events)
Begin DatesEnd DatesDaysBegin DatesEnd DatesDaysBegin datesEnd DatesDays
1981-06-161981-06-2492007-07-032007-07-1191981-08-131981-08-2412
1985-07-071985-07-19132008-07-012008-07-0661984-07-071984-07-1812
1991-08-151991-08-26122010-06-302010-07-0561987-08-011987-08-099
1991-08-301991-09-0352011-07-022011-07-1091993-07-081993-07-1912
1995-08-281995-09-09132011-07-202011-08-03151996-07-181996-08-0115
2000-06-262000-07-07122011-08-122011-08-22111981-08-131981-08-2412
2002-07-292002-08-0582012-08-122012-08-2091998-07-071998-07-2014
2004-08-072004-08-1262013-06-172013-06-2152003-08-232003-08-308
2005-07-242005-08-03112016-07-202016-08-02142005-07-142005-07-185
2006-06-192006-06-2352016-08-102016-08-25162015-06-232015-07-019
2006-08-072006-08-18122017-08-022017-08-109
2006-08-262006-09-0410
Disclaimer/Publisher’s Note: The statements, opinions and data contained in all publications are solely those of the individual author(s) and contributor(s) and not of MDPI and/or the editor(s). MDPI and/or the editor(s) disclaim responsibility for any injury to people or property resulting from any ideas, methods, instructions or products referred to in the content.

