
Summer Onset in Northern East Asia: Feature, Mechanism and Variability

 , ,
, , 
Abstract
:1. Introduction
2. Data and Methods
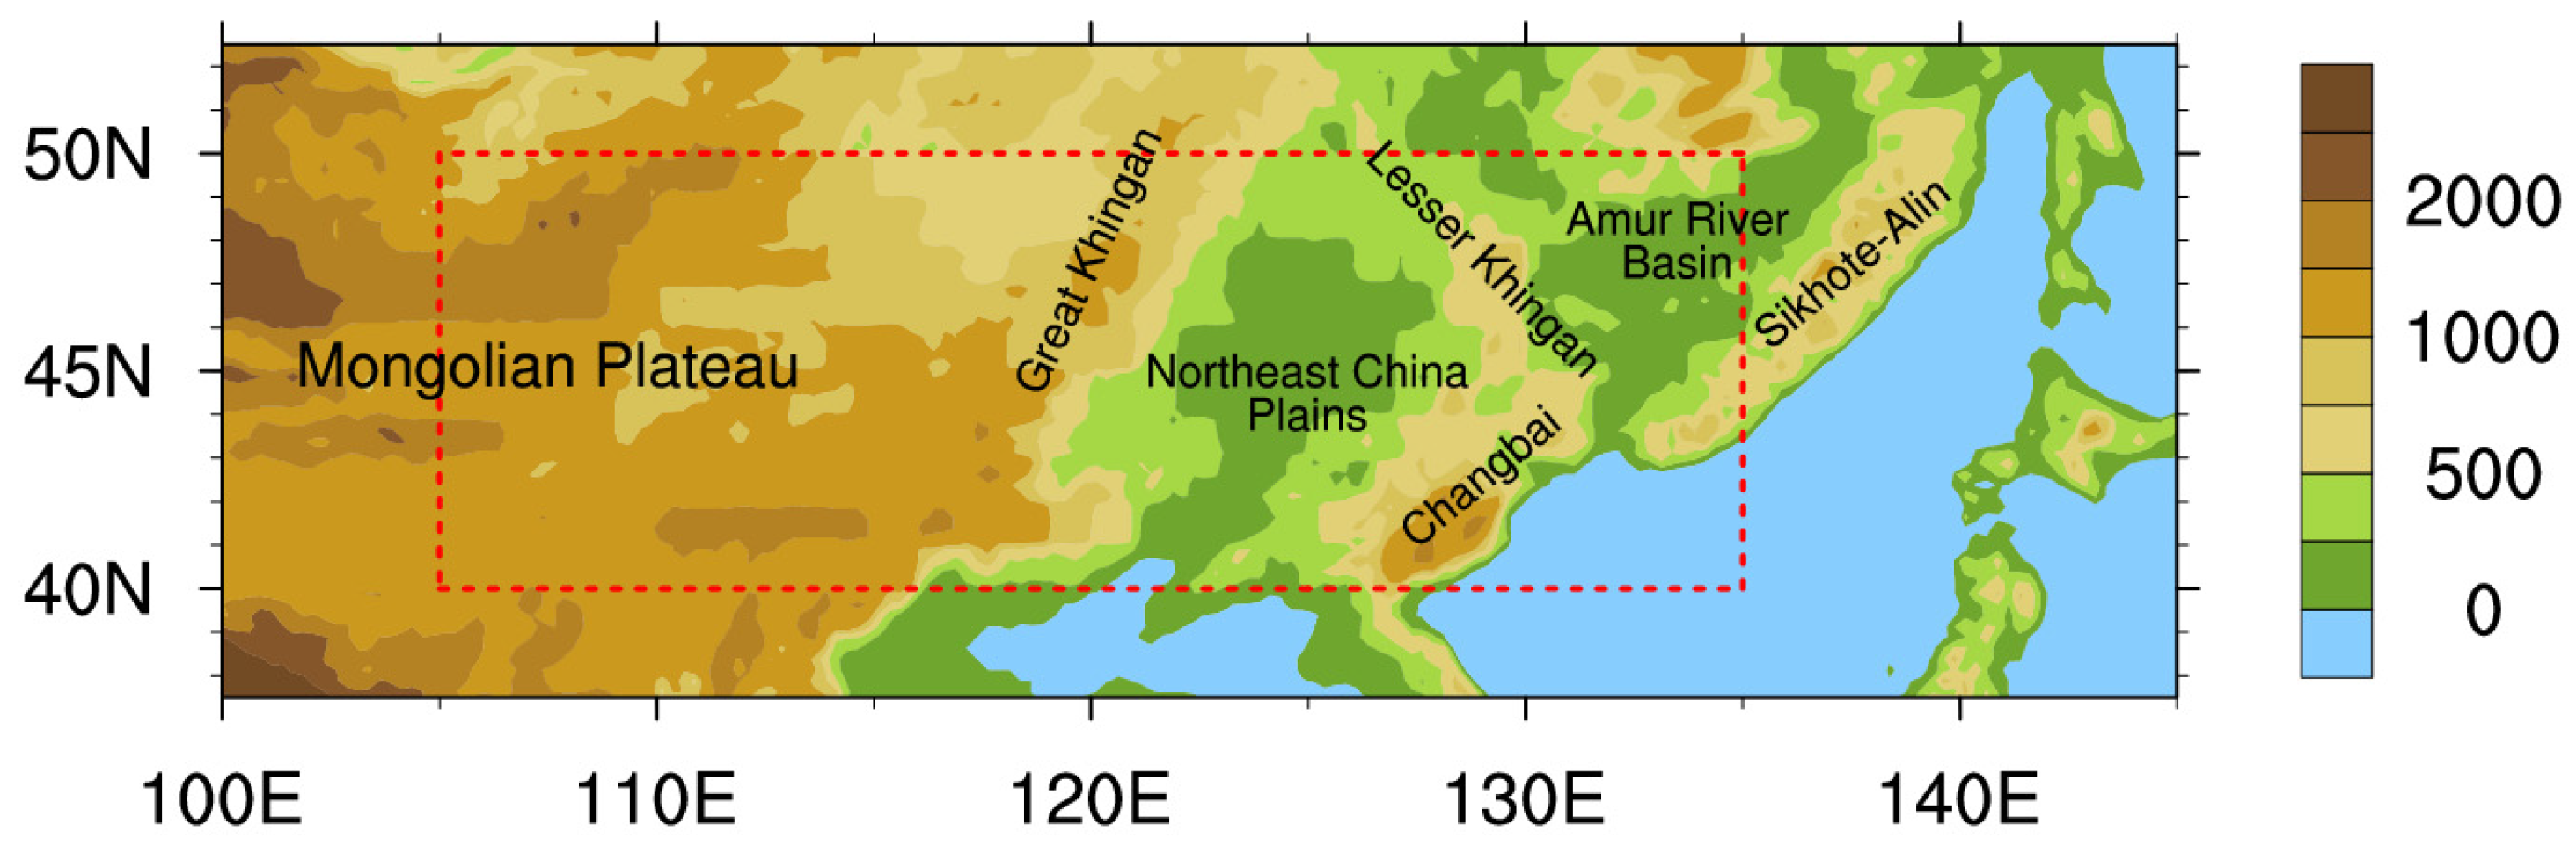
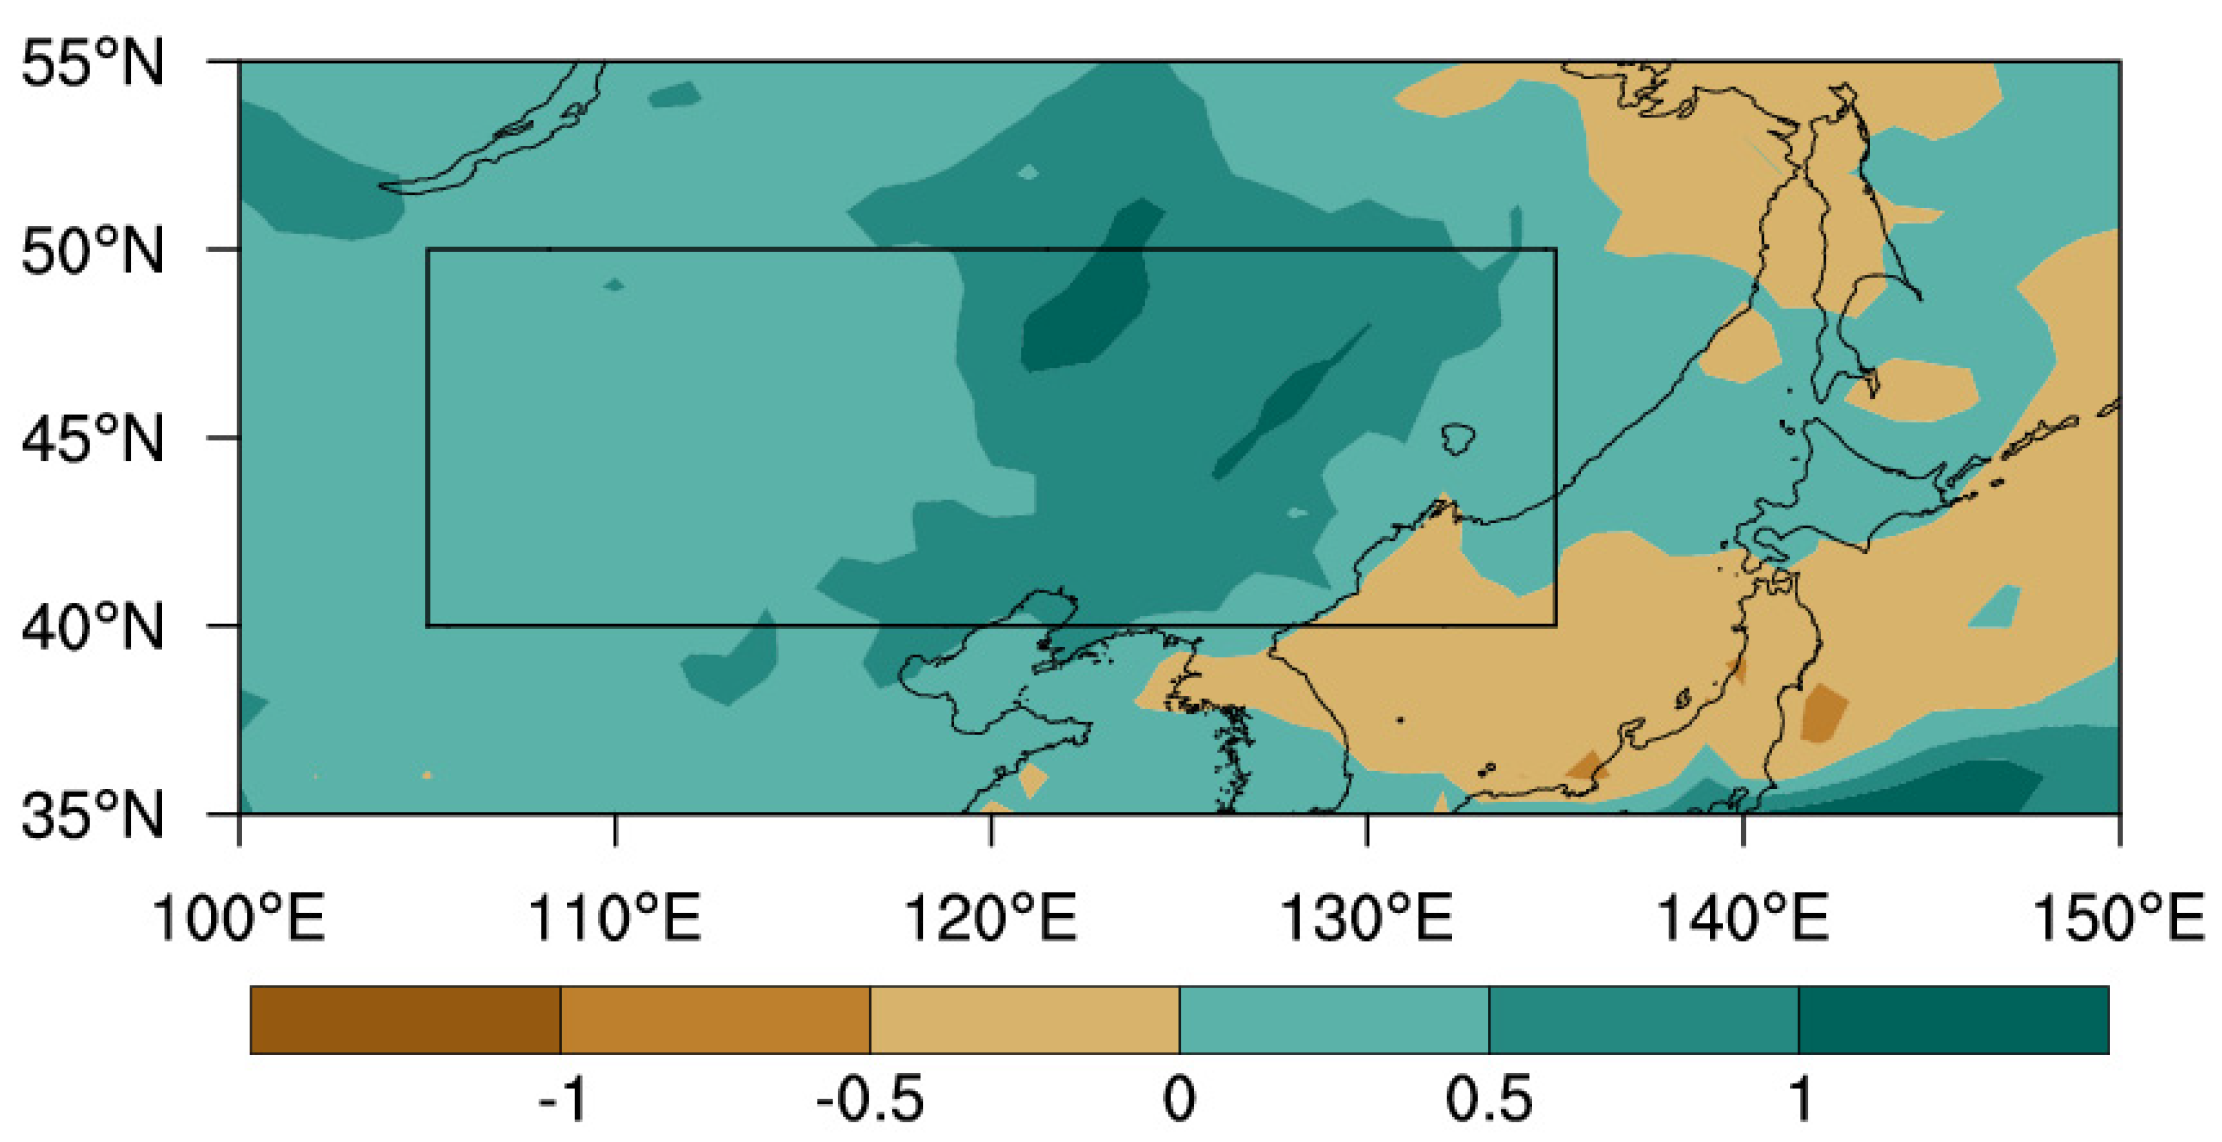
2.1. Study Area
2.2. Data
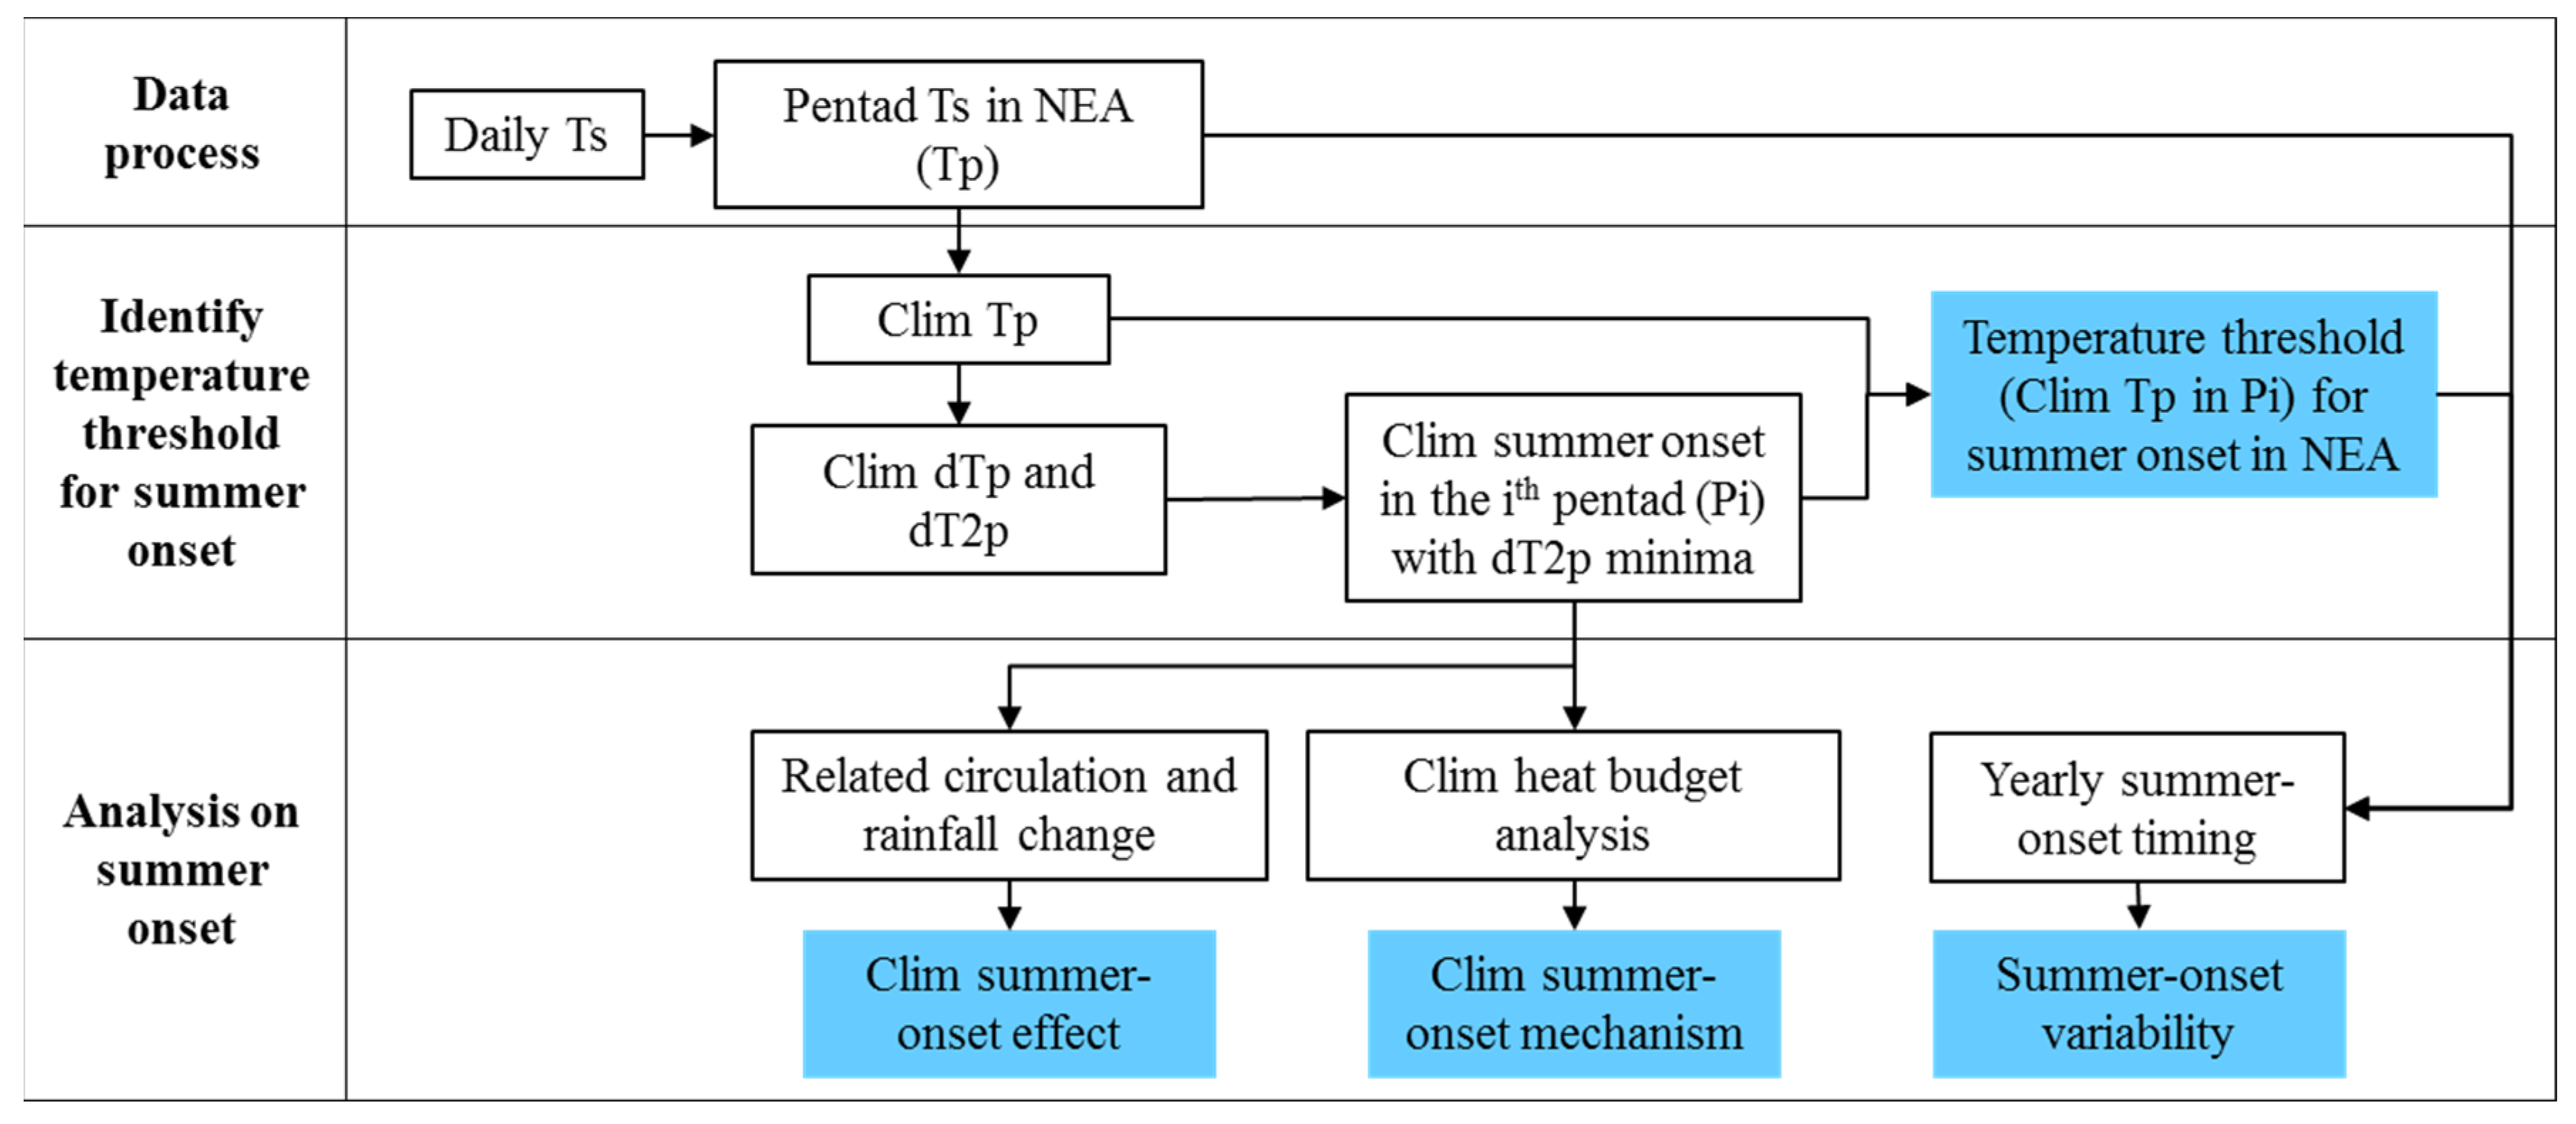
2.3. Definition of Summer Onset in NEA
2.4. Climatological Heat Budget Analysis
3. Results
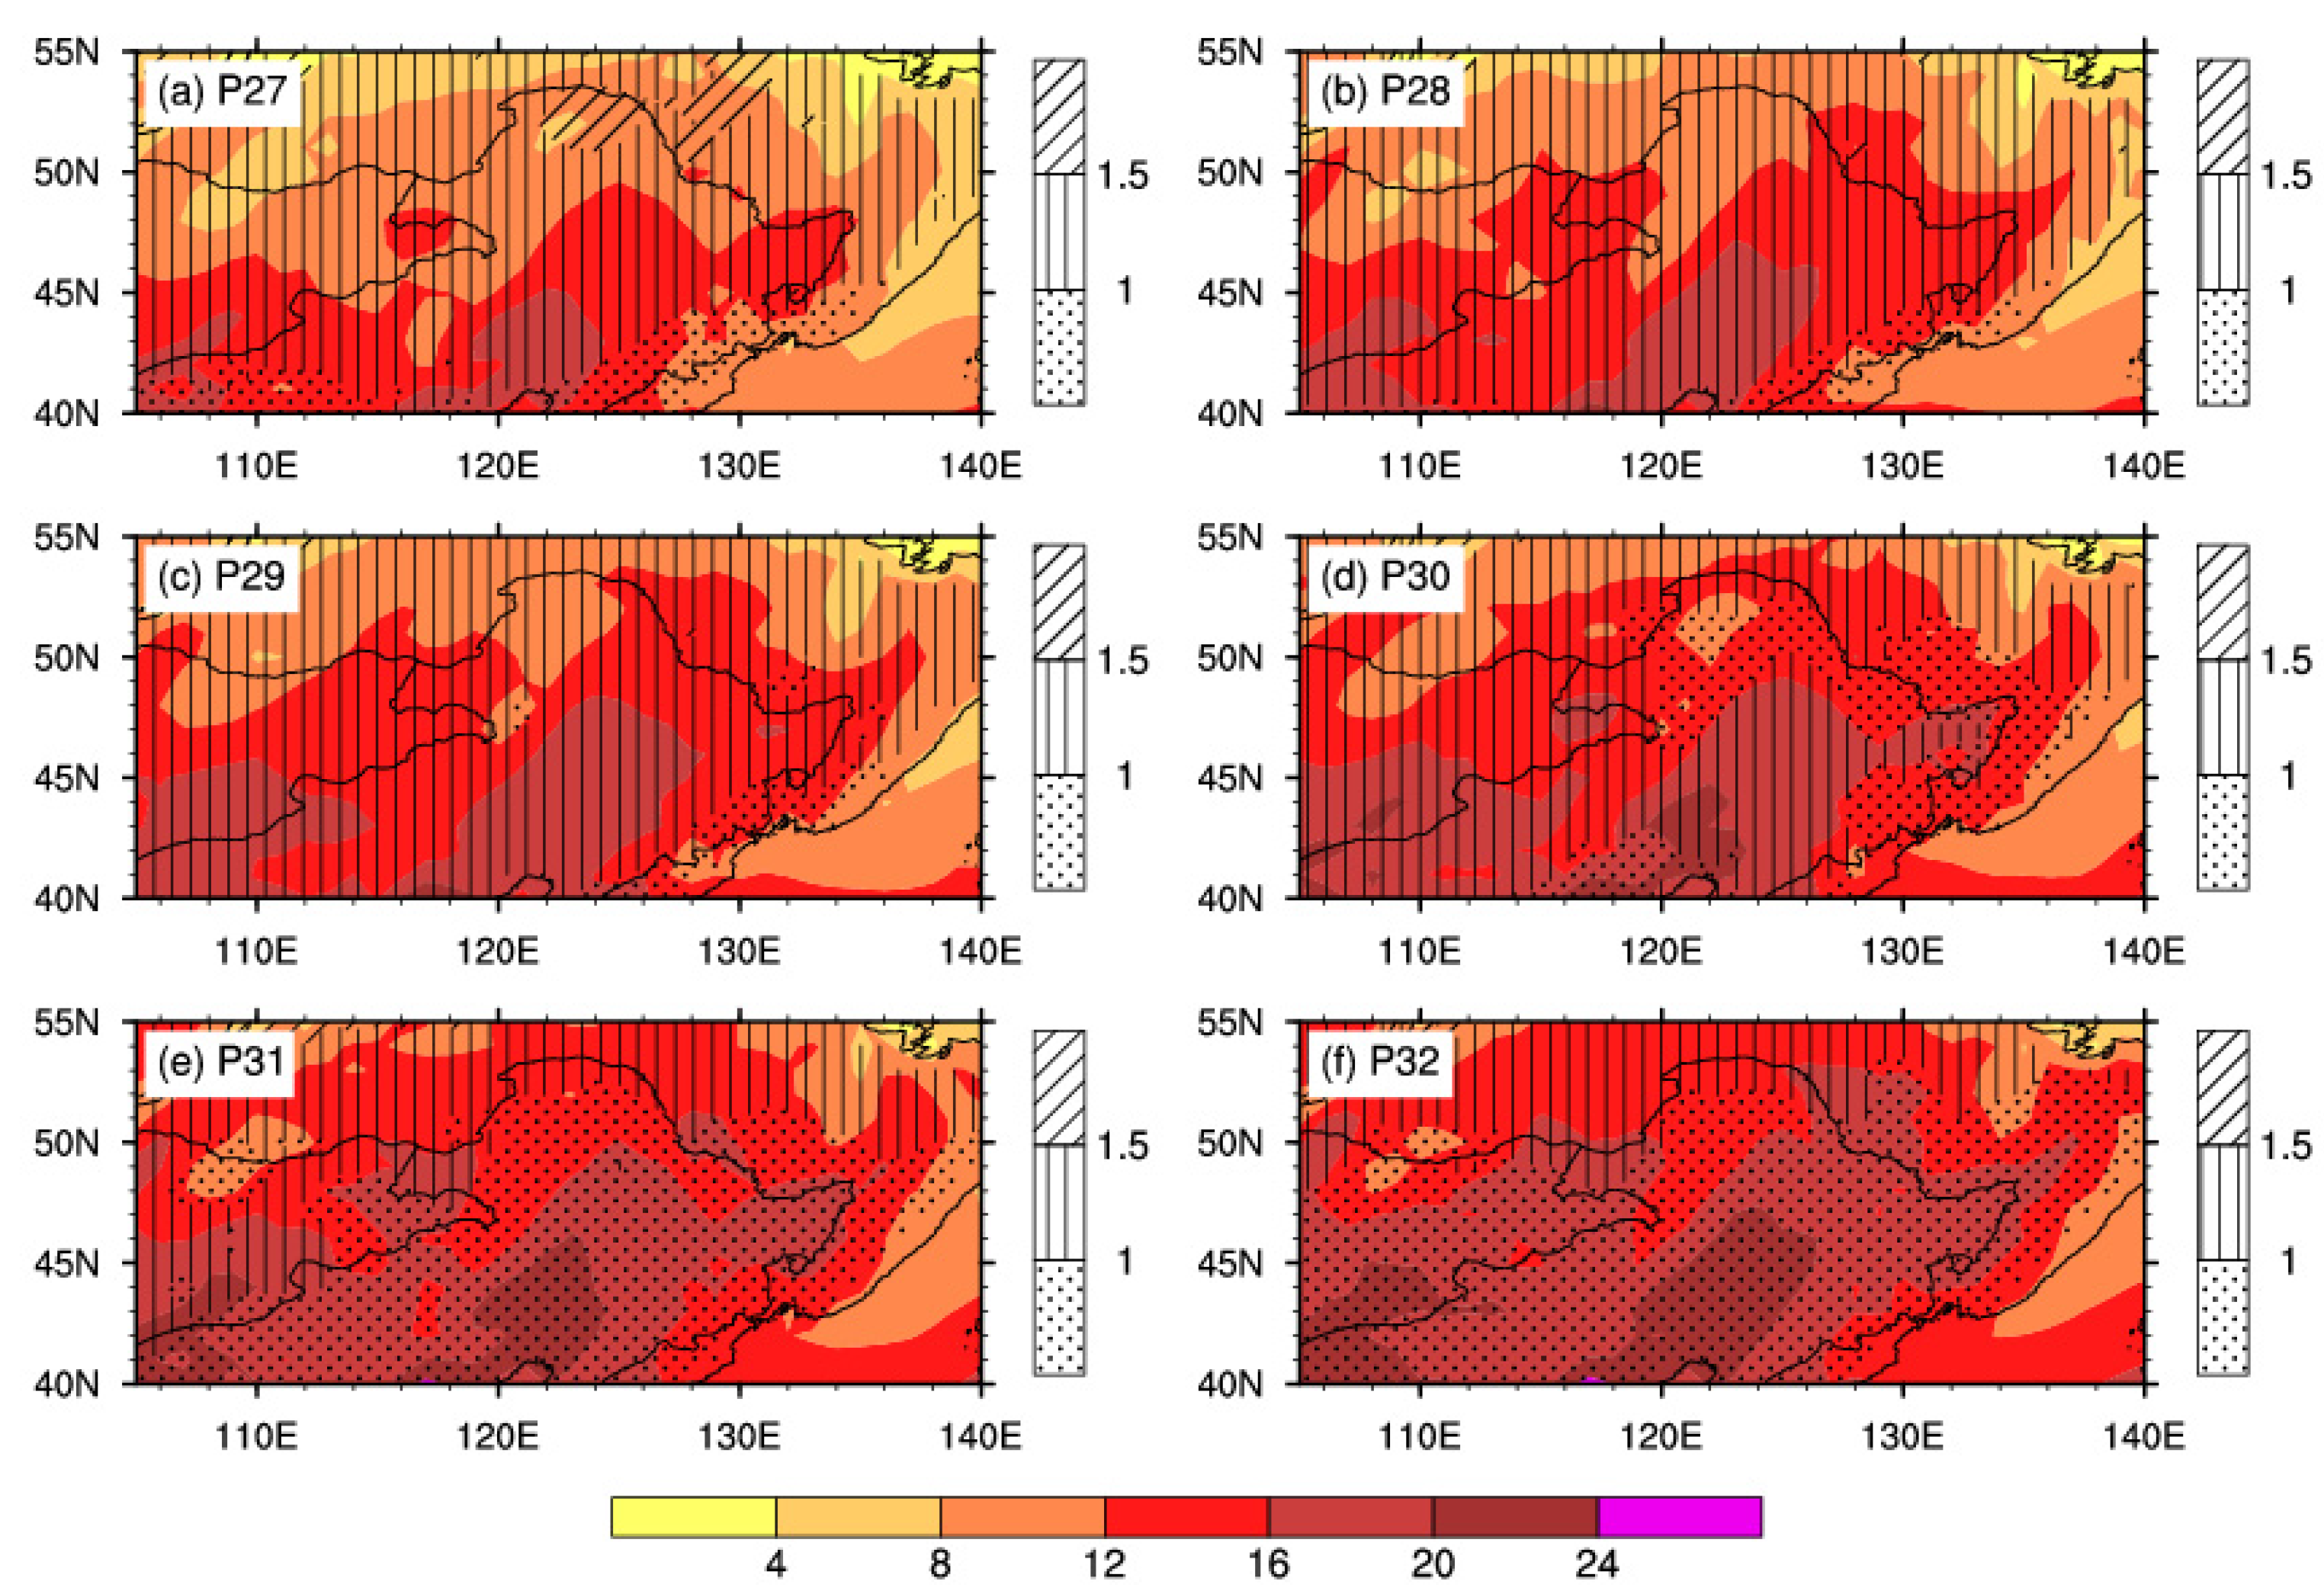
3.1. Summer Onset in NEA
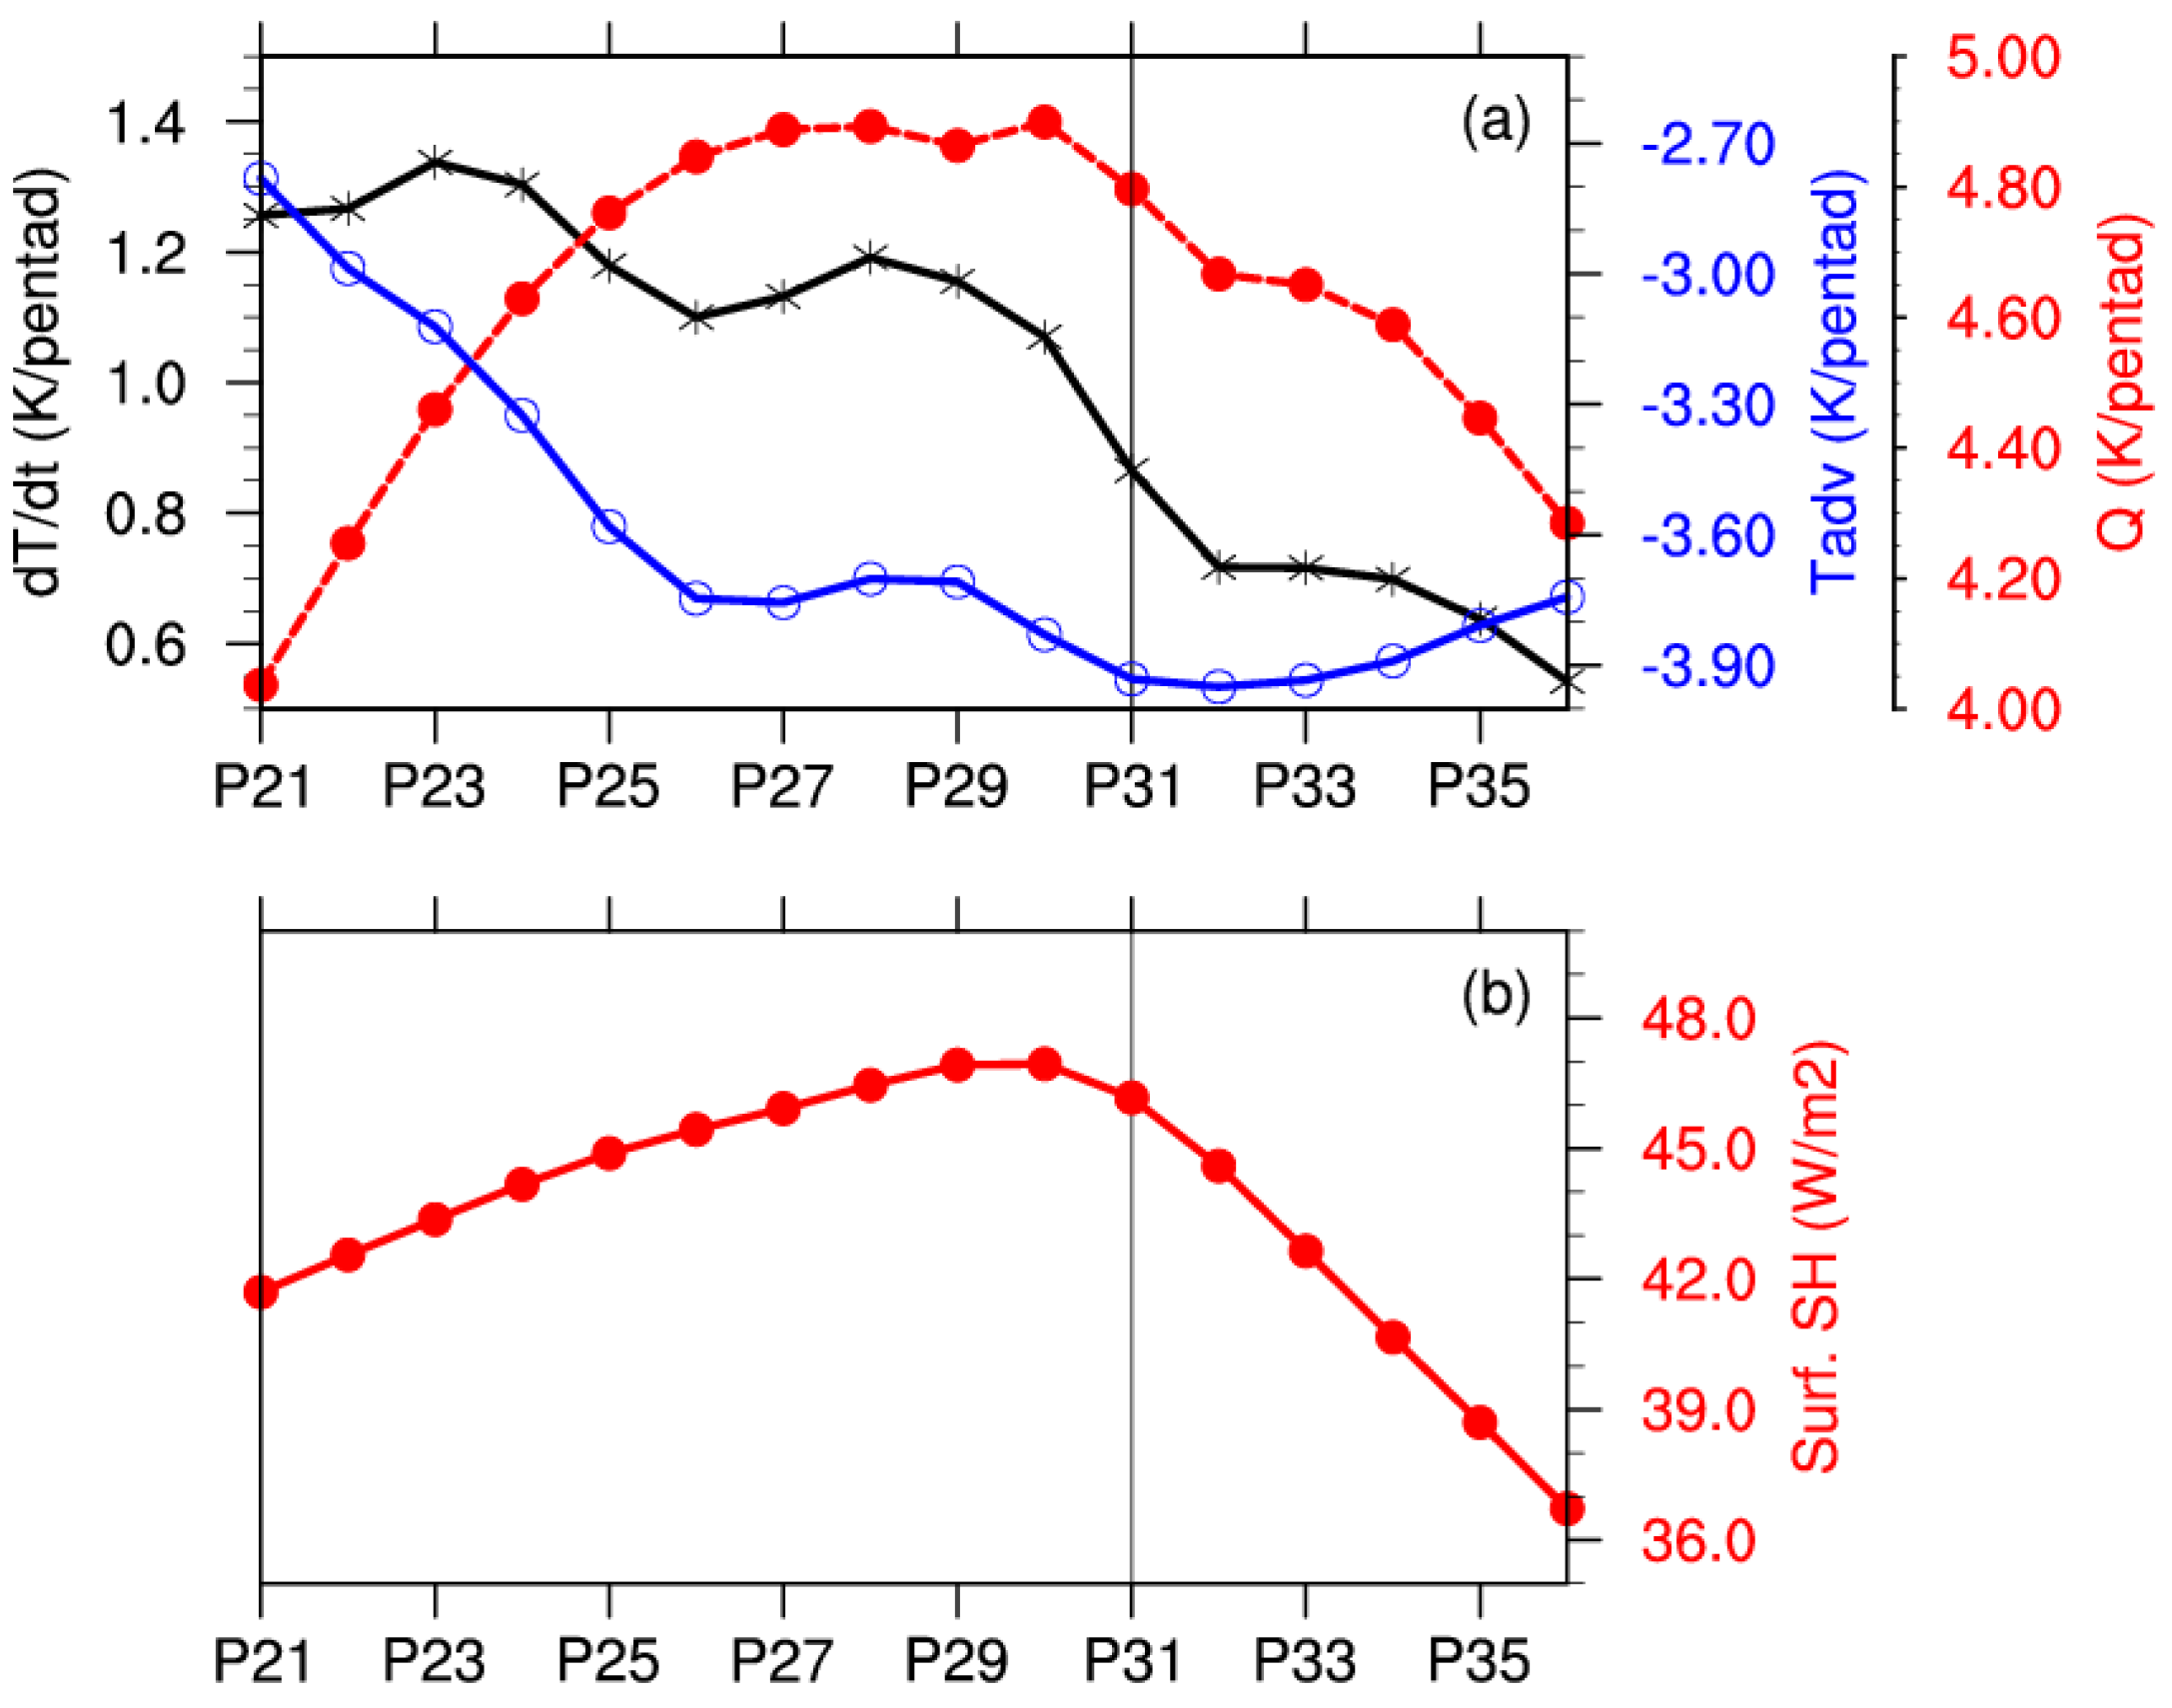
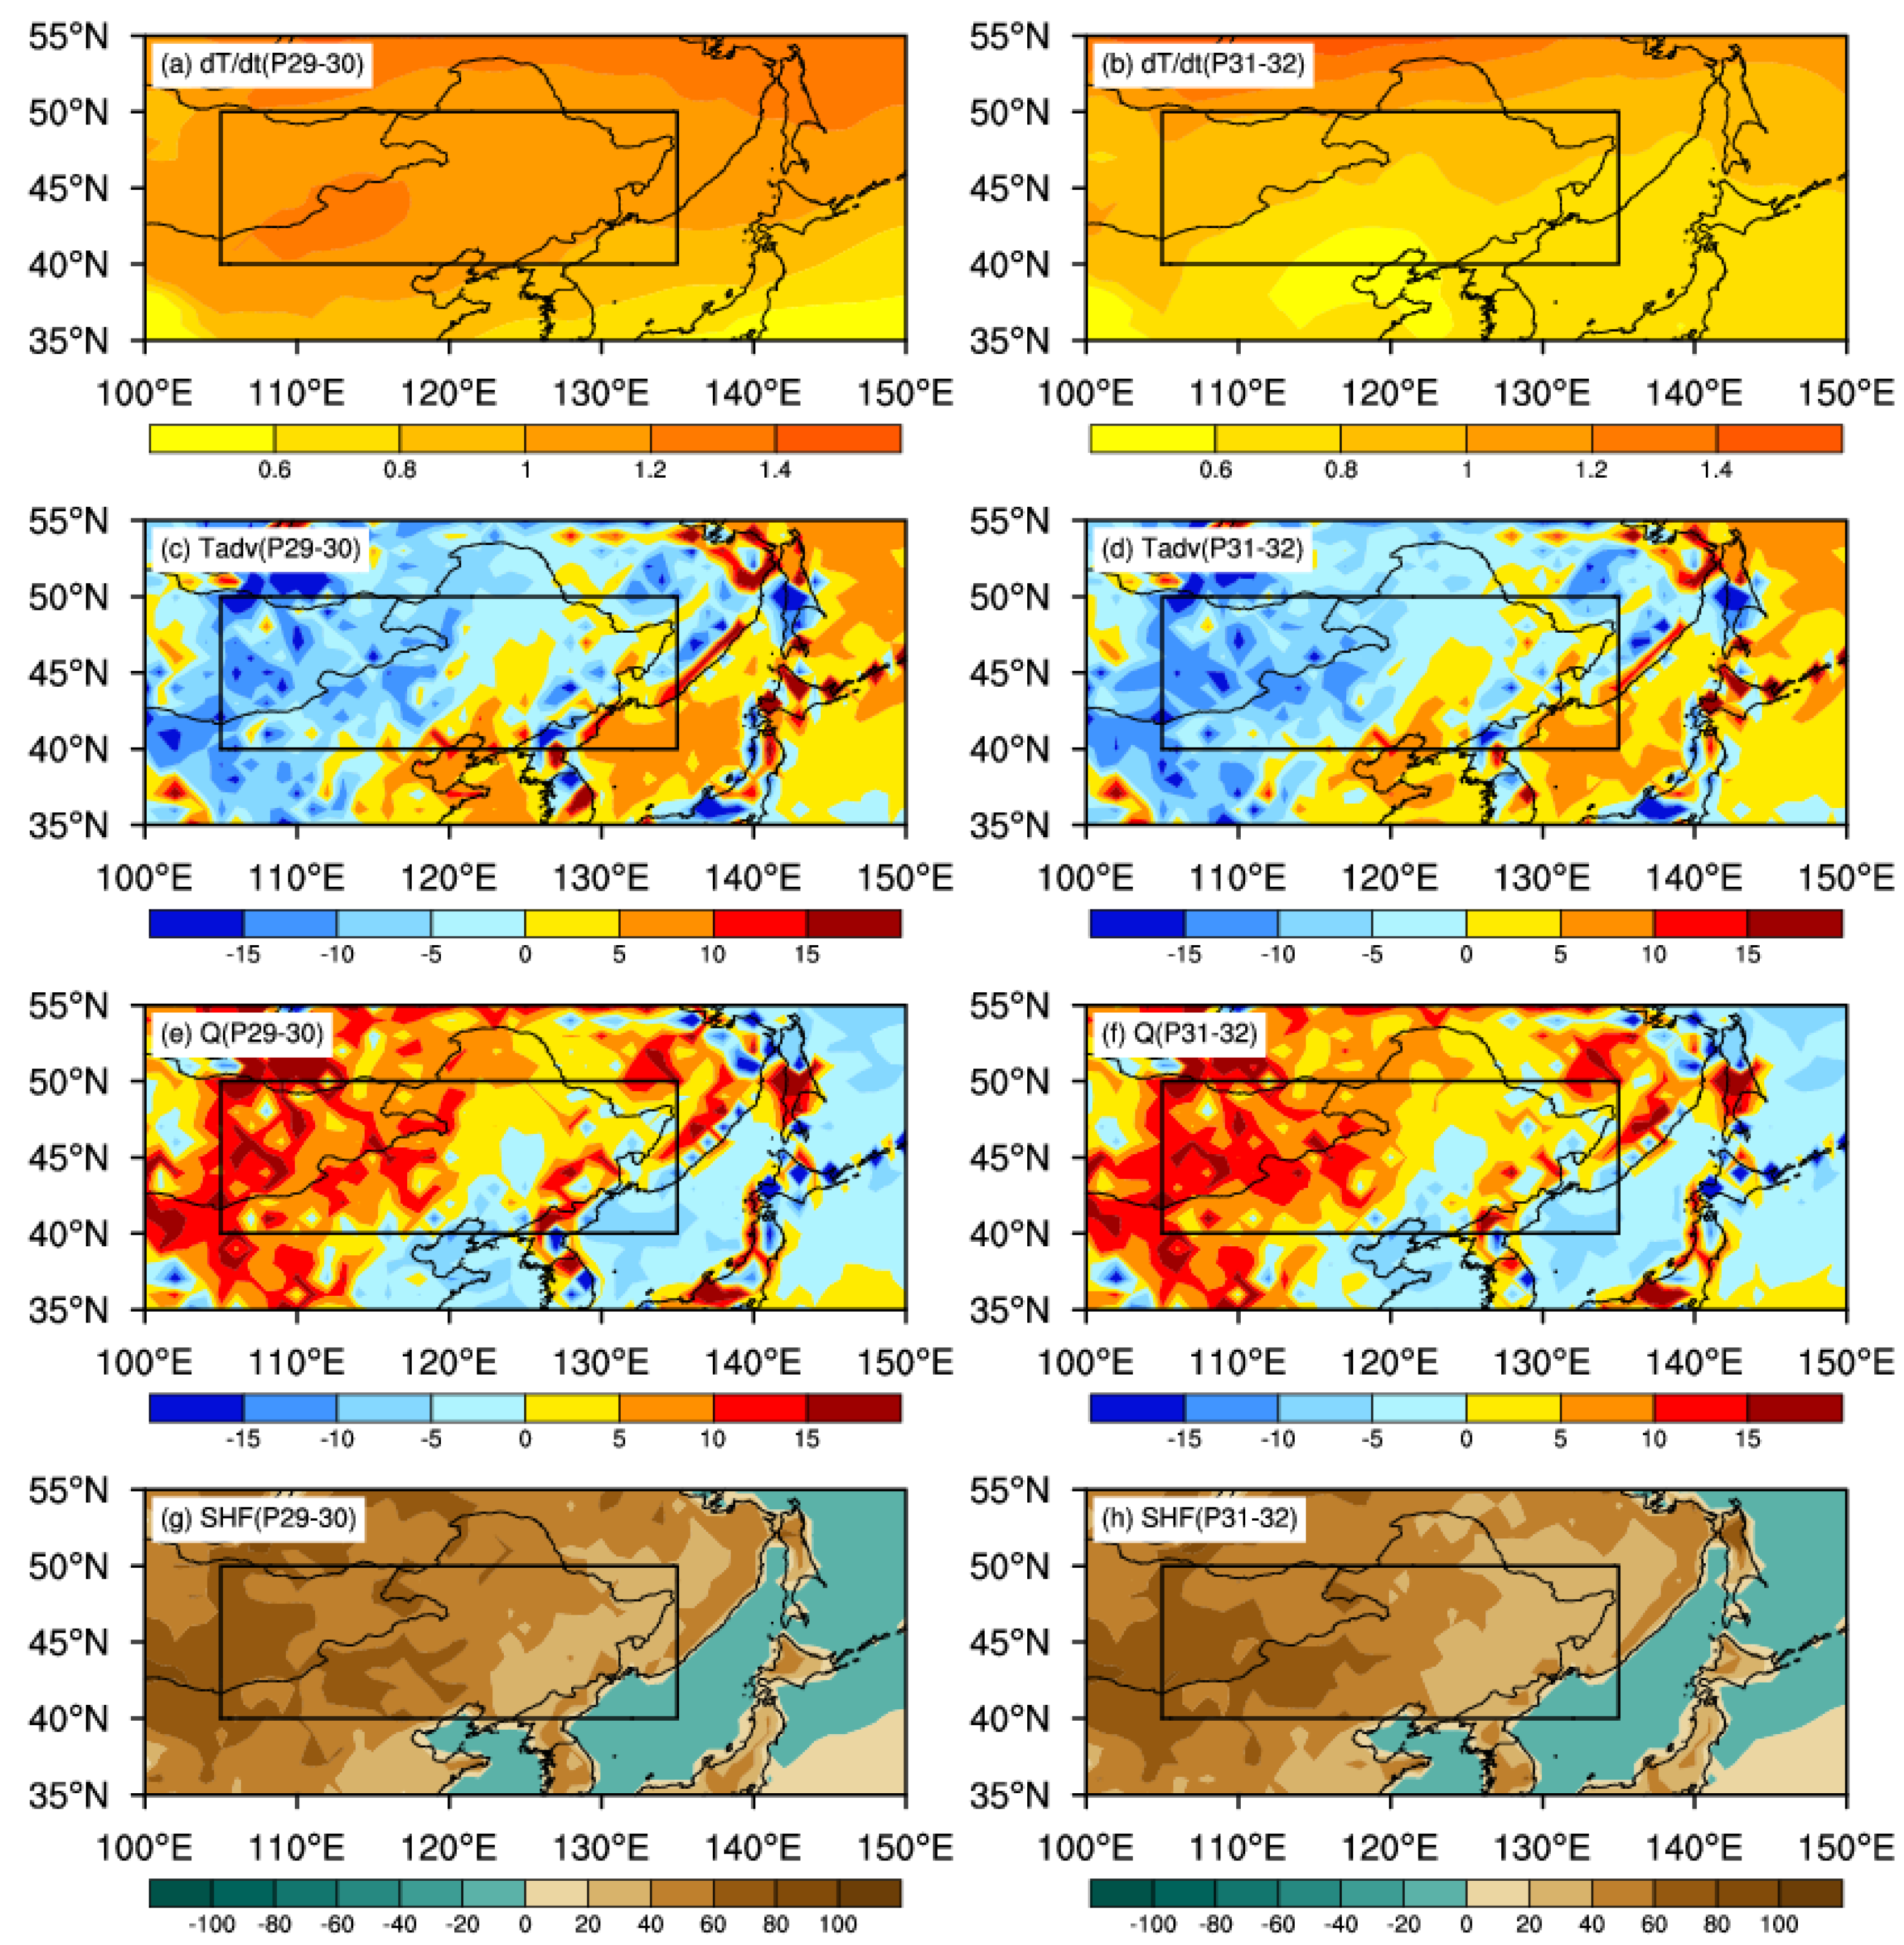
3.2. Mechanism
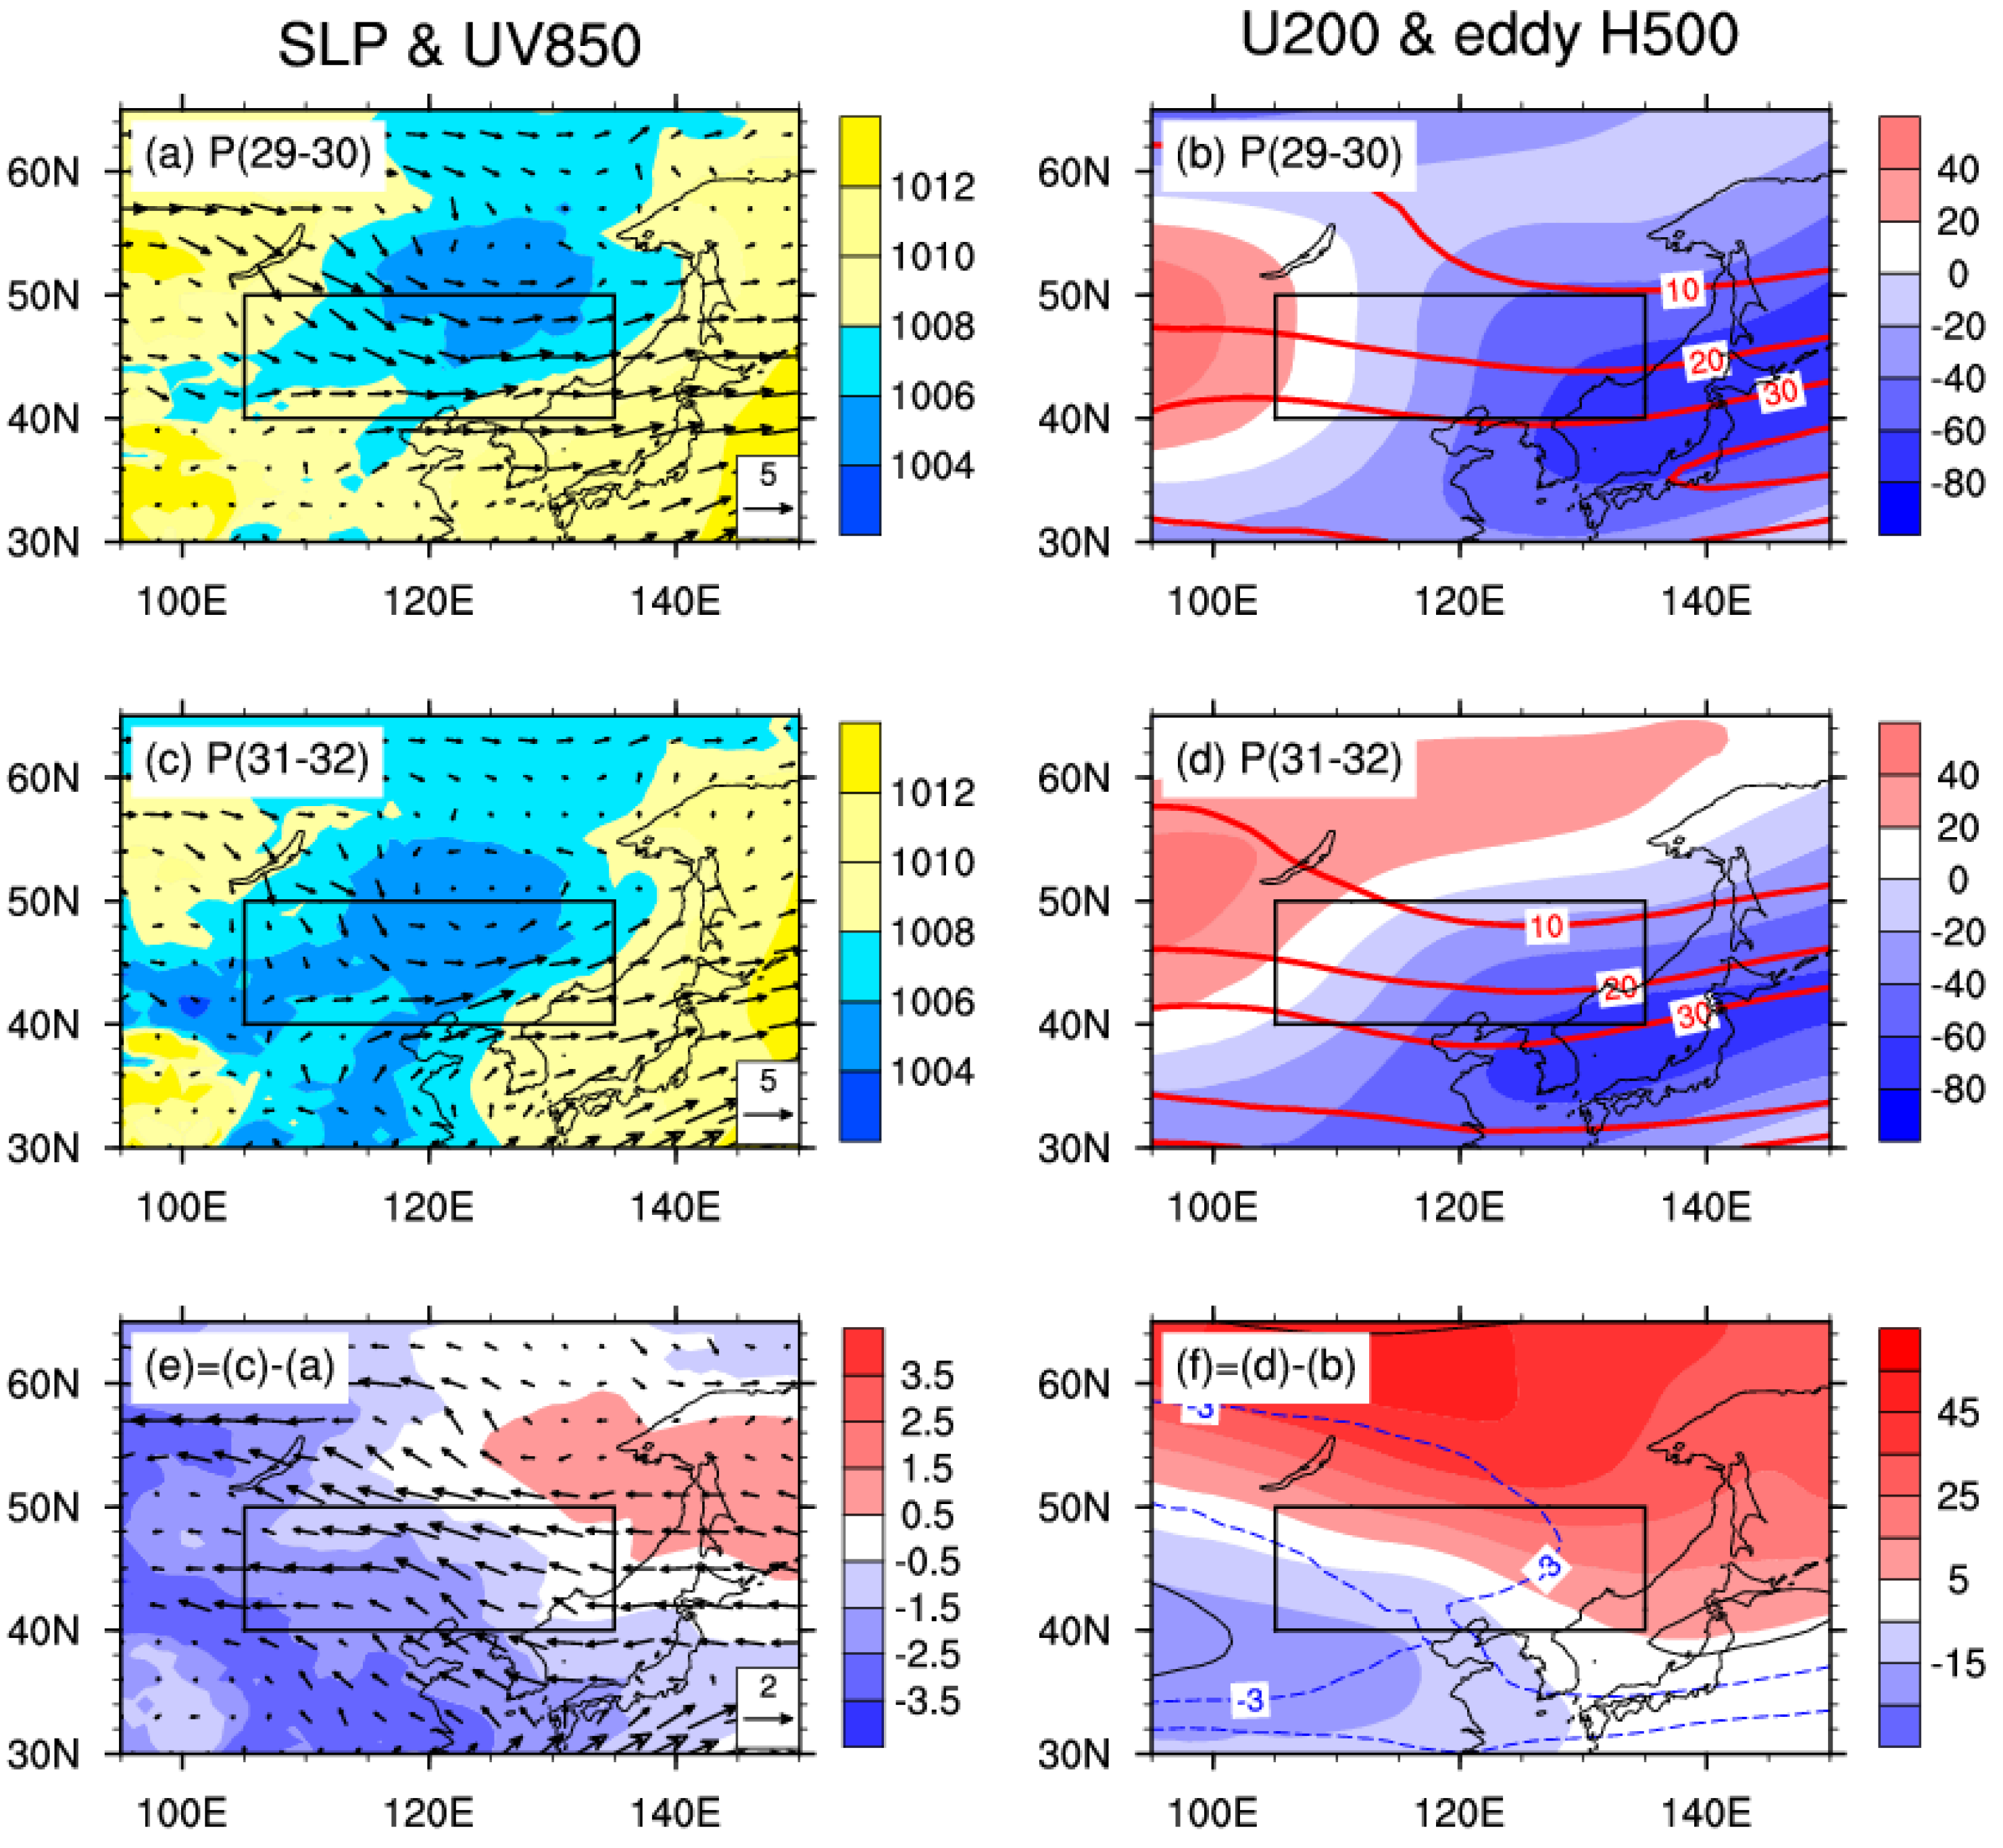
3.3. Related Circulation and Rainfall Changes
3.4. Year-to-Year Variability
4. Discussion
5. Conclusions
Author Contributions
Funding
Institutional Review Board Statement
Informed Consent Statement
Data Availability Statement
Acknowledgments
Conflicts of Interest
References
- Qian, C.; Zhang, X. Human Influences on Changes in the Temperature Seasonality in Mid- to High-Latitude Land Areas. J. Clim. 2015, 28, 5908–5921. [Google Scholar] [CrossRef]
- Thomson, D.J. The Seasons, Global Temperature, and Precession. Science 1995, 268, 59–68. [Google Scholar] [CrossRef] [PubMed]
- Bertram, D.F.; Mackas, D.L.; McKinnell, S.M. The seasonal cycle revisited: Interannual variation and ecosystem consequences. Prog. Oceanogr. 2001, 49, 283–307. [Google Scholar] [CrossRef]
- Walther, G.-R.; Post, E.; Convey, P.; Menzel, A.; Parmesan, C.; Beebee, T.J.C.; Fromentin, J.-M.; Hoegh-Guldberg, O.; Bairlein, F. Ecological responses to recent climate change. Nature 2002, 416, 389–395. [Google Scholar] [CrossRef]
- Parmesan, C. Ecological and Evolutionary Responses to Recent Climate Change. Annu. Rev. Ecol. Evol. Syst. 2006, 37, 637–669. [Google Scholar] [CrossRef] [Green Version]
- Garonna, I.; Jong, R.; Schaepman, M. Variability and evolution of global land surface phenology over the past three decades (1982–2012). Glob. Change Biol. 2015, 22, 1456–1468. [Google Scholar] [CrossRef]
- Zscheischler, J.; Seneviratne, S.I. Dependence of drivers affects risks associated with compound events. Sci. Adv. 2017, 3, e1700263. [Google Scholar] [CrossRef] [PubMed] [Green Version]
- Pfleiderer, P.; Schleussner, C.-F.; Kornhuber, K.; Coumou, D. Summer weather becomes more persistent in a 2 °C world. Nat. Clim. Chang. 2019, 9, 666–671. [Google Scholar] [CrossRef]
- Rasilla, D.; Allende, F.; Martilli, A.; Fernández, F. Heat Waves and Human Well-Being in Madrid (Spain). Atmosphere 2019, 10, 288. [Google Scholar] [CrossRef] [Green Version]
- Alizadeh, M.R.; Abatzoglou, J.T.; Adamowski, J.F.; Prestemon, J.P.; Chittoori, B.; Akbari Asanjan, A.; Sadegh, M. Increasing Heat-Stress Inequality in a Warming Climate. Earth’s Future 2022, 10, e2021EF002488. [Google Scholar] [CrossRef]
- Tao, S.; Chen, L. A review of recent research on the East Asian summer monsoon in China. In Monsoon Meteorology; Chang, C.-P., Krishuamurti, T.N., Eds.; Oxford University Press: New York, NY, USA, 1987; pp. 66–92. [Google Scholar]
- Wang, B.; LinHo. Rainy season of the Asian–Pacific summer monsoon. J. Clim. 2002, 15, 386–398. [Google Scholar] [CrossRef]
- Tanaka, M. Intraseasonal oscillation and the onset and retreat dates of the summer monsoon over the east, southeast and western North Pacific region using GMS high cloud amount data. J. Meteorol. Soc. Jpn. 1992, 70, 613–629. [Google Scholar] [CrossRef] [Green Version]
- Murakami, T.; Matsumoto, J. Summer monsoon over the Asian continent and western North Pacific. J. Meteorol. Soc. Jpn. 1994, 72, 719–745. [Google Scholar] [CrossRef] [Green Version]
- Lau, K.M.; Yang, S. Climatology and interannual variability of the Southeast Asian summer monsoon. Adv. Atmos. Sci. 1997, 14, 141–162. [Google Scholar] [CrossRef]
- Lian, Y.; Shen, B.; Gao, Z.; An, G.; Tang, X. The Study of the On-Set Criterion and the Date of East Asian Summer Monsoon in Northeast China and its Main Characteristic Analysis. Acta Meteorol. Sin. 2003, 61, 548–558. [Google Scholar] [CrossRef]
- Wang, H.; Liu, F.; Dong, W.J. Features of climatological intraseasonal oscillation during Asian summer monsoon onset and their simulations in CMIP6 models. Clim. Dyn. 2022, 59, 3153–3166. [Google Scholar] [CrossRef]
- Qian, J.H.; Lu, M.M.; Sui, C.H. Evolution of South China Sea and East Asian monsoon from spring to summer by the progression of daily weather types. Int. J. Climatol. 2022, 42, 3633–3647. [Google Scholar] [CrossRef]
- Dai, L.; Cheng, T.F.; Lu, M.Q. Define East Asian Monsoon Annual Cycle via a Self-Organizing Map-Based Approach. Geophys. Res. Lett. 2021, 48, e2020GL089542. [Google Scholar] [CrossRef]
- Cao, Q.; Hao, Z.C.; Shao, Q.X.; Hao, J.; Nyima, T. Variability of onset and retreat of the rainy season in mainland China and associations with atmospheric circulation and sea surface temperature. J. Hydrol. 2018, 557, 67–82. [Google Scholar] [CrossRef]
- He, J.H.; Liu, B.Q. The East Asian subtropical summer monsoon: Recent progress. J. Meteorol. Res. 2016, 30, 135–155. [Google Scholar] [CrossRef]
- Zhu, C.W.; Zhou, X.J.; Zhao, P.; Chen, L.X.; He, J.H. Onset of East Asian subtropical summer monsoon and rainy season in China. Sci. China-Earth Sci. 2011, 54, 1845–1853. [Google Scholar] [CrossRef]
- Qian, W.; Ding, T.; Tang, S. Some Understanding of the Seasonal March of Asian Monsoons. J. Trop. Meteorol. 2010, 26, 111–116. [Google Scholar]
- Ding, Y.H.; Chan, J.C.L. The East Asian summer monsoon: An overview. Meteorol. Atmos. Phys. 2005, 89, 117–142. [Google Scholar] [CrossRef]
- Lin, Z.; Yang, Q. Three leading coupled modes of summer rainfall with atmospheric circulations over northern East Asia. Int. J. Climatol. 2022, 42, 5916–5934. [Google Scholar] [CrossRef]
- Piao, S.; Ciais, P.; Huang, Y.; Shen, Z.; Peng, S.; Li, J.; Zhou, L.; Liu, H.; Ma, Y.; Ding, Y.; et al. The impacts of climate change on water resources and agriculture in China. Nature 2010, 467, 43–51. [Google Scholar] [CrossRef]
- Shen, X.; Liu, B.; Henderson, M.; Wang, L.; Wu, Z.; Wu, H.; Jiang, M.; Lu, X. Asymmetric effects of daytime and nighttime warming on spring phenology in the temperate grasslands of China. Agric. For. Meteorol. 2018, 259, 240–249. [Google Scholar] [CrossRef]
- Qian, C.; Yan, Z.; Fu, C. Climatic changes in the Twenty-four Solar Terms during 1960–2008. Chin. Sci. Bull. 2012, 57, 276–286. [Google Scholar] [CrossRef] [Green Version]
- Chang, P. The duration of four seasons in China. Acta Geogr. Sin. 1934, 1, 29–74. [Google Scholar]
- Chen, Y.; Zhang, Y.; Li, Y.; Song, S. Changes in lengths of the four seasons in China and the relationship with changing climate during 1961–2020. Int. J. Climatol. 2022, 1–18. [Google Scholar] [CrossRef]
- Miao, Q.; Wang, Y. Analysis of the division of four seasons in China and its changing characteristics. In Proceedings of the Climate Change Subcommittee of the 2007 Annual Meeting of the Chinese Meteorological Society, Guangzhou, China, 22–25 November 2007; pp. 693–701. [Google Scholar]
- Ma, B.; Zhang, B. Spatio-temporal distribution of the climatic seasonsin China from 1961 to 2016. Acta Geogr. Sin. 2020, 75, 458–469. [Google Scholar] [CrossRef]
- Tang, M.; Zhou, H.; Li, D. The Standard of Marking off the Four Seasons along Qinghai-Xizang Railway and Its Temperature Variation Analysis. Plateau Meteorol. 2003, 22, 440–444. [Google Scholar]
- Qian, C.; Wu, Z.; Fu, C.; Zhou, T. On multi-timescale variability of temperature in China in modulated annual cycle reference frame. Adv. Atmos. Sci. 2010, 27, 1169–1182. [Google Scholar] [CrossRef]
- Trenberth, K.E. What are the Seasons? Bull. Am. Meteorol. Soc. 1983, 64, 1276–1282. [Google Scholar] [CrossRef]
- Yan, Z.; Xia, J.; Qian, C.; Zhou, W. Changes in seasonal cycle and extremes in China during the period 1960–2008. Adv. Atmos. Sci. 2011, 28, 269–283. [Google Scholar] [CrossRef]
- Hekmatzadeh, A.A.; Kaboli, S.; Torabi Haghighi, A. New indices for assessing changes in seasons and in timing characteristics of air temperature. Theor. Appl. Climatol. 2020, 140, 1247–1261. [Google Scholar] [CrossRef] [Green Version]
- Park, B.-J.; Min, S.-K.; Weller, E. Lengthening of summer season over the Northern Hemisphere under 1.5 °C and 2.0 °C global warming. Environ. Res. Lett. 2022, 17, 014012. [Google Scholar] [CrossRef]
- Lin, W.; Wang, C. Longer summers in the Northern Hemisphere under global warming. Clim. Dyn. 2022, 58, 2293–2307. [Google Scholar] [CrossRef]
- Peña-Ortiz, C.; Barriopedro, D.; García-Herrera, R. Multidecadal Variability of the Summer Length in Europe. J. Clim. 2015, 28, 5375–5388. [Google Scholar] [CrossRef] [Green Version]
- Chyi, D.; Bueh, C.; Xie, Z. Summer onset in northern Asia. Int. J. Climatol. 2021, 41, 1094–1111. [Google Scholar] [CrossRef]
- Hersbach, H.; Bell, B.; Berrisford, P.; Hirahara, S.; Horányi, A.; Muñoz-Sabater, J.; Nicolas, J.; Peubey, C.; Radu, R.; Schepers, D.; et al. The ERA5 global reanalysis. Q. J. R. Meteorol. Soc. 2020, 146, 1999–2049. [Google Scholar] [CrossRef]
- Lau, K.-M.; Li, M.-T. The Monsoon of East Asia and its Global Associations—A Survey. Bull. Am. Meteorol. Soc. 1984, 65, 114–125. [Google Scholar] [CrossRef]
- Wang, B.; Wu, Z.; Chang, C.-P.; Liu, J.; Li, J.; Zhou, T. Another Look at Interannual-to-Interdecadal Variations of the East Asian Winter Monsoon: The Northern and Southern Temperature Modes. J. Clim. 2010, 23, 1495–1512. [Google Scholar] [CrossRef] [Green Version]
- Wang, L.; Chen, W.; Zhou, W.; Huang, R. Interannual Variations of East Asian Trough Axis at 500 hPa and its Association with the East Asian Winter Monsoon Pathway. J. Clim. 2009, 22, 600–614. [Google Scholar] [CrossRef]
- Lin, Z.; Wang, B. Northern East Asian low and its impact on the interannual variation of East Asian summer rainfall. Clim. Dyn. 2016, 46, 83–97. [Google Scholar] [CrossRef]
- Lin, Z.; Bueh, C. Interannual variability of the East Asian trough in summer. Clim. Dyn. 2022, 59, 2293–2309. [Google Scholar] [CrossRef]
- Zhang, Y.; Kuang, X.; Guo, W.; Zhou, T. Seasonal evolution of the upper-tropospheric westerly jet core over East Asia. Geophys. Res. Lett. 2006, 33, L11708. [Google Scholar] [CrossRef] [Green Version]
- Chen, W.; Lu, R. A decadal shift of summer surface air temperature over Northeast Asia around the mid-1990s. Adv. Atmos. Sci. 2014, 31, 735–742. [Google Scholar] [CrossRef]
- Hong, X.; Lu, R.; Li, S. Amplified summer warming in Europe–West Asia and Northeast Asia after the mid-1990s. Environ. Res. Lett. 2017, 12, 094007. [Google Scholar] [CrossRef] [Green Version]
- Lin, J.-S.; Wu, B.; Zhou, T.-J. Is the interdecadal circumglobal teleconnection pattern excited by the Atlantic multidecadal Oscillation? Atmos. Ocean. Sci. Lett. 2016, 9, 451–457. [Google Scholar] [CrossRef] [Green Version]
- Wang, L.; Xu, P.; Chen, W.; Liu, Y. Interdecadal Variations of the Silk Road Pattern. J. Clim. 2017, 30, 9915–9932. [Google Scholar] [CrossRef]
- Hong, X.-W.; Xue, S.-H.; Lu, R.-Y.; Liu, Y.-Y. Comparison between the interannual and decadal components of the Silk Road pattern. Atmos. Ocean. Sci. Lett. 2018, 11, 270–274. [Google Scholar] [CrossRef] [Green Version]
- Monerie, P.-A.; Robson, J.; Dong, B.; Dunstone, N. A role of the Atlantic Ocean in predicting summer surface air temperature over North East Asia? Clim. Dyn. 2018, 51, 473–491. [Google Scholar] [CrossRef] [Green Version]
- Zhu, Y.; Wang, H.; Zhou, W.; Ma, J. Recent changes in the summer precipitation pattern in East China and the background circulation. Clim. Dyn. 2011, 36, 1463–1473. [Google Scholar] [CrossRef]
- Zhu, C.; Wang, B.; Qian, W.; Zhang, B. Recent weakening of northern East Asian summer monsoon: A possible response to global warming. Geophys. Res. Lett. 2012, 39, L09701. [Google Scholar] [CrossRef]
- Dong, B.; Sutton, R.T.; Chen, W.; Liu, X.; Lu, R.; Sun, Y. Abrupt summer warming and changes in temperature extremes over Northeast Asia since the mid-1990s: Drivers and physical processes. Adv. Atmos. Sci. 2016, 33, 1005–1023. [Google Scholar] [CrossRef]

Disclaimer/Publisher’s Note: The statements, opinions and data contained in all publications are solely those of the individual author(s) and contributor(s) and not of MDPI and/or the editor(s). MDPI and/or the editor(s) disclaim responsibility for any injury to people or property resulting from any ideas, methods, instructions or products referred to in the content. |
© 2023 by the authors. Licensee MDPI, Basel, Switzerland. This article is an open access article distributed under the terms and conditions of the Creative Commons Attribution (CC BY) license (https://creativecommons.org/licenses/by/4.0/).
Share and Cite
Shi, C.; Lin, Z.; Lian, Y.; Li, S.; Yang, X.; Shen, B.; Su, L.; Liu, G. Summer Onset in Northern East Asia: Feature, Mechanism and Variability. Atmosphere 2023, 14, 187. https://doi.org/10.3390/atmos14010187
Shi C, Lin Z, Lian Y, Li S, Yang X, Shen B, Su L, Liu G. Summer Onset in Northern East Asia: Feature, Mechanism and Variability. Atmosphere. 2023; 14(1):187. https://doi.org/10.3390/atmos14010187
Chicago/Turabian StyleShi, Chen, Zhongda Lin, Yi Lian, Shangfeng Li, Xu Yang, Baizhu Shen, Lixin Su, and Gang Liu. 2023. "Summer Onset in Northern East Asia: Feature, Mechanism and Variability" Atmosphere 14, no. 1: 187. https://doi.org/10.3390/atmos14010187
APA StyleShi, C., Lin, Z., Lian, Y., Li, S., Yang, X., Shen, B., Su, L., & Liu, G. (2023). Summer Onset in Northern East Asia: Feature, Mechanism and Variability. Atmosphere, 14(1), 187. https://doi.org/10.3390/atmos14010187