Article

An Enhanced Atmospheric Pre-Corrected Differential Absorption (APDA) Algorithm by Extending LUTs Applied to Analyze ZY1-02D Hyperspectral Images

1
Airborne Remote Sensing Center, Aerospace Information Research Institute, Chinese Academy of Sciences, Beijing 100094, China
2
Foshan-Siwei lnnovation Center for Spatial and Temporal Data, Foshan 528051, China
3
China Centre for Resources Satellite Data and Application, Beijing 100094, China
4
China Shenhua Energy Company Limited, Beijing 100011, China
*
Author to whom correspondence should be addressed.
Atmosphere 2023, 14(10), 1560; https://doi.org/10.3390/atmos14101560
Submission received: 24 July 2023 / Revised: 7 October 2023 / Accepted: 7 October 2023 / Published: 13 October 2023
(This article belongs to the Special Issue New Insights in Atmospheric Water Vapor Retrieval)

Abstract

:
Water vapor is a crucial component of the atmosphere. Its absorption significantly influences remote sensing by impacting radiation signals transmitted through the atmosphere. Determining columnar water vapor (CWV) from hyperspectral remote sensing data is essential during the imagery atmospheric correction process. Over the past 40 years, numerous CWV inversion algorithms have been developed, with refinements to enhance retrieval accuracy and reliability. In this study, we proposed an enhanced atmospheric pre-corrected differential absorption (APDA) algorithm. This enhancement was achieved by thoroughly analyzing water vapor absorption in relation to elevation and aerosol optical depth and extending look up tables (LUTs). The enhanced method utilizes a pre-built MODTRAN lookup table and is applied to ZY1-02D hyperspectral data from a satellite launched in 2020. We compared the inversion results of 10 ZY1-02D scenes obtained using the improved method with AERONET measurements and inversion results from commonly used atmospheric correction software, namely, FLAASH and ATCOR. The updated algorithm demonstrated a lower average error (0.0568 g·cm−2) and relative average error (10.49%) compared to the ATCOR software (0.17 g·cm−2 and 40.78%, respectively) and the FLAASH module (0.13 g·cm−2 and 30.82%, respectively). Consequently, the enhanced method outperforms traditional CWV inversion algorithms, especially at high altitudes.

1. Introduction

Water vapor is one of the most important and active components of the atmosphere and is an indispensable part of the Earth’s ecosystem. Water vapor in the atmosphere is generally distributed at low altitudes and rapidly changes its form in time and space through evaporation, condensation, and precipitation [1,2,3]. Water vapor absorption is an important factor affecting the radiation signal. Therefore, common methods to obtain columnar water vapor (CWV) include measurements from microwave radiometers and ground-based solar photometers, as well as retrievals based on remote sensing data [4,5,6]. Traditional algorithms for remote sensing data are based on near-infrared bands, such as the continuous interpolated band ratio (CIBR) algorithm [7]. The basic principle of this algorithm is calculating the ratio of the atmospheric water vapor absorption channel proximate to the near-infrared band and the atmospheric window channel nearest to the channel that is unaffected by water vapor to retrieve atmospheric water vapor. Therefore, the CIBR algorithm is traditionally called a channel ratio algorithm. Kaufman et al. [8] performed water vapor inversion on Moderate Resolution Imaging Spectroradiometer (MODIS) data based on the CIBR algorithm and applied this method to Airborne Visible Infrared Imaging Spectrometer (AVIRIS) data to provide theoretical support for the water vapor inversion of subsequent hyperspectral data. Gao et al. [9] explained the principle of the two-channel and three-channel ratio algorithm in detail, introduced its application to MODIS data, displayed the water vapor retrieval products at all levels, and compared the retrieved CWV with that observed by a microwave radiometer. The error was typically between 5% and 10%. Near-infrared and infrared methods were used to retrieve water vapor based on MODIS data and the results were verified using water vapor measured by Global Positioning System (GPS) [10]. The atmospheric CWV retrieved using the near-infrared algorithm has better accuracy. The proposed atmospheric pre-corrected differential absorption (APDA) algorithm [11] accounts for the influence of atmospheric path radiance on water vapor retrieval, and it has a higher accuracy of water vapor retrieval than that in the traditional CIBR algorithm in AVIRIS hyperspectral data. The inversion results derived from Sentinel-2 data using the APDA algorithm were cross-verified against CWV measurements from the Aerosol Robotic Network (AERONET) ground observation site [12]. The results from both methods demonstrated a high correlation, with a root-mean-square error (RMSE) of 0.1.
ZY1-02D, launched in 2020, is a hyperspectral satellite with 166 bands spanning the visible, near-infrared, and short-wave infrared spectra. Currently, no studies have reported on using either the CIBR or APDA algorithms to retrieve water vapor from the ZY1-02D data. In this study, we conducted a comprehensive analysis of the APDA algorithm. Subsequently, the enhanced algorithm was employed for the water vapor inversion of ZY1-02D data. The algorithm’s accuracy was then confirmed by juxtaposing the CWV readings from the AERONET site against inversions by FLAASH and ATCOR. It must be noted that this study did not modify the APDA algorithm, but further expanded it by considering factors such as elevation and AOD.

2. Materials and Methods

2.1. Introduction to ZY1-02D Hyperspectral Satellite Data

The ZY1-02D satellite is an important scientific and technological support for China’s high-quality development of natural resources. Applications of ZY1-02D include urban heat island monitoring and land surface ecological environment detection. The satellite operates in a Sun-synchronous orbit with a regression period of 55 days and a design life of 5 years (Table 1).

2.2. Introduction of AERONET Data

AERONET is a ground-based aerosol monitoring network established by the National Aeronautics and Space Administration to monitor global aerosol characteristics with over 500 global sites. AERONET stations use the same observation instruments worldwide; therefore, their inversion accuracy is globally consistent. Their observed data are strictly processed and reviewed with high accuracy and are usually used as true values [13,14].
This study used AERONET-measured aerosol optical depth (AOD) as the input for the CWV inversion from the ZY1-02D data, and its observed CWV was used to verify the accuracy of the inversion results. The three levels of AERONET data are as follows [15]: Level 1.0 represents unfiltered and uncorrected data; Level 1.5 represents data that underwent prior cloud screening, but the quality is not fully guaranteed; Level 2.0 represents data that were calibrated, cloud screened, and manually inspected, and the data quality is guaranteed. Level 2.0 data are typically selected in scientific research to verify the accuracy of remote sensing data [16]. However, only a few sites could provide Level 2.0 data with the same imaging time as ZY1-02D during data retrieval. Therefore, Level 1.5 AERONET data were used to match the ZY1-02D data in this study.
The spatial subset of 5 × 5 km CWV retrievals from the ZY1-02D data centered at the AERONET site were averaged and compared with the AERONET measurements. The retrieved images are cloudless, and the difference between the observation time of the ground-based measurements and the imaging time of the sensor is not more than half an hour [17,18]. Finally, 10 ZY1-02D images satisfying the above requirements were selected. Images that matched the measurements of the five AERONET sites are shown in Table 2.

2.3. Principle of the APDA Algorithm

The radiance received by the satellite for the near-infrared channel can be approximately expressed as [9]:
L λ = L p a t h λ + E S U N λ μ 0 / π T λ ρ ( λ )
where L(λ) is the radiance received by the sensor, Lpath (λ) is the path radiance, ESUN (λ) is the extraterrestrial solar irradiance, μ0 is the cosine of the solar zenith angle, T(λ) is the total atmospheric transmittance in the upward and downward directions, and ρ (λ) is the surface reflectance. The atmospheric transmittance is approximately one in the atmospheric window. The reflectance slope can be determined using the reference channels on both sides of the absorption band. One measurement channel was ratioed to a linearly interpolated value at the same wavelength between the two reference channels. The following formula was obtained [19] based on the above conditions:
R A P D A = L m L a t m , m ω r 1 ( L r 1 L a t m , r 1 ) + ω r 2 ( L r 2 L a t m , r 2 )
where RAPDA is the band ratio calculated by the APDA algorithm (the transmissivity of water channel absorption); Lm is the radiance of the band affected by the water vapor absorption effect (water channel absorption); Lr1 and Lr2 are the radiances of the band unaffected by the water vapor absorption effect (water channel reference); Latm,i is the path radiance that can be simulated by running the radiative transfer model under the assumption that the surface reflectance is 0; ωr1 and ωr2 are the weight values calculated from the distance from the water channel absorption to the water channel reference:
ω r 1 = λ r 2 λ m λ r 2 λ 1 , ω r 2 = λ m λ r 1 λ r 2 λ 1
Previous studies show a logarithmic relationship between the band ratio and CWV [9].
R A P D A = exp ( α + β w * )
where w* is the content of the slant water vapor column. A lookup table (LUT) for the relationship between water vapor content and the ratio value is generally pre-built based on the radiative transfer model. The constants α and β are derived from the LUT and used to invert the ratio image to the final retrieved total CWV distribution image. This study built a LUT based on the MODTRAN [20,21] radiative transfer model.
The relationship between the vertical and slanted water vapor column contents was expressed as follows:
w = w * / ( 1 / cos θ s + 1 / cos θ v )
where θs and θv are the zenith angles of the Sun and the satellite, respectively.
This article analyzes the impact of AOD and elevation on water vapor inversion, building on previous research. Due to the weak radiance over water bodies, the enhanced APDA algorithm was primarily applied to land surfaces [22].

2.4. Optimizing the APDA Algorithm

Two key points should be considered when using the APDA algorithm to realize water vapor inversion: selecting water channel absorption and constructing a water vapor inversion LUT. This section discusses these two points and optimizes the water vapor inversion algorithm.

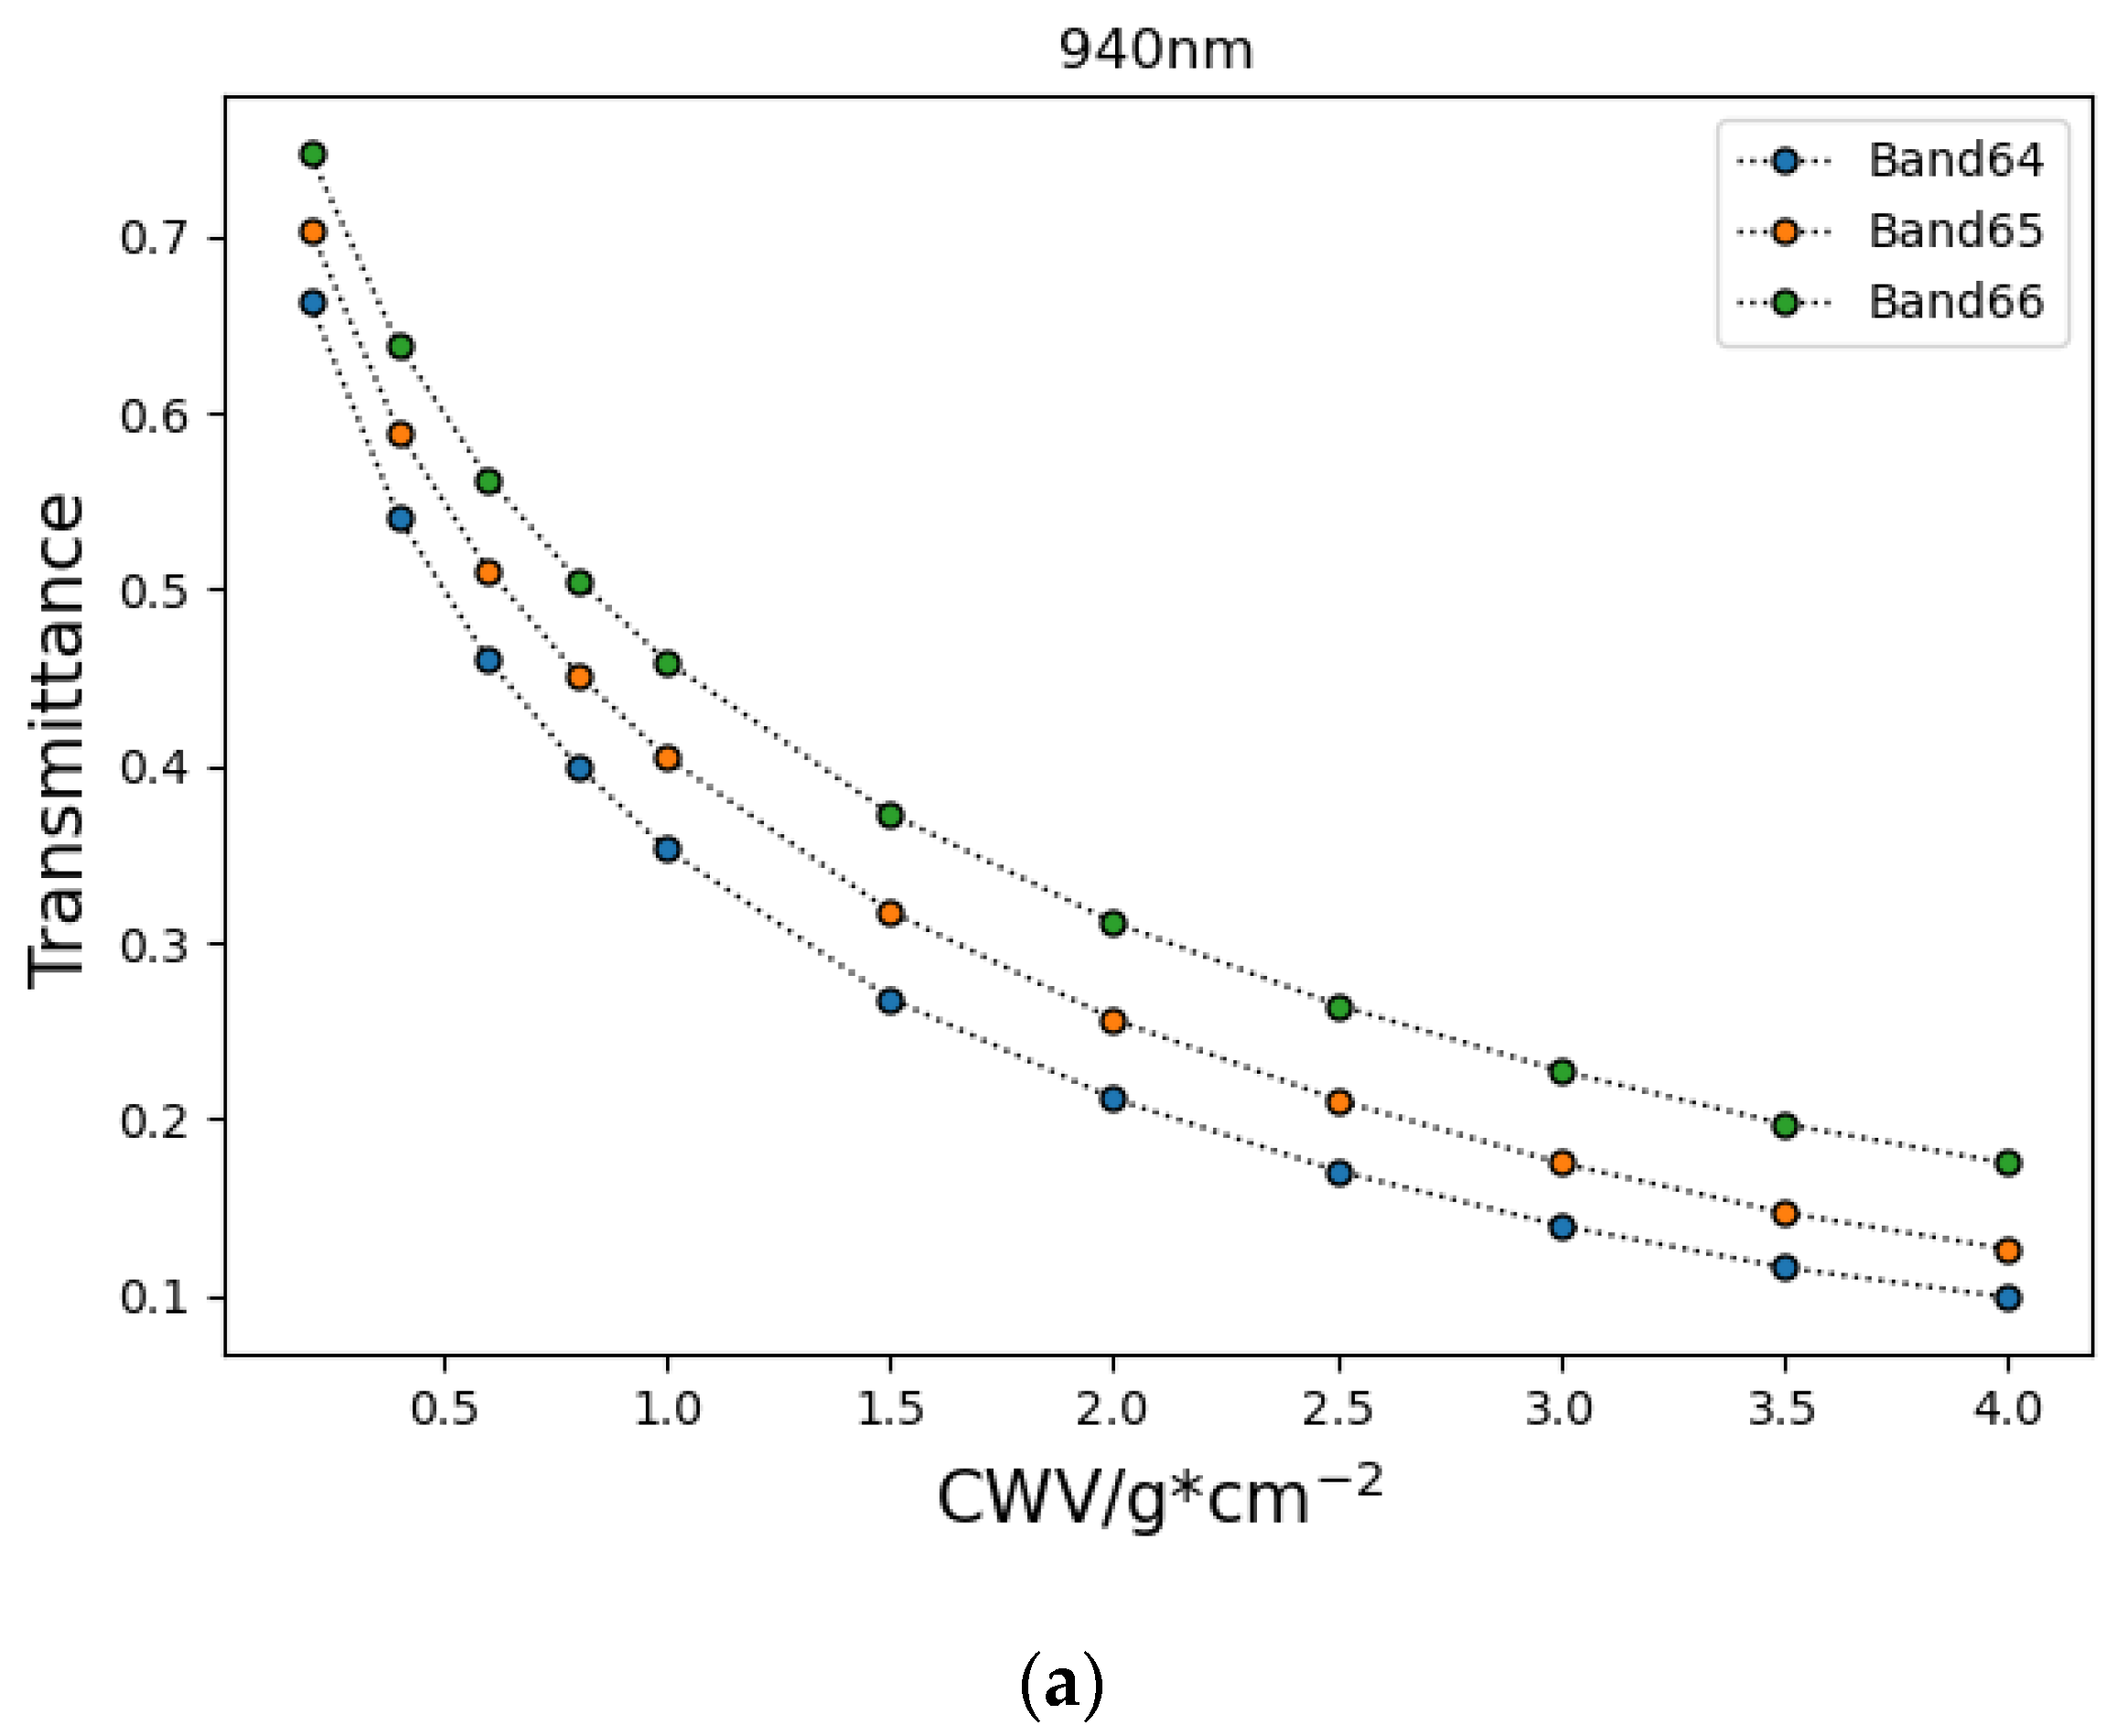
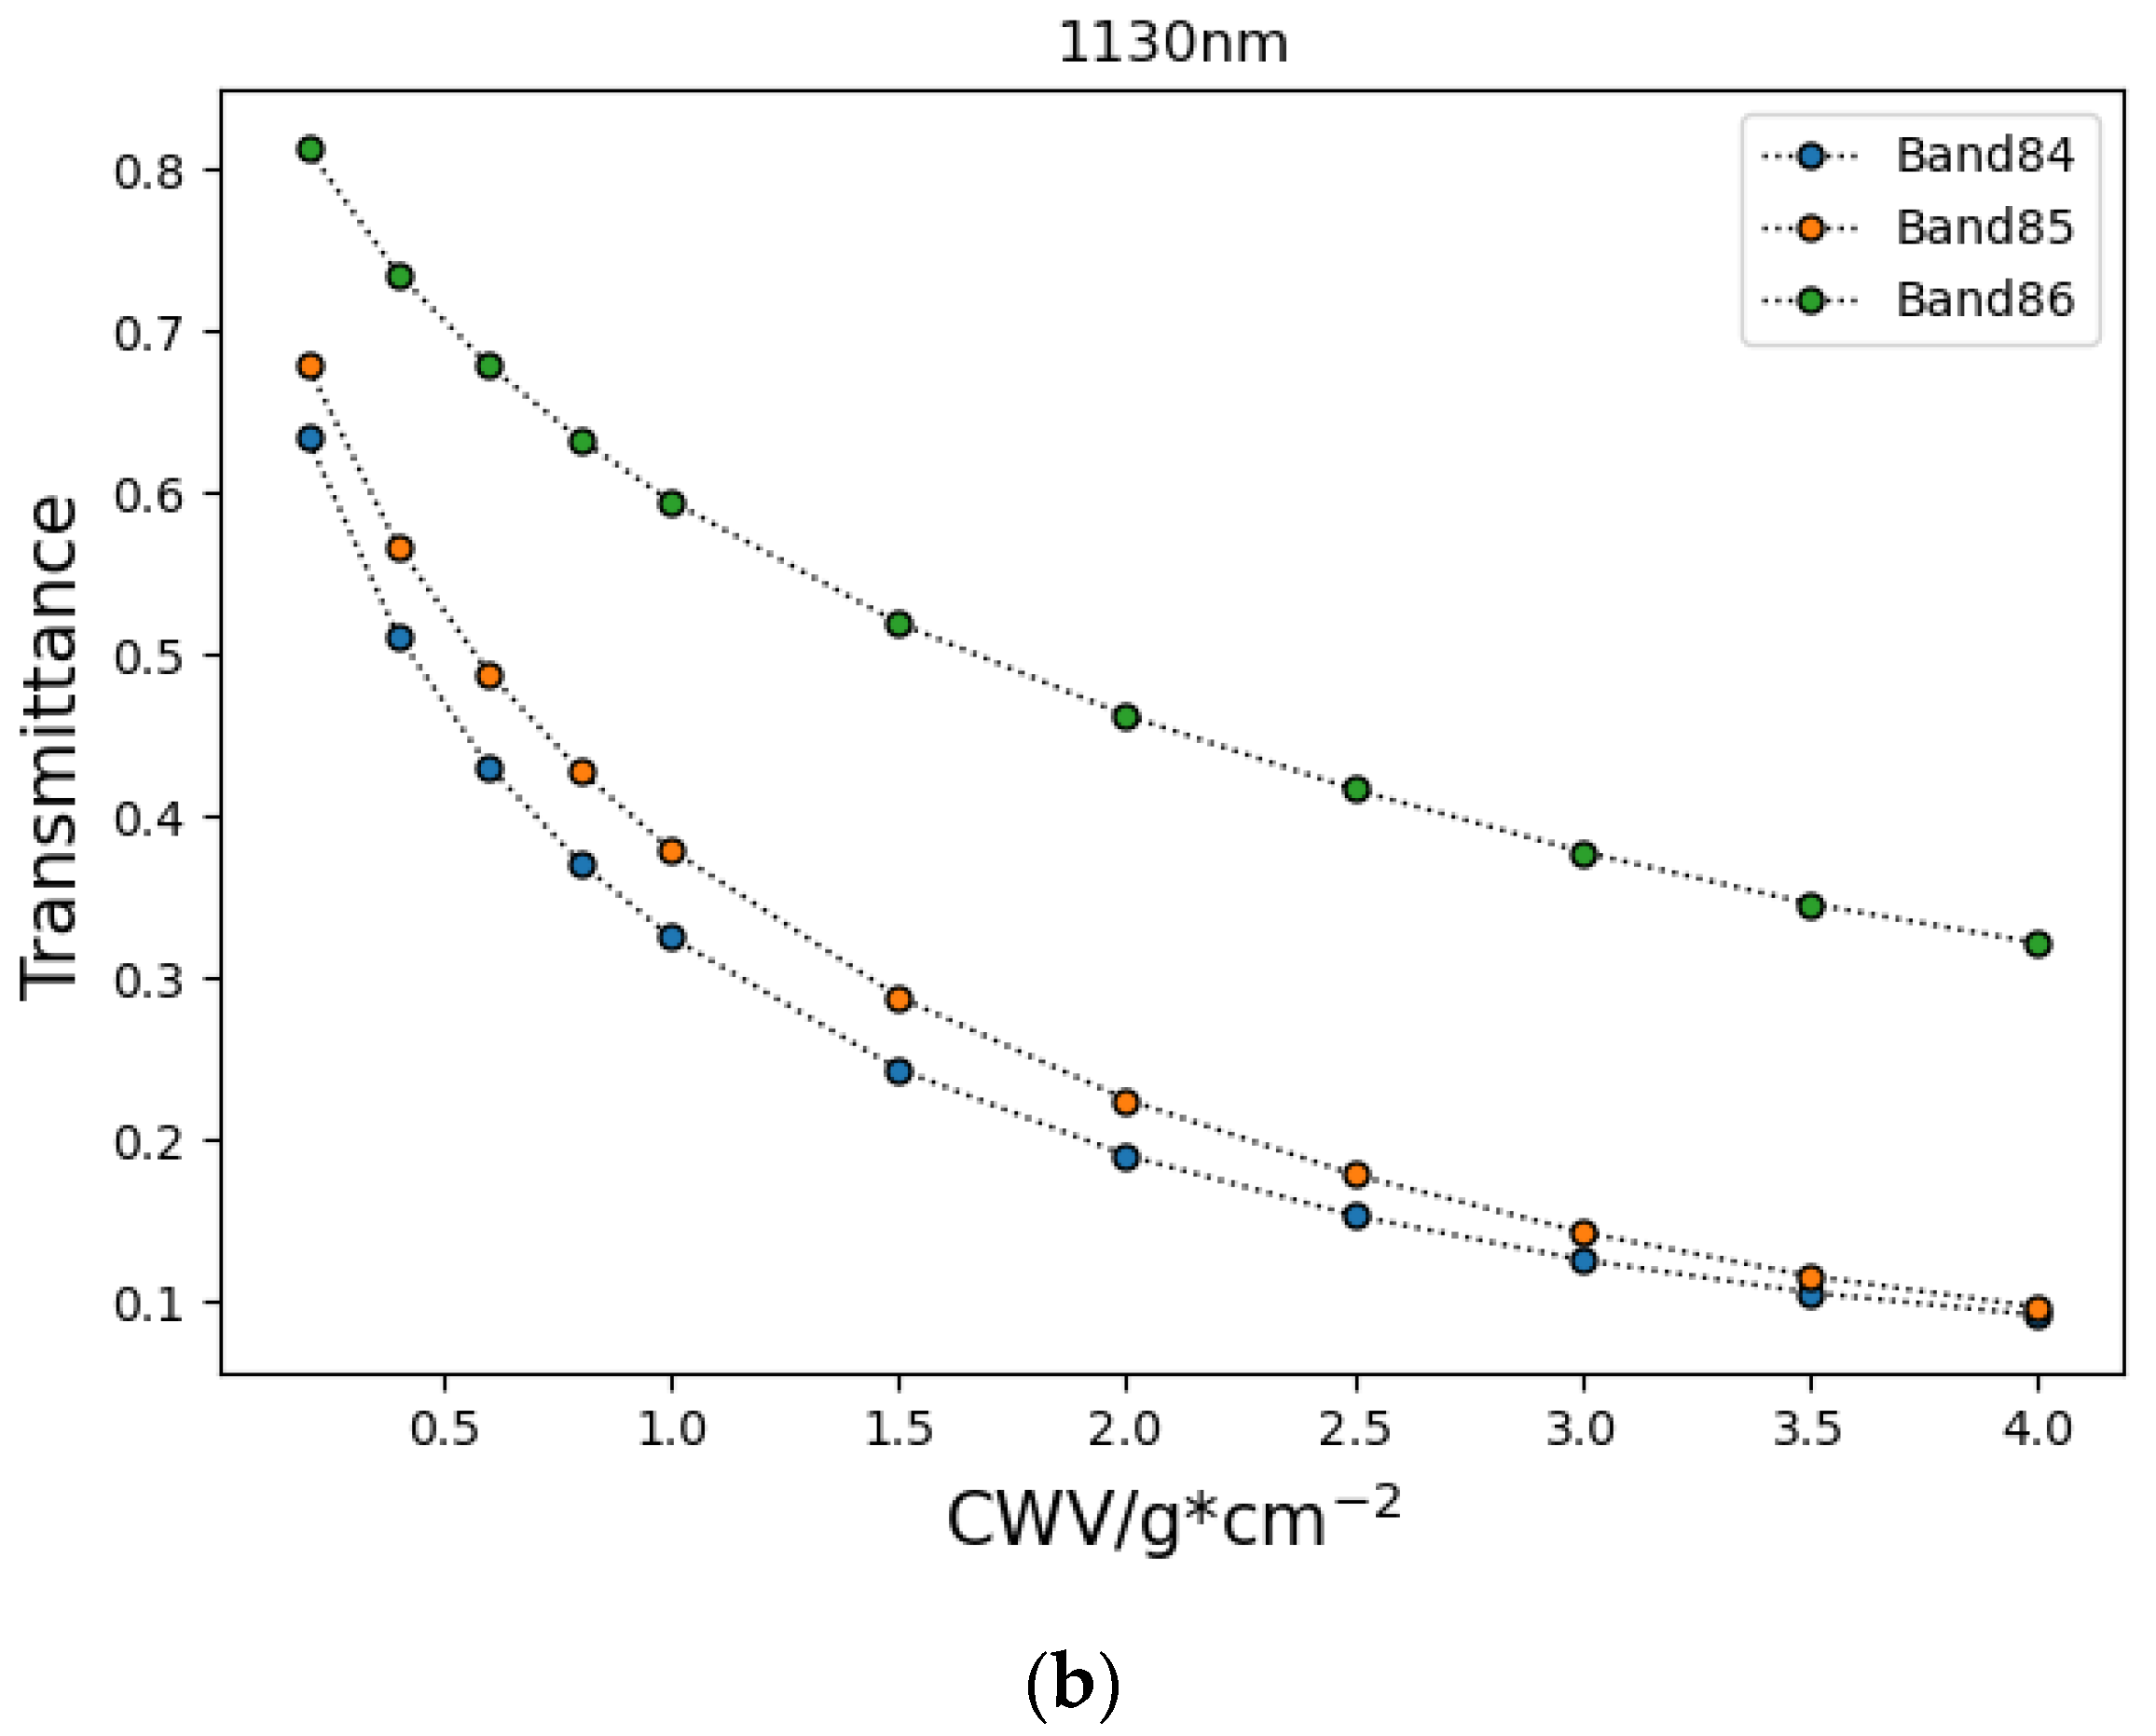
2.4.1. Band Selection

The selection of appropriate water vapor absorption channels forms the basis of the APDA. Two evident water vapor absorption regions are present around 940 nm and 1130 nm in the near-infrared region of the ZY1-02D data.
This study selected three bands of the ZY1-02D data from each spectral region as water vapor absorption channels to check the sensitivity to water vapor absorption at different bands. The selection of referenced bands should follow two principles: (1) the bands should barely be affected by the water vapor absorption effect, and (2) the wavelength of the banks should be as close as possible to the water channel absorption (Table 3).
The transmittance was obtained using MODTRAN, considering the spectral response functions of ZY1-02D and other conditions (Table 4).
The curves of transmittance versus water vapor in different bands are shown in Figure 1.
The 64th and 84th bands of the ZY1-02D data were the most sensitive to water vapor near 940 nm and 1130 nm, respectively (Figure 1). Furthermore, Figure 2 shows the transmittance curves of the 64th and 84th bands.
The transmittance around 1130 nm varied to a greater extent than that around 940 nm when the CWV was small (<1.5 g·cm−2) (Figure 2). This phenomenon indicated that the band at 1130 nm was more sensitive to water vapor when the CWV was small and was more suitable for water vapor inversion in a dry atmosphere than under other conditions.
The signal-to-noise ratio (SNR) of the different water vapor absorption bands was evaluated before the final band selection by calculating the standard deviation (StdDev) of the radiance of the ZY1-02D data under a uniform surface:
S t d D e v = i = 1 n ( x i x ¯ ) n 1
where x i is the value of the pixels and x ¯ is the average value of the pixels in the selected area. Twenty uniform areas were visually selected from the multi-scene image, and the StdDev of the water vapor absorption band was calculated (Table 5).
The bands with the highest SNRs in the water vapor absorption region near 940 nm and 1130 nm were also the 64th and 84th bands, respectively (Table 5). Furthermore, the SNR in the 84th band was significantly higher than that in the 64th band.
The 84th band was selected as the water channel absorption band, and the 79th and 88th bands were selected as the water channel references for water vapor inversion.

2.4.2. Construction of LUT

The LUT is the core of the water vapor inversion. Water vapor inversion accuracy is affected if the step size of the LUT parameter setting is extremely large [23]. Meanwhile, the information will be redundant, and the efficiency of water vapor inversion will be reduced if the step size is extremely small. A sensitivity analysis of AOD and ground elevation was conducted using the MODTRAN model to improve the accuracy and operation speed of water vapor retrieval.
(1)
Sensitivity analysis
(a)
Sensitivity analysis of AOD at 550 nm
The transmittances of AOD at 550 nm were simulated by MODTRAN from 0.01 to 2.0, and the other parameters were unchanged (Table 6, Figure 3).
The overall trend of the water vapor and transmittance curve under different AOD conditions is consistent; however, the inversion error can still reach 1.0 g·cm−2 in the case of low transmittance. The AOD retrieval accuracy was approximately 80% using the commonly used dark dense vegetation algorithm [14]. Therefore, considering the influence of AOD on CWV retrieval is crucial. The LUT should be set up under AODs of 0.01, 1.0, 1.5, and 2.0 as the minimum requirement to reach the CWV retrieval accuracy of 0.1 g·cm−2.
(b)
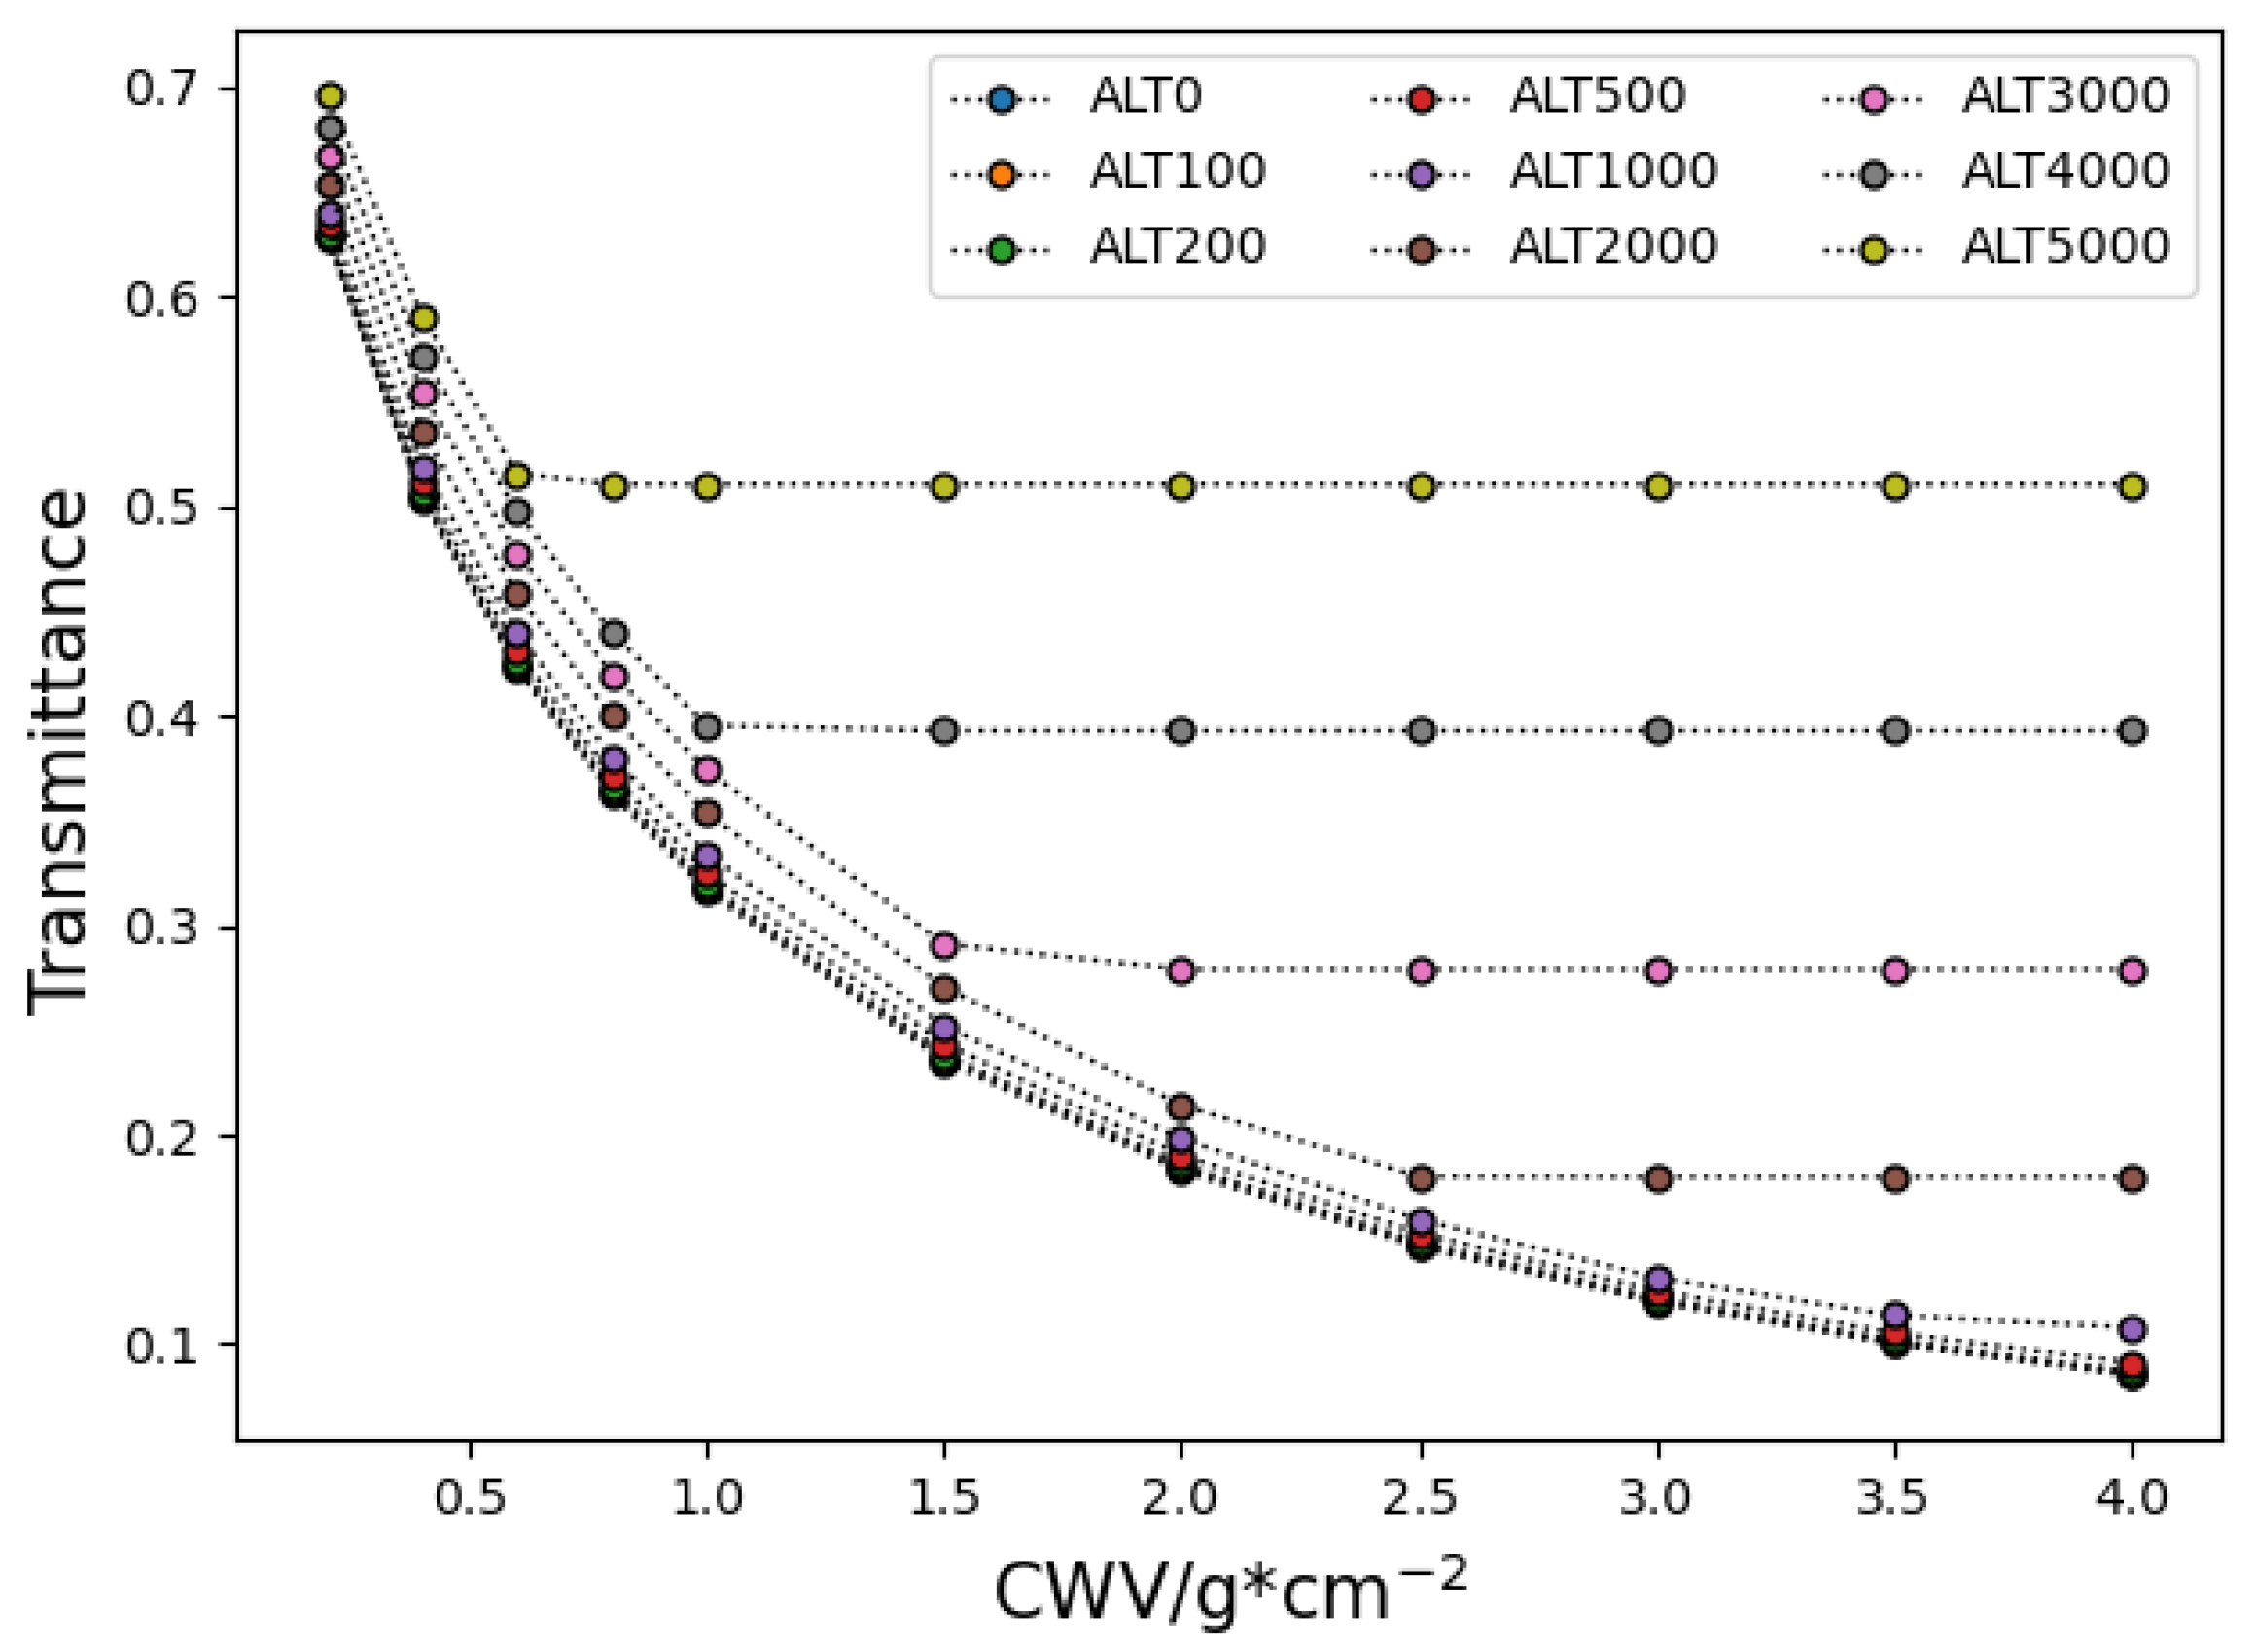
Sensitivity analysis of elevation
The elevations were set to 0, 100, 200, 500, 1000, 2000, 3000, 4000, and 5000 m for the radiative transfer model, while the other conditions remained unchanged (Table 7).
The change in ground elevation significantly impacts water vapor and transmissivity curves (Figure 4). In addition, the simulated transmittance exhibited unresponsive behavior when the water vapor exceeded a specific value, particularly when the elevation was above 1000 m.
This phenomenon was consistent with the characteristics of water vapor distribution in the atmosphere. Most of the water vapor in the atmosphere is concentrated in the troposphere: half of the water vapor is concentrated below 2 km, three-quarters of the water vapor is concentrated below 4 km, and the water vapor between 10 and 12 km accounts for approximately 99% of the total water vapor; however, previous studies have not accounted for this variation in distribution.
Based on the above analysis, the corresponding situation should be avoided when building a water vapor LUT. Therefore, the LUT in this study used ground elevation input parameters of 0, 100, 200, 500, and 1000 m. A fitting coefficient of 1000 m was used if the ground elevation was >1000 m.
(2)
Construction of the water vapor LUT
A LUT for water vapor inversion was constructed with the following specific structure based on the research in the previous summary:
  • Water vapor (g·cm−2): 0.2, 0.4, 0.6, 0.8, 1.0, 1.5, 2.0, 2.5, 3.0, 3.5, 4.0
  • AOD (550 nm): 0.01, 0.5, 1.0, 1.5, 2.0
  • Ground elevation (m): 0, 100, 200, 500, 1000
  • Solar zenith angle (°): 0°, 31°, 41.4°, 48.2°, 53.1°, 56.9°, 60°
  • Aerosol model: desert, maritime, rural, urban
  • Atmospheric model: mid-latitude summer, mid-latitude winter, tropic, US Standard
The circulation was AOD (550 nm), ground elevation, solar zenith angle, aerosol type, and atmospheric model from inside to outside. There were 26,400 effective combinations of the above six variable parameters to fit the water vapor inversion parameters, and each combination comprised the MODTRAN model. A water vapor retrieval LUT was built with a path radiance LUT to achieve more efficient water vapor inversion that has the same structure as the water vapor LUT.

2.5. Data Processing

This research realized water vapor inversion of ZY1-02D hyperspectral data based on the FLAASH atmospheric correction module, ATCOR software, and the enhanced APDA algorithm. The AOD observed by AERONET was used in three methods to avoid errors caused by different AOD inversion algorithms, and the initial CWV was set to 1 g·cm−2 for three iterations in APDA algorithm. Performing radiometric calibration on ZY1-02D data is necessary to obtain radiance data at the beginning of the experiment. The experimental process involves three iterations to reduce the error caused by path radiation and obtain the final water vapor (Figure 5).
FLAASH is an atmospheric correction module jointly developed by the US Air Force Research Laboratory and other institutions [24,25,26] and is now integrated into the commercial remote sensing software, ENVI. Columnar water vapor is the intermediate product of the atmospheric correction. ATCOR is professional atmospheric correction software developed by Dr. Rudolf Richter at the German Aerospace Center, which uses the APDA algorithm to achieve water vapor inversion. This study used ENVI 5.3 and ATCOR 3 to obtain the CWV of ZY1-02D data for subsequent comparison. The FLAASH atmospheric correction module and ATCOR 3 provided three options for water vapor inversion: 1135 nm, 940 nm, and 820 nm, and 1135 nm was also selected.

3. Results and Discussion

Water Vapor Inversion

This study used the ATCOR software (APDA), FLAASH atmospheric correction model, and enhanced APDA algorithm to achieve water vapor inversion. The results were compared with those observed by AERONET stations. The absolute error, relative error, and average values of these three methods were calculated to determine the inversion results (Table 8).
The results of the APDA algorithm at two high-altitude sites (NAM_CO and QOMS_CAS) were extremely poor from the 10 scene images, with relative errors of 0.965309 and 0.960317, respectively (Figure 6). These errors were much higher than the average relative error of 0.407847 in 10 images; the average absolute error of FLAASH atmospheric correction was 0.1338 g·cm−2, and the average relative error was 30.82%. The average absolute error of the enhanced APDA algorithm was 0.0568 g·cm−2, and the average relative error was 10.49%. The image with the largest error in the enhanced APDA algorithm appeared at the XiangHe site. The elevation of this site and the AOD conditions were normal during imaging; the only difference was that the solar zenith angle of this image was the largest among the 10 images. The approximate ±10% accuracy of the AERONET level 1.5 and 2.0 data may also cause the error. Overall, the enhanced APDA algorithm showed a higher correlation with the CWV observed by AERONET (Figure 7).
The absolute error was checked under different conditions to verify whether the step size of the LUT parameter was excessively large (Figure 8).
The absolute errors under different conditions were not correlated (Figure 8), which indicated that the LUT constructed in this study showed good accuracy.
An elevation greater than 1000 m was avoided when building the LUT; a fitting coefficient under 1000 m was used when the ground elevation was above 1000 m. The inversion results of water vapor at the NAM_CO and QOMS_CAS sites at elevations of 4746 m and 4276 m showed that many invalid values appeared in the water vapor inversion results of FLAASH and ATCOR at high altitude sites, and the enhanced APDA algorithm avoided this situation (Figure 9).
The maximum error of water vapor retrieved by FLAASH and ATCOR occurred at QOMS_CAS sites and at NAM_CO sites, respectively: 157.1429% and 6.18% for FLAASH and 96.03% and 96.53% for ATCOR. In contrast, the relative error of the enhanced APDA algorithm at QOMS_CAS sites and NAM_CO sites was only 0.5556% and 5.86%, respectively. In general, the retrieved columnar wave vapor of the enhanced APDA algorithm showed higher accuracy than that of the FLAASH atmospheric correction and ATCOR, especially at high-altitude areas.

4. Conclusions

This study analyzed the factors that might influence the water vapor inversion of ZY1-02D data. Based on these analyses, a LUT for water vapor inversion was constructed. Water vapor inversion was performed on 10 scenes of ZY1-02D data near five AERONET stations. The outcomes were then compared and verified against the CWV measurements taken at the AERONET sites and values inverted by the FLAASH atmospheric correction module and ATCOR. The CWV derived from the enhanced APDA algorithm aligned closely with the CWV measurements from the AERONET sites, having an average absolute error of 0.0568 g·cm−2 and an average relative error of 10.49%. This performance significantly surpassed that of FLAASH and ATCOR, especially in high-altitude regions. The inversion error displayed no consistent pattern with variations in AOD and elevation. This suggests that the water vapor inversion LUT developed in this study possesses adequate accuracy. Moreover, the LUT notably enhanced the temporal, spatial, and precision aspects of water vapor inversion, laying a theoretical foundation for water vapor inversion of other hyperspectral datasets.
However, due to the limited overlapping data between AERONET and ZY1-02D satellite readings, this study’s volume of experimental data is somewhat limited. Efforts will be made to expand and refine this dataset in future research. It is also worth noting that the enhanced APDA algorithm is tailored specifically for land surfaces. The water vapor inversion for other surface types remains an area for further exploration.

Author Contributions

Conceptualization, H.Z. (Hongwei Zhang) and H.Z. (Hao Zhang); methodology, H.Z. (Hongwei Zhang) and H.Z. (Hao Zhang); software, H.Z. (Hao Zhang); validation, H.Z. (Hongwei Zhang); formal analysis, X.Z.; investigation, X.Z., Z.M.; resources, H.Z. (Hao Zhang); data curation, S.Z., Z.M. and X.H.; writing—original draft preparation, H.Z. (Hongwei Zhang); writing—review and editing, H.Z. (Hao Zhang); visualization, S.Z.; supervision, X.H., Z.M.; project administration, H.Z. (Hao Zhang); funding acquisition, H.Z. (Hao Zhang). All authors have read and agreed to the published version of the manuscript.

Funding

This research was funded by the National Key R&D Program of China (Grant No. 2021YFB1407002); the National Natural Science Foundation of China (Grant No. 41771397); the Major Project of High Resolution Earth Observation System (Grant No. “30-Y60B01-9003-22/23”).

Institutional Review Board Statement

Not applicable.

Informed Consent Statement

Not applicable.

Data Availability Statement

Not applicable.

Conflicts of Interest

Zhonghui Ma is the employee of China Shenhua Energy Company Limited. The paper reflects the views of the scientists and not the company.

References

  1. Liu, J. Precipitable Water Vapor on the Tibetan Plateau Estimated by GPS, Water Vapor Radiometer, Radiosonde, and Numerical Weather Prediction Analysis and Its Impact on the Radiation Budget. J. Geophys. Res. 2005, 110, D17106. [Google Scholar] [CrossRef]
  2. Ferraro, R.R.; Grody, N.C.; Weng, F.; Basist, A. An Eight-Year (1987–1994) Time Series of Rainfall, Clouds, Water Vapor, Snow Cover, and Sea Ice Derived from SSM/I Measurements. Bull. Am. Meteorol. Soc. 1996, 77, 891–905. [Google Scholar] [CrossRef]
  3. Webb, E.K.; Pearman, G.I.; Leuning, R. Correction of Flux Measurements for Density Effects Due to Heat and Water Vapour Transfer. Q. J. R. Meteorol. Soc. 1980, 106, 85–100. [Google Scholar] [CrossRef]
  4. Ningombam, S.S.; Jade, S.; Shrungeshwara, T.S.; Song, H.-J. Validation of Water Vapor Retrieval from Moderate Resolution Imaging Spectro-Radiometer (MODIS) in near Infrared Channels Using GPS Data over IAO-Hanle, in the Trans-Himalayan Region. J. Atmos. Sol.-Terr. Phys. 2016, 137, 76–85. [Google Scholar] [CrossRef]
  5. Serrano, L. Deriving Water Content of Chaparral Vegetation from AVIRIS Data. Remote Sens. Environ. 2000, 74, 570–581. [Google Scholar] [CrossRef]
  6. Vasudevan, B.G.; Gohil, B.S.; Agarwal, V.K. Backpropagation Neural-Network-Based Retrieval of Atmospheric Water Vapor and Cloud Liquid Water from IRS-P4 MSMR. IEEE Trans. Geosci. Remote Sens. 2004, 42, 985–990. [Google Scholar] [CrossRef]
  7. Carrère, V.; Conel, J.E. Recovery of Atmospheric Water Vapor Total Column Abundance from Imaging Spectrometer Data around 940 Nm—Sensitivity Analysis and Application to Airborne Visible/Infrared Imaging Spectrometer (AVIRIS) Data. Remote Sens. Environ. 1993, 44, 179–204. [Google Scholar] [CrossRef]
  8. Kaufman, Y.J.; Gao, B.-C. Remote Sensing of Water Vapor in the near IR from EOS/MODIS. IEEE Trans. Geosci. Remote Sens. 1992, 30, 871–884. [Google Scholar] [CrossRef]
  9. Gao, B.-C.; Kaufman, Y.J. Water Vapor Retrievals Using Moderate Resolution Imaging Spectroradiometer (MODIS) near-Infrared Channels. J. Geophys. Res. 2003, 108, 4389. [Google Scholar] [CrossRef]
  10. Bennouna, Y.S.; Torres, B.; Cachorro, V.E.; Ortiz de Galisteo, J.P.; Toledano, C. The Evaluation of the Integrated Water Vapour Annual Cycle over the Iberian Peninsula from EOS-MODIS against Different Ground-Based Techniques: Water Vapour Annual Cycle Over Iberia. Q. J. R. Meteorol. Soc. 2013, 139, 1935–1956. [Google Scholar] [CrossRef]
  11. Schläpfer, D.; Borel, C.C.; Keller, J.; Itten, K.I. Atmospheric Precorrected Differential Absorption Technique to Retrieve Columnar Water Vapor. Remote Sens. Environ. 1998, 65, 353–366. [Google Scholar] [CrossRef]
  12. Makarau, A.; Richter, R.; Schlapfer, D.; Reinartz, P. APDA Water Vapor Retrieval Validation for Sentinel-2 Imagery. IEEE Geosci. Remote Sens. Lett. 2017, 14, 227–231. [Google Scholar] [CrossRef]
  13. Russell, P.B.; Bergstrom, R.W.; Shinozuka, Y.; Clarke, A.D.; DeCarlo, P.F.; Jimenez, J.L.; Livingston, J.M.; Redemann, J.; Dubovik, O.; Strawa, A. Absorption Angstrom Exponent in AERONET and Related Data as an Indicator of Aerosol Composition. Atmos. Chem. Phys. 2010, 10, 1155–1169. [Google Scholar] [CrossRef]
  14. Kahn, R.A.; Garay, M.J.; Nelson, D.L.; Yau, K.K.; Bull, M.A.; Gaitley, B.J.; Martonchik, J.V.; Levy, R.C. Satellite-Derived Aerosol Optical Depth over Dark Water from MISR and MODIS: Comparisons with AERONET and Implications for Climatological Studies. J. Geophys. Res. 2007, 112, D18205. [Google Scholar] [CrossRef]
  15. Holben, B.N.; Eck, T.F.; Slutsker, I.; Tanré, D.; Buis, J.P.; Setzer, A.; Vermote, E.; Reagan, J.A.; Kaufman, Y.J.; Nakajima, T.; et al. AERONET—A Federated Instrument Network and Data Archive for Aerosol Characterization. Remote Sens. Environ. 1998, 66, 1–16. [Google Scholar] [CrossRef]
  16. Holben, B.N.; Eck, T.F.; Slutsker, I.; Smirnov, A.; Sinyuk, A.; Schafer, J.; Giles, D.; Dubovik, O. Aeronet’s Version 2.0 Quality Assurance Criteria. In Proceedings of the Remote Sensing of the Atmosphere and Clouds, Goa, India, 13–17 November 2006; Tsay, S.-C., Nakajima, T., Singh, R.P., Sridharan, R., Eds.; SPIE: Bellingham, WA, USA, 2006; Volume 6408, p. 64080Q. [Google Scholar]
  17. Vermote, E.; Justice, C.; Claverie, M.; Franch, B. Preliminary Analysis of the Performance of the Landsat 8/OLI Land Surface Reflectance Product. Remote Sens. Environ. 2016, 185, 46–56. [Google Scholar] [CrossRef] [PubMed]
  18. Li, Y.; Chen, J.; Ma, Q.; Zhang, H.K.; Liu, J. Evaluation of Sentinel-2A Surface Reflectance Derived Using Sen2Cor in North America. IEEE J. Sel. Top. Appl. Earth Obs. Remote Sens. 2018, 11, 1997–2021. [Google Scholar] [CrossRef]
  19. SchlŠpfer, D.; Borel, C.C.; Keller, J.; Itten, K.I. Atmospheric Pre-Corrected Differential Absorption Techniques to Retrieve Columnar Water Vapor: Application to Aviris 91/95 Data. 9. Available online: https://digital.library.unt.edu/ark:/67531/metadc670441/ (accessed on 7 September 2023).
  20. Berk, A.; Conforti, P.; Kennett, R.; Perkins, T.; Hawes, F.; van den Bosch, J. MODTRAN6: A Major Upgrade of the MODTRAN Radiative Transfer Code. In Proceedings of the Algorithms and Technologies for Multispectral, Hyperspectral, and Ultraspectral Imagery XX, Baltimore, MD, USA, 13 June 2014; Velez-Reyes, M., Kruse, F.A., Eds.; SPIE: Bellingham, WA, USA, 2014; Volume 9088, p. 90880H. [Google Scholar]
  21. Berk, A.; Conforti, P.; Hawes, F. An Accelerated Line-by-Line Option for MODTRAN Combining on-the-Fly Generation of Line Center Absorption within 0.1 Cm-1 Bins and Pre-Computed Line Tails. In Proceedings of the Algorithms and Technologies for Multispectral, Hyperspectral, and Ultraspectral Imagery XXI, Baltimore, MD, USA, 21 May 2015; Velez-Reyes, M., Kruse, F.A., Eds.; SPIE: Bellingham, WA, USA, 2015; Volume 9472, p. 947217. [Google Scholar]
  22. Acito, N.; Diani, M.; Corsini, G. CWV-Net: A Deep Neural Network for Atmospheric Column Water Vapor Retrieval From Hyperspectral VNIR Data. IEEE Trans. Geosci. Remote Sens. 2020, 58, 8163–8175. [Google Scholar] [CrossRef]
  23. Richter, R.; Heege, T.; Kiselev, V.; Schläpfer, D. Correction of Ozone Influence on TOA Radiance. Int. J. Remote Sens. 2014, 35, 8044–8056. [Google Scholar] [CrossRef]
  24. Anderson, G.P.; Felde, G.W.; Hoke, M.L.; Ratkowski, A.J.; Cooley, T.W.; Chetwynd, J.H., Jr.; Gardner, J.A.; Adler-Golden, S.M.; Matthew, M.W.; Berk, A.; et al. MODTRAN4-Based Atmospheric Correction Algorithm: FLAASH (Fast Line-of-Sight Atmospheric Analysis of Spectral Hypercubes). In Proceedings of the Algorithms and Technologies for Multispectral, Hyperspectral, and Ultraspectral Imagery VIII, Orlando, FL, USA, 1–5 April 2002; Shen, S.S., Lewis, P.E., Eds.; SPIE: Bellingham, WA, USA, 2002; Volume 4725, pp. 65–71. [Google Scholar]
  25. Perkins, T.; Adler-Golden, S.; Matthew, M.; Berk, A.; Anderson, G.; Gardner, J.; Felde, G. Retrieval of Atmospheric Properties from Hyper and Multispectral Imagery with the FLAASH Atmospheric Correction Algorithm. In Proceedings of the Remote Sensing of Clouds and the Atmosphere X, Bruges, Belgium, 19–22 September 2005; Schäfer, K., Comerón, A., Slusser, J.R., Picard, R.H., Carleer, M.R., Sifakis, N.I., Eds.; SPIE: Bellingham, WA, USA, 2005; Volume 5979, p. 59790E. [Google Scholar]
  26. Felde, G.W.; Anderson, G.P.; Gardner, J.A.; Adler-Golden, S.M.; Matthew, M.W.; Berk, A. Water Vapor Retrieval Using the FLAASH Atmospheric Correction Algorithm. In Proceedings of the Algorithms and Technologies for Multispectral, Hyperspectral, and Ultraspectral Imagery X, Orlando, FL, USA, 12–16 April 2004; Shen, S.S., Lewis, P.E., Eds.; SPIE: Bellingham, WA, USA, 2004; Volume 5425, p. 357. [Google Scholar]
Figure 1. Influence of different absorption bands on water vapor transmittance at (a) 940 nm and (b) 1130 nm. CWV, columnar water vapor.
Atmosphere 14 01560 g001aAtmosphere 14 01560 g001b
Figure 2. Comparison of the sensitivities of different absorption regions.
Atmosphere 14 01560 g002
Figure 3. Transmittance simulated at different AODs at 550 nm.
Atmosphere 14 01560 g003
Figure 4. Influence of different ground elevation on transmittance.
Atmosphere 14 01560 g004
Figure 5. Flow chart of water vapor inversion.
Atmosphere 14 01560 g005
Figure 6. Relative and absolute errors of APDA, APDA-enhanced, and FLAASH.
Atmosphere 14 01560 g006
Figure 7. Statistic of inversion results.
Atmosphere 14 01560 g007
Figure 8. Absolute error distribution diagram under different conditions. (a) Absolute error as a function of ground elevation. (b) Absolute error as a function of AOD.
Atmosphere 14 01560 g008
Figure 9. Comparison of inversion results of water vapor at high altitude stations: (a) NAM_CO-true color image; (b) NAM_CO-FLAASH; (c) NAM_CO-APDA; (d) NAM_CO-enhanced APDA; (e) QOMS_CAS-true color image; (f) QOMS_CAS-FLAASH; (g) QOMS_CAS-APDA; and (h) QOMS_CAS-enhanced APDA.
Atmosphere 14 01560 g009
Table 1. ZY1-02D parameters.
Parameter NameParameter Values
Wavelength range0.4–2.5 μm
Number of bands166 (VNIR:1–76; SWIR:77–166)
Spatial resolution/m30
Swath width/km60
Spectral resolution/nmVNIR:10; SWIR:20
Quantization bits12 bits
Data formatBSQ
Table 2. Information of AERONET site used in this experiment.
Scene NumberSite NameLatitude and
Longitude (°)
Elevation (m)Date and TimeAOD_550 nmSolar Zenith Angle (°)
1Beijing39.97/
116.38
928 September 2020. 3:250.071935.80
217 September 2020. 3:150.075639.89
316 October 2021. 3:250.054649.73
41 March 2022. 3:250.085349.79
5AOE_Baotou40.85/
109.62
131422 September 2021. 3:530.363741.78
6NAM_CO30.77/
90.96
474613 December 2020. 4:570.026155.46
7QOMS_CAS28.36/
86.94
427630 December 2020. 5:12 5:120.021953.90
8XiangHe39.75/
116.96
362 December 2019. 3:13 3:130.092862.58
93 February 2021. 3:210.207958.10
1014 November 2021. 3:240.180858.44
AOD, aerosol optical depth.
Table 3. Band combination for water vapor inversion.
Absorption Range (nm)Water Channel AbsorptionCentral Wavelength (nm)Water Channel ReferenceCentral Wavelength (nm)
94064937.09357876.881
65945.712
66954.243721005.836
1130841122.592791039.191
851139.444
861156.412881190.166
Table 4. Input parameters of MODTRAN-1.
Parameter NameParameter Setting
Atmospheric modelMidlatitude summer
Aerosol modelRural
AOD_550 nm0.4
Ground elevation (m)500
Solar zenith angle (°)0
Surface reflectance0.4
Water vapor (g·cm−2)0.2, 0.4, 0.6, 0.8, 1.0, 1.5, 2.0, 2.5, 3.0, 3.5, 4.0
Table 5. Signal-to-noise ratio of the water vapor absorption band.
Absorption Range/nmWater Channel AbsorptionCentral Wavelength (nm)StdDev
94064937.0930.1938
65945.7120.2083
66954.2430.2190
1130841122.5920.1549
851139.4440.1598
861156.4120.2162
Table 6. Input parameters of MODTRAN-2.
Parameter NameParameter Setting
Atmospheric modelMidlatitude summer
Aerosol modelRural
AOD_550 nm0.01, 0.1, 0.2, 0.3, 0.4, 0.6, 0.8,
1.0, 1.2, 1.4, 1.6, 1.8, 2.0
Ground elevation (m)500
Solar zenith angle (°)0
Surface reflectance0.4
Water vapor (g·cm−2)0.2, 0.4, 0.6, 0.8, 1.0, 1.5, 2.0, 2.5, 3.0, 3.5, 4.0
Table 7. Input parameters of MODTRAN-4.
Parameter NameParameter Setting
Atmospheric modelMidlatitude summer
Aerosol modelRural
AOD_550 nm0.4
Ground elevation (m)0, 100, 200, 500, 1000, 2000, 3000, 4000, 5000
Solar zenith angle (°)0
Surface reflectance0.4
Water vapor (g·cm−2)0.2, 0.4, 0.6, 0.8, 1.0, 1.5, 2.0, 2.5, 3.0, 3.5, 4.0
Table 8. Inversion results of water vapor.
Scene
Number
WVP
(AERONET)
APDA(APDA-Enhanced)FLAASH
WVPError
AE/RE
WVPError
AE/RE
WVPError
AE/RE
12.20951.87100.33/15.32%2.42360.21/9.69%1.81320.39/17.93%
21.22870.91500.31/25.53%1.21670.01/0.97%0.92360.30/24.83%
30.30280.22400.07/26.02%0.30130.001/0.51%0.20370.09/32.72%
40.36590.23300.13/36.32%0.45460.08/24.23%0.29630.06/19.02%
51.21400.81260.40/33.06%1.17920.03/2.87%0.95990.25/20.93%
60.06630.00230.06/96.53%0.06240.003/5.86%0.07040.0041/6.18%
70.02520.00100.02/96.03%0.02530.00014/0.55%0.06480.03/157.14%
80.32990.25100.07/23.91%0.47450.14/43.83%0.33390.004/1.21%
90.30660.25200.05/17.80%0.27580.03/10.03%0.28970.01/5.51%
100.59010.37000.22/37.29%0.62750.03/6.33%0.43800.15/25.77%
Average0.66390.49320.17/40.78%0.70410.056/10.49%0.5390.13/31.12%
WVP, water vapor; RE, relative error; AE, absolute error.
Disclaimer/Publisher’s Note: The statements, opinions and data contained in all publications are solely those of the individual author(s) and contributor(s) and not of MDPI and/or the editor(s). MDPI and/or the editor(s) disclaim responsibility for any injury to people or property resulting from any ideas, methods, instructions or products referred to in the content.

