Communication

Increasing Antarctic Ice Mass to Help Offset Sea Level Rise

1
Cooperative Institute for Research in Environmental Sciences, University of Colorado Boulder, Boulder, CO 80309, USA
2
Chemical Sciences Laboratory, National Oceanic and Atmospheric Administration, Boulder, CO 80305, USA
*
Authors to whom correspondence should be addressed.
Atmosphere 2023, 14(10), 1564; https://doi.org/10.3390/atmos14101564
Submission received: 6 September 2023 / Revised: 3 October 2023 / Accepted: 11 October 2023 / Published: 15 October 2023
(This article belongs to the Section Climatology)

Abstract

:
Global sea level is predicted to rise for centuries even if greenhouse gas emissions are greatly reduced. Sea level rise (SLR) threatens coastal communities where a large fraction of the human population lives. A possible mitigation effort is to increase the ice mass in Antarctica. Coastal Antarctic radiosonde profiles are supersaturated with respect to ice on average 47% of the time. If all of this excess water vapor and supercooled liquid cloud water were removed from the atmosphere and deposited on the Antarctic landmass, it would offset 11 cm of SLR by 2100, or about 15 (8–17) percent of the predicted SLR. This strategy could be used to supplement other efforts to reduce climate change impacts, such as carbon dioxide removal or solar climate intervention.

1. Introduction

Sea level is predicted to rise about 75 (63–132) cm by 2100 due to climate change [1,2]. Even if greenhouse gas emissions were reduced to zero now, the current CO2 loading would continue the radiative imbalance, leading to further ocean warming and thermosteric sea level rise (SLR) [3]. SLR threatens coastal communities and could have profound effects on humanity. Stopping SLR will be difficult due to the sheer mass of water involved.
One way to limit SLR is to slow or stop land ice from melting. Geoengineering approaches for glacier restraint has been reviewed by Lockley et al. [4]. Another way is to accumulate water mass on land surfaces in the form of ice. Many glaciated land masses, such as Greenland and Antarctica, could be used to store ice. In this study, we are focusing on Antarctica because it is the largest glaciated land mass and very little ice is predicted to melt from Antarctica over the next century [1], making it a good candidate for ice storage. However, other polar and mountainous land masses could also be considered for their ice storage potential.
How much ice would be required to offset sea level rise? The area of Antarctica, 1.4 × 10⁷ km2 [5], is about 4% of the area of the global ocean [6]. Therefore, adding 1 m of ice covering all of Antarctica would reduce sea level by about 4 cm.
Increasing Antarctic ice by pumping ocean water onto the surface of the Antarctic ice sheet was proposed by Frieler et al. [7]. The energy cost was estimated to exceed 7% of the global primary energy supply and the impact of adding salt to the ice sheet and the environment is unknown but could be detrimental. It would also be possible to ship fresh water from landmasses or use desalinized ocean water [8] to eliminate the impact of salt, but those options add a substantial energy cost. The present study explores using atmospheric water, both as water vapor and liquid (in the form of droplets), as a source to increase Antarctic ice mass. Recent work shows that the mass balance of the West Antarctic Ice Sheet, and thus sea level rise, depends on snowfall anomalies [9]. This supports our premise that depositing atmospheric water onto the land surface would result in offsetting SLR.
This study is an exploratory effort investigating how much atmospheric water in the forms of liquid and excess vapor is currently available to deposit on the Antarctic surface. We use data obtained from historical frost point hygrometer and operational radiosonde measurements. We focus on liquid drops and excess vapor because of their theoretical potential to be turned into precipitation. In this study, we do not address how the water is deposited on the surface. Cloud seeding could be invoked to do this; however, this study focuses on estimating the available atmospheric water, not the method of delivering it to the surface.

2. Materials and Methods

2.1. Liquid Water Availability

Several studies have investigated the type and frequency of clouds over the Antarctic continent [10,11,12,13]. Mixed-phase clouds containing supercooled water droplets are prevalent in the South Pole in all months of the year except August, and occur as frequently as ice-only clouds during the Antarctic summer months [10]. Mixed-phase clouds were present an average of 7.7% of the time and pure ice clouds 22% of the time. Supercooled liquid water clouds were also prevalent over Dome C (Concordia), with December, January, and February (DJF) frequencies of about 50% [11]. These clouds were generally thin and had liquid water paths (LWPs) of about 50 g/m2. Recently (16 August 2016), an extended drizzle event was observed over McMurdo for 7.7 h at temperatures below −25 °C that had a LWP of 100 g/m2 [12]. These observations of liquid water and mixed-phase clouds over Antarctica are suggestive of a low ice-nucleating particle (INP) concentration. Measurements using satellite-based radar and lidar indicate the widespread presence of supercooled water clouds with a strong seasonal cycle and spatial variability [13]. Spatially averaged over the continent, supercooled liquid clouds and mixed-phase clouds occur 5–20% of the time, with the coasts having higher cloud frequencies than the interior [13].

2.2. Excess Water Vapor over Antarctica

Daily operational radiosonde profiles over Antarctica (https://ruc.noaa.gov/raobs/, accessed on 13 October 2023.) are used to calculate column excess water vapor. The station locations are shown on the map in Figure 1. The temporal coverage of the radiosonde data is nominally from 2000–2021; however, some stations have less data. Specifically, Concordia only covers 2019; Mario_Zuchelli is missing several years including 2005–2007 and 2008–2012; McMurdo has very sparse coverage in 2014–2015; and Centro_Met_Antartico has very limited coverage and only for 2018–2019.
The radiosonde profiles report the atmospheric and dewpoint temperature and allow for the calculation of water supersaturation, providing an upper limit of the amount of water that could be extracted from the atmosphere and deposited onto land. An empirical formula [14,15] is used to calculate saturation vapor pressure with respect to water and ice (es and esi). The formulas are:
Log10 es = −7.90298 (373.16/T − 1) + 5.02808 Log10(373.16/T)
    − 1.3816 × 10⁻⁷ (1011.344 (1−T/373.16) − 1) + 8.1328 × 10⁻³ (10−3.49149 (373.16/T−1) − 1) +
    Log10(1013.246)
(1)
Log10 esi = −9.09718 (273.16/T − 1) − 3.56654 Log10(273.16/T)
    + 0.876793 (1 − T/273.16) + Log10(6.1071)
(2)
where T is the ambient temperature in K and e is in hPa.
Supersaturation with respect to water, defined as relative humidity over water (RHw) above 100%, is rare over Antarctica. However, at the temperatures normally experienced there, supersaturation with respect to ice, defined as a relative humidity over ice (RHi) above 100%, is the relevant metric and occurs in an average of 47% (30–61) of the coastal profiles. Excess water vapor is calculated from the water vapor pressure minus the saturation pressure with respect to ice (e – esi), in each supersaturated atmospheric layer. Then, the column total of excess water is calculated by summing over the supersaturated layers.
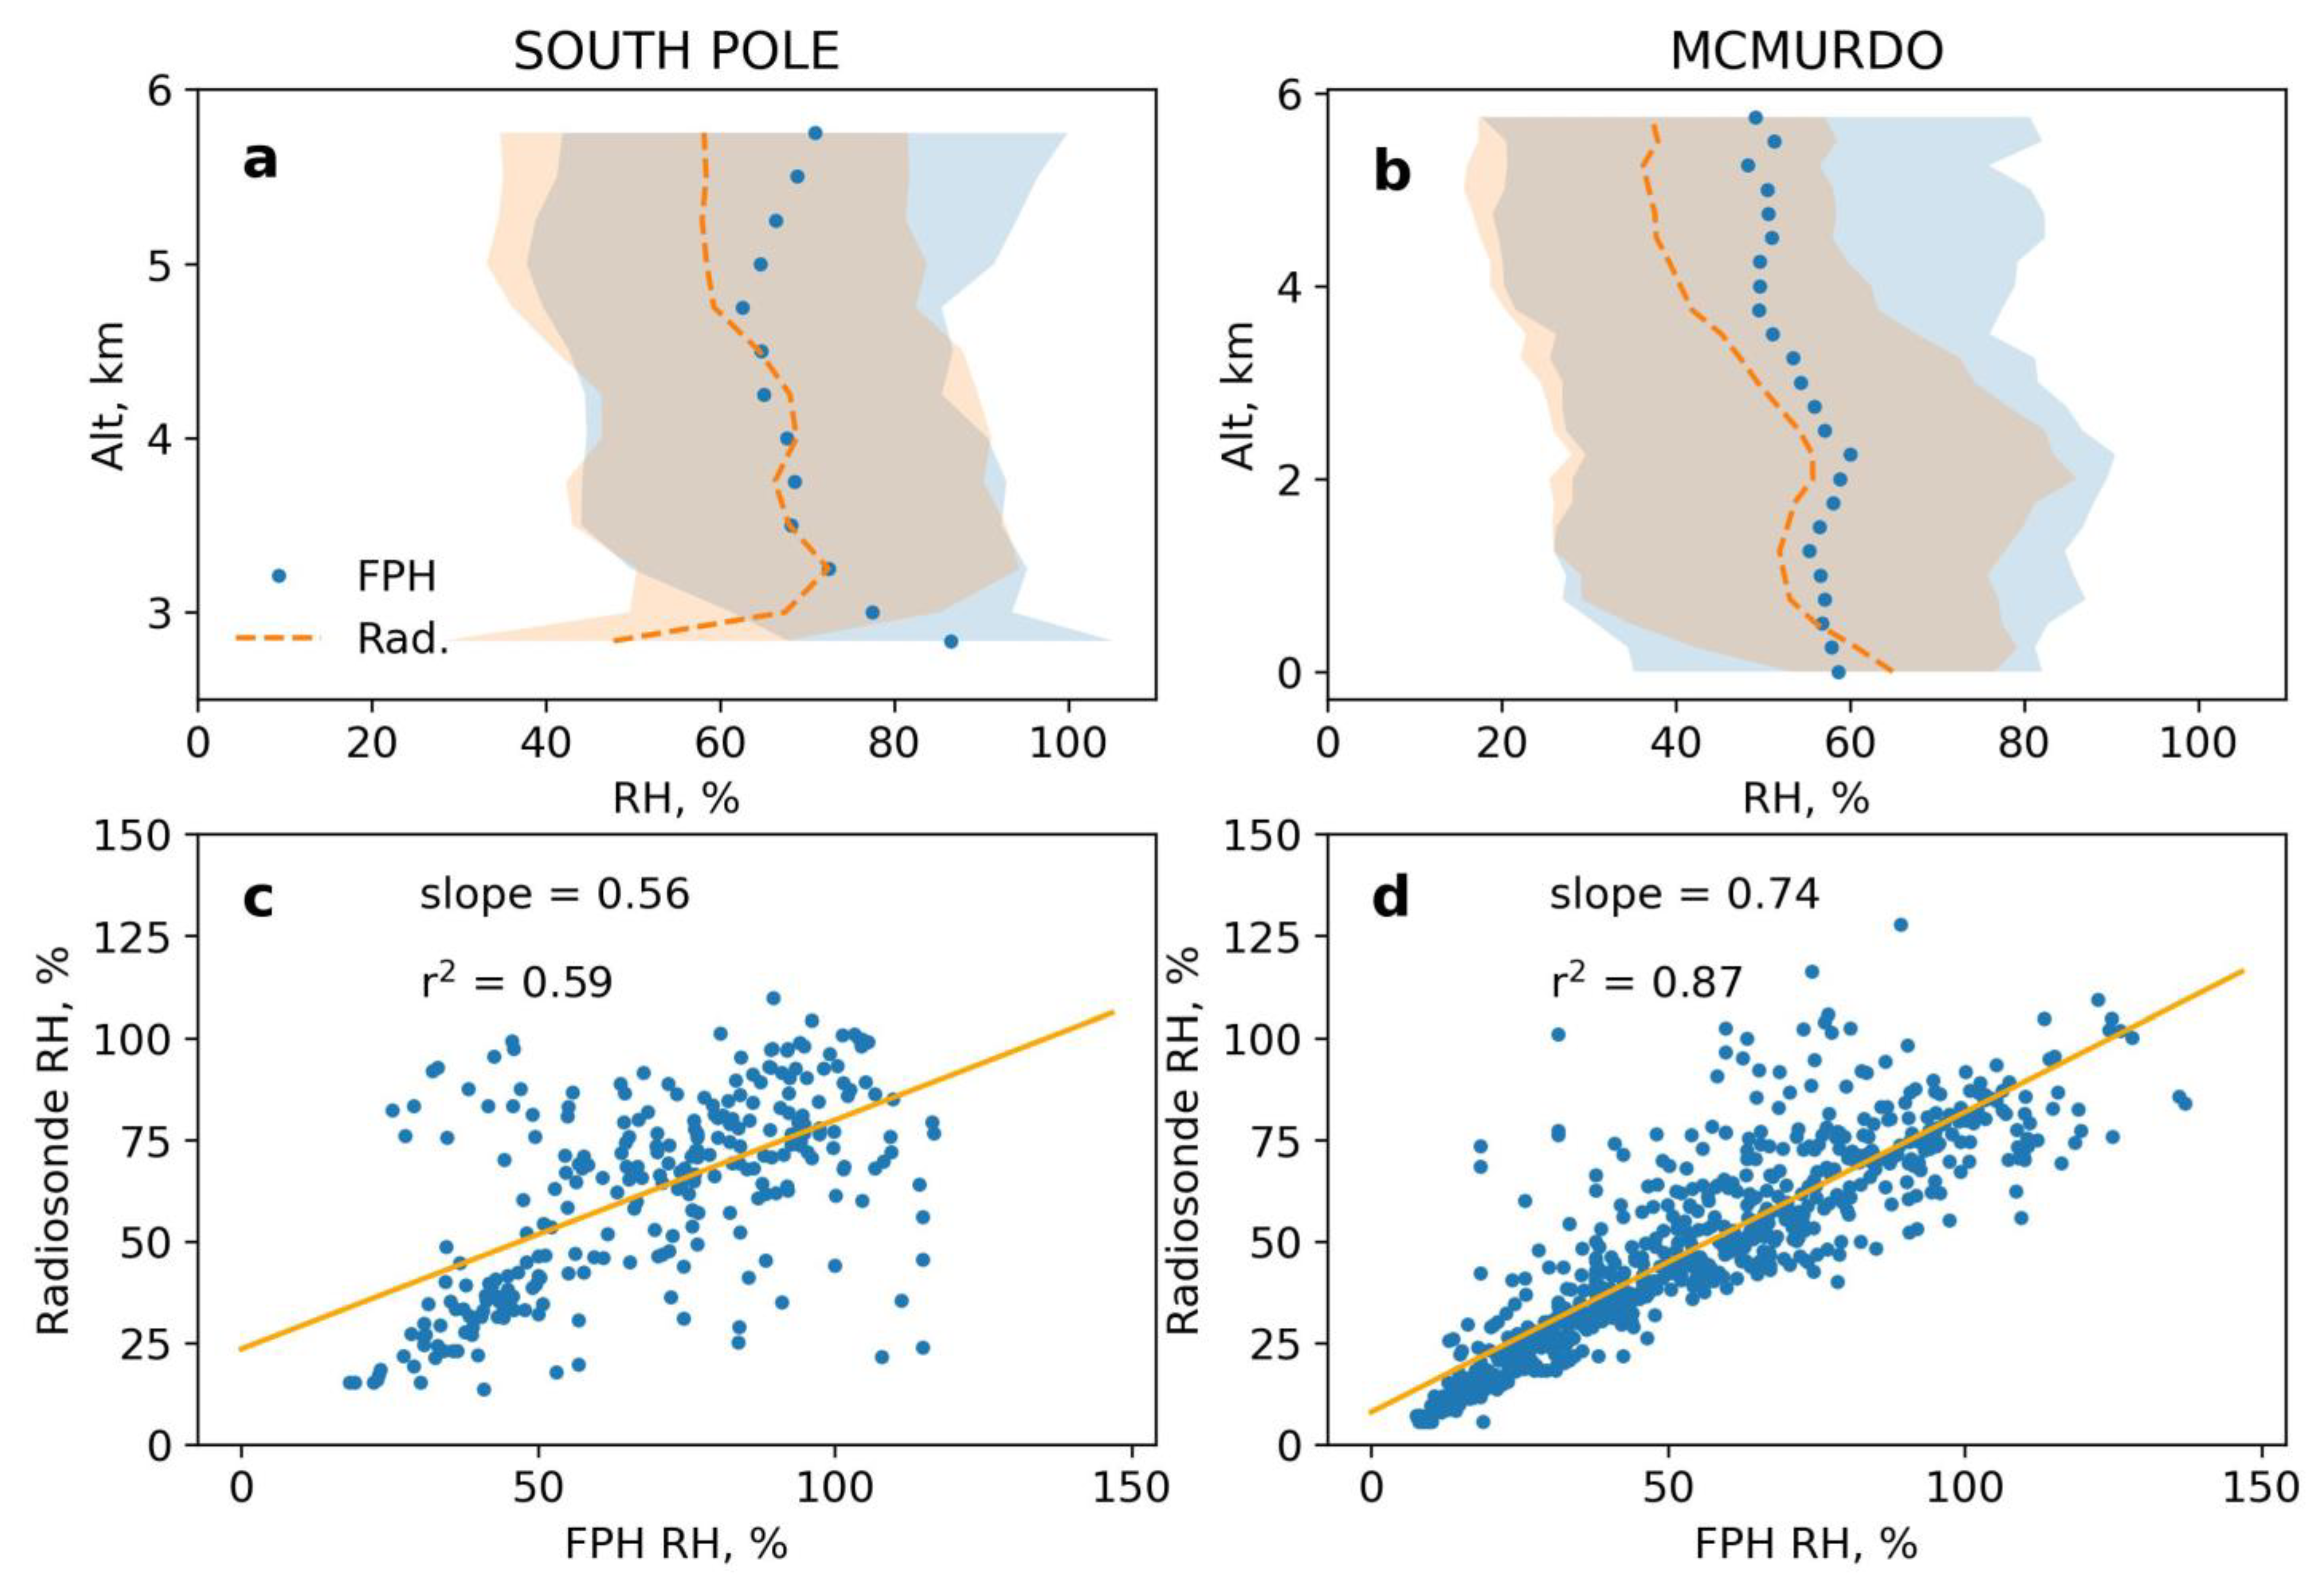
Operational radiosonde measurements of specific humidity are known to have a temperature-dependent dry bias [16,17,18]. This bias is also a function of radiosonde type. We compare paired radiosonde and frost point hygrometer (FPH) specific humidities taken by the NOAA Global Monitoring Laboratory to estimate the radiosonde bias at South Pole and McMurdo during the late 1980s and early 1990s, when the Vaisala RS-80 sonde was used. Calculations of RHi in each atmospheric layer show a dry bias in these radiosondes (Figure 2). The slope from regressing the RHi from the radiosondes and FPH gives an indication of the bias. We find a slope of 0.56 at the South Pole and 0.74 at McMurdo (Figure 2). In these profiles at McMurdo, FPHs report RHi values that are 35% higher than radiosonde values. This dry bias is comparable to that found by Miloshevich et al. [17], who calculated a 1.3 scale factor between FPH and the Vaisala RS-80 sonde values at temperatures of −35 °C, which is consistent with Antarctic temperatures. This RHi bias at McMurdo results in a 4x low bias in excess water vapor for the cases using a Vaisala RS-80 when assuming the wetter FPH profiles are accurate. More recent sondes used in the calculation have lower biases, so our underestimate in excess water is likely less than a factor of four.

3. Results

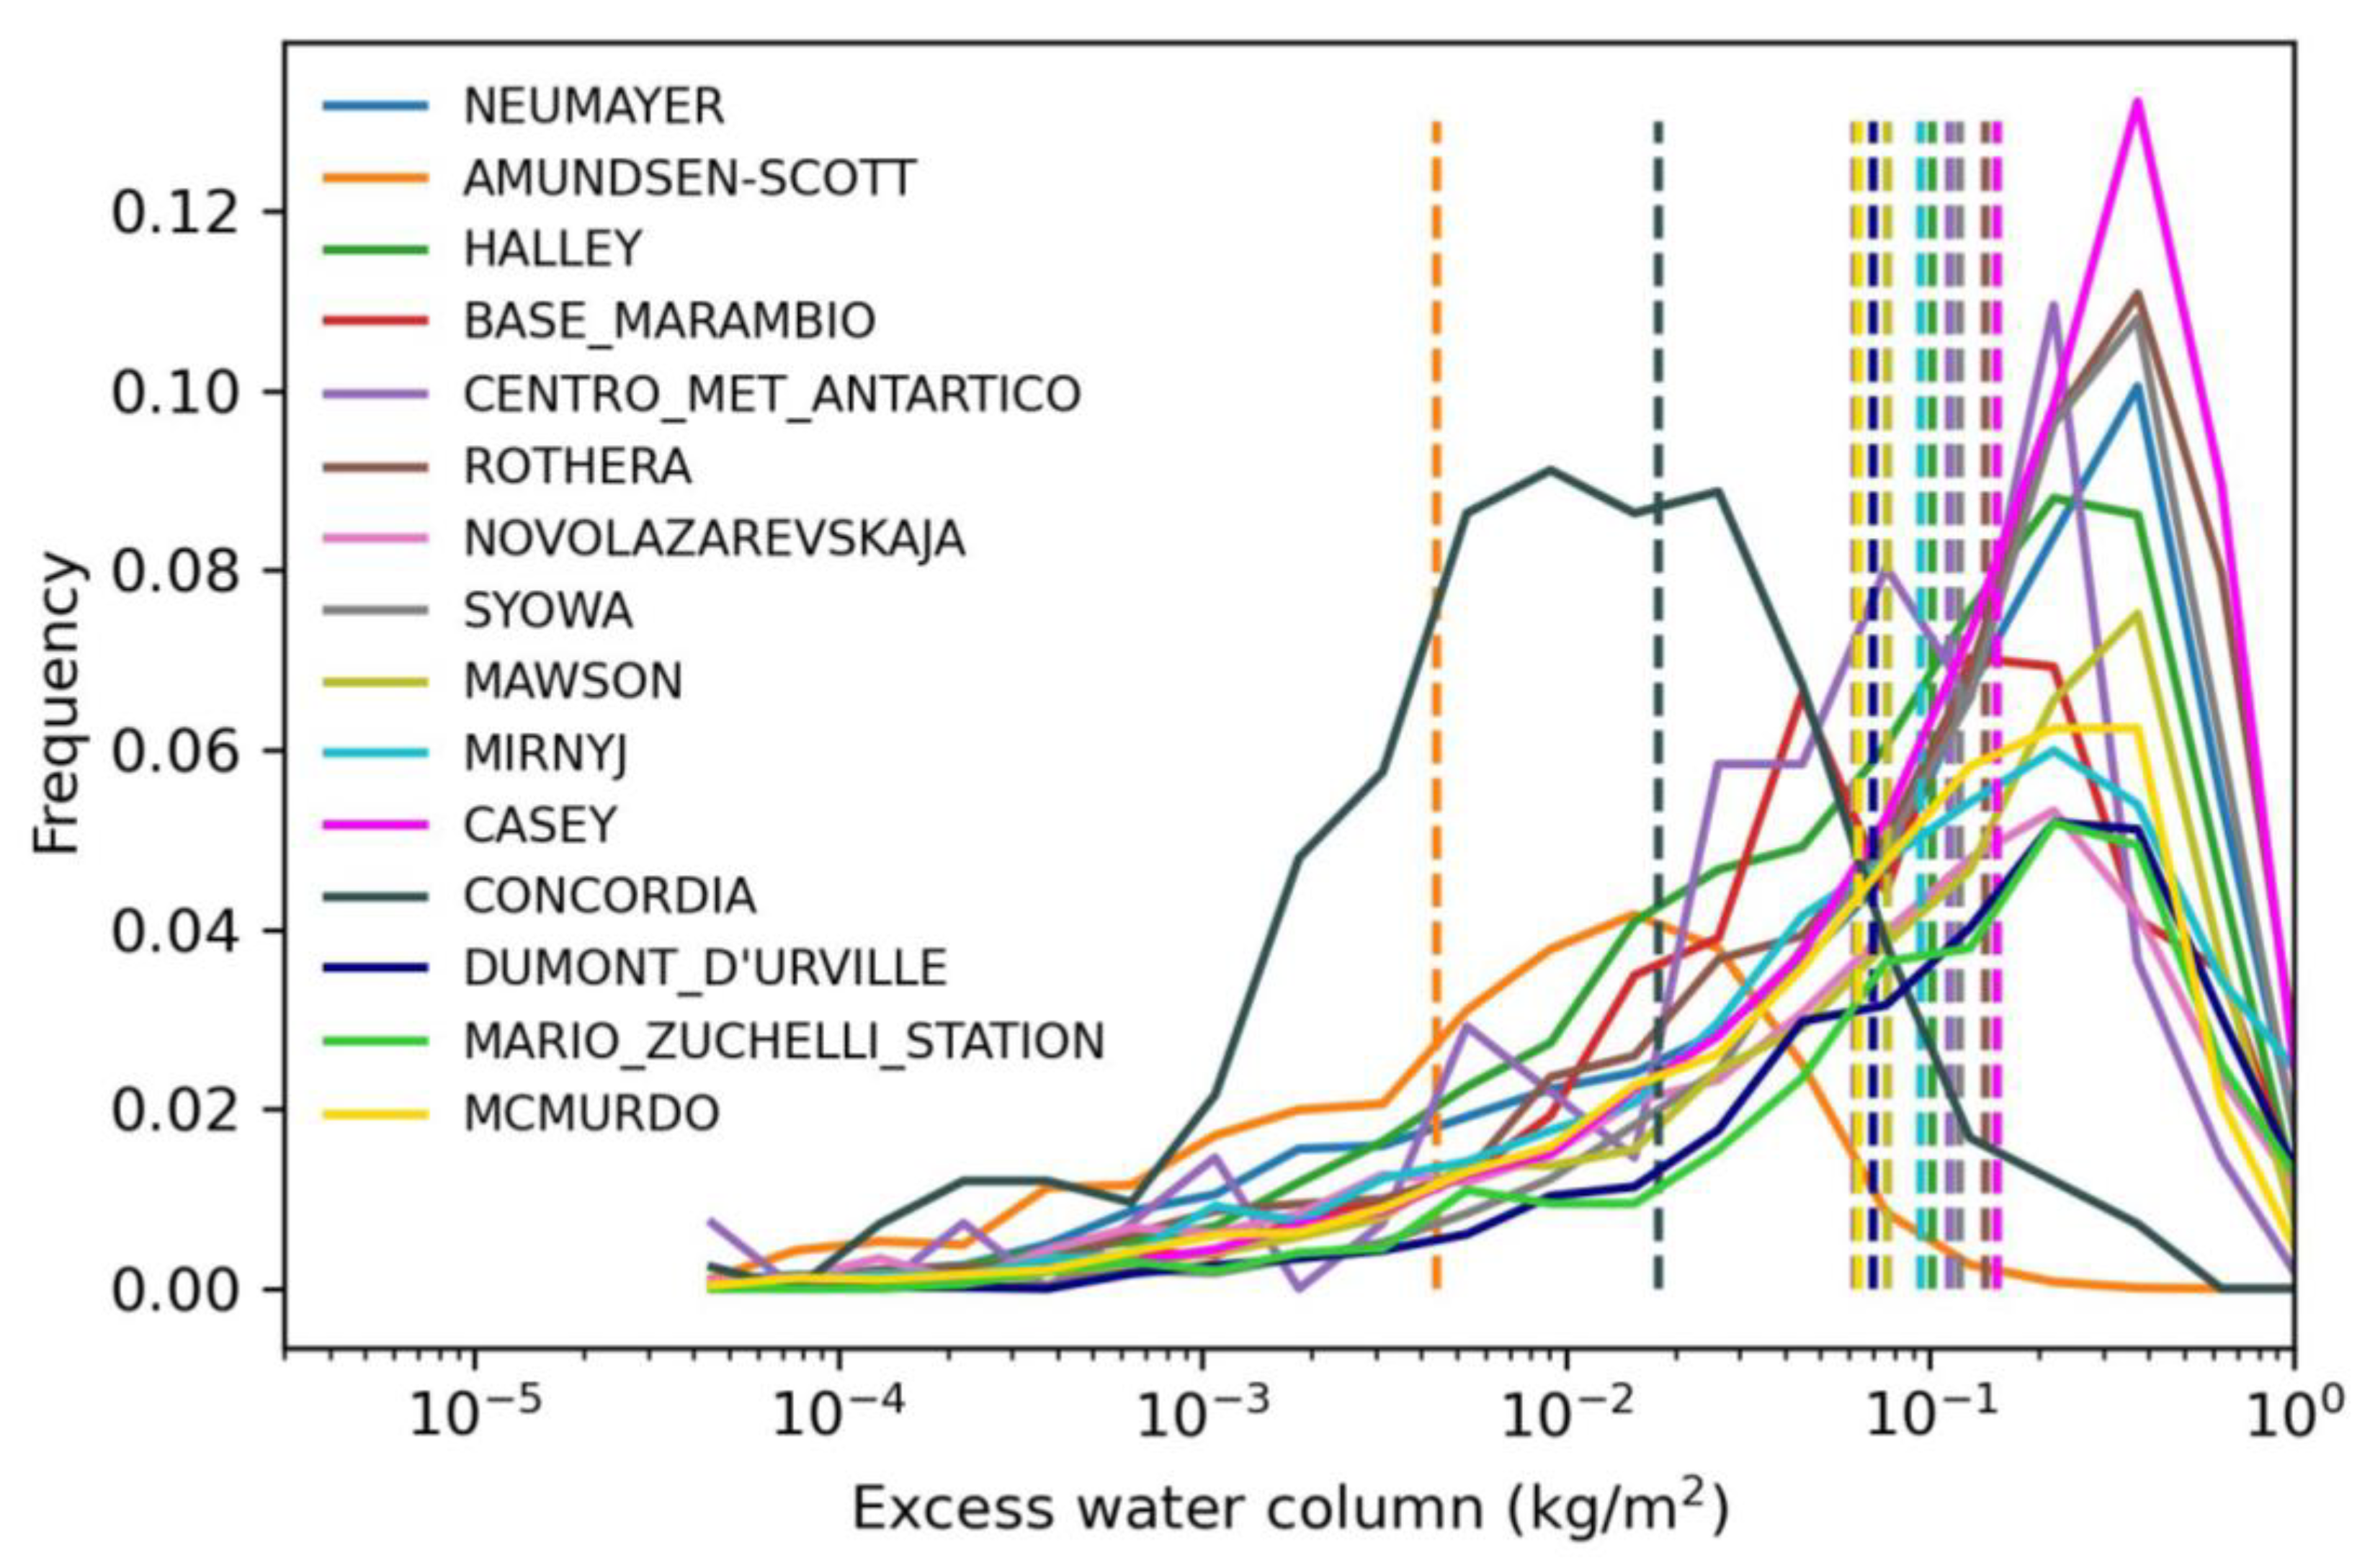
Radiosonde profiles indicate the atmosphere air over the coastal regions in Antarctica is supersaturated 47% (30–60%) of days with little seasonality between 2000 and 2022. The interior, represented by Dome C and the South Pole stations, is supersaturated 28% and 66% of the time, respectively. The average amount of excess vapor in daily radiosonde measurements is 0.005 kg/m2 at the South Pole, 0.02 kg/m2 over Dome C (Concordia), and a mean of 0.095 kg/m2 over the Antarctic costal stations (Figure 3). However, considering the dry biases in operational radiosonde measurements, this value is likely an underestimate. Correcting the RH measurements based on the FPH/radiosonde biases discussed previously, there may actually be up to four times more excess vapor.
Depositing the coastal mean excess water vapor (0.095 kg/m2/day) every day would add 3.5 cm (35 kg/m2) of water-equivalent precipitation annually, and accounting for the dry bias in radiosonde measurements, this could be as high as 14 cm (140 kg/m2) annually. To put this in perspective, McMurdo station currently receives 18.4 cm of water-equivalent precipitation annually [19]. Precipitating out the excess vapor would increase the precipitation by 19–76% depending on the dry bias. These estimates assume daily water vapor removal with the surrounding ocean replenishing the removed excess water. There is a tradeoff between the frequency of excess water removal and the distance inland that can effectively be seeded based on the flux of water vapor from the ocean. It is outside the scope of this work to calculate this flux and optimize a seeding plan. However, weekly removal of excess water vapor would presumably result in 7× less water removed compared with daily removal.
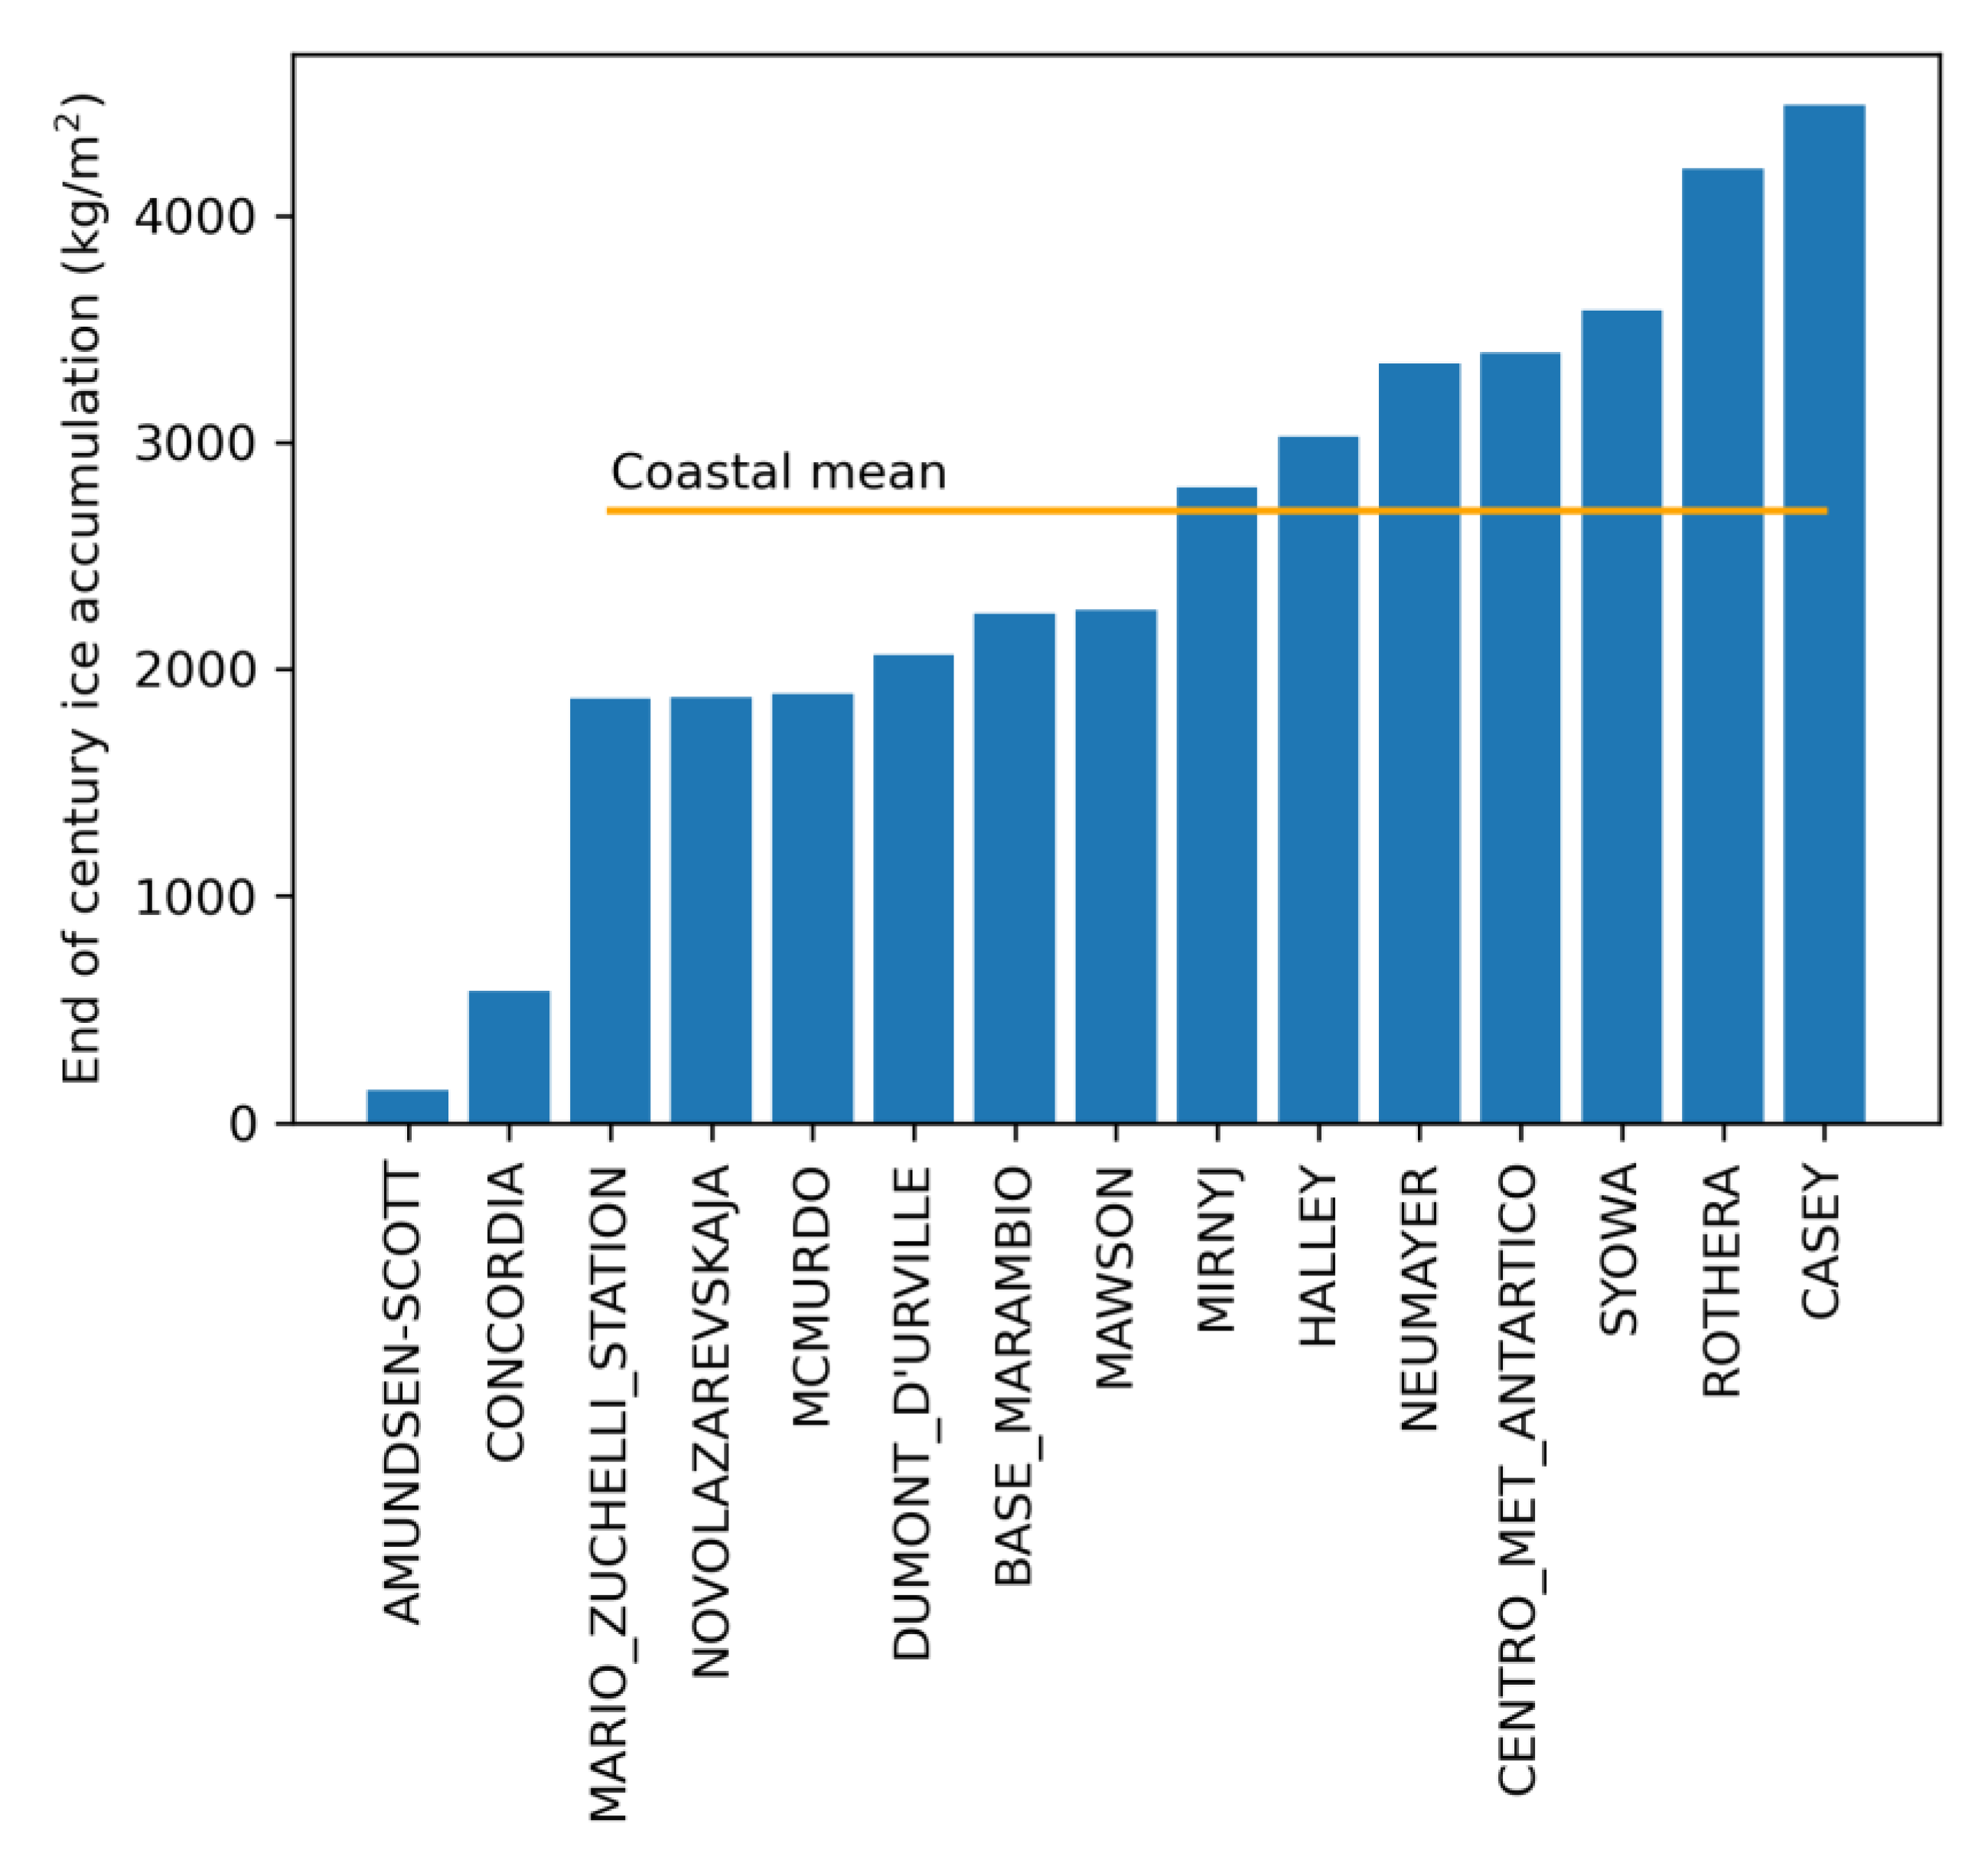
Assuming daily removal, the deposit of excess water vapor at coastal stations based on current supersaturation could reach an average total of 2700–10,800 kg/m2 by the end of the century, which corresponds to 2.9–11.6 m of ice accumulation, depending on the dry bias (Figure 4). In contrast, inland sites, which have substantially less excess water vapor, could accumulate 14–56 cm at the South Pole and 55–220 cm at Dome C by the end of the century. Assuming the coastal area represented by the radiosonde measurements extends inland up to ~290 km, then the coastal area makes up 25% of the Antarctic continent. For comparison, lake effects of snow totals can be seen up to about 200 km from the shore of the Great Lakes in the USA [20]. Furthermore, atmospheric rivers have been observed, extending ~1000 km inland in west Antarctica [9]. Removing daily excess water vapor over the coastal region would offset 2.6–10.4 cm of global sea level rise by the end of the century.
Along with the excess water vapor, there is an additional source of potentially removable water in the form of cloud liquid water over Antarctica. Listowski et al. [13] used radar and lidar to estimate the seasonality and frequency of supercooled liquid-water-containing clouds (SLCs) over Antarctica. They found the highest SLCs over the coasts and west Antarctica, with average values around 20% of daily observations. Assuming an efficient removal of daily mixed or liquid clouds over 20% of the coastal regions with an LWP of 100 g/m2, as recently observed over McMurdo [12], then 7.3 kg/m2/yr of cloud water could be removed over the coastal regions, or 570 kg/m2 by the end of the century. This is a small addition to the 2700–10,800 kg/m2 available in excess water vapor identified from profiles, but together, this increases the available water to 3300–11,400 kg /m2 by the end of the century. The combined total represents offsetting 3.2–11 cm of SLR, or 4–15% of the predicted 75 cm of SLR this century [1,2]. Table 1 summarizes the end-of-century excess water that could be stored on the continent through daily or weekly removal with and without correcting for the dry bias in the radiosonde measurements.

4. Discussion

This study explores the possibility of using cloud seeding over Antarctica for offsetting part of the projected SLR. We have shown the potential of the proposed method (up to 15% of SLR). Obviously, this method alone will not mitigate the entire SLR problem. However, it still has the potential of reducing projected one-in-100-year coastal flooding areas by over 105 km2 [21]. Furthermore, the method could have a beneficial side effect of surface cooling due to cloud removal. Cooling the surface could help slow down glacier melting. As this is an exploratory work, many issues still need to be appropriately addressed. Here are some of future research topics:
Water vapor uncertainty. One uncertainty of the proposed method is the projection of atmospheric water available for removal. For simplicity, we assumed that that availability would remain unchanged; however, natural variability and climate change can both alter our estimates. Studies have hypothesized that relative humidity will remain constant with global warming [22], indicating that the water cycle will intensify with climate change. This is also in agreement with the United Nations’ Intergovernmental Panel on Climate Change Sixth Assessment Report [23], which states that total atmospheric water vapor is increasing 1 to 2% per decade. However, modeling studies are needed to assess whether this is indeed going to occur over Antarctica.
Our estimates assume that the cloud seeding will be completely efficient. It may be that cloud seeding may only remove a small fraction of the excess water vapor. Actual tests of cloud seeding in Antarctica are needed to assess efficacy.
Cloud seeding and associated energy need. Cloud seeding has a long history [24,25], but still is a controversial topic. Recent studies [26,27] have shown cloud seeding led to snow precipitation that would otherwise not have fallen. However, the effectiveness and energy efficiency (energy spent per unit snow fall) of cloud seeding still need further assessments.
Radiative effects. Efforts to remove clouds through cloud seeding may reduce cloud prevalence and affect the net cloud radiative effects (CRE). Lawson and Gettelman [10] found a +7.4 W/m2 change in CRE over the continent in the Community Earth System Model (CESM), which included mixed-phase clouds at very low temperatures compared to ice-only clouds. Therefore, a reduction in liquid clouds reduces surface temperature. Changing the radiative balance over Antarctica could potentially have an effect on circulation as well. The overall impact would require extensive modeling work.

5. Conclusions

Removing supersaturated atmospheric water vapor over the Antarctic coastal region could offset up to 10.4 cm and removing available liquid cloud water could offset another 0.6 cm of SLR by end of century. This represents 15% of projected 75 cm of SLR by 2100. These estimates may increase if climate change greatly increases water vapor over the continent. An increase of 2 °C in the Antarctic temperature profile with the same relative humidity would increase the excess water vapor by about 20% [14,15]. Thus, we expect that in the future warmer world, more excess vapor would be available for deposition.
An important consideration for climate change mitigation techniques is assessing the unintended side effects. We do not anticipate any major environmental pollution from converting atmospheric water vapor to deposited ice over Antarctica. Cloud seeding could be carried out with dry ice, which would not leave any contamination on the surface. Termination shock of the sort that could be caused by halting solar climate intervention is not expected. Changing precipitation in a region with virtually no population and no agriculture should also not have negative impacts. And, although other proposals have suggested storing ice in Antarctica from sea water or by transporting fresh water, these have large energy requirements [7]. This proposal would require the shipping of cloud seeding material, which is typically silver iodide or dry ice (CO2), and energy to deploy the seeding material.
There are many assumptions that go into these calculations of available atmospheric water. We assume that the removal mechanism deposits all of the excess vapor on the surface where it accumulates. This undoubtedly overestimates the fraction of excess vapor that could practically be removed from the atmosphere. Furthermore, we assume that removing excess vapor in the atmosphere does not reduce supersaturation at other coastal stations. It is possible that downstream locations would have less vapor available to precipitate out. However, we are focusing on coastal regions which should be less affected by this than the interior.
We recognize that offsetting SLR by 11 cm represents an upper limit for growing glaciers via atmospheric removal of water vapor. However, given the severity of the impacts of sea level rise, the maximum potential for any strategy to mitigate the effects of climate change should be calculated before that strategy can be ruled out. Furthermore, this idea could be used in concert with other climate change mitigation strategies or possibly at locations in the Arctic.

Author Contributions

Conceptualization, R.-S.G.; methodology, K.H.R.; software, E.J.L.L.; validation, K.H.R.; formal analysis, E.J.L.L.; investigation, E.J.L.L., K.H.R. and R.-S.G.; resources, K.H.R.; data curation, K.H.R.; writing—original draft preparation, E.J.L.L.; writing—review and editing, E.J.L.L., K.H.R. and R.-S.G.; visualization, E.J.L.L. All authors have read and agreed to the published version of the manuscript.

Funding

This research received no external funding.

Institutional Review Board Statement

Not applicable.

Informed Consent Statement

Not applicable.

Data Availability Statement

Frost point hygrometer and radiosonde data used to determine the radiosonde bias are available from NOAA GML (https://gml.noaa.gov/aftp/data/ozwv/WaterVapor/Other%20Sites/, accessed on 13 October 2023.). The operational radiosonde measurements analyzed in this study are also available from NOAA (https://ruc.noaa.gov/raobs/, accessed on 13 October 2023.). Python code for analyzing the radiosonde and FPH data are available at https://github.com/larsonej/Antarctic_watervapor (accessed on 13 October 2023).

Acknowledgments

We thank Graham Feingold, Greg McFarquhar, Yaosheng Chen, and David Fahey for insightful discussions.

Conflicts of Interest

The authors declare no conflict of interest.

References

  1. Hermans, T.H.J.; Gregory, J.M.; Palmer, M.D.; Ringer, M.A.; Katsman, C.A.; Slangen, A.B.A. Projecting Global Mean Sea-Level Change Using CMIP6 Models. Geophys. Res. Lett. 2021, 48, e2020GL092064. [Google Scholar] [CrossRef]
  2. Horton, B.P.; Khan, N.S.; Cahill, N.; Lee, J.S.H.; Shaw, T.A.; Garner, A.J.; Kemp, A.C.; Engelhart, S.E.; Rahmstorf, S. Estimating global mean sea-level rise and its uncertainties by 2100 and 2300 from an expert survey. NPJ Clim. Atmos. Sci. 2020, 3, 18. [Google Scholar] [CrossRef]
  3. NOAA. 2022 Sea Level Rise Technical Report. Section 2. 2022. Available online: https://aambpublicoceanservice.blob.core.windows.net/oceanserviceprod/hazards/sealevelrise/2.0-Future-Mean-Sea-Level.pdf (accessed on 13 October 2023).
  4. Lockley, A.; Wolovick, M.; Keefer, B.; Gladstone, R.; Zhao, L.-Y.; Moore, J.C. Glacier geoengineering to address sea-level rise: A geotechnical approach. Adv. Clim. Change Res. 2020, 11, 401–414. [Google Scholar] [CrossRef]
  5. CIA. Antarctica. 2023. Available online: https://www.cia.gov/the-world-factbook/countries/antarctica/ (accessed on 13 October 2023).
  6. NOAA. 2023. Available online: https://oceanexplorer.noaa.gov/facts/explored.html#:~:text=Consider%20the%20size%20of%20the,3%2C682%20meters%20(12%2C080%20feet) (accessed on 13 October 2023).
  7. Frieler, K.; Mengel, M.; Levermann, A. Delaying future sea-level rise by storing water in Antarctica. Earth Syst. Dyn. 2016, 7, 203–210. [Google Scholar] [CrossRef]
  8. Boyer, S.; Lefort, M.C. Sequestering seawater on land: A water-based solution to global issues [version 2; peer review: 2 approved with reservations, 1 not approved]. F1000Research 2017, 5, 889. [Google Scholar] [CrossRef]
  9. Davison, B.J.; Hogg, A.E.; Rigby, R.; Veldhuijsen, S.; van Wessem, J.M.; van den Broeke, M.R.; Holland, P.R.; Selley, H.L.; Dutrieux, P. Sea level rise from West Antarctic mass loss significantly modified by large snowfall anomalies. Nat. Commun. 2023, 14, 1479. [Google Scholar] [CrossRef] [PubMed]
  10. Lawson, R.P.; Gettelman, A. Impact of Antarctic mixed-phase clouds on climate. Proc. Natl. Acad. Sci. USA 2014, 111, 18156–18161. [Google Scholar] [CrossRef]
  11. Ricaud, P.; Del Guasta, M.; Bazile, E.; Azouz, N.; Lupi, A.; Durand, P.; Attié, J.-L.; Veron, D.; Guidard, V.; Grigioni, P. Supercooled liquid water cloud observed, analysed, and modelled at the top of the planetary boundary layer above Dome C, Antarctica. Atmos. Chem. Phys. 2020, 20, 4167–4191. [Google Scholar] [CrossRef]
  12. Silber, I.; Fridlind, A.M.; Verlinde, J.; Ackerman, A.S.; Chen, Y.; Bromwich, D.H.; Wang, S.; Cadeddu, M.; Eloranta, E.W. Persistent Supercooled Drizzle at Temperatures Below −25 °C Observed at McMurdo Station, Antarctica. J. Geophys. Res. Atmos. 2019, 124, 10878–10895. [Google Scholar] [CrossRef]
  13. Listowski, C.; Delanoë, J.; Kirchgaessner, A.; Lachlan-Cope, T.; King, J. Antarctic clouds, supercooled liquid water and mixed phase, investigated with DARDAR: Geographical and seasonal variations. Atmos. Chem. Phys. 2019, 19, 6771–6808. [Google Scholar] [CrossRef]
  14. Goff, J.A.; Gratch, S. Low-pressure properties of water from −160 to 212 F. Trans. Am. Soc. Heat. Vent. Eng. 1946, 95–122. [Google Scholar]
  15. Smithsonian Meteorological Tables, 5th ed.; Smithsonian Institute Press: Washington, DC, USA, 1984; p. 350.
  16. Dirksen, R.J.; Sommer, M.; Immler, F.J.; Hurst, D.F.; Kivi, R.; Vömel, H. Reference quality upper-air measurements: GRUAN data processing for the Vaisala RS92 radiosonde. Atmos. Meas. Tech. 2014, 7, 4463–4490. [Google Scholar] [CrossRef]
  17. Miloshevich, L.M.; Vömel, H.; Paukkunen, A.; Heymsfield, A.J.; Oltmans, S.J. Characterization and Correction of Relative Humidity Measurements from Vaisala RS80-A Radiosondes at Cold Temperatures. J. Atmos. Ocean. Technol. 2001, 18, 135–156. [Google Scholar] [CrossRef]
  18. Wang, J.; Cole, H.L.; Carlson, D.J.; Miller, E.R.; Beierle, K.; Paukkunen, A.; Laine, T.K. Corrections of Humidity Measurement Errors from the Vaisala RS80 Radiosonde—Application to TOGA COARE Data. J. Atmos. Ocean. Technol. 2002, 19, 981–1002. [Google Scholar] [CrossRef]
  19. Monaghan, A.J.; Bromwich, D.H.; Powers, J.G.; Manning, K.W. The Climate of the McMurdo, Antarctica, Region as Represented by One Year of Forecasts from the Antarctic Mesoscale Prediction System. J. Clim. 2005, 18, 1174–1189. [Google Scholar] [CrossRef]
  20. Wright, D.M.; Posselt, D.J.; Steiner, A.L. Sensitivity of lake-effect snowfall to lake ice cover and temperature in the Great Lakes region. Mon. Weather. Rev. 2013, 141, 670–689. [Google Scholar] [CrossRef]
  21. Brown, S.; Nicholls, R.J.; Goodwin, P.; Haigh, I.D.; Lincke, D.; Vafeidis, A.T.; Hinkel, J. Quantifying Land and People Exposed to Sea-Level Rise with no Mitigation and 1.5 °C and 2.0 °C Rise in Global Temperatures to Year 2300. Earth's Future 2018, 6, 583–600. [Google Scholar] [CrossRef]
  22. Douville, H.; Qasmi, S.; Ribes, A.; Bock, O. Global warming at near-constant tropospheric relative humidity is supported by observations. Commun. Earth Environ. 2022, 3, 237. [Google Scholar] [CrossRef]
  23. IPCC. 2021 Climate Change 2021: The Physical Science Basis; Masson-Delmotte, V., Zhai, P., Pirani, A., Connors, S.L., Péan, C., Berger, S., Caud, N., Chen, Y., Goldfarb, L., Gomis, M.I., et al., Eds.; Contribution of Working Group I to the Sixth Assessment Report of the Intergovernmental Panel on Climate Change; Cambridge University Press: Cambridge, UK; New York, NY, USA, 2021; in press. [Google Scholar] [CrossRef]
  24. Schaefer, V.J. The production of ice crystals in a cloud of supercooled water droplets. Science 1946, 104, 457–459. [Google Scholar] [CrossRef]
  25. Vonnegut, B. The nucleation of ice formation by silver iodide. J. Appl. Phys. 1947, 18, 593–595. [Google Scholar] [CrossRef]
  26. French, J.R.; Friedrich, K.; Tessendorf, S.A.; Rauber, R.M.; Geerts, B.; Rasmussen, R.M.; Xue, L.; Kunkel, M.L.; Blestrud, D.R. Precipitation formation from orographic cloud seeding. Proc. Natl. Acad. Sci. USA 2018, 115, 1168–1173. [Google Scholar] [CrossRef] [PubMed]
  27. Tessendorf, S.A.; French, J.R.; Friedrich, K.; Geerts, B.; Rauber, R.M.; Rasmussen, R.M.; Xue, L.; Ikeda, K.; Blestrud, D.R.; Kunkel, M.L.; et al. A transformational approach to winter orographic weather modification research: The SNOWIE project. Bull. Am. Meteorol. Soc. 2019, 100, 71–92. [Google Scholar] [CrossRef]
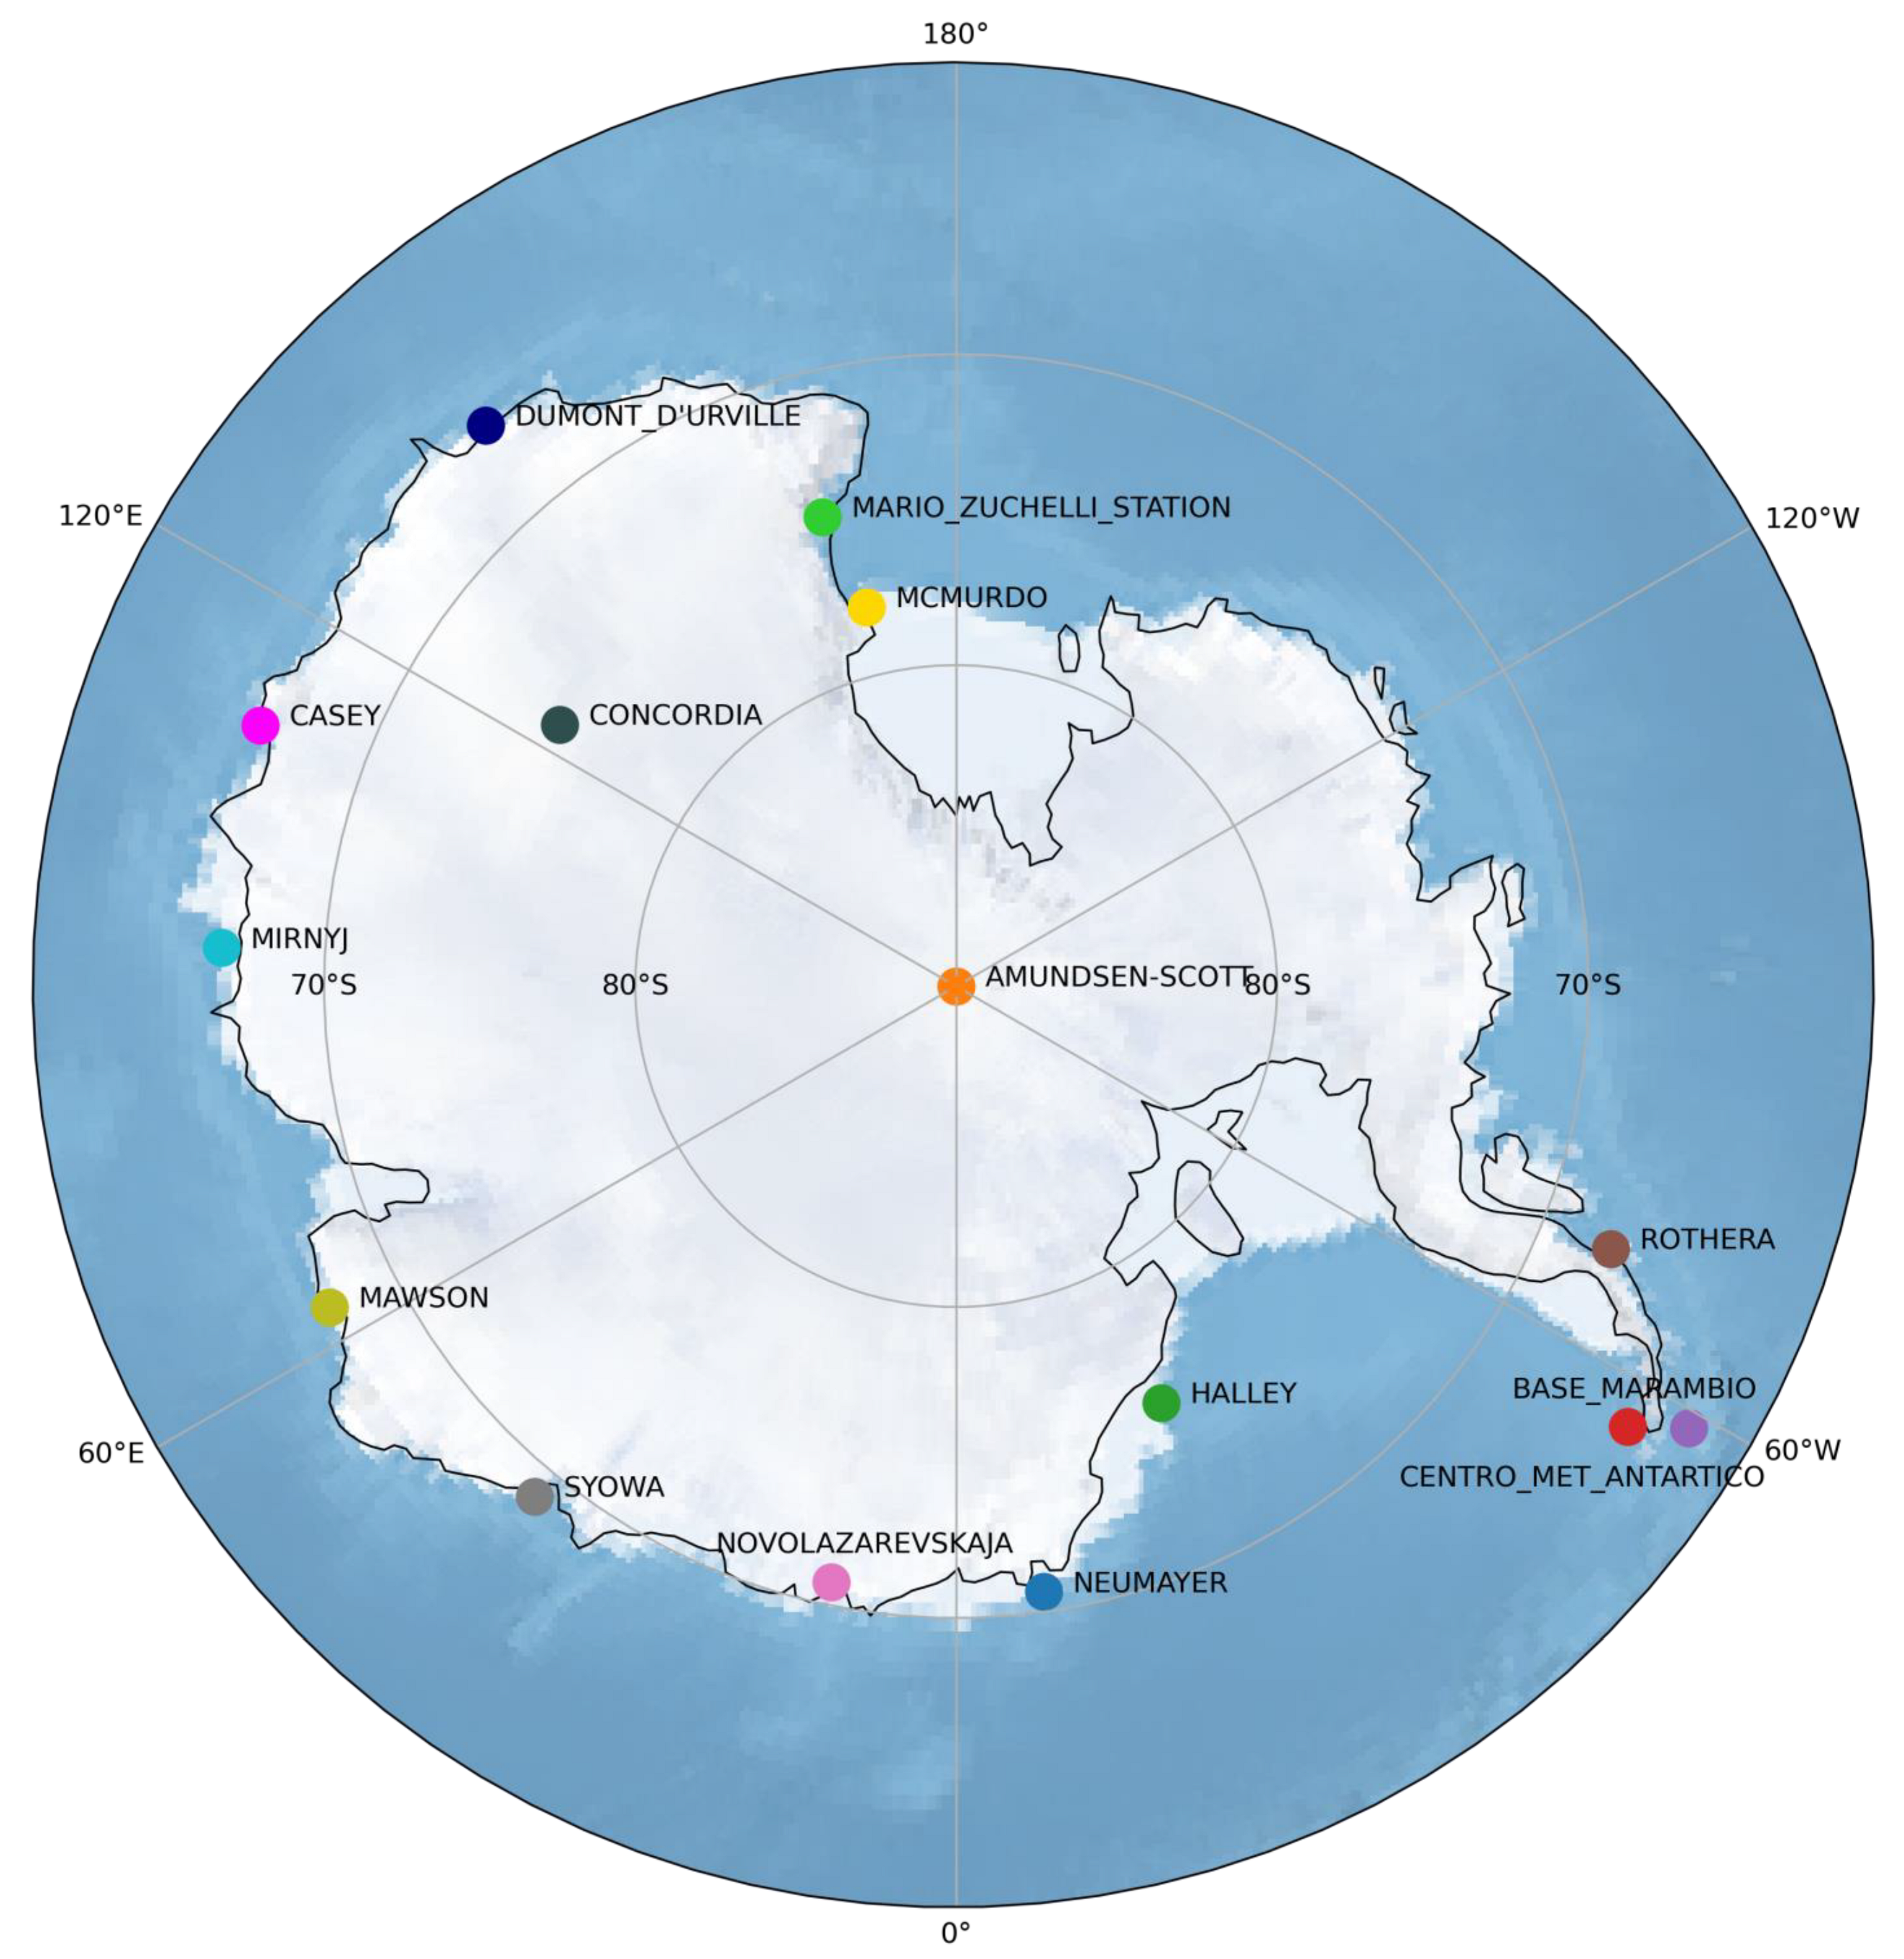
Figure 1. Map of Antarctica with the stations used in this study.
Atmosphere 14 01564 g001
Figure 2. Panels (a,b): the data points indicate the mean and the shaded regions indicate the standard deviation of RHi across all profiles as a function of altitude. Panels (c,d): a comparison of RHi between radiosondes and FPHs at the South Pole (c) and McMurdo (d) stations. Yellow lines are linear fits to the data.
Atmosphere 14 01564 g002
Figure 3. Frequency and magnitudes of excess column water vapor for each Antarctic station. The dashed lines indicate the mean value. These estimates do not take into account the dry bias in radiosonde measurements.
Atmosphere 14 01564 g003
Figure 4. Net ice accumulation (kg/m2) by the end of the century (assuming supersaturations remain unchanged from the present) assuming that all excess water removed from the n at each station accumulates as ice on the surface. This does not take into account the dry bias in radiosonde measurements.
Atmosphere 14 01564 g004
Table 1. A summary of the end-of-century (EoC) excess water removal and sea level rise offset, assuming coastal levels of excess water are removed over 25% of the land area given different removal frequencies and radiosonde dry bias.
Frequency of Vapor RemovalEoC Excess Water (kg/m2)EoC Excess Water with Dry Bias Correction (kg/m2)EoC Cloud Liquid Water Removed (kg/m2)EoC SLR Offset (cm)EoC SLR Offset with Dry Bias Correction (cm)EoC Cloud SLR Offset (cm)
Daily270010,8005702.610.40.6
Weekly39015405700.371.50.6
Disclaimer/Publisher’s Note: The statements, opinions and data contained in all publications are solely those of the individual author(s) and contributor(s) and not of MDPI and/or the editor(s). MDPI and/or the editor(s) disclaim responsibility for any injury to people or property resulting from any ideas, methods, instructions or products referred to in the content.